improved relay coordination in port harcourt distribution...
TRANSCRIPT

American Journal of Engineering Research (AJER) 2018
American Journal of Engineering Research (AJER)
e-ISSN: 2320-0847 p-ISSN : 2320-0936
Volume-7, Issue-7, pp-43-56
www.ajer.org Research Paper Open Access
w w w . a j e r . o r g
Page 43
Improved Relay Coordination In Port Harcourt Distribution
Network Case Study Of RSU 2 X 15MVA, 33/11kv Injection
Substation
Idoniboyeobu, D. C.1, Braide, S. L.
2and Igbogidi, O. N.
3
1,2&3Department of Electrical Engineering, Rivers State University, Port Harcourt, Nigeria
Corresponding Author: Igbogidi,, O. N.
ABSTRACT: Relay coordination is a means by which a relay closest the point of fault operates, but in the event
of failure the backup relay operates in sequence to provide backup protection. This research was a detailed
improved relay coordination in Port Harcourt Distribution Network using RSU 2 X 15MVA, 33/11kv Injection
Substation as a case study. This work is of high practical importance to the society and country in general. The
research methodology included the collection of relevant data from Port Harcourt Distribution Company and
Transmission Company of Nigeria and provision of appropriate parameters using appropriate equations
required for the short circuit analysis. The Electrical Network was modelled in Electrical Transient Analyzer
Program 12.6 Software. The short circuit was embedded in ETAP 12.6 software to determine the sequence of
operation of relays for the existing network (Existing Case). The sequence of operation event report showed that
tripping sequence violation occurred in 2 (two) relays with each tripping the associated CB at 12.3ms for fault
on Ojoto 11kv feeder or RSU 11kv feeder and 12.1ms for fault on Federal 11kv feeder or Wokoma 11kv feeder
while the successive relays tripped theirs first at 10.2ms and 10.1ms respectively. The sequence was in the order
of 1, 3, 2 and 4. Tripping sequence violation was eliminated in the New Case in the order of 1, 2, 3 and 4. The
New Case showed improved relay coordination.
KEYWORDS: Relay coordination, RSU Injection Substation, Short circuit analysis, Tripping sequence
violation
----------------------------------------------------------------------------------------------------------------------------- ----------
Date of Submission: 22-06-2018 Date of acceptance: 07-07-2018
----------------------------------------------------------------------------------------------------------------------------- ----------
I. INTRODUCTION
It is obvious that proper relay coordination always stops the healthy part of the network from
unnecessary outages. Essentially, proper coordination of relays generally, coupled with backup protection will
always protect the power system. Certain time interval must be maintained to allow for proper sequence of
operation and very importantly, selectivity must be maintained bearing in mind the time interval. From the
above, selectivity problem of overcurrent relays can be tackled by time grading. But this results in delayed relay
operational time for faults which are more severe and close to the source. Backup protection is provided to each
unit if primary relay fails to operate. To coordinate this protection, the backup relay must have enough time
delay for the primary relay (and its breaker) to clear the fault [1].
Relay coordination has to do with discrimination, selectivity as well as backup relay arrangement. A
report from Magnus[2] states that electrical faults must be cleared early enough to avoid equipment damage and
injury to people. The need for automatic fault clearing arose due to the stringent nature of the power system.
There have been several reported and unreported cases of electrocution in our electricity distribution networks in
Nigeria in the recent past.It will be pertinent to mention that there exist numerous cases of electrocution in
Nigeria that are not reported or properly documented for public perusal.A report from PHED [3] states that a sad
incidence of electrical hazard that instantly claimed the lives of 13 persons trading under 11kv line at Slaughter
market in Trans Amadi 5 years ago resulting from high tension lines snap and yet the feeder failed to trip.In
another development, it will be pertinent to state categorically that reports have it that at different occasions
customers experience power outage due to the tripping of 33kv feeder connected to the substation that supplies
them owing to the fact that the faulty 11kv feeder relay failed to operate. This means that relays at Transmission
station and Injection substation trip on the same fault resulting to over-trip. It is a known fact a facility will
American Journal of Engineering Research (AJER) 2018
w w w . a j e r . o r g
Page 44
always get damaged in the event of fault especially if the primary relay fails. For clarity, backup protection only
operates on sympathy for primary protection to keep the fault away after the required time delay. The part that is
faulty is quarantined on the identification of short circuit to provide adequate security in the system. The
programmed relays (correct relay coordination) observe and check the entire system [4].
Considering the above developments, it may be perfect to state that electricity distribution network in
Nigeria has relay coordination problem. The reason being that proper relay coordination should be able to
continuously detect and isolate any faulted part of the system.
II. RELATED WORKS
In power system, overcurrent and earth fault relay coordination are very essential to correctly identify
fault and provide correct sequence of fault clearing. By setting principle, OCRs base on full load current of the
components in the power system [5]. The aim of selectivity and coordination is to choose the correct current and
setting of operating time of every relay in the power system and avoiding undesired power loss [6].
One of the steps in the calculations for a symmetrical fault is to choose a common base, determine and
refer to the common base, the per unit reactance of every generator, and transformer and line in the system [7].
A report from NEPA[6] states that relays having similar relay characteristics can be in series with each other,
provide minimum setting for relays far away from the source and retain or increase the current settings for
relays to the source. Appropriate time interval from the downstream relay at maximum fault conditions must be
selected [8]. Whenever the current increases higher than the required value it is then determined that a fault is
detected [2]. In practice according to a report from NEPA [6], correct sequence cannot be achieved by
discrimination by current grading only. Overcurrent and earth fault elements are essential for adequate power
system protection [9]. The higher the fault current the lesser the IDMT relay operating time [10].
According to Serge[11], overcurrent relays are to be set higher than expected load, earth fault relays are
to be set higher than expected unbalanced load and all coordinated with downstream relays. Earth fault current
depends on system earthing [12]. Conventionally, Normal Inverse or Standard type may be used for plain feeder
while extremely type can be linked to transformer or motor feeder [13].
Short circuit analysis can be conducted with ETAP. However, Hima, et al [14] presented a successful
use of Electrical Transient Analyzer Program to provide solution to over current relays in radial system.The
short circuit analysis has become very imperative that it provides the maximum current flow under fault
conditions. The output of which is very essential in determining a correct relay coordination [4].
III. MATERIALS AND METHOD
3.1 Research Materials
Data required for the purpose of analysis and investigation of the study area were collected from Port
Harcourt Electricity Distribution Company (PHEDC) and transmission Company of Nigeria (TCN). The method
and procedure adopted in this research are described accordingly.
3.2 Method of Analysis
The transformers considered on the network are at Port Harcourt Town 2 X 30MVA, 1 X 45MVA & 1
X 60MVA, 132/33kv transmission station and RSU 2 X 15MVA, 33/11kv Injection Substation. The relevant
data required between the two stations are also considered. The data collected generally were used to calculate
the distributed impedance, admittance and other parameters required for the short circuit analysis.
Also, short circuit analysis was run on RSU 2 X 15MVA, 33/11kv Injection Substation with the available data
using ETAP. Furthermore, data generated from relevant equations arising from theoretical analysis and relevant
available data were used on a new short circuit analysis using ETAP. Relevant available data included the
following: 33kv transmission line route length, transformers’ impedance, nominal frequency, nominal voltage,
maximum load on RSU 33kv feeder at transmission station and 11kv feeders at RSU Injection Substation,
conductor type and size, CTRs, type of system etc.Table 3.1 contains some of the data required for the network
simulation [15-16].
Table 3.1: Data Considerations made in Software
S/NO PARAMETER/SYSTEM ASSUMPTIONS
1 33KV Transmission line route length 9.5km
2 T2 30MVA impedance at Transmission Station 12.27%
3 T1A 15MVA impedance at RSU Injection Substation 11.1%
4 T2A 15MVA impedance at RSU Injection Substation 10.689%
5 Maximum load on 33kv line 20Mw
6 Maximum load on Ojoto 11kv feeder 230A
7 Maximum load on RSU 11kv feeder 170A
8 Maximum load on Federal 11kv feeder 320A
9 Maximum load on Wokoma 11kv feeder 420A

American Journal of Engineering Research (AJER) 2018
w w w . a j e r . o r g
Page 45
10 Conductor type AAC
11 Conductor size 150ⅿⅿ²
12 Cable size 240ⅿⅿ²
13 System type 3-phase AC
14 CTRs 600/5, 1200/5, 300/5 & 600/1
15 Base MVA 100
16 Relay type IDMT Electromechanical Relay
17 Conductor resistivity at 20°C 2.83X10⁻⁸
18 33kv line spacing 1219.2ⅿⅿ
Source: PHEDC and TCN.
3.3 Case Study of RSU 2 X 15MVA, 33/11kv Injection Substation
The full meaning of RSU is Rivers State University. RSU 2 X 15MVA, 33/11kv Injection Substation is
an injection substation owned and operated by Port Harcourt Electricity Distribution Company (PHEDC) but
located at Rivers State University, left wing from RSU main gate.
RSU 2 X 15MVA, 33/11kv Injection Substation is composed of 2 power transformers in the capacity of
15MVA each, with nomenclature as T1A and T2A. T1A 15MVA is connected to T1A 15MVA incomer breaker
which is connected to Ojoto 11kv feeder and RSU 11KV feeder while T2A 15MVA is connected to T2A
incomer breaker which in turn is connected to Federal 11kv feeder and Wokoma 11kv feeder.
The source of supply to RSU 2 X 15MVA, 33/11kv Injection Substation is the Port Harcourt Town 2 X
30MVA, 1 X 45MVA & 1 X 60MVA,132/33kv Transmission station also known as Z4, located at Amadi
junction by Nzimiro. At this location, a 30MVA transformer is connected to RSU 2 X 15MVA, 33/11kv
Injection Substation via the former UST 33kv feeder now known as RSU 33kv feeder.
3.4 Method of Relay Coordination in use at RSU 2 X 15MVA, 33/11kv Injection Substation
RSU 33kv line breaker at the Port Harcourt transmission station (Z4) has both Over Current Relay
(OCR) and Earth Fault Relay (EFR) protection schemes with current transformers (CTs) in place. RSU 2 X
15MVA, 33/11kv Injection Substation 33kv control panels, 11kv incomer breakers and 11kv outgoing feeders
also use OCR and EFR schemes with CTs at the various points. Relay coordination in both stations use a
combination of time and current grading for the protection of the 33kv line breaker at the Port Harcourt
transmission station and 33kv control panels, 11kv incomer breakers and 11kv outgoing feeders at RSU 2 X
15MVA, 33/11kv Injection Substation. The coordination uses Inverse Definite Minimum Time (IDMT) relay.
The relay in use is the IDMT 3sec. CDG electromechanical relay. OCR ranges from 2.5 to 10amperes while
EFR ranges from 1 to 4amperes.
3.5 Short Circuit Analysis on RSU 2 X 15MVA, 33/11kv Injection Substation If the DC is flowing around cylindrical conductor, the DC resistance becomes:
RD = ρl
A (Ω) (3.1)
Where
𝜌 is conductor resistivity at a given temperature in Ω/ⅿ
𝑙 is conductor length in m
A is conductor cross-section area in m²
Assuming cross – section area is: A =π ( d
2 )²(3.2)
Then calculation of the diameter becomes: d = 2r(3.3)
Entering the cross – section A:
d = 2. √A
π = 2r ≡ 1.1284√A (3.4)
From equation (3.3), the radius can be evaluated as:
r = d
2 (3.5)
Per kilometer reactance of one phase can be evaluated using:
xₒ = 0.1445log (DGMD
r)
10+ 0.0157 (3.6)
Where
DGMD is the geometric mean distance between the line conductors
r is taken as radius of conductors
Determination of the line reactance X, is given as:
𝑋 = 𝑥ₒ 𝑙ₒ (3.7)
The distributed series impedance becomes:
Z₁ = R + jX (3.8)

American Journal of Engineering Research (AJER) 2018
w w w . a j e r . o r g
Page 46
The equivalent admittance is given as:
Zₒ = Y = 1
Z= G + jB(3.9)
From the above relation, the following can be deduced as:
G = 1
R (3.10)
and
jB = j1
X (3.11)
If the source impedance and Base MVA are known, source impedance becomes:
Source Impedance =Base MVA
Fault MVA (3.12)
If transmission line constants for the route length 𝑍₁ 𝑎𝑛𝑑 𝑍ₒ are known, then transmission line constants
referred to base MVA in p.u can be evaluated as:
Z1P.U =
Z1 XBase MVA
(KV)²
(3.13)
Total fault impedance at RSU Injection Substation in p.u can be evaluated thus:
Zf = Zs+ Z1 + Zt (3.14)
Where
Zt =Zp.u = %Z×(Base MVA)
Transformer MVA
If a 3-phase fault occur on the 11kv at RSU Injection Substation, fault MVA becomes:
Fault MVA = Base MVA
Total fault impedance at RSU Injection Substation (3.15)
At RSU Injection Substation, fault current can be determined thus:
Fault current = Fault MVA
√3.VL (3.16)
Where
VL= Line voltage
3.5.1 Overcurrent Relay Coordination for 11kv Feeder Breaker at RSU 2 X 15MVA, 33/11kv Injection
Substation
If CTR and fault current are known, then:
Secondary value of fault current = fault current X CTR (3.17)
Also, if full load current is known, thenSecondary value of full load current can be determined as:
Secondary value of full load current = full load current X CTR (3.18)
Also, Multiplier Plug Setting (MPS) can be determined thus:
MPS = Secondary value of fault current
Plug set (3.19)
Relay operating time here is:
t = operating time of fuse + time delay of fuse to blow (3.20)
Alternatively, If TMS is calculated:
t =TMS X 0.14
MPS0.02
-1 (3.21)
Where
Time step delay = 0.1sec.
3.5.2 Overcurrent Relay Coordination for 11kv Transformer Breaker (incomer) at RSU 2 X 15MVA,
33/11kv
Injection Substation
Transformer full load current can be evaluated using:
I = P
3 .𝑉𝐿 (3.22)
Where
VL= 11kv
P = 15MVA
Relay actual operating time here is:
t = Relay operating time of feeder + time step delay (3.23)
Where
Time step delay is 0.3sec
3.5.3 Overcurrent Relay Coordination for 33kv Control Panel at RSU 2 X 15MVA, 33/11kv Injection
Substation
Transformer full load current in the primary can be evaluated using equation(3.22)
Where

American Journal of Engineering Research (AJER) 2018
w w w . a j e r . o r g
Page 47
VL = 33KV
P = 15MVA
The actual relay operating time at this point is:
t = Relay operating time of 11kv transformer breaker + time step delay (3.24)
Where
Time step delay = 0.6sec
3.5.4 RSU 33kv Line Breaker Overcurrent Relay Coordination (OCR) at Port Harcourt Town 2 X
30MVA, 1
X 45MVA & 1 X 60MVA, 132/33kv Transmission Station
Transformer full load current can be evaluated using equation (3.22)
Where
VL = 33kv
P = 30MVA From the value of full load current, appropriate CTR can be selected. Fault current on 33kv can be calculated
using the following:
Fault current = secondary value of fault current
3 (by transformation ratio) (3.25)
The actual relay operating time here becomes:
t = Relay operating time of 33kv control panel + time step delay (3.26)
Where
Time step delay = 0.9sec.
When considering earth fault relay coordination, it follows that:
Z1 = Z1P.U + Zt (3.27)
Where
Zt =Zp.u =%Z×(Base MVA)
Transformer MVA
Transformer 𝑍0 is 80% of 𝑍1 (3.28)
Assuming a line makes contact with earth, earth fault impedance is evaluated as follows:
Zef = Zs + Z1+Z2 + Z0
3 (3.29)
On the 11kv side, RSU 2 X 15MVA, 33/11kv Injection Substation earth fault MVA becomes:
Earth fault MVA = Base MVA
Zef (3.30)
Earth fault current, IEF = Earth fault MVA
3.VL (3.31)
Where
VL = 11kv
3.5.5 Earth Fault Relay Coordination for 11kv Feeder Breaker at RSU 2 X 15MVA, 33/11kv Injection
Substation
Since CTR is known, earth fault current can be defined as:
Isef = Ief X CTR (3.32)
Relay operating time here is:
t = EFR operating time of feeder (3.33)
Where
Time step delay = 0.1sec.
3.5.6 Earth Fault Relay Coordination for 11kv Transformer Breaker (incomer) at RSU 2 X 15MVA,
33/11kv
Injection Substation Relay operating time here becomes:
t = EFR operating time of feeder + time step delay (3.34)
Where
Time step delay = 0.3sec.
3.5.7 Earth Fault Relay Coordination for 33kv Control Panel at RSU 2 X 15MVA, 33/11kv Injection
Substation
Operating time of relay is t and is:
t = EFR operating time of 11kv transformer breaker + time step delay (3.35)
Where
Time step delay = 0.6sec.

American Journal of Engineering Research (AJER) 2018
w w w . a j e r . o r g
Page 48
3.5.8 RSU 33kv Line Breaker Earth Fault Relay Coordination (EFR) at Port Harcourt Town 2 X
30MVA, 1
X 60MVA, 132/33kv Transmission Station
Fault current on 33kv can be calculated as:
If = Isef
3 (3.36)
P.S is generally at the lowest value of 1 (IR). MPS is calculated using equation (3.19) at unity TMS. Operating
time of the relay will be:
t = EFR operating time of 33kv control panel + time step delay (3.37)
Where
Time step delay = 0.9sec.
3.6 Network Model and Simulation (Existing Case)
Considering the equation
RD = ρl
A (Ω)
RD = 2.83 x 10⁻⁸ 9500
1.5 x 10-4
= 1.7923Ω
From equations (3.4) and (3.5):
d = 2. √A
π = 2r
d = 2. √150
π = 13.82mm
and
r = d
2
r = 13.82
2= 6.91mm
Using equations (3.6) and (3.7), we have:
xₒ = 0.1445log (DGMD
r)
10
+ 0.0157
xₒ = 0.1445log (1219.2
6.91)
10 + 0.0157 = 0.3404Ω/km
and
X = xₒ lₒ
X = 0.3404 x 9.5 = 3.2338Ω
From the equation
Z₁ = R + jX
Z₁ = 1.7923 + j3.2338
Z₁ =√ ((1.7923)2+ (j3.2338)
2) = 3.6973Ω
Considering the equation
Zₒ = Y = 1
Z= G + jB

American Journal of Engineering Research (AJER) 2018
w w w . a j e r . o r g
Page 49
Where
1
Z =
1
1..7923 + j3.2338
1
Z = 0.1311 - j0.2366 Siemens
Series combination of 1.7923Ω and 3.2338Ω is equivalent to1
0.1311 = 7.628Ω resistance in parallel with a
1
0.2366 = 4.227Ω inductive reactance.
Using the equation
Zₒ = G + jB
Zₒ = (7.628 + j4.227)Ω
Zₒ = √ ((7.628)2+(j4.227)
2) = 8.721Ω
Also, base MVA = 100 and source % impedance = 12.27%.
Using the relation
Source impedance = % z X Base MVA
Transformer MVA
𝑆𝑜𝑢𝑟𝑐𝑒 𝐼𝑚𝑝𝑒𝑑𝑎𝑛𝑐𝑒, 𝑍𝑠𝑝. 𝑢 =12.27
100 𝑋
100
30= 0.409 p.u
Using the relation
Z1P.U =
Z1 X Base MVA
(KV)²
Z1P.U =
3.6973 X100
(33)²
= 0.3395 p.u
If impedance of transformer (T1A) at RSU Injection Substation is on 100MVA,
Zt1p.u = 11.1
100 X
100
15 = 0.74 p.u
Similarly, impedance on T2A becomes:
Zt2p.u = 10.689
100 X
100
15 = 0.7126 p.u
Total fault impedance on T1A at RSU Injection Substation becomes:
Zf = Zs+ Z1 + Zt1
Zf = 0.409 + 0.3395 + 0.74 = 1.4885 p.u
Also, total fault impedance on T2A at RSU Injection Substation becomes:
Zf = Zs+ Z1 + Zt2
Zf = 0.409 + 0.3395 + 0.7126 = 1.4611 p.u
Using the relation for T1A
American Journal of Engineering Research (AJER) 2018
w w w . a j e r . o r g
Page 50
Fault MVA = Base MVA
Total fault impedance at RSU Injection Substation
Fault MVA = 100
1.4885 = 67.18MVA
and for T2A
Fault MVA = 100
1.4611 = 68.44MVA
Considering the relations for 15MVA transformer
Primary full load current, I = P
√3.VL
I = 15 X 10
6
3X 33X103 = 262.43A
and
Secondary full load current,I = P
√3.VL
I = 15 X 10
6
3X 11X103 = 787.30A
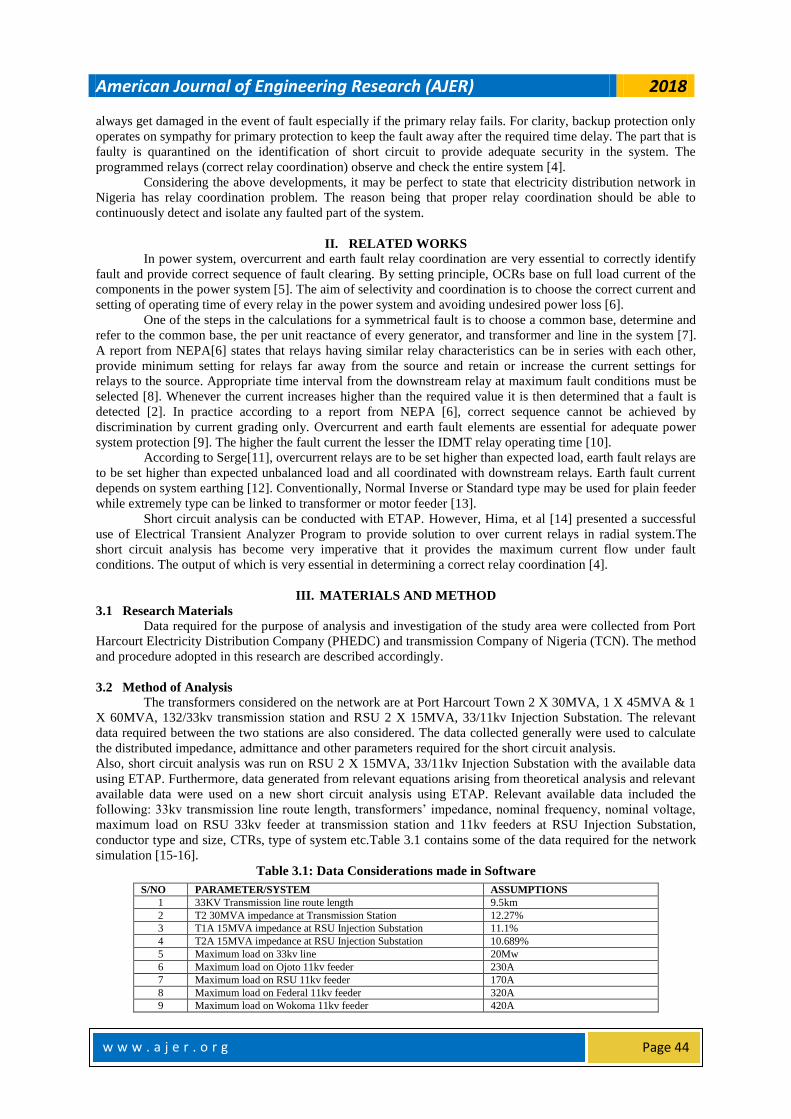
Upon getting all the data required to model and simulate to ascertain the present relay coordination status of
RSU 2 X 15MVA, 33/11kv Injection Substation with the use of ETAP 12.6 software, the data were used as
input data and are shown in figures 3.4(a-d).
Figure 3.4a:Ojoto 11kv Feeder Modelled in ETAP 12.6 Software (Existing Case)

American Journal of Engineering Research (AJER) 2018
w w w . a j e r . o r g
Page 51
Figure 3.4b:RSU 11kv Feeder Modelled in ETAP 12.6 Software (Existing Case)
Figure 3.4c:Federal 11kv Feeder Modelled in ETAP 12.6 Software (Existing Case)
Figure 3.4d:Wokoma 11kv Feeder Modelled in ETAP 12.6 Software (Existing Case)

American Journal of Engineering Research (AJER) 2018
w w w . a j e r . o r g
Page 52
3.7 Network Model and Simulation (New Case)
Having considered the fact that there was the dear need to improve the relay coordination, effort was made to
eliminate sequence tripping violation by replacing T1A and T2A secondary CTRs (from 1200/5 to 800/5).
All other existing parameters remained for the purpose of modelling and running a new case of short circuit
analysis which resulted to total elimination of sequence tripping violation. The sequence of operation was
numbered from 1 to 4 from upstream relay to downstream relay without violation which represents improved
relay coordination. The new case modelled short circuit analysis was modelled in ETAP 12.6 as in figures 3.5(a-
d).
Figure 3.5a:Ojoto 11kv Feeder Modelled in ETAP 12.6 Software (New Case)
Figure 3.5b:RSU 11kv Feeder Modelled in ETAP 12.6 Software (New Case)

American Journal of Engineering Research (AJER) 2018
w w w . a j e r . o r g
Page 53
Figure 3.5c:Federal 11kv Feeder Modelled in ETAP 12.6 Software (New Case)
Figure 3.5d:Wokoma 11kv Feeder Modelled in ETAP 12.6 Software (New Case)
IV. RESULTS AND DISCUSSION
4.1 Sequence of Operation Result Summary
The results obtained from the existing relay coordination (with CTR = 1200/5 for T1A and T2A and
time step delay of 0.3sec to 1.2sec) and new case relay coordination (with CTR=800/5 for T1A and T2A and
time step delay of 0.1sec to 0.9sec) are shown in Tables 4.1(a-f) and Figures 4.3(a-f). In each case, the tripping
that occurred due to the insertion of fault on any outgoing 11kv feeder are summarized in Tables 4.1(a-f) and
Figures 4.3(a-f). However, the tripping of the CBs by the relays followed the sequence when CTR of 1200/5 for
T1A and T2A was replaced with CTR of 800/5.
Table 4.1a: Tripping Sequence for Fault on T1A 11kv Feeders - Ojoto/RSU (Existing Case) FEEDER TRIPPING SEQUENCE TIME(ms)
OJOTO/RSU 1 8.2
T1A 11KV INCOMER 2 12.3
33KV CONTROL PANEL 3 10.2
33KV LINE BREAKER 4 17.8

American Journal of Engineering Research (AJER) 2018
w w w . a j e r . o r g
Page 54
Figure 4.3a: Graph Showing Existing Case Tripping Curve for Fault on T1A 11kv Feeders
Table 4.1b: Tripping Sequence for Fault on T2A 11kv Feeders - Federal/Wokoma (ExistingCase) FEEDER TRIPPING SEQUENCE TIME(ms)
FEDERAL/WOKOMA 1 8.2
T2A 11KV INCOMER 2 12.1
33KV CONTROL PANEL 3 10.1
33KV LINE BREAKER 4 17.5
Figure 4.3b: Graph Showing Existing Case Tripping Curve for Fault on T2A 11kv Feeder
Table 4.1c: Tripping Sequence for Fault on T1A 11kv Feeders - Ojoto/RSU (New Case)
FEEDER TRIPPING SEQUENCE TIME(ms)
OJOTO/RSU 1 8.2
T1A 11KV INCOMER 2 9.5
33KV CONTROL PANEL 3 10.2
33KV LINE BREAKER 4 17.8
Figure 4.3c: Graph Showing New Case Tripping Curve for Fault on T1A 11kv Feeders
Table 4.1d: Tripping Sequence for Fault on T2A 11kv Feeders - Federal/Wokoma (New Case) FEEDER TRIPPING SEQUENCE TIME(ms)
FEDERAL/WOKOMA 1 8.2
T2A 11KV INCOMER 2 9.4
33KV CONTROL PANEL 3 10.1
33KV LINE BREAKER 4 17.5
1 2 3 4
0.010.020.0
OJOTO/RSU T1A 11KV INCOMER 33KV CONTROL PANEL 33KV LINE BREAKER
TIM
E (m
S)
TRIPPING SEQUENCE
1 2 3 4
01020
FEDERAL/WOKOMA T2A 11KV INCOMER 33KV CONTROL PANEL 33KV LINE BREAKER
TIM
E (
mS
)
TRIPPING SEQUENCE
1 2 3 4
05
101520
OJOTO/RSU T1A 11KV INCOMER 33KV CONTROL PANEL 33KV LINE BREAKER
TIM
E (m
S)
TRIPPING SEQUENCE
American Journal of Engineering Research (AJER) 2018
w w w . a j e r . o r g
Page 55
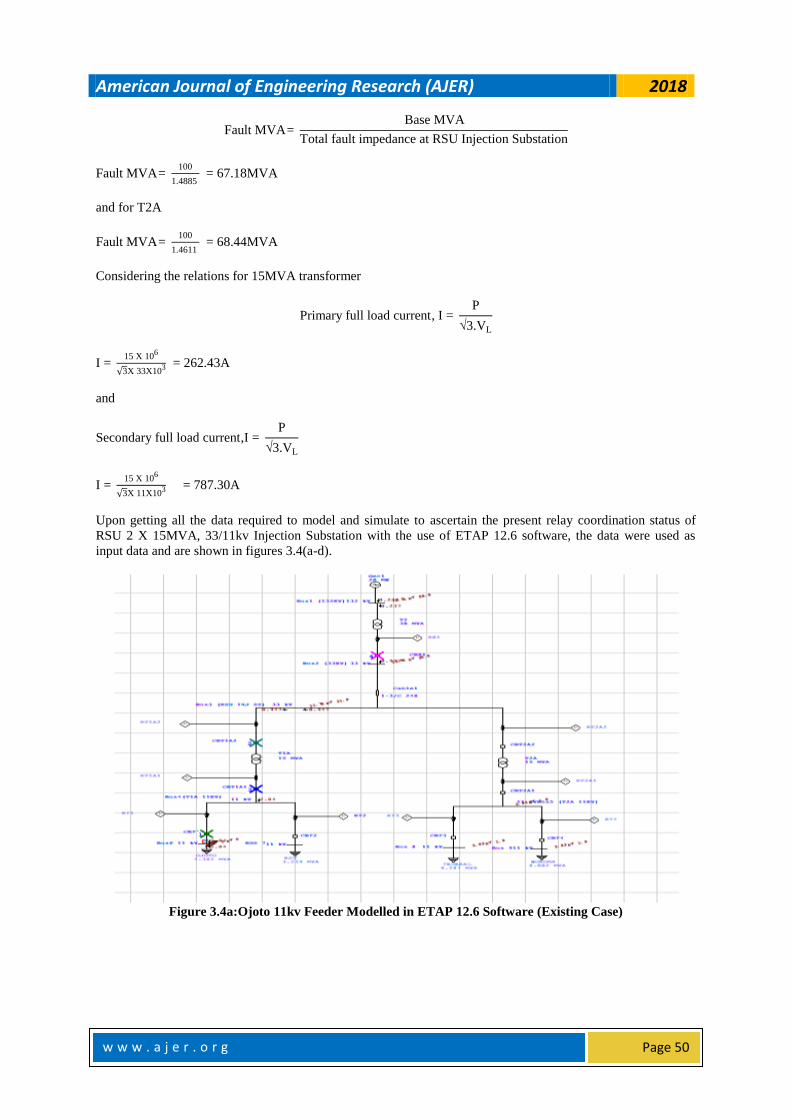
Figure 4.3d: Graph Showing New Case Tripping Curve for Fault on T2A 11kv Feeders
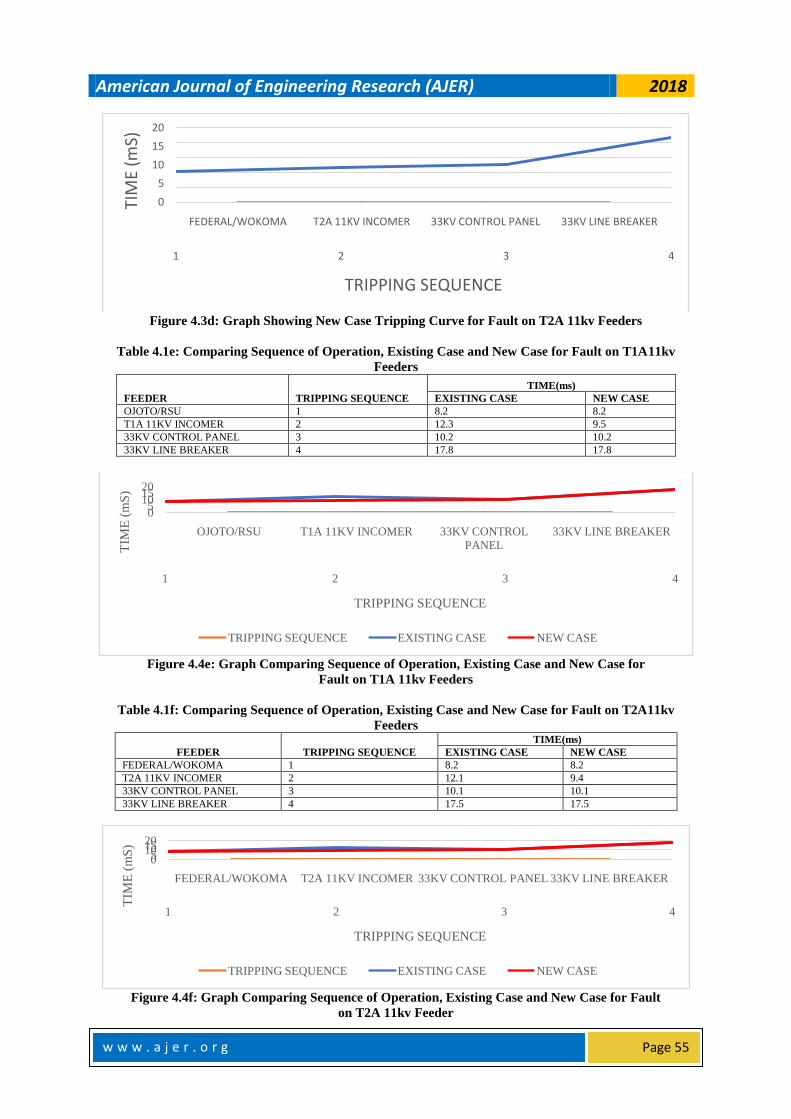
Table 4.1e: Comparing Sequence of Operation, Existing Case and New Case for Fault on T1A11kv
Feeders
FEEDER TRIPPING SEQUENCE
TIME(ms)
EXISTING CASE NEW CASE
OJOTO/RSU 1 8.2 8.2
T1A 11KV INCOMER 2 12.3 9.5
33KV CONTROL PANEL 3 10.2 10.2
33KV LINE BREAKER 4 17.8 17.8
Figure 4.4e: Graph Comparing Sequence of Operation, Existing Case and New Case for
Fault on T1A 11kv Feeders
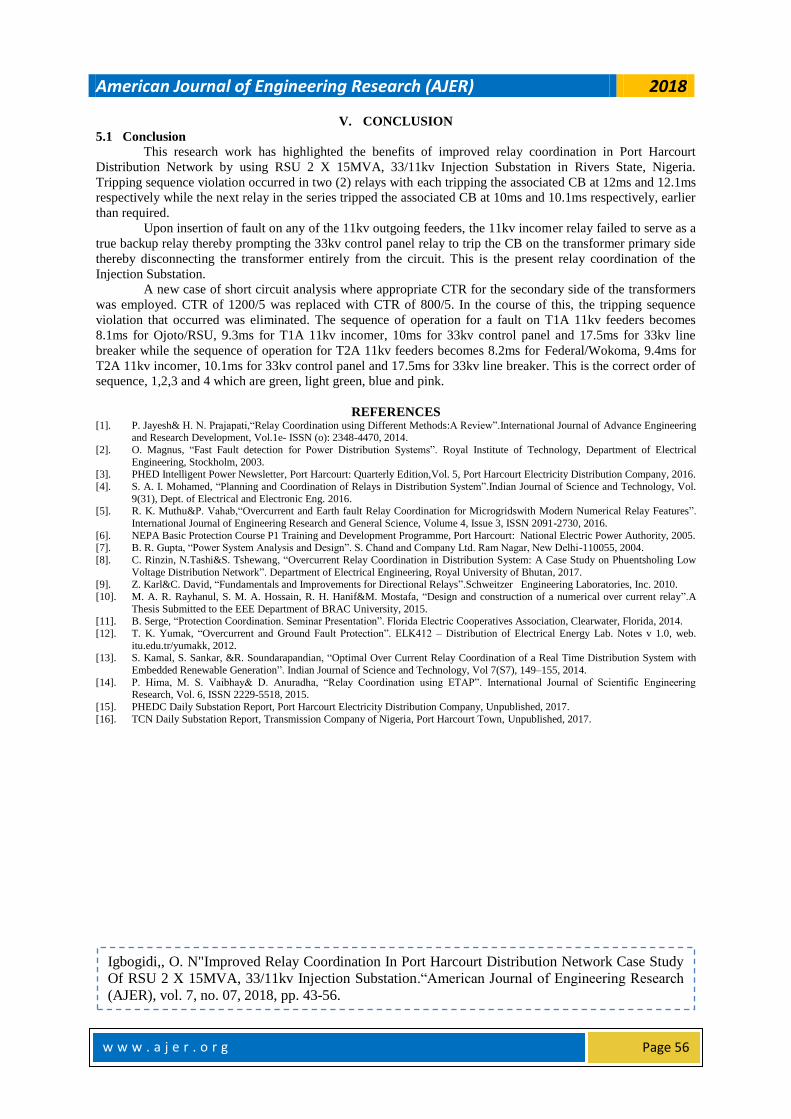
Table 4.1f: Comparing Sequence of Operation, Existing Case and New Case for Fault on T2A11kv
Feeders
FEEDER TRIPPING SEQUENCE
TIME(ms)
EXISTING CASE NEW CASE
FEDERAL/WOKOMA 1 8.2 8.2
T2A 11KV INCOMER 2 12.1 9.4
33KV CONTROL PANEL 3 10.1 10.1
33KV LINE BREAKER 4 17.5 17.5
Figure 4.4f: Graph Comparing Sequence of Operation, Existing Case and New Case for Fault
on T2A 11kv Feeder
1 2 3 4
0
5
10
15
20
FEDERAL/WOKOMA T2A 11KV INCOMER 33KV CONTROL PANEL 33KV LINE BREAKER
TIM
E (m
S)
TRIPPING SEQUENCE
1 2 3 4
05
101520
OJOTO/RSU T1A 11KV INCOMER 33KV CONTROL
PANEL
33KV LINE BREAKER
TIM
E (
mS
)
TRIPPING SEQUENCE
TRIPPING SEQUENCE EXISTING CASE NEW CASE
1 2 3 4
05101520
FEDERAL/WOKOMA T2A 11KV INCOMER 33KV CONTROL PANEL 33KV LINE BREAKER
TIM
E (
mS
)
TRIPPING SEQUENCE
TRIPPING SEQUENCE EXISTING CASE NEW CASE
American Journal of Engineering Research (AJER) 2018
w w w . a j e r . o r g
Page 56
V. CONCLUSION
5.1 Conclusion
This research work has highlighted the benefits of improved relay coordination in Port Harcourt
Distribution Network by using RSU 2 X 15MVA, 33/11kv Injection Substation in Rivers State, Nigeria.
Tripping sequence violation occurred in two (2) relays with each tripping the associated CB at 12ms and 12.1ms
respectively while the next relay in the series tripped the associated CB at 10ms and 10.1ms respectively, earlier
than required.
Upon insertion of fault on any of the 11kv outgoing feeders, the 11kv incomer relay failed to serve as a
true backup relay thereby prompting the 33kv control panel relay to trip the CB on the transformer primary side
thereby disconnecting the transformer entirely from the circuit. This is the present relay coordination of the
Injection Substation.
A new case of short circuit analysis where appropriate CTR for the secondary side of the transformers
was employed. CTR of 1200/5 was replaced with CTR of 800/5. In the course of this, the tripping sequence
violation that occurred was eliminated. The sequence of operation for a fault on T1A 11kv feeders becomes
8.1ms for Ojoto/RSU, 9.3ms for T1A 11kv incomer, 10ms for 33kv control panel and 17.5ms for 33kv line
breaker while the sequence of operation for T2A 11kv feeders becomes 8.2ms for Federal/Wokoma, 9.4ms for
T2A 11kv incomer, 10.1ms for 33kv control panel and 17.5ms for 33kv line breaker. This is the correct order of
sequence, 1,2,3 and 4 which are green, light green, blue and pink.
REFERENCES [1]. P. Jayesh& H. N. Prajapati,“Relay Coordination using Different Methods:A Review”.International Journal of Advance Engineering
and Research Development, Vol.1e- ISSN (o): 2348-4470, 2014.
[2]. O. Magnus, “Fast Fault detection for Power Distribution Systems”. Royal Institute of Technology, Department of Electrical
Engineering, Stockholm, 2003. [3]. PHED Intelligent Power Newsletter, Port Harcourt: Quarterly Edition,Vol. 5, Port Harcourt Electricity Distribution Company, 2016.
[4]. S. A. I. Mohamed, “Planning and Coordination of Relays in Distribution System”.Indian Journal of Science and Technology, Vol.
9(31), Dept. of Electrical and Electronic Eng. 2016. [5]. R. K. Muthu&P. Vahab,“Overcurrent and Earth fault Relay Coordination for Microgridswith Modern Numerical Relay Features”.
International Journal of Engineering Research and General Science, Volume 4, Issue 3, ISSN 2091-2730, 2016.
[6]. NEPA Basic Protection Course P1 Training and Development Programme, Port Harcourt: National Electric Power Authority, 2005. [7]. B. R. Gupta, “Power System Analysis and Design”. S. Chand and Company Ltd. Ram Nagar, New Delhi-110055, 2004.
[8]. C. Rinzin, N.Tashi&S. Tshewang, “Overcurrent Relay Coordination in Distribution System: A Case Study on Phuentsholing Low
Voltage Distribution Network”. Department of Electrical Engineering, Royal University of Bhutan, 2017.
[9]. Z. Karl&C. David, “Fundamentals and Improvements for Directional Relays”.Schweitzer Engineering Laboratories, Inc. 2010.
[10]. M. A. R. Rayhanul, S. M. A. Hossain, R. H. Hanif&M. Mostafa, “Design and construction of a numerical over current relay”.A
Thesis Submitted to the EEE Department of BRAC University, 2015. [11]. B. Serge, “Protection Coordination. Seminar Presentation”. Florida Electric Cooperatives Association, Clearwater, Florida, 2014.
[12]. T. K. Yumak, “Overcurrent and Ground Fault Protection”. ELK412 – Distribution of Electrical Energy Lab. Notes v 1.0, web.
itu.edu.tr/yumakk, 2012. [13]. S. Kamal, S. Sankar, &R. Soundarapandian, “Optimal Over Current Relay Coordination of a Real Time Distribution System with
Embedded Renewable Generation”. Indian Journal of Science and Technology, Vol 7(S7), 149–155, 2014.
[14]. P. Hima, M. S. Vaibhay& D. Anuradha, “Relay Coordination using ETAP”. International Journal of Scientific Engineering Research, Vol. 6, ISSN 2229-5518, 2015.
[15]. PHEDC Daily Substation Report, Port Harcourt Electricity Distribution Company, Unpublished, 2017.
[16]. TCN Daily Substation Report, Transmission Company of Nigeria, Port Harcourt Town, Unpublished, 2017.
Igbogidi,, O. N"Improved Relay Coordination In Port Harcourt Distribution Network Case Study
Of RSU 2 X 15MVA, 33/11kv Injection Substation.“American Journal of Engineering Research
(AJER), vol. 7, no. 07, 2018, pp. 43-56.