improved quantification of left ventricular mass based on ... · enrico g. caiani phd1,2, cristiana...
TRANSCRIPT
1
Improved quantification of left ventricular mass based on endo- and epicardial surface detection
using real-time three-dimensional echocardiography
Enrico G. Caiani PhD1,2, Cristiana Corsi PhD3, Lissa Sugeng MD1, Peter MacEneaney MD1, Lynn Weinert BS1, Victor Mor-Avi PhD1, Roberto M. Lang MD1
1 Noninvasive Cardiac Imaging Laboratory, University of Chicago, Chicago, Illinois, USA 2 Dipartimento di Bioingegneria, Politecnico di Milano, Milano, Italy 3 DEIS, Università di Bologna, Bologna, Italy Short running title: 3D Echocardiographic Quantification of LV Mass The Corresponding Author has the right to grant on behalf of all authors and does grant on behalf of all authors, an exclusive licence on a worldwide basis to the BMJ Publishing Group Ltd and its Licensees to permit this article to be published in HEART editions and any other BMJPGL products to exploit all subsidiary rights. Address for correspondence: Roberto M. Lang, MD University of Chicago Medical Center, MC5084, 5841 S. Maryland Ave., Chicago Illinois 60637. Tel: (773)-702-1842, Fax: (773)-702-1034; E-mail: [email protected]
Heart Online First, published on May 12, 2005 as 10.1136/hrt.2005.060889
Copyright Article author (or their employer) 2005. Produced by BMJ Publishing Group Ltd (& BCS) under licence.
on 3 May 2019 by guest. P
rotected by copyright.http://heart.bm
j.com/
Heart: first published as 10.1136/hrt.2005.060889 on 12 M
ay 2005. Dow
nloaded from
2
Abstract. Objective: Our goal was to develop a technique for volumetric analysis of real-time three-dimensional echocardiography (RT3DE) data aimed at quantification of LV mass and validate it against magnetic resonance (MR) assumed as “gold standard”. Design: RT3DE, which has recently become widely available, provides dynamic pyramidal data structures that encompass the entire heart and allows four-dimensional assessment of cardiac anatomy and function. However, analysis techniques for the quantification of left ventricular (LV) mass from RT3DE data are fundamentally two-dimensional, rely on geometric modelling and do not fully exploit the volumetric information contained in RT3DE datasets. Twenty-one patients underwent 2D echocardiography (2DE), RT3DE and cardiac MR. LV mass was measured from 2DE and MR images using conventional techniques. RT3DE data were analyzed to semi-automatically detect endocardial and epicardial LV surfaces using the level-set approach. From the detected surfaces, LV mass was computed directly in the 3D space as voxel counts. Results: RT3DE measurements were feasible in 19/21 patients and resulted in higher correlation with MR (r=0.96) than 2DE (r=0.79). RT3DE measurements also had a significantly smaller bias (-2.1g) and tighter limits of agreement (2SD:±23g) with MR than the 2DE values (bias (2SD):-34.9 (50) g). Additionally, interobserver variability of RT3DE (12.5%) was significantly lower than that of 2DE (24.1%). Conclusions: Direct 3D model-independent LV mass measurements from RT3DE images are feasible in the clinical setting and provide fast and accurate assessment of LV mass, superior to the 2D analysis techniques. Keywords: real-time three-dimensional echocardiography; semi-automated surface detection; left ventricular mass; cardiac magnetic resonance imaging.
on 3 May 2019 by guest. P
rotected by copyright.http://heart.bm
j.com/
Heart: first published as 10.1136/hrt.2005.060889 on 12 M
ay 2005. Dow
nloaded from

3
1. Introduction The evaluation of left ventricular (LV) mass is an important clinical variable in
patient management, since this parameter is an independent and strong predictor of morbid cardiac events and death.[1][2] Conventional LV mass measurements derived from manual tracing of two-dimensional echocardiographic (2DE) images are subjective,[3] time-consuming and rely on geometric assumptions of uniform chamber size and shape.[4] Importantly, the LV mass measurements are highly dependent on the ability to obtain non-foreshortened long-axis images from apical acoustic windows,[5] which is in many patients compromised by limited access to the apex through the inter-costal spaces.
We have recently shown that this limitation can be overcome by extracting anatomically correct,[6] non-foreshortened, orthogonal 2D apical views from transthoracic real-time three-dimensional echocardiographic (RT3DE) data. From these views, biplane calculation of LV volumes is obtained by manually tracing endocardial and epicardial contours. This approach was used to test a fast and simple, widely available technique to asses LV mass and to evaluate the effects of the foreshortening as the source of the underestimation of LV mass by the conventional 2DE analysis.
While our previous results demonstrated that LV mass can be measured from RT3DE datasets more accurately than with the conventional 2DE approach,[6] the data analysis procedure we used is still two-dimensional, and thus fraught with the limitations inherent to this methodology. First, it relies on the subjective selection of non-foreshortened 2D apical views and manual tracing of endo- and epicardial boundaries, and second, LV mass computations are derived from model-based biplane volumes, which may be inaccurate.
RT3DE datasets are dynamic pyramidal data structures that encompass the entire heart and are obtained from a single acoustic window, allowing four-dimensional assessment of cardiac anatomy and function.[7][8] Our current study was designed to test the hypothesis that detection of LV endo- and epicardial surfaces in 3D space could allow even more accurate direct measurements of LV mass, without the need for subjective plane selection and geometrical modelling. Accordingly, our goal was to develop and validate a new semi-automated method, based on level set models,[9][10][11] to measure LV mass based on rapid detection of LV endocardial and epicardial surfaces. To achieve this goal, we evaluated the accuracy and interobserver variability of LV mass measurements based on this newly developed technique, using cardiac MR measurements as the reference for comparison.
2. Methods In the current investigation, we studied the same group of patients reported
previously. [6] Patients referred for cardiac MR imaging were included in the study if they had adequate transthoracic 2D acoustic windows (apical 4- and 2-chambers) that allowed adequate endocardial visualization without contrast enhancement. Exclusion criteria included dyspnea precluding a 12 sec breath-hold, atrial fibrillation, pacemaker or defibrillator implantation, claustrophobia and other well-known contraindications to MR. Using these criteria, twenty-one patients (age (SD), 48 (16) years; 13 men, 8 women) were recruited, including 7 patients with suspected coronary artery disease, 7 with dilated cardiomiopathy, 2 post myocardial infarction, 3 with aortic disease, 1 with a right atrial mass and 1 with mitral valve regurgitation. After Institutional Review Board
on 3 May 2019 by guest. P
rotected by copyright.http://heart.bm
j.com/
Heart: first published as 10.1136/hrt.2005.060889 on 12 M
ay 2005. Dow
nloaded from

4
committee approval, written informed consent was obtained from all patients. Echocardiographic imaging, including 2DE and RT3DE data acquisition, was performed on the same day as the MR study.
MAGNETIC RESONANCE IMAGING Cardiac MR images were obtained with a 1.5 Tesla scanner (General Electric)
with a phased-array cardiac coil. Electrocardiogram-gated localizing spin-echo sequences were used to identify the long-axis of the heart. Steady-state free precession (FIESTA) dynamic gradient-echo cine-loops were obtained during 12-second breath-holds with a temporal resolution of 20 frames per cardiac cycle. In all patients, 6 to 10 short-axis cine-loops were obtained from the atrioventricular ring to the apex (9 mm slice thickness, no gaps).
TWO-DIMENSIONAL ECHOCARDIOGRAPHY Transthoracic 2DE harmonic imaging was performed using a commercial
ultrasound scanner (SONOS 7500, Philips Medical Systems) equipped with a broad-band transducer (S3, 2-4 MHz). Echocardiographic imaging was performed from the apical window, with the patient in the left lateral decubitus position. Five consecutive apical 4- and 2-chamber loops were acquired during a breath-hold while taking care to avoid foreshortening during acquisition. Loops were stored digitally for off-line review and analysis (EnConcert, Philips Medical Systems).
REAL-TIME THREE-DIMENSIONAL ECHOCARDIOGRAPHY Transthoracic RT3DE imaging was performed in the same setting, using a fully
sampled matrix array transducer (X4) in the harmonic 3D mode. Care was taken to include the entire LV cavity within the pyramidal 3D scan volume. RT3DE datasets were then acquired using the wide-angled acquisition mode, wherein four wedge-shaped sub-volumes (93°x21°) were acquired over four cardiac cycles during a breath-hold with ECG gating. Acquisition of each sub-volume was triggered to the R-wave of every other heartbeat in order to allow sufficient time for the probe to be recalibrated and each sub-volume stored.
ANALYSIS OF MR IMAGES Cardiac MR images were analyzed using commercial software (MASS Analysis,
General Electric). Consecutive slices from the LV base, defined as the highest slice in which the LV outflow tract was not visible, down to the lowest slice in which LV cavity was visible, were selected for analysis. In every slice, LV endocardial contours were traced semi-automatically frame-by-frame, with the papillary muscles included in the LV cavity, and manually corrected when necessary to optimize boundary position. Then, LV volumes were computed throughout the cardiac cycle using a disk-area summation method (modified Simpson’s rule). The end-diastolic (ED) frame was then identified as the frame with the maximum LV volume reached during the cardiac cycle, and used to trace the LV epicardial contour. The volume included in the epicardium (EDVep) was computed with the same disk-area summation method and used to calculate the LV mass as (EDVep – EDV) times the mass density constant (1.05 g/cc). The MR data served as the “gold standard” for comparisons against 2DE and RT3DE echocardiographic data. All tracings were performed by an investigator experienced in cardiac MR analysis who had no knowledge of the echocardiographic measurements.
on 3 May 2019 by guest. P
rotected by copyright.http://heart.bm
j.com/
Heart: first published as 10.1136/hrt.2005.060889 on 12 M
ay 2005. Dow
nloaded from
5
ANALYSIS OF 2DE IMAGES The 2DE loops were analyzed off-line (Enconcert, Philips Medical Systems). For
both apical 4- and 2-chamber views, from the five acquired loops, the one with the best image quality and least apical foreshortening was selected for analysis. The ED frame was selected as the image with the largest LV cavity area. Endocardial and epicardial contours were manually traced while including the papillary muscles in the LV cavity, and used to calculate ED endocardial and epicardial volumes using the biplane Simpson’s formula.[4][12] The difference between epicardial and endocardial volumes was computed for each view, averaged for both views and multiplied by the mass density constant (1.05 g/cc) to calculate a biplane estimate of LV mass.
ANALYSIS OF RT3DE IMAGES The RT3DE datasets were analyzed using custom software,[11] which allows
semi-automated LV surface detection based on the level set approach.[9] This method uses an implicit representation of curves in the form of a partial differential equation to track boundaries, without geometrical assumptions or a-priori shape knowledge.[10]
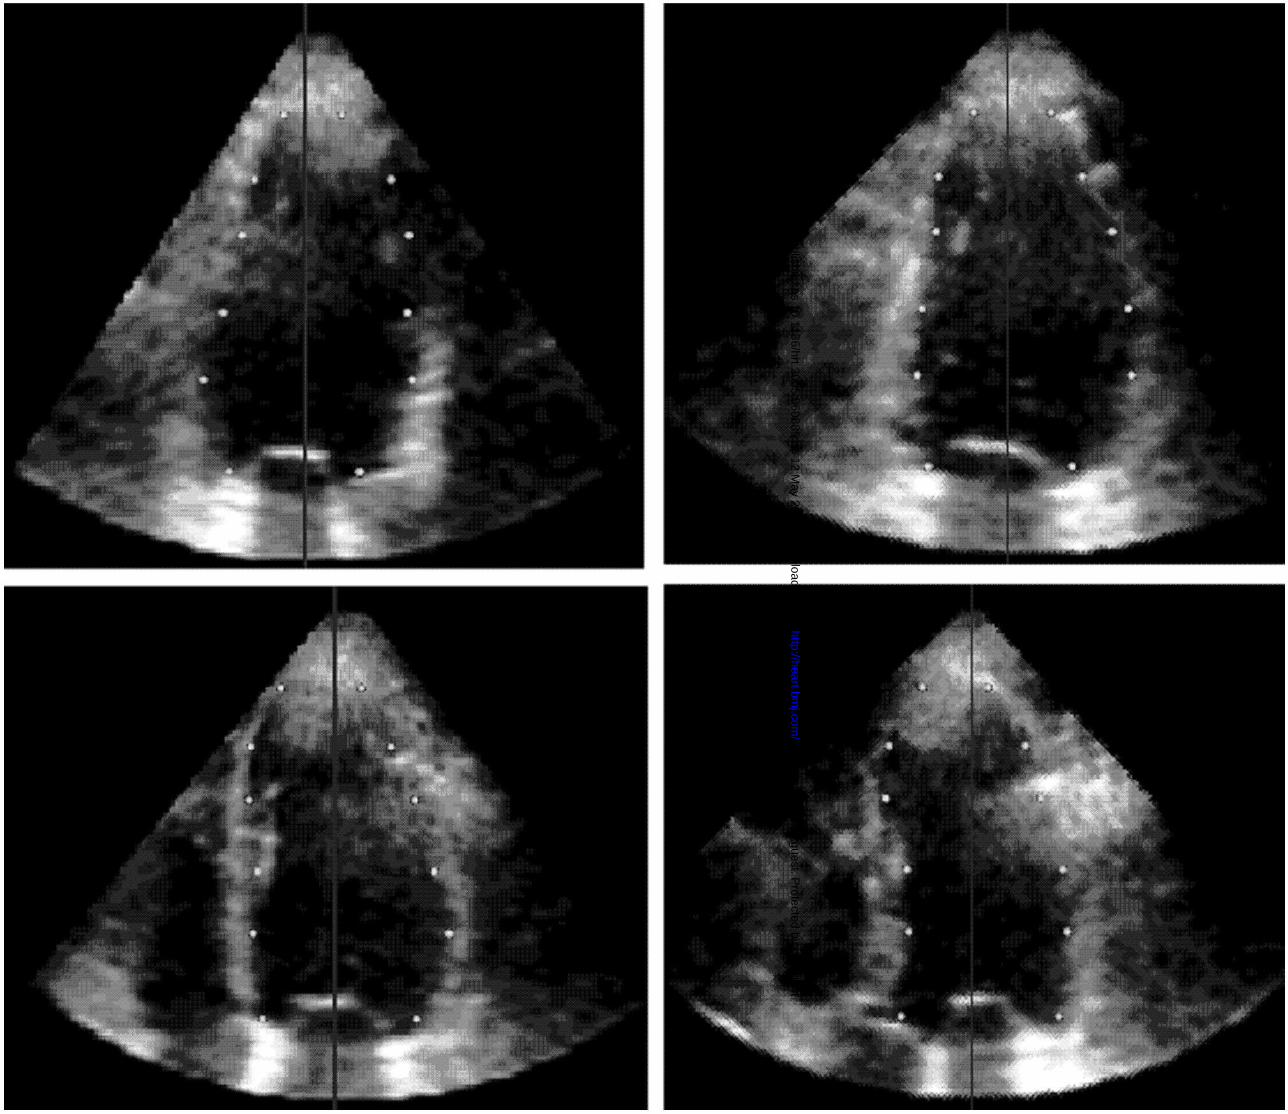
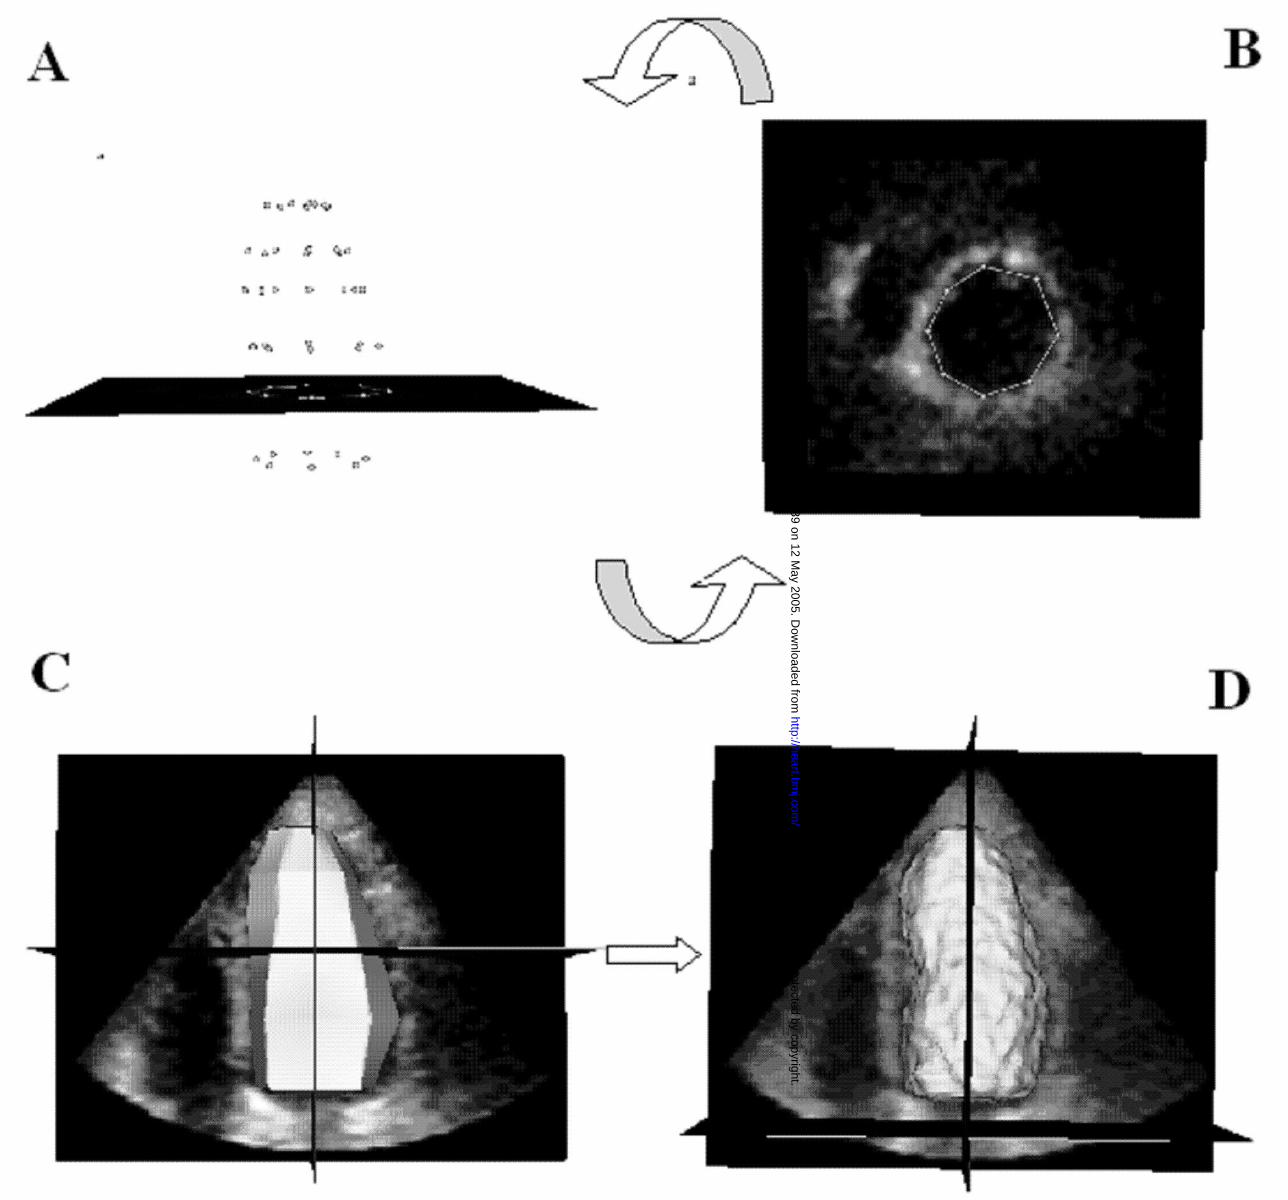
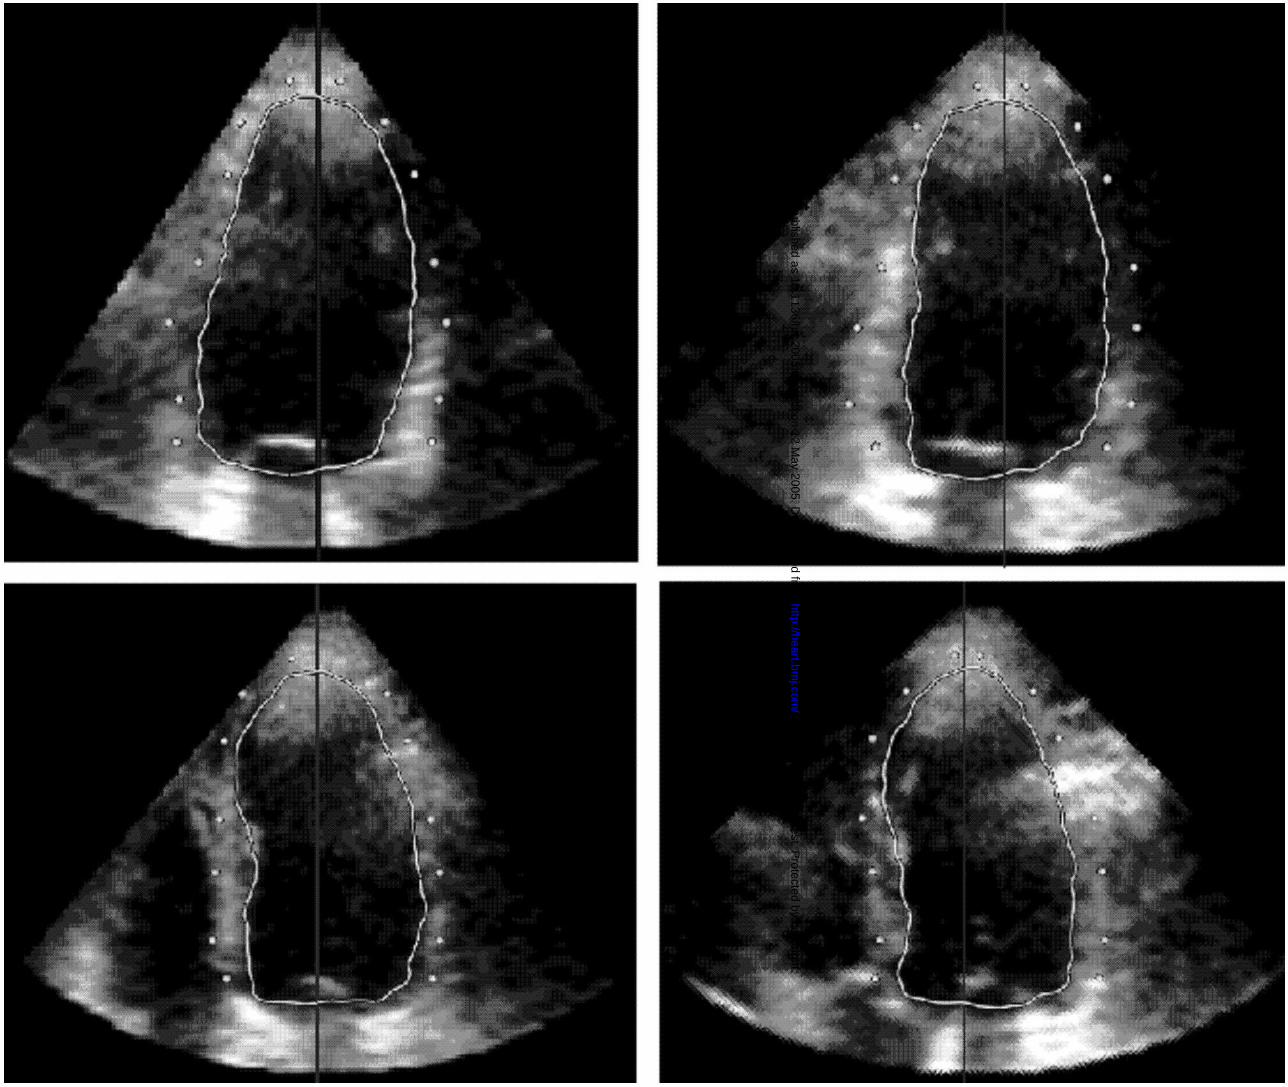
Initially, the dynamic dataset was displayed in the 3D space. Then, a manual initialization procedure of the LV endocardial position was required. The ED frame, visually determined by the operator as the largest LV cavity in the cardiac cycle, was selected for analysis. In order to detect the LV endocardium (fig 1), the operator manually defined the long axis of the left ventricle in the 3D dataset; then, two points were manually selected in each of four evenly 45°-rotated long-axis planes, one on each side of the endocardial interface. This procedure was repeated at six to eight different short axis planes, from apex to base. To be consistent with cardiac MR tracings, papillary muscles were included in the LV cavity initialization. Once the points were manually initialized on the four evenly 45°-rotated long-axis planes, verification of the position of the points was performed in multiple short-axis views from base to apex, thus resolving possible ambiguities, During this phase, the operator had the opportunity to adjust the position of the points, if needed (fig 2, A,B).
All selected points were then joined to define a surface (fig 2, C), representing the initial condition for the level-set partial differential equation, which guided the evolution of this surface within the volumetric dataset towards the endocardial position.
Following a fully automated iterative process, the final endocardial surface was detected (fig 2, D), from which the EDV was measured by counting voxel confined within the surface.
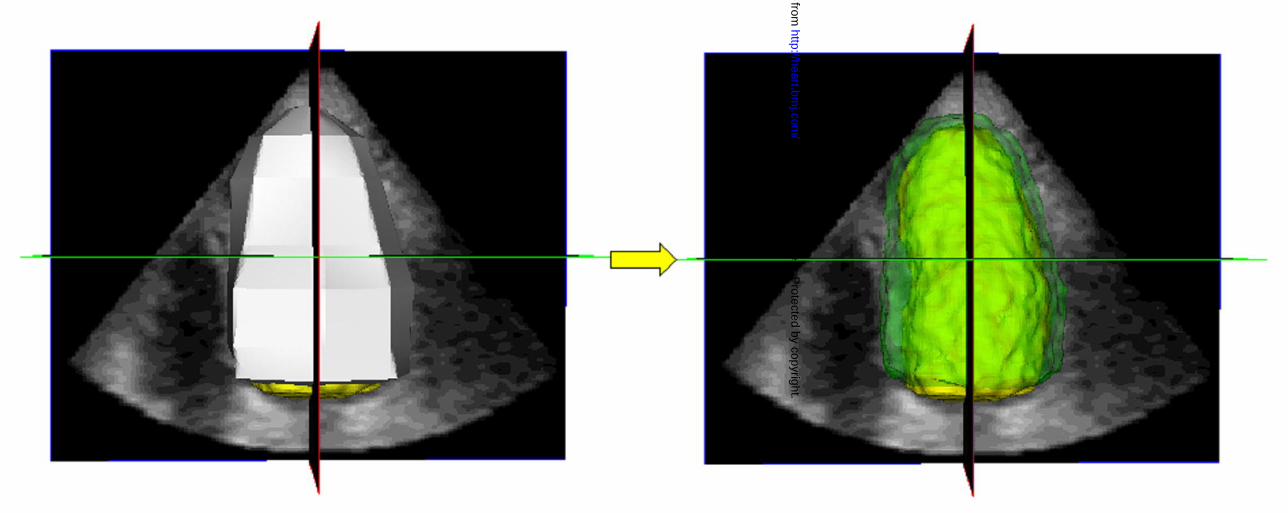
To detect the epicardial surface (fig 3), the same initialization procedure was repeated on the same frame. The epicardial points were then selected on the same four long-axis planes with the cross-section of the detected LV endocardial surface, which was superimposed to guide the initialization. The initial epicardial surface was then calculated by joining the selected points and, following an iterative process, the final epicardial surface was obtained (fig 4). The epicardial volume (EDVep) was measured from voxel counts, and LV mass was then obtained as 1.05*(EDVep - EDV).
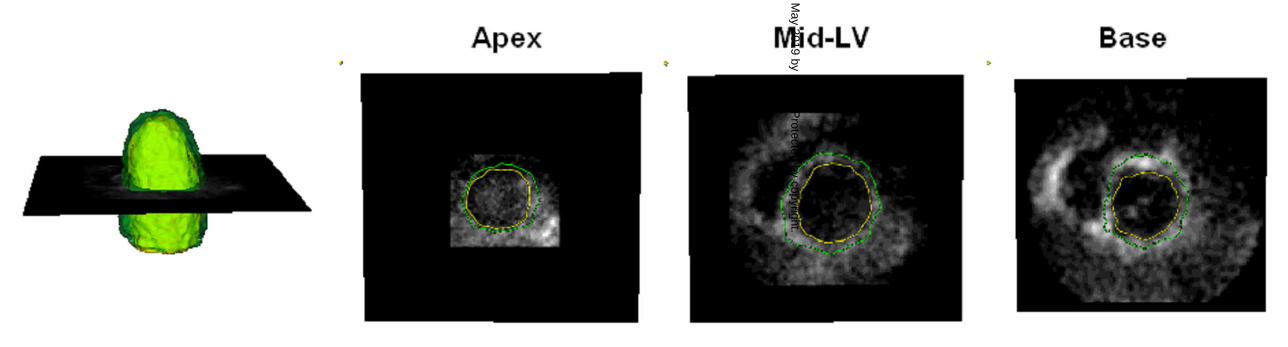
To visually verify the correctness of the detected endo- and epicardial surfaces, both surfaces were superimposed on the volumetric data (fig 5), which allowed cross-sectioning in any arbitrary plane and corrections in the initial points when necessary.
on 3 May 2019 by guest. P
rotected by copyright.http://heart.bm
j.com/
Heart: first published as 10.1136/hrt.2005.060889 on 12 M
ay 2005. Dow
nloaded from

6
INTEROBSERVER VARIABILITY To determine the interobserver variability in the measurement of LV mass, 2DE
and RT3DE images were analyzed on separate days by three independent observers blinded to the results obtained with MR and the other echocardiographic technique. Inter-observer variability for 2DE and RT3DE was calculated as the SD of the mean of three observers and expressed in percent of the mean.
STATISTICAL ANALYSIS Values were expressed as mean (SD). 2DE and RT3DE measurements obtained
by each observer were compared with MR values using paired t-test. Linear regression analysis was performed, and Pearson’s correlation coefficient and SEE were computed. In addition, agreement between 2DE and RT3DE with MR “gold standard” was evaluated using Bland-Altman analysis. T-test was applied to verify the significance of the bias (paired t-test versus null values).
3. Results RT3DE echocardiography was feasible in all patients with the exception of two
patients with dilated cardiomiopathy, whose hearts did not completely fit into the pyramidal scan volume. In the remaining 19 patients, MR values for EDV ranged from 79 to 390 ml (172 (74) ml), while LV mass measurements ranged from 57 to 222 g, with a mean value of 126 (39) g.
The time required to analyze a single RT3DE dataset, including endocardial and epicardial surface initialization, correction and computation of LV mass was 190 (60) sec. The mean (SD) for LV mass obtained by each of the three observers from RT3DE and 2DE data sets is presented in Table 1.
Table 1. LV mass measurements as mean (SD) obtained in 19 patients by three observers using manual tracing of two-dimensional echocardiography (2DE) and semi-automated surface detection applied to real-time three-dimensional echocardiography (RT3DE). All values were compared with MR reference of 126 (39) g.
Observer 1 Observer 2 Observer 3
RT3DE (g) 119 (41) 127 (37) 129 (35)
2DE (g) 99 (37)* 70 (21)* 95 (26)* * p<0.05, paired t-test versus MR
While no significant differences in mean values of LV mass were noted between
MR and RT3DE, with 2DE all three observers consistently and significantly (p=0.001) underestimated LV mass (average error: 28 (19) %) compared to MR.
The combined measurements of LV mass for the three observes using biplane 2DE resulted in a correlation of r=0.79 (SEE = 20 g, p<0.001) with MR values (fig 6, top left). Bland-Altman analysis (fig 6, bottom left) confirmed the underestimation by 2DE by demonstrating a bias (p=0.001) of –34.9 g, (28% of the mean) with relatively wide 95% limits of agreement at ± 50 g (± 40 % of the mean MR value).
The combined semi-automated measurements of LV mass by the 3 observers using the RT3DE technique resulted in a correlation of r=0.96 (SEE = 10.5 g, p<0.001)
on 3 May 2019 by guest. P
rotected by copyright.http://heart.bm
j.com/
Heart: first published as 10.1136/hrt.2005.060889 on 12 M
ay 2005. Dow
nloaded from
7
with MR values (fig 6, top right). Bland-Altman analysis (fig 6, bottom right) demonstrated no significant underestimation by RT3DE, as reflected by a minimal bias of –2.1 g (2 % of the mean) and narrow 95% limits of agreement at ± 23 g (± 18 % of the mean MR value).
The interobserver variability of LV mass values derived from manual tracing of the 2DE images was 24 (12) % (ranging in individual patients from 4 to 50 %). Using RT3DE data and the semi-automated surface detection algorithm, the interobserver variability was significantly lower (12 (8) %, p=0.001 vs 2DE, range: 1 to 26 %).
4. Discussion Although M-mode and 2DE have been traditionally utilized for the quantification of
LV mass,[13] their dependence on geometric modelling have limited their use. In fact, both the M-mode and 2D area-length formulas for calculating LV mass assume that the left ventricle has a fixed geometric shape, which may result in errors, particularly in patients with wall motion abnormalities. Moreover, the inadvertent use of oblique cuts in M-mode echocardiography and foreshortened apical views with 2DE can potentially result in additional inaccuracies.[6][14][15][16][17]
Three-dimensional echocardiography, as a basis for off-line 3D reconstruction from multiple planes, has been demonstrated to reliably quantify LV mass in both animal experiments,[18][19][20][21] and human studies.[16][22][23] The enhanced accuracy with reduced interobserver variability has been demonstrated with a variety of methods for data acquisition, including the gated rotational approach,[18][24] and free-hand scanning using locator devices.[21][25][26] Despite the obvious advantages of using a 3D imaging approach to quantify LV mass, these methods have not been successfully incorporated into the clinical practice. This is probably due to the cumbersome and lengthy data acquisition coupled with the extensive time requirements for data analysis.
The recent introduction of the fully-sampled matrix array transducer for near real-time 3D imaging and rendering of the left ventricle has solved the majority of the problems inherent to the 3D acquisition. However, in all previous studies,[24][27][28][29][30] the analysis of RT3DE datasets was essentially two-dimensional, since it relied on the computation of LV endocardial or epicardial surface by interpolating manually traced or semi-automatically detected contours on multiple 2D planes extracted from the 3D datasets. This 2D analysis can potentially introduce errors due to its inability to detect asymmetries or changes in LV shape between individually traced planes. In our recent paper,[6] we proved that even 2D analysis of RT3DE data by extraction of biplane views improves the accuracy of LV mass measurements compared to the conventional 2DE methodology.
In the present study, we hypothesised that true 3D analysis, free of both geometric modelling and the need to subjectively select and manually trace non-foreshortened 2D apical views, could further improve the accuracy of echocardiographic evaluation of LV mass. To test this hypothesis, we developed a novel volumetric analysis technique for direct LV mass measurement from endo- and epicardial surfaces detected from the RT3DE data. This technique was validated against MR “gold standard” in the same group of patients used in our previous study, using the same datasets to obtain reference measurements.[6]
Differently to previously presented approaches for RT3DE data analysis,[24][27][28][29][30] which were based on detection of LV contours on multiple 2D planes, and their interpolation in order to generate the LV surface, our 3D technique
on 3 May 2019 by guest. P
rotected by copyright.http://heart.bm
j.com/
Heart: first published as 10.1136/hrt.2005.060889 on 12 M
ay 2005. Dow
nloaded from
8
directly detects the LV surface in 3D space, using all the voxel information contained in the volumetric dataset to guide the evolution of the surface, starting from the manually initialized cloud of points. Differently to another recently described 3D analysis techniques applied to RT3DE data,[31] the level set image segmentation approach that we used to detect LV endo- and epicardial surfaces is completely independent from any a-priori information about the shape characteristics of the left ventricle and its deformation throughout the cardiac cycle. [9] Therefore, this novel approach allows the detection of a variety of ventricular endocardial and epicardial shapes.
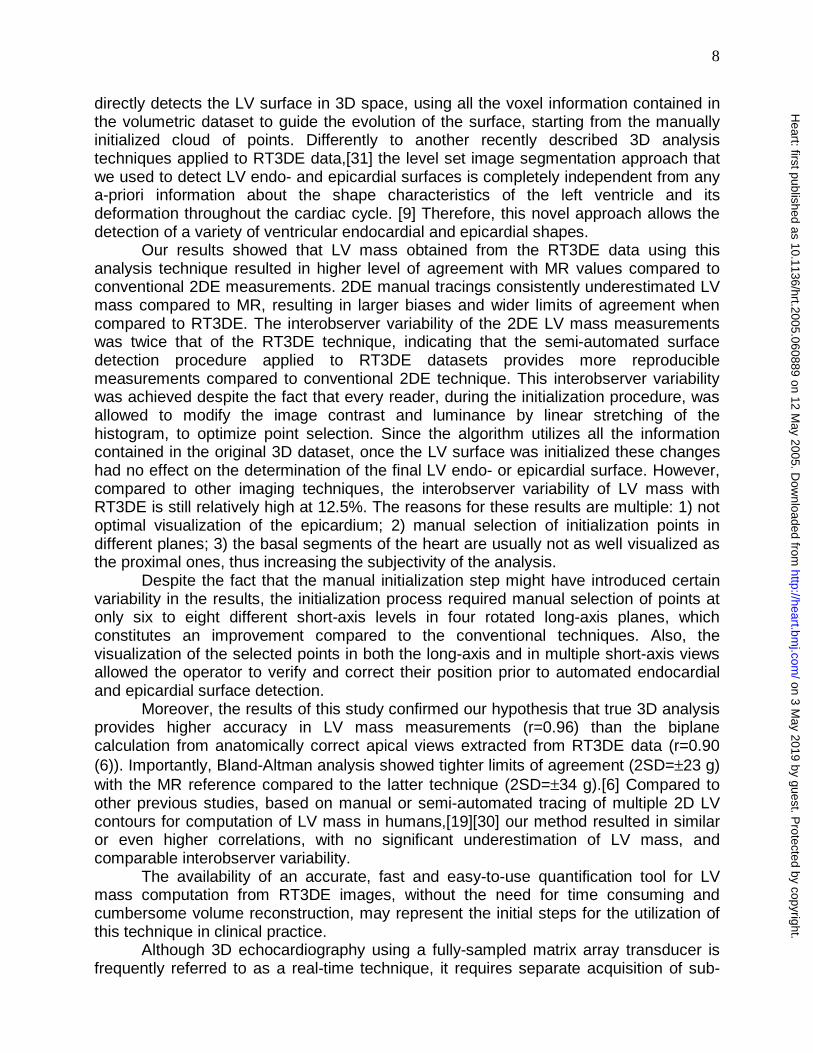
Our results showed that LV mass obtained from the RT3DE data using this analysis technique resulted in higher level of agreement with MR values compared to conventional 2DE measurements. 2DE manual tracings consistently underestimated LV mass compared to MR, resulting in larger biases and wider limits of agreement when compared to RT3DE. The interobserver variability of the 2DE LV mass measurements was twice that of the RT3DE technique, indicating that the semi-automated surface detection procedure applied to RT3DE datasets provides more reproducible measurements compared to conventional 2DE technique. This interobserver variability was achieved despite the fact that every reader, during the initialization procedure, was allowed to modify the image contrast and luminance by linear stretching of the histogram, to optimize point selection. Since the algorithm utilizes all the information contained in the original 3D dataset, once the LV surface was initialized these changes had no effect on the determination of the final LV endo- or epicardial surface. However, compared to other imaging techniques, the interobserver variability of LV mass with RT3DE is still relatively high at 12.5%. The reasons for these results are multiple: 1) not optimal visualization of the epicardium; 2) manual selection of initialization points in different planes; 3) the basal segments of the heart are usually not as well visualized as the proximal ones, thus increasing the subjectivity of the analysis.
Despite the fact that the manual initialization step might have introduced certain variability in the results, the initialization process required manual selection of points at only six to eight different short-axis levels in four rotated long-axis planes, which constitutes an improvement compared to the conventional techniques. Also, the visualization of the selected points in both the long-axis and in multiple short-axis views allowed the operator to verify and correct their position prior to automated endocardial and epicardial surface detection.
Moreover, the results of this study confirmed our hypothesis that true 3D analysis provides higher accuracy in LV mass measurements (r=0.96) than the biplane calculation from anatomically correct apical views extracted from RT3DE data (r=0.90 (6)). Importantly, Bland-Altman analysis showed tighter limits of agreement (2SD=±23 g) with the MR reference compared to the latter technique (2SD=±34 g).[6] Compared to other previous studies, based on manual or semi-automated tracing of multiple 2D LV contours for computation of LV mass in humans,[19][30] our method resulted in similar or even higher correlations, with no significant underestimation of LV mass, and comparable interobserver variability.
The availability of an accurate, fast and easy-to-use quantification tool for LV mass computation from RT3DE images, without the need for time consuming and cumbersome volume reconstruction, may represent the initial steps for the utilization of this technique in clinical practice.
Although 3D echocardiography using a fully-sampled matrix array transducer is frequently referred to as a real-time technique, it requires separate acquisition of sub-
on 3 May 2019 by guest. P
rotected by copyright.http://heart.bm
j.com/
Heart: first published as 10.1136/hrt.2005.060889 on 12 M
ay 2005. Dow
nloaded from

9
volumes over eight consecutive beats. This may limit the applicability of this method in patients with severe dyspnea, atrial fibrillation and cardiac arrhythmias. Moreover, LV mass cannot be measured in patients with severely dilated hearts, which do not completely fit into the pyramidal scan volume. Further studies on patients with severe dilated cardiomiopathy, ventricular aneurysms or ventricles with heavy trabeculations need to be performed to better define the applicability of this technique to this population. However, these patients were excluded, since our goal was to test and validate the newly developed 3D analysis technique rather than establish the applicability of RT3DE imaging in a wide range of clinical scenarios.
Another limitation is the limited image quality which sometimes precludes the accurate delineation of endocardial and epicardial borders with RT3DE. The use of contrast enhancement could potentially solve this problem. However, the potential increased accuracy of LV measurements with contrast-enhanced RT3DE still has to be determined.
In summary, despite these limitations, this study indicates that our 3D analysis based on semi-automated detection of the LV endo- and epicardial surface applied to RT3DE images allows rapid and accurate measurements of LV mass, superior to the conventional 2DE measurements and 2D analysis techniques applied to RT3DE data.
on 3 May 2019 by guest. P
rotected by copyright.http://heart.bm
j.com/
Heart: first published as 10.1136/hrt.2005.060889 on 12 M
ay 2005. Dow
nloaded from

10
Support: The study was supported by: 1) The “Marco Polo” grant from University of Bologna, Italy (C. C.) 2) Grant-in-Aid from the American Heart Association (V. M.)
Figure legends Figure 1. LV endocardial surface initialization was performed in four 45°-rotated apical planes. After selecting the long axis of the left ventricle (vertical line), two points were manually selected in each plane at each of six different levels (from apex to base, white dots), (see text for details). Figure 2. Point verification/correction (A,B) and endocardial surface detection (C,D). The initialized points (A) are shown in each short-axis plane (B) for verification and correction if required. The endocardial surface (C) obtained by joining these points represents the initial condition for the 3D endocardial detection algorithm, which results in the calculated LV endocardial surface (D). Figure 3. LV epicardial surface initialization procedure shown in the format of figure 1. The cross-section of the detected endocardial surface was displayed to guide the selection of epicardial points (white dots, see text for details). Figure 4. Initial LV epicardial surface obtained by joining the selected points (left), and the final calculated LV epicardial surface (right) shown in semi-transparent green with the endocardial surface shown in yellow. Figure 5. Example of the detected LV endocardial and epicardial surfaces (left), and corresponding short-axis cross-sections from apex to base (right panels). This display allowed visual verification of the position of the calculated endocardial and epicardial surfaces in multiple planes. LV, left ventricle. Figure 6. Comparison between 2DE (left) and RT3DE (right) echocardiographic data with MR measurements of LV mass obtained in 19 subjects. Linear regression (top) and Bland-Altman (bottom) analyses: each dot represents the mean of the three observers. Horizontal dashed lines represent the 95% limits of agreement. 2DE, two-dimensional echocardiography; RT3DE, real-time three-dimensional echocardiography; MR, magnetic resonance; SD, standard deviation.
on 3 May 2019 by guest. P
rotected by copyright.http://heart.bm
j.com/
Heart: first published as 10.1136/hrt.2005.060889 on 12 M
ay 2005. Dow
nloaded from

11
References 1. Levy D, Garrison RJ, Kannel WB, et al. Prognostic implications of
echocardiographically determined left-ventricular mass in the Framingham Heart-Study - Reply. New Engl J Medicine 1990;323:1706-7.
2. Ghali JK, Liao Y, Simmons B, et al. The prognostic role of the left ventricular hypertrophy in patients with or without coronary artery disease. Ann Intern Med 1992;117:831-6.
3. Byrd BF, Wahr D, Wang YS, et al. Left ventricular mass and volume mass ratio determined by two-dimensional echocardiography in normal adults. J Am Coll Cardiol 1985;6:1021-5.
4. Wyatt HL, Heng MK, Meerbaum S, et al. Cross-sectional echocardiography. 1. Analysis of mathematic models for quantifying mass of the left ventricle in dogs. Circulation 1979;60:1104-13.
5. Schiller NB, Shah PM, Crawford M, et al. Recommendations for quantitation of the left ventricle by two-dimensional echocardiography. American Society of Echocardiography Committee on Standards, Subcommittee on Quantitation of Two-Dimensional Echocardiograms. J Am Soc Echocardiogr 1989;2:358-67.
6. Mor-Avi V, Sugeng L, Weinert L, et al. Fast measurement of left ventricular mass with real-time three-dimensional echocardiography. Comparison with magnetic resonance imaging. Circulation 2004;110:1814-18.
7. Sugeng L, Weinert L, Lang RM. Left ventricular assessment using real time three dimensional echocardiography. Heart 2003;89:29-36.
8. Sugeng L, Weinert L, Thiele K, et al. Real-time three-dimensional echocardiography using a novel matrix array transducer. Echocardiography 2003;20:623-35.
9. Osher S, Sethian JA. Fronts propagating with curvature-dependent speed. Algorithms based on Hamilton-Jacobi formulations. J Computational Physics 1988;79:12-49.
10. Malladi R, Sethian JA, Vemuri BC. Shape modelling with front propagation. A level set approach. IEEE Trans Pattern Analysis and Machine Intelligence 1995;17:158-75.
11. Corsi C, Saracino G, Sarti A, et al. Left ventricular volume estimation for real-time three-dimensional echocardiography. IEEE Trans Med Imaging 2002;21:1202-08.
12. Helak JW, Reichek N. Quantitation of human left ventricular mass and volume by two-dimensional echocardiography. In-vitro anatomic validation. Circulation 1981;63:1398-407.
on 3 May 2019 by guest. P
rotected by copyright.http://heart.bm
j.com/
Heart: first published as 10.1136/hrt.2005.060889 on 12 M
ay 2005. Dow
nloaded from
12
13. Devereux RB, Reichek N. Echocardiographic determination of left ventricular mass in man. Anatomic validation of method. Circulation 1977;55:613-8.
14. Myerson SG, Montgomery HE, et al. Left ventricular mass. Reliability of M-mode and 2-dimensional echocardiographic formulas. Hypertension 2002;40:673-8.
15. Missouris CG, Forbat SM, Singer DRJ, et al. Echocardiography overestimates left ventricular mass: A comparative study with magnetic resonance imaging in patients with hypertension. J Hypertension 1996;14:1005-10.
16. Kuhl HP, Bucker A, Franke A, et al. Transesophageal 3-dimensional echocardiography: in-vivo determination of left ventricular mass in comparison with magnetic resonance imaging. J Am Soc Echocardiogr 2000;13:205-15.
17. Kuhl HP, Hanrath P, Franke A. M-mode echocardiography overestimates left ventricular mass in patients with normal left ventricular shape: a comparative study using three-dimensional echocardiography. Eur J Echocardiogr 2003;4:312-9.
18. Teupe C, Takeuchi M, Yao JF, et al. Determination of left ventricular mass by three-dimensional echocardiography: in vitro validation of a novel quantification method using multiple equi-angular rotational planes for rapid measurements. Int J Cardiovascular Imaging 2002;18:161-7.
19. Gopal AS, Keller AM, Shen ZQ, et al. 3-Dimensional echocardiography. In-vitro and in-vivo validation of left ventricular mass and comparison with conventional echocardiographic methods. J Am Coll Cardiol 1994;24:504-13.
20. Sapin PM, Gopal AS, Clarke GB, et al. Three-dimensional echocardiography compared to two-dimensional echocardiography for measurement of left ventricular mass anatomic validation in an open chest canine model. Am J Hypertension 1996;9:467-74.
21. Leotta DF, Munt B, Bolson EL, et al. Quantitative three-dimensional echocardiography by rapid imaging from multiple transthoracic windows: in vitro validation and initial in vivo studies. J Am Soc Echocardiogr 1997;10:830-9.
22. Sapin PM, Schroder KM, Gopal AS, et al. Comparison of 2-dimensional and 3-dimensional echocardiography with cineventriculography for measurement of left-ventricular volume in patients. J Am Coll Cardiol 1994;24:1054-63.
23. Kuhl HP, Franke A, Merx M, et al. Quantification of left ventricular function and mass using transesophageal three-dimensional echocardiography: validation of a method that uses long-axis cutplanes. Eur J Echocardiogr 2000;1:213-21.
24. Kuhl HP, Franke A, Janssens U, et al. Three-dimensional echocardiographic determination of left ventricular volumes and function by multiplane transesophageal transducer: dynamic in vitro validation and in vivo comparison with angiography and thermodilution. J Am Soc Echocardiogr 1998;11:1113-24.
on 3 May 2019 by guest. P
rotected by copyright.http://heart.bm
j.com/
Heart: first published as 10.1136/hrt.2005.060889 on 12 M
ay 2005. Dow
nloaded from

13
25. Chuang ML, Beaudin RA, Riley MF, et al. Three-dimensional echocardiographic measurement of left ventricular mass: comparison with magnetic resonance imaging and two-dimensional echocardiographic determinations in man. Int J Cardiac Imaging 2000;16:347-57.
26. Gopal AS, Schnellbaecher MJ, Shen ZQ, et al. Freehand three-dimensional echocardiography for measurement of left ventricular mass: in vivo anatomic validation using explanted human hearts. J Am Coll Cardiol 1997;30:802-10.
27. Kuhl HP, Schreckenberg M, Rulands D, et al. High-resolution transthoracic real-time three-dimensional echocardiography. Quantitation of cardiac volumes and function using semi-automatic border detection and comparison with cardiac magnetic resonance imaging. J Am Coll Cardiol 2004;43:2083-90.
28. Qin JX, Jones M, Shiota T, et al. Validation of real-time three-dimensional echocardiography for quantifying left ventricular volumes in the presence of a left ventricular aneurysm: in vitro and in vivo studies. J Am Coll Cardiol 2000;36:900-7.
29. Qin JJ, Jones M, Shiota T, et al. New digital measurement method for left ventricular volume using real-time three-dimensional echocardiography: comparison with electromagnetic flow method and magnetic resonance imaging. Eur J Echocardiogr 2000;1:96-104.
30. Jenkins C, Bricknell K, Hanekom L, et al. Reproducibility and accuracy of echocardiographic measurements of left ventricular parameters using real-time three-dimensional echocardiography. J Am Coll Cardiol 2004;44:878-86.
31. Gerard O, Billon AC, Rouet JM, et al. Efficient model-based quantification of left ventricular function in 3-D echocardiography. IEEE Trans Med Imaging 2002;21:1059-68.
on 3 May 2019 by guest. P
rotected by copyright.http://heart.bm
j.com/
Heart: first published as 10.1136/hrt.2005.060889 on 12 M
ay 2005. Dow
nloaded from
on 3 May 2019 by guest. P
rotected by copyright.http://heart.bm
j.com/
Heart: first published as 10.1136/hrt.2005.060889 on 12 M
ay 2005. Dow
nloaded from
on 3 May 2019 by guest. P
rotected by copyright.http://heart.bm
j.com/
Heart: first published as 10.1136/hrt.2005.060889 on 12 M
ay 2005. Dow
nloaded from
on 3 May 2019 by guest. P
rotected by copyright.http://heart.bm
j.com/
Heart: first published as 10.1136/hrt.2005.060889 on 12 M
ay 2005. Dow
nloaded from
on 3 May 2019 by guest. P
rotected by copyright.http://heart.bm
j.com/
Heart: first published as 10.1136/hrt.2005.060889 on 12 M
ay 2005. Dow
nloaded from
on 3 May 2019 by guest. P
rotected by copyright.http://heart.bm
j.com/
Heart: first published as 10.1136/hrt.2005.060889 on 12 M
ay 2005. Dow
nloaded from

on 3 May 2019 by guest. P
rotected by copyright.http://heart.bm
j.com/
Heart: first published as 10.1136/hrt.2005.060889 on 12 M
ay 2005. Dow
nloaded from