improved physically based approaches for channel erosion
TRANSCRIPT

Improved physically based approaches for Channel Erosion Modeling in SWAT
Balaji Narasimhan, P. M. Allen, J. G. Arnold, and R. Srinivasan
Outline
Channel ErosionSediment Routing
In SWAT2000 and SWAT2005
Physically based approachErosionTransportationDeposition
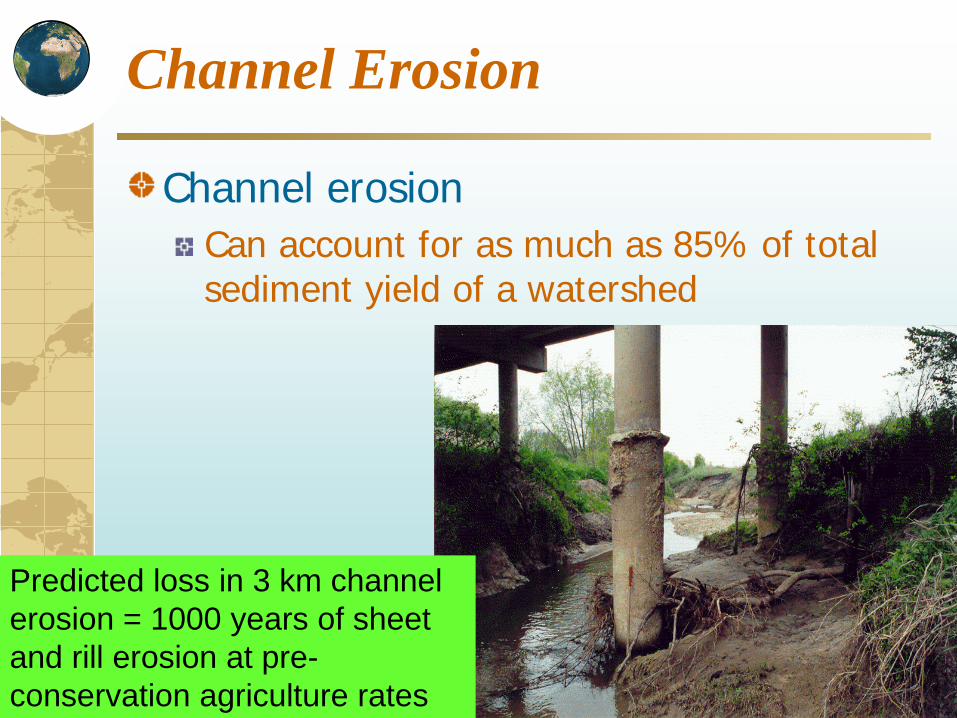
Channel Erosion
Channel erosionCan account for as much as 85% of total sediment yield of a watershed
Predicted loss in 3 km channel erosion = 1000 years of sheet and rill erosion at pre-conservation agriculture rates
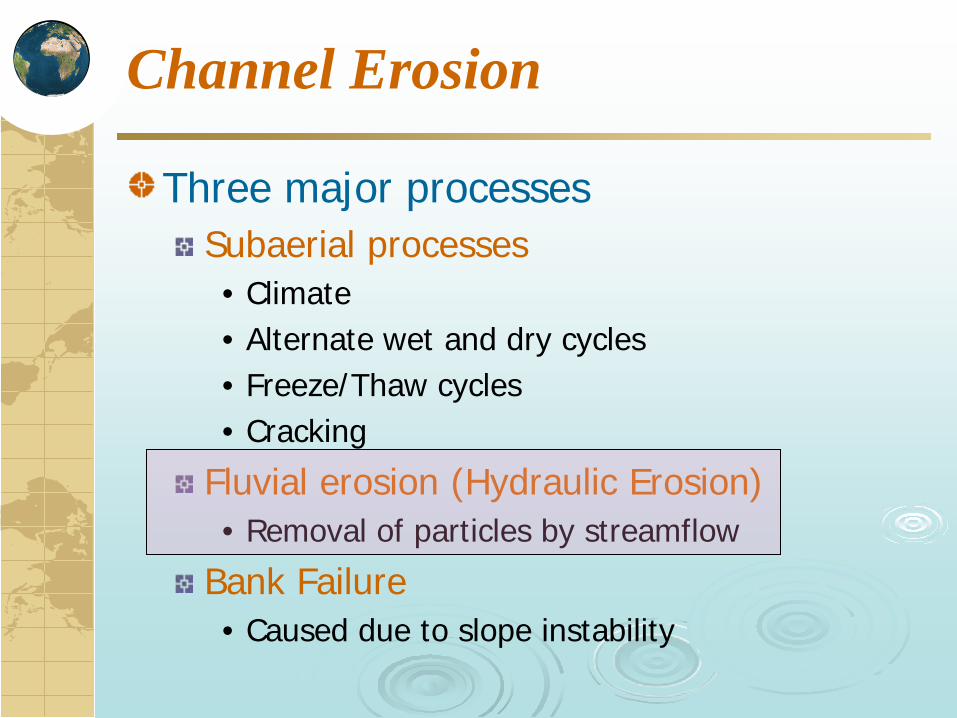
Channel Erosion
Three major processesSubaerial processes• Climate • Alternate wet and dry cycles• Freeze/Thaw cycles• Cracking
Fluvial erosion (Hydraulic Erosion)• Removal of particles by streamflow
Bank Failure• Caused due to slope instability

SWAT2000 and 2005
Simplified Bagnold stream power equation
Channel erosionlimited only by the stream power or transport capacity but not by limits on sediment supply from the actual erosion process
exp,
spchmxsed vspconconc ×=
chchchchsedmxsed CKVconcconcsed )( ,,deg −=

SWAT2000 and 2005
No particle size distribution of eroded sediment
No bedload• Hence, TSS calculated from sediment yield is
often high and not directly comparable with observations

Organic nutrient load
Are we missing to quantify a significant organic nutrient load from stream bank and attributing the nutrient loads only to overland?
Cedar Creek, Texas• 8% of orgN and • 15% of orgP from channel erosion• Channel erosion – 35% of total sediment yield
Hence, accurate quantification of channel erosion is very important
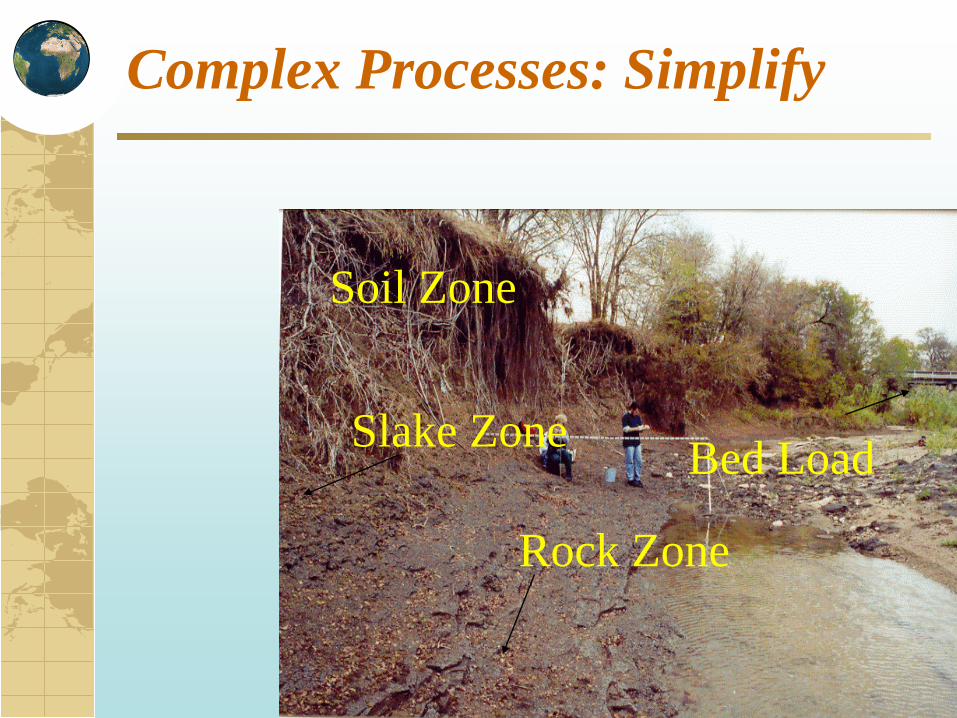
Rock Zone
Slake Zone
Soil Zone
Bed Load
Complex Processes: Simplify

Fluvial Erosion Process
For the erosion to occurThere should be enough shear stress exerted by the flowing water on stream bank and stream bed to dislodge the sedimentsThe channel should have enough stream power to carry the eroded sediments (overland+channel)Deposition will occur if the sediment transport capacity is low

Wash-load particle size distribution
Sediment yield from overland (MUSLE) is partitioned using the approach used in CREAMS

Shear Stress
Critical shear stress (τc)Soil parameter that governs erosion
Excess shear stress equation:
where ξ – erosion rates of the bank and bed (m/s), kd – erodibility coefficient of bank and bed (cm3/N-s) and τc – Critical shear stress acting on bank and bed (N/m2).
6,,, 10)( −⋅−⋅= bankcbankebankdbank k ττξ
6,,, 10)( −⋅−⋅= bedcbedebeddbed k ττξ

Shear Stress
Effective shear stress based on channel hydraulics: (Eaton and Millar, 2004)
⋅
⋅+=
⋅⋅ depthPWSF
slpdepthbedbank
ch
banke
4sin)(
100, θ
γτ
+
⋅
−=
⋅⋅5.0
21001,
bed
bank
chw
bede
PWSF
slpdepthγτ
247.25.1log4026.1log +
+⋅−=
bank
bedbank P
PSF
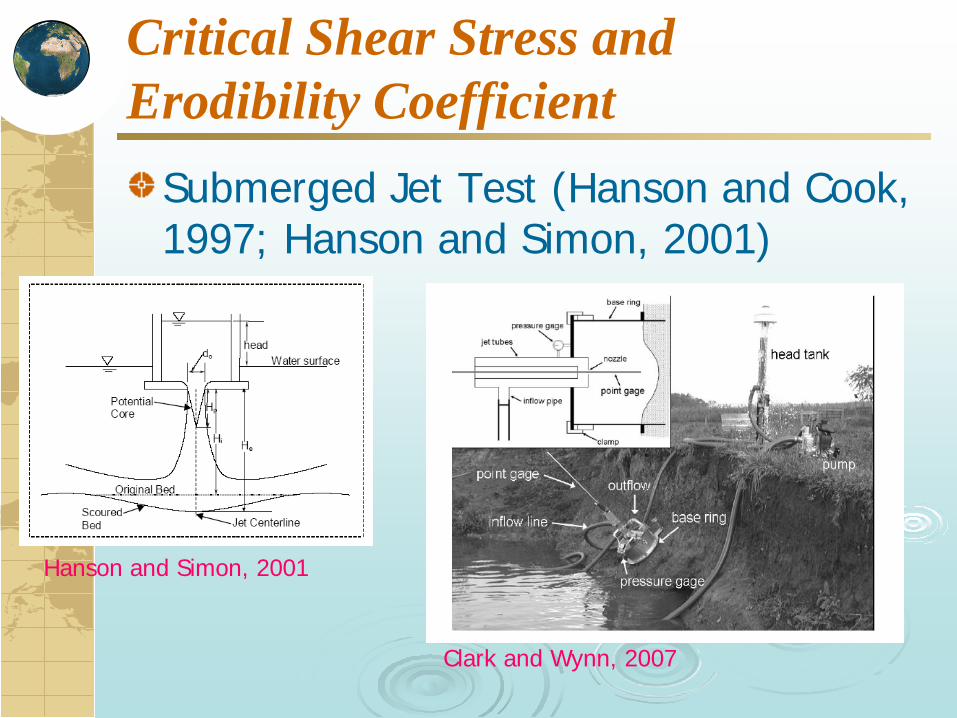
Critical Shear Stress and Erodibility Coefficient
Submerged Jet Test (Hanson and Cook, 1997; Hanson and Simon, 2001)
Clark and Wynn, 2007
Hanson and Simon, 2001

Empirical Equation for τc
Julian and Torres, 2001
Range mostly between:0 and 100 N/m2
But could go asHigh as 400 N/m2

Empirical Equation for Kd
Erodibility Coefficient, Kd: (Zhu et al. 2006)
( )
91.0
3
5.050
%)(14.4)1(8.9)1(
0176.0exp0034.0
−⋅=
⋅−⋅⋅−
=
⋅=
ClayCCsDsM
MK
e
ed
Where s is relative density of sediment
Range mostly between 0 and 0.01 cm3/N-s but could go As high as 3.75 cm3/N-s for highly erodible material

Stream Power/Transport Capacity
Four new transport equationsSimplified Bagnold Equation• Silt type bed material
Kodatie model• Silt to gravel size bed materials
Molinas and Wu model• Large sand bed rivers
Yangs sand and gravel model• Sand and gravel bed material
exp,
spchmxsed vspconconc ×=

Kodatie Model
Kodatie (2000)
+⋅
⋅⋅⋅=
2.,btm
in
dcbch
mxchsedWW
QSya
concν
a, b, c and d coefficients depend on D50

Molinas and Wu Model
Molinas and Wu (2001):
( ) 65.1
10016.086.01430 −⋅
+⋅+⋅
=ψ
ψψwC
2
501050
3
log)1(
⋅⋅⋅⋅−
=
DdepthdepthgS
v
g
ch
ω
ψ
3600411 2
5050
D⋅=ω
ggww
wmxchsed S
SCCC
conc ⋅⋅−+
=)1(.,

Yangs Sand and Gravel Model
Sand equation: (D50 less than 2mm):
Gravel equation: (D50 between 2mm and 10mm)
−
−−+
−−=
505050
*5050
50
*5050
loglog314.0log409.0799.1
log457.0log286.0435.5log
ωων
ωυω
ωυω
SVSVD
VDC
crch
w
−
−−+
−−=
505050
*5050
50
*5050
loglog282.0log305.0784.2
log816.4log633.0681.6log
ωων
ωυω
ωυω
SVSVD
VDC
crch
w

Excess transport capacity
Upper limit of channel erosion is the transport capacity or the erosion due to excess shear stress whichever is lower
( )ichsedmxchsedch concconcVSedEx .,., −⋅=

Deposition
If the sediment concentration in the channel is more than the transport capacity then deposition occurs:Einstein equation (1965):
Flood plain depositionIf the streamflow goes overbank
depthvLx
eDep
ch
ch
xfract
⋅⋅⋅
=
−=
50055.1
11
ω3600
411 250
50D⋅
=ω

Cedar Creek Watershed
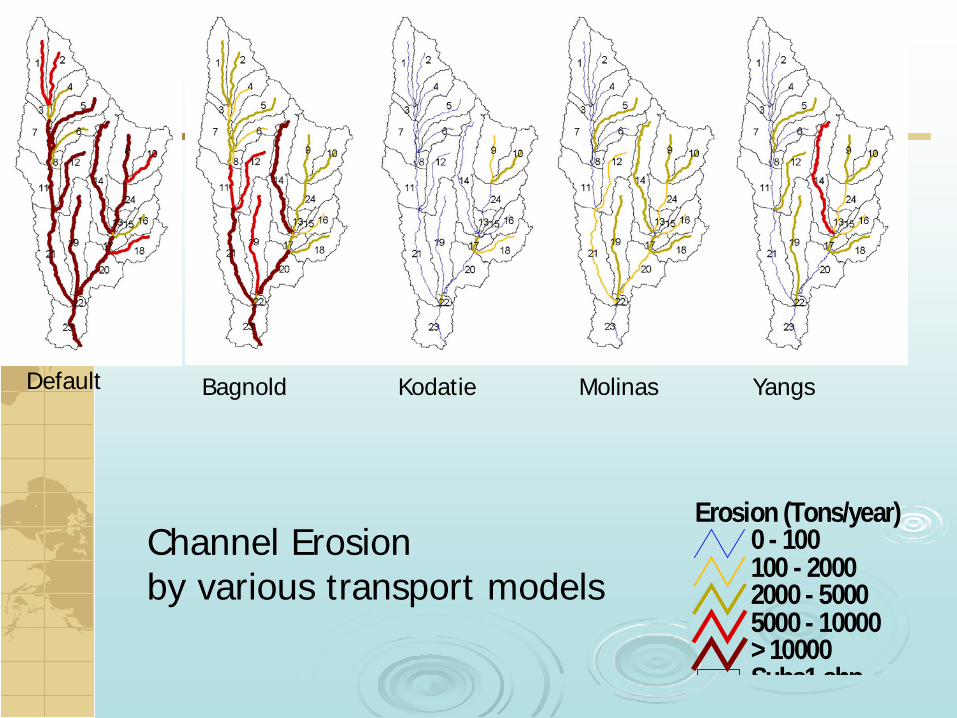
Subs1 shp
Erosion (Tons/year)0 - 100100 - 20002000 - 50005000 - 10000> 10000
Default Bagnold Kodatie Molinas Yangs
Channel Erosion by various transport models

S b 1 h
Deposition (Tons/year)0 - 100100 - 20002000 - 50005000 - 10000> 10000
Default Bagnold Kodatie Molinas Yangs
Channel Deposition by various transport models

Channel Erosion
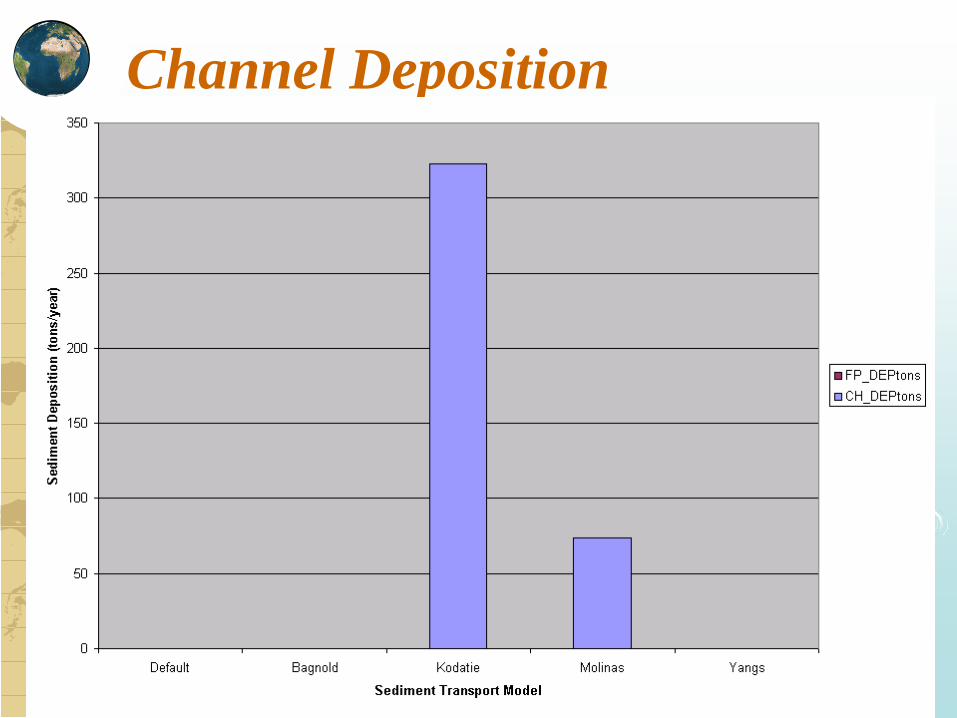
Channel Deposition

Total Suspended Sediments

Model Inputs
Default modelspcon, spext, CH_cov, CH_Erod
Physically based modelsD50 – Median particle size of bank and bed materialCritical shear stress of bank and bedCover factor of bank and bedErodibility coefficient of bank and bedBulk density of bank and bedParticle size distribution of bank and bed material

Model Output
File name: output.sedDefault
Total sedimentBed erosion, deposition, TSS
Physically based modelsTotal sediment
• Sand, silt, clay, SAGG, LAGG, gravelBank erosionBed erosionChannel depositionFlood plain depositionTSS

Thank You