improved middle atmosphere climate and forecasts in the ... · meteorological training course...
TRANSCRIPT

Meteorological Training Course Lecture Series 1
Improved middle atmosphere climate and forecasts in the ECMWF model through a non-orographic gravity wave drag parametrization April 2010
Andrew Orr*, Peter Bechtold, John Scinocca1, Manfred Ern2
and Marta Janiskova
ECMWF, Shinfield Park, Reading, England 1Canadian Centre for Climate Modelling and Analysis,
University of Victoria, Canada 2Forschungszentrum Jülich, Germany
* Current affiliation: British Antarctic Survey, Cambridge, UK
Table of Contents
ABSTRACT ............................................................................................................................................ 2
1 Introduction ................................................................................................................................ 3
2 The S03 gravity wave scheme .................................................................................................... 5
2.1 Launch spectrum and conservative propagation ..................................................................... 5
2.2 Critical level filtering and nonlinear dissipation ..................................................................... 6
2.3 Momentum conservation ......................................................................................................... 7
3 Climate experiments, parameter settings, and validating data ................................................... 8
3.1 Climate experiments ............................................................................................................... 8
3.2 Parameter settings ................................................................................................................... 8
3.3 Validating data ........................................................................................................................ 8
4 The extratropical temperature structure and circulation ............................................................ 9
4.1 January .................................................................................................................................... 9
4.2 July ........................................................................................................................................ 12

Improved middle atmosphere climate and forecasts in the ECMWF model …
2 Meteorological Training Course Lecture Series
5 Planetary waves ........................................................................................................................ 14
5.1 January .................................................................................................................................. 16
5.2 July ........................................................................................................................................ 16
6 Tropical oscillations ................................................................................................................. 17
7 Parametrized and resolved momentum flux ............................................................................. 19
8 High resolution middle atmosphere forecast error and analysis .............................................. 21
9 Summary and discussion .......................................................................................................... 25
References ............................................................................................................................................. 27
ABSTRACT
In model cycle 35r3 (Cy35r3) of the ECMWF Integrated Forecast System (IFS) the momentum deposition from small-scale non-orographic gravity waves is parametrized by the Scinocca (2003) scheme which uses hydrostatic non-rotational wave dynamics to describe the vertical evolution of a broad, constant, isotropic spectrum of gravity waves emanating from the troposphere. The Cy35r3 middle atmosphere climate shows: i) an improved representation of the zonal-mean circulation and temperature structure, ii) realistic parametrized gravity wave drag, iii) reasonable stationary planetary wave structure and stationary wave driving in July, and an underestimate of the generation of stationary wave activity in the troposphere and stationary wave driving in January, iv) improved representation of the tropical variability of the stratospheric circulation, although the westerly phase of the semi-annual oscillation is missing, and v) realistic horizontal distribution of momentum flux in the stratosphere. By contrast, the middle atmosphere climate is much too close to radiative equilibrium when the Scinocca scheme is replaced by Rayleigh friction, which was the standard method of parametrizing the effects of non-orographic gravity waves in the IFS prior to Cy35r3. Finally, there is a reduction in Cy35r3 short-range high resolution forecast error in the upper stratosphere.

Improved middle atmosphere climate and forecasts in the ECMWF model …
Meteorological Training Course Lecture Series 3
1 Introduction The middle atmosphere is dominated by a westerly jet in the winter hemisphere and an easterly jet in the summer hemisphere, and a meridional circulation comprising of upwelling in the tropics and downwelling over the winter pole, referred to as the Brewer-Dobson circulation (Brewer, 1949). The Brewer-Dobson circulation is a mechanically driven circulation arising from mid-latitude wintertime wave drag in the stratosphere associated primarily with the dissipation of planetary-scale Rossby waves but also from the dissipation of gravity waves. Vertically propagating small-scale non-orographic gravity waves are particularly important in driving the summer hemisphere branch of the Brewer-Dobson circulation (Alexander and Rosenlof, 2003) as Rossby waves are unable to propagate vertically between the westerly winds of the troposphere and the easterly winds of the stratosphere. In the mesosphere and lower thermosphere the dominant contribution to the momentum balance is from the breaking or dissipation of non-orographic gravity waves, resulting in drag which generally decelerates the jets and generates a Coriolis torque which modulates the meridional circulation by inducing additional summer pole to winter pole drift and ascent/descent over the summer/winter poles (e.g. Holton, 1982, 1983; Garcia and Solomon, 1985). This, through adiabatic expansion/compression, influences the temperature structure down to the lower stratosphere in the polar regions (Garcia and Boville, 1994). Studies such as Dunkerton (1997) and Ray et al. (1998) have shown that non-orographic gravity wave forcing is also important in driving the interannual variability of the tropical stratospheric circulation, most noticeably the quasi-biennial oscillation (QBO) and the semi-annual oscillation (SAO).
Non-orographic gravity waves are forced by dynamical motions such as convection, frontogenesis, and jet stream activity (e.g. Fritts and Nastrom, 1992; Jiang et al., 2005; Lane et al., 2008) and have vertical wavelengths, , which vary from less than 1 km to many tens of km and horizontal
wavelengths, , which vary from tens to thousands of km (e.g. Gardner et al., 1989; Ern et al.,
2004), and are thus generally unresolved or under-resolved (as the mechanisms which generate them are themselves often poorly represented) by general circulation models (GCMs) (Hamilton et al., 1995, 1999). In GCMs, therefore, planetary-scale wave activity and its dissipation are resolved by the dynamics of the model, whereas smaller-scale processes such as unresolved non-orographic gravity wave drag (GWD) need to be parametrized.
zλ
lλ
Orographic gravity waves have a similar range of vertical and horizontal wavelengths to that of non-orographic waves (e.g. Whiteway and Duck, 1999), and are thus also often poorly resolved by GCMs. Such waves are forced by flow travelling over mountains and so have zero horizontal phase speed. They have an important impact on the climatological winds and temperatures of the middle atmosphere (e.g. Scinocca et al., 2008), for example by decelerating the northern hemisphere wintertime upper troposphere/lower stratosphere flow (Palmer et al., 1986). However, orographic gravity waves are not the focus of this study as their parametrization is well established in the ECMWF model, which uses the scheme of Lott and Miller (1997). Hereafter the term ‘gravity waves’ refers to non-orographic gravity waves and the term ‘GWD’ refers to non-orographic GWD.
Garcia and Boville (1994) showed that, in the absence of GWD parametrization, sinking at the southern winter polar stratopause was reduced by a factor of two, resulting in middle atmosphere temperatures too close to radiative equilibrium, notably with unrealistically cold winter polar stratosphere temperatures. Such biases are particularly exacerbated in the southern winter due to weak planetary wave forcing. Hamilton et al. (1995, 1999) showed that the size of the cold bias (in the

Improved middle atmosphere climate and forecasts in the ECMWF model …
4 Meteorological Training Course Lecture Series
absence of parametrized GWD) was extremely sensitive to horizontal resolution (i.e. the fraction of the gravity wave spectrum explicitly resolved), demonstrating a southern winter cold bias of ~70 K with ~300 km grid spacing, ~35 K with ~100 km grid spacing, and ~10 K with ~35 km grid spacing. The lack of convergence at ~100 km grid spacing suggests that simulations performed at climate resolution require the parametrization of drag from ‘missing’ gravity waves, i.e. those which are not resolved. By contrast, the sensitivity of the cold bias to vertical resolution was shown to be limited.
To capture the QBO and the SAO requires a wave spectrum of: i) planetary-scale (resolved) equatorial waves (such as eastward propagating Kelvin waves and westward propagating Rossby-gravity waves), ii) intermediate-scale (resolved) gravity waves, and iii) small-scale (parametrized) gravity waves. The primary source of the resolved waves is parametrized deep convection in the tropics (e.g. Giorgetta et al., 2002). Lindzen and Holton (1968) showed how gravity waves break near critical levels (i.e. when the ground based phase speed of a wave approaches the background wind speed) in the lower stratosphere, contributing as much as 3/4 of the vertical flux of horizontal momentum required to drive the descent of the alternating eastward and westward shear zones of the QBO (Dunkerton, 1997). Waves which are unfiltered by the QBO continue to propagate upwards and can break near critical levels of the SAO. Meyer (1970) showed that SAO easterlies are primarily due to advection of easterly winds across the equator by the Brewer-Dobson circulation (and as a result are largely uniform in the vertical with little tilt), while Sato and Dunkerton (1997) and Ray et al. (1998) showed that SAO westerlies are primarily driven by gravity waves (and therefore descend with time, leading to a tilt). A failure to capture the tropical variability is a well known problem associated with the absence of GWD parametrization (e.g. Manzini et al., 1997; Scaife et al., 2002).
Observationally, the middle atmosphere vertical wavenumber, , spectrum of horizontal wind variance is continuous and roughly proportional to m-t, with the constant t = 3 (Smith et al., 1987) and (i.e. large-m), where is a transitional wavenumber estimated by Fritts and
VanZandt (1993) to correspond to ~ 2 km near the tropopause and ~16 km near the mesopause. Physically, due to the decrease of ambient air density with height, as gravity waves propagate vertically their amplitude increases and eventually becomes unstable (Smith et al., 1987), resulting in their nonlinear breakdown and turbulent dissipation (hereafter referred to as nonlinear dissipation). It is argued that the shape of the wave spectrum is consistent with this ‘saturation’ theory (e.g. Dewan and Good, 1986), but this remains an open question (Hines, 1991). By contrast, gravity wave variations in both space and time are observed in the troposphere, where the gravity waves generally originate, and are frequently modelled as a spectrum of horizontal winds proportional to ms, with the constant s = 1 (Allen and Vincent, 1995) and (i.e. small-m).
zm λπ /2=
*mm > *m
m
zλ
*m<
Recently, physically based GWD parametrizations have been developed which launch either a discrete or continuous spectrum of upwardly propagating gravity waves (hereafter referred to as the launch spectrum) towards the middle atmosphere, consisting largely of waves which are not resolved [e.g. Medvedev and Klaassen (1995), Hines (1997a, b), Alexander and Dunkerton (1999), Warner and McIntyre (1996, 2001), Scinocca (2002, 2003)]. Since the wide space and time variations of the tropospheric source of non-orographic waves are poorly constrained by observations, a simplified launch spectrum that is independent of time and geographic location is typically employed to represent the global and temporal average of gravity wave activity forced by the troposphere. This simplifies the problem so that only the vertical propagation of the wave field and its eventual dissipation and resulting drag are parametrized. The scheme of Scinocca (2003) - hereafter called S03
Improved middle atmosphere climate and forecasts in the ECMWF model …
Meteorological Training Course Lecture Series 5
- was implemented in model cycle 35r3 (which became operational on 8 September 2009) of the European Centre for Medium-Range Weather Forecasts (ECMWF) Integrated Forecast System (IFS). Prior to this the effect of the missing GWD was parametrized in the simplest possible manner by Rayleigh friction above the stratopause, which is formulated as a drag force proportional to the mean zonal flow and which uses a damping coefficient which increases with height.
This paper assesses the resulting middle atmosphere climatology and middle atmosphere short-range high resolution forecast errors of model cycle 35r3. The S03 parametrization is described in section 2. The experimental setup and the observations used for validation are described in section 3. The mean circulation and temperature structure are described in section 4. The propagation and driving of the mean zonal flow by stationary planetary waves is described in section 5. The representation of the QBO and SAO is described in section 6. An analysis of the parametrized and resolved horizontal distributions of momentum flux is described in section 7. Short-range high resolution forecast errors and analysis are described in section 8. The sensitivity of the zonal flow and momentum flux to horizontal resolution is described in section 9. A summary and discussion are presented in section 10.
2 The S03 gravity wave scheme S03 follows from the Warner and McIntyre (1996) scheme in which a framework is developed using conservative propagation of gravity waves, critical level filtering, and non-linear dissipation. The full non-hydrostatic and rotational wave dynamics considered by Warner and McIntyre (1996) are too expensive to implement in an operational model (e.g. Scinocca, 2002). Therefore, operational schemes, such as S03, generally employ hydrostatic non-rotational wave dynamics which allow an efficient implementation that is suitably fast for operational use.
2.1 Launch spectrum and conservative propagation
The dispersion relation for an individual hydrostatic gravity wave in the absence of rotation is
2 2 2
22
k N Nmc
= =ω% %2
)
(1)
where is the intrinsic phase speed of the gravity wave (with c the ground based phase speed and U the background wind speed in the direction of propagation), N is the buoyancy frequency, is the horizontal wavenumber, and is the intrinsic frequency
(with the ground based frequency).
Ucc −=~
(k π2=
ωlλ/ kU−= ωω~
Following Scinocca (2002), the globally uniform and constant launch spectrum is based on the total wave energy per unit mass in each azimuth, , the spectral density of which is assumed to be of the generalised Desaubies form (Fritts and VanZandt, 1993)
ϕ
2
( , , )
1
s r
s t
m NE m Bm m
m
−
+∗
∗
⎛ ⎞= ⎜ ⎟
⎛ ⎞⎝ ⎠− ⎜ ⎟⎝ ⎠
%% %ωω φ (2)
where B and r are constants and is a function of . Observations and theory suggest that the value of r lies between approximately 1 and 2 (e.g. Gage and Nastrom, 1985; Hertzog et al., 2002; Warner and McIntyre, 1996). However, to reduce the computational cost of S03 the value of r in (2) is
E~ ),~,( ϕωm
Improved middle atmosphere climate and forecasts in the ECMWF model …
6 Meteorological Training Course Lecture Series
restricted to integer and half-integer values (1 or 3/2). Following Scinocca (2002), is
expressed in terms of the momentum flux . The coordinate framework is used in
place of as k and are conserved quantities and thus is conserved in the absence of dissipative processes as the spectrum propagates vertically through height-varying background wind and buoyancy frequency. Furthermore, use of the simplified wave dynamics (1) allows to be expressed as a function only of the independent variable c. Following Scinocca (2003) and taking t = 3 the new expression for the momentum flux is expressed as
),~,(~ ϕωmE),ω),,( ϕωρ kF (k
)~,( ωm
,,( ωρ kF
ω ),,( ϕωρ kF
)ϕ
2
1
1
r
m cN
−
∗ −+
)
)(ϕU
3)( )
s
c U c UN c U
+
⎛ ⎞− −= ⎜ ⎟
⎛ ⎞⎝ ⎠⎜ ⎟⎝ ⎠
) )) )
) )( ,)ρ φ
(0UU −
)
F c)
)(ϕU=
Aρ
c)
(3)
where and , with the velocity in the direction of the azimuth
and the subscript ‘0’ referring to the launch level, and is density. The constant A comprises all terms which are independent of height, and is given by
)ϕ )(0ϕUc −= ϕ
ρ
2 2
r−−
n
3m∗
ϕ
c)
0
2
r rN f− −
)
)
)
A B=
)
(4)
where f is the Coriolis parameter. A is a fundamental tuneable parameter in the scheme. It sets the total amount of horizontal momentum transported vertically by the waves in each azimuth.
,(ρ cF ) is discretized using azimuths equally spaced around the azimuth circle (i.e. the source
spectrum is azimuthally isotropic) and n is the number of spectral elements used to discretize the
range of horizontal phase speeds c . In order to make the most efficient use of spectral resolution, a ‘coordinate stretch’ on is applied to reduce the value of (see Scinocca, 2003) and increase the
resolution at large (i.e. small-m), which is the portion of the wave spectrum which is most crucial for GWD in the mesosphere. is the minimum number of spectral elements that can be used without
altering the parametrized GWD and the response of the model.
ϕn
c
c
c cn ˆ
2.2 Critical level filtering and nonlinear dissipation
The dissipative mechanisms applied to the wave field in each azimuthal direction and on each model level are critical level filtering and nonlinear dissipation. Waves that encounter critical levels are filtered from the wave spectrum, depositing their momentum to the mean flow in this layer. For example, as waves propagate vertically through stratospheric winter westerlies that increase with height, more and more of the westerly phase-speed waves will be lost to critical level filtering while the easterly phase-speed waves remain unaffected. As a result the spectrum becomes asymmetric with progressively more net easterly momentum, leading to strong easterly forcing at mesospheric altitudes (Garcia and Solomon, 1994). Similar, but oppositely signed, critical-level filtering occurs for stratospheric summer easterlies.
Nonlinear dissipation is simply modelled by assuming the waves are dissipative in nature and employing ‘saturation’ theory (Lindzen, 1981; Dewan and Good, 1986), such that the amplitude of the parametrized wave field is limited to some threshold value (thought to be associated with the onset of

Improved middle atmosphere climate and forecasts in the ECMWF model …
Meteorological Training Course Lecture Series 7
instability). This is dealt with empirically by limiting the growth of the gravity wave spectrum at large-m so as not to exceed the observed m-3 dependence. The application of saturation to a vertically propagating wave field restricts the amplitude of the wave to neutral stability above its breaking level, implying a loss of momentum from the wave field to the mean flow causing the flow to accelerate towards the horizontal phase speed of the dissipating wave. This is achieved by specifying a saturation upper bound on the value of the wave energy density (2) at each level, which in space is
ω−m ~
3
2( , , )sat rmE m C B Nm
−
∗
∗
⎛ ⎞= ⎜ ⎟
⎝ ⎠% %ω φ ω−%
)
(5)
where is a constant introduced by McLandress and Scinocca (2005). Following Scinocca (2003), this can be expressed in terms of momentum flux as a function of c
∗C
2
( , )r
sat c U c UF c C AN c
−
∗ ⎛ ⎞− −= ⎜ ⎟
⎝ ⎠
) )) )) ))ρ φ ρ (6)
),( ϕρ cF sat ))
(ρ cF ))
decreases in amplitude with height as a consequence of decreasing density, i.e. it is not
conserved. Nonlinear dissipation is implemented by enforcing the constraint
When , is set equal to and the excess momentum
flux removed from is deposited to the flow. This procedure is repeated on all layers and for
all azimuths. Increasing implies that the saturation bounds (5) and (6) start at larger amplitude and so the nonlinear dissipation constraints onset at higher altitude, increasing the height at which momentum is deposited (McLandress and Scinocca, 2005).
),(),( ϕρϕρ cFcF sat )) ≤))
) ) )),(), ϕρϕ cF sat )>
),( ϕρ cF ))
(>∗C
),( ϕρ cF )
)1
),( ϕρ cF sat )
After application of the dissipative mechanisms the resulting momentum flux profiles are used to
derive the net eastward, EFρ , and northward, NFρ , momentum flux. Defining u and as the zonal
and meridional wind components respectively, the resulting forcing terms or wind tendencies in each of these directions are given by
v
( ) ( ) ( ),,, E N
u v
F Fu vF F g
t p∂∂
= =∂ ∂
ρ ρ (7)
where are the GWD tendencies (or accelerations) in the zonal and meridional directions, g is
the gravitational acceleration, t is time, and p is pressure. vu FF ,
2.3 Momentum conservation
At the model top momentum conservation is achieved by depositing any remaining momentum from the wave field to the mean flow. Shepherd and Shaw (2004) and Shaw and Shepherd (2007) suggest that, if momentum is not conserved, there is a non-negligible spurious downward influence in response to GWD feedbacks to planetary wave or radiative perturbations. They also suggest that, by enforcing momentum conservation, the principal of ‘downward control’ implies that it is not necessary to explicitly simulate the region in which GWD occurs in order to represent the effects of that drag on regions below, reducing the sensitivity to model top height (Haynes et al., 1991). This is

Improved middle atmosphere climate and forecasts in the ECMWF model …
8 Meteorological Training Course Lecture Series
convenient as the IFS does not extend into the thermosphere, a region where significant momentum flux is still carried by gravity waves.
3 Climate experiments, parameter settings, and validating data
3.1 Climate experiments
Two simulations are performed, one with model cycle 35r3 (hereafter called Cy35r3) and another with model cycle 35r3, but with Rayleigh friction replacing S03 (hereafter called Cy35r3RF), i.e. we evaluate the performance of the operational scheme as well as identify the impact made by the introduction of the S03 scheme. The resolution of the simulations is T159 (which corresponds to a grid-spacing of ~125 km) and 91 vertical levels (which corresponds to a model top located at 0.01 hPa) with an approximate vertical resolution of ~1 km in the stratosphere and ~3 km in the mesosphere. Both simulations comprise six 13 month integrations covering the years 1994 to 1999 (beginning on November 1 of the preceding year), with each forced at the lower boundary by observed sea-surface temperatures. Monthly mean results are computed from fields that have been accumulated each model time step (which is 3600 s). These are used to evaluate a 6-year mean model climate.
3.2 Parameter settings
The S03 scheme requires a number of free parameters to be specified. Two central parameters that are typically used to tune the response are the total horizontal momentum flux launched into each azimuth (3) and the elevation of the launch level. In the Cy35r3 simulation the launch momentum flux is 3.75 mPa in each azimuth from an elevation of 450 hPa (i.e. the upper troposphere). The remaining required parameters are set to typical values of , m-1, (with cardinal
directions of N, S, E, W), , and . Sensitivity experiments determined that is
sufficient for the scheme to produce the self-consistent GWD. To further reduce the cost in the T159 simulations the S03 scheme is called every second model time step (i.e. every 7200 s), but with the updated GWD tendencies applied at every model time step, so that the scheme contributes less than 3% to the total Cy35r3 run time.
1=s 2000/2π=∗m 4=ϕn
1=r 1=∗C 20ˆ =cn
3.3 Validating data
The simulated results are compared to observations comprising SPARC (Stratospheric Processes And their Role in Climate) climatology (Randel et al., 2004) and ERA-Interim (the latest ECMWF reanalysis, hereafter called ERAI). The SPARC climatology provides a dataset up to a height of 0.01 hPa from sources such as reanalysis, satellite measurements, rocketsonde wind and temperature data, and lidar temperature measurements. As there are relatively few measurements over the polar regions the climatology is effectively valid only for latitudes ranging from 80oN to 80oS, with values at higher latitudes interpolated. ERAI uses a 12 hour 4D-VAR T255 horizontal resolution (grid-spacing of ~60 km) and 60 vertical levels (model top of 0.1 hPa) assimilating model based on model cycle 31r1 of the IFS.

Improved middle atmosphere climate and forecasts in the ECMWF model …
Meteorological Training Course Lecture Series 9
4 The extratropical temperature structure and circulation
4.1 January
Figure 1 shows the zonal-mean temperature (K) and zonal wind (m s-1) climatologies for the Cy35r3 and Cy35r3RF for January, and the corresponding SPARC climatology. Cy35r3 shows a realistic cold southern summer polar upper mesosphere (~170 K) and a (overly) warm northern winter polar stratosphere (~230 K), which suggest that the meridional circulation is reasonably reproduced. The representation of the stratopause is generally realistic, although there is a failure to capture the warm (separated) northern winter polar stratopause. Cy35r3 further shows generally realistic southern summer easterlies and northern winter westerlies, although for both jets the peak wind speeds occur at slightly too low an altitude and are slightly overestimated, with their respective poleward and equatorward vertical inclinations underestimated. Cy35r3RF reveals a 20 K warm bias at the southern summer polar upper mesopause, consistent with the atmosphere being too close to radiative equilibrium, i.e. the drag supplied by Rayleigh friction is insufficient and the meridional circulation is weak. However, there is no associated northern winter polar stratosphere cold bias, suggesting that the model’s radiative, orographic GWD, or resolved contributions are compensating and might themselves be biased. Cy35r3RF also shows a warm northern winter stratopause bias of ~10 K and no separated northern winter polar stratopause. The weak representation of both the westerly and easterly jets is explained by the use of Rayleigh friction formulated in terms of a damping coefficient that increases with height (and which therefore strongly damps upper level winds). The westerly jet also lacks equatorward inclination and the easterly jet has its core near the stratopause instead of near the mesopause.
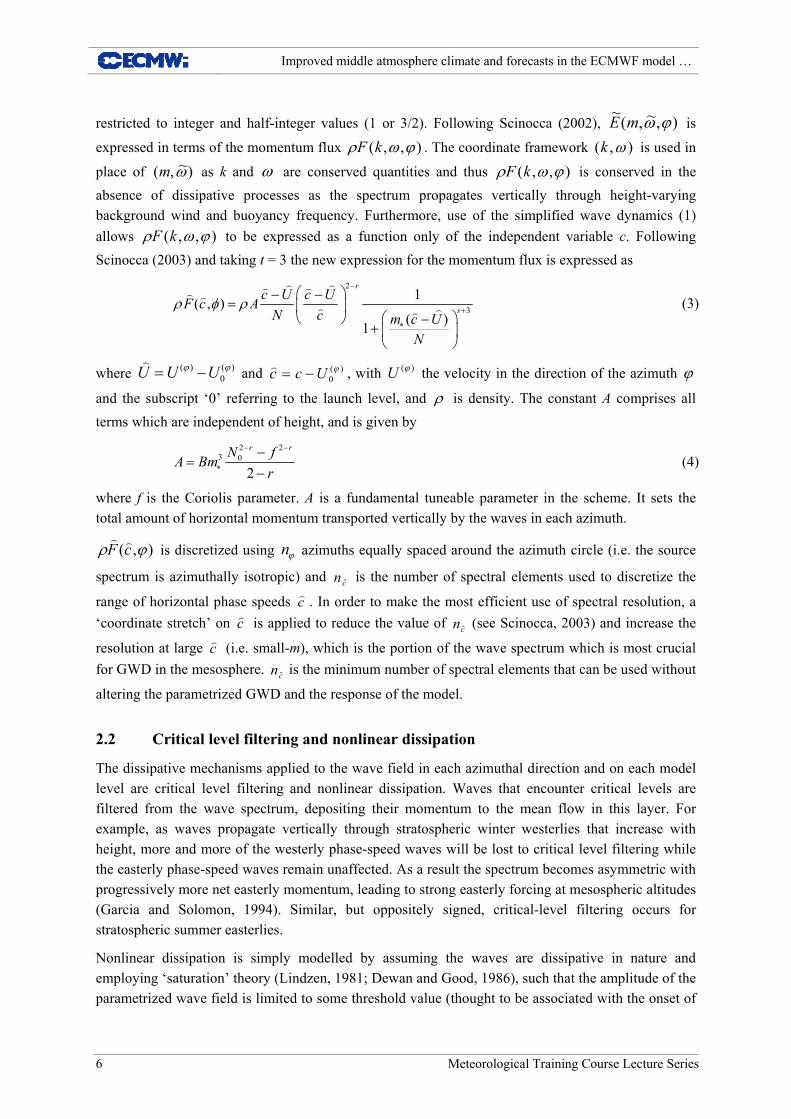
The horizontal distribution of the westerly jet is illustrated in Figure 2 at the 1 hPa level (i.e. the upper stratosphere) for January (left column). ERAI data are compared to the Cy35r3 and Cy35r3RF climatologies. ERAI shows a jet with a maximum zonal velocity of 80-100 m s-1 over the North Atlantic but which is strongly disrupted over the Pacific with velocities <10 m s-1 in this region. The structure of the jet is reasonably reproduced by Cy35r3, which captures the local maximum but overestimates the minimum by around 20 m s-1. With Cy35r3RF the jet minimum is well represented but the maximum over the North Atlantic is underestimated by ~20 m s-1.

Improved middle atmosphere climate and forecasts in the ECMWF model …
10 Meteorological Training Course Lecture Series
Figure 1: Average January cross-sections of zonal-mean temperature (K) and zonal wind (ms-1) for SPARC observations (a, b), Cy35r3 (c, d), and Cy35r3RF (e, f). Simulation results are 6-year averages at resolution T159 and 91 vertical levels. SPARC data north and south of 80oN and 80oS respectively is constant and interpolated. Easterly winds are denoted by dashed contours.
Improved middle atmosphere climate and forecasts in the ECMWF model …
Meteorological Training Course Lecture Series 11
Figure 2: Average northern (left, January) and southern (right, July) winter zonal wind (m s-1) at 1 hPa for ERAI (a, b), Cy35r3 (c, d), and Cy35r3RF (e, f). Simulation results are 6 year averages at resolution T159 and 91 vertical levels. Easterly winds are denoted by dashed contours.
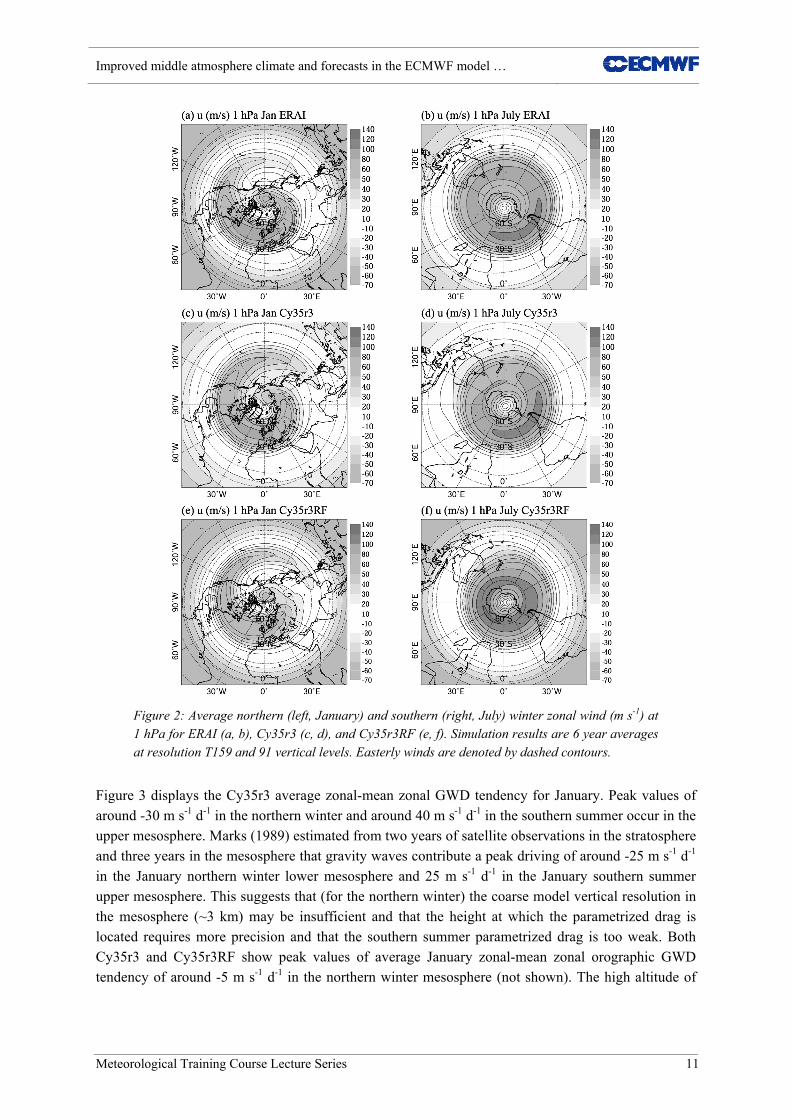
Figure 3 displays the Cy35r3 average zonal-mean zonal GWD tendency for January. Peak values of around -30 m s-1 d-1 in the northern winter and around 40 m s-1 d-1 in the southern summer occur in the upper mesosphere. Marks (1989) estimated from two years of satellite observations in the stratosphere and three years in the mesosphere that gravity waves contribute a peak driving of around -25 m s-1 d-1 in the January northern winter lower mesosphere and 25 m s-1 d-1 in the January southern summer upper mesosphere. This suggests that (for the northern winter) the coarse model vertical resolution in the mesosphere (~3 km) may be insufficient and that the height at which the parametrized drag is located requires more precision and that the southern summer parametrized drag is too weak. Both Cy35r3 and Cy35r3RF show peak values of average January zonal-mean zonal orographic GWD tendency of around -5 m s-1 d-1 in the northern winter mesosphere (not shown). The high altitude of
Improved middle atmosphere climate and forecasts in the ECMWF model …
12 Meteorological Training Course Lecture Series
this drag is perhaps surprising as orographic gravity waves are typically limited to the troposphere and stratosphere (Eckermann and Preusse, 1999).
Figure 3: Average January cross-section of Cy35r3 zonal-mean zonal GWD tendency (m s-1 d-1). Simulation results are 6 year averages at resolution T159 and 91 vertical levels. Easterly accelerations are denoted by dashed contours.
4.2 July
Figure 4 is analogous to Figure 1, but for July. Cy35r3 is characterised by a realistic temperature structure, in particular a cold northern summer polar upper mesosphere (~170 K) and a warm southern winter polar stratosphere (~190 K), consistent with a realistic meridional circulation being driven by the inclusion of strong GWD. The stratopause temperature is reasonably simulated in the northern summer hemisphere, while in the southern winter hemisphere the stratopause is correctly closed, but characterized by a warm bias of ~10 K. Cy35r3 also shows a good representation of both the easterly and westerly jets which are now ‘closed off’ in the mesosphere with peak velocity, core height, and vertical inclination all captured. Cy35r3RF shows a warm bias of ~20 K at the northern summer polar upper mesosphere and a cold bias of ~10 K at the southern winter polar stratosphere, again consistent with unrealistically weak forcing of the mean flow and insufficient meridional circulation. Furthermore, the southern winter westerly jet is much too strong with a poleward rather than an equatorward inclination, while the northern summer easterly jet is too weak and its core is near the stratopause instead of the upper mesosphere.
The horizontal distribution of the July westerly jet at 1 hPa is illustrated in Figure 2 (right column). The jet is reasonably reproduced by Cy35r3, which shows the local jet maxima over the South Atlantic but with overly weak winds in the Australian sector of the Southern Ocean and over Australia itself. With Cy35r3RF the localised region of maximum winds at the jets core erroneously extends around the whole of Antarctica.

Improved middle atmosphere climate and forecasts in the ECMWF model …
Meteorological Training Course Lecture Series 13
Figure 4: As Figure 1, but for July.
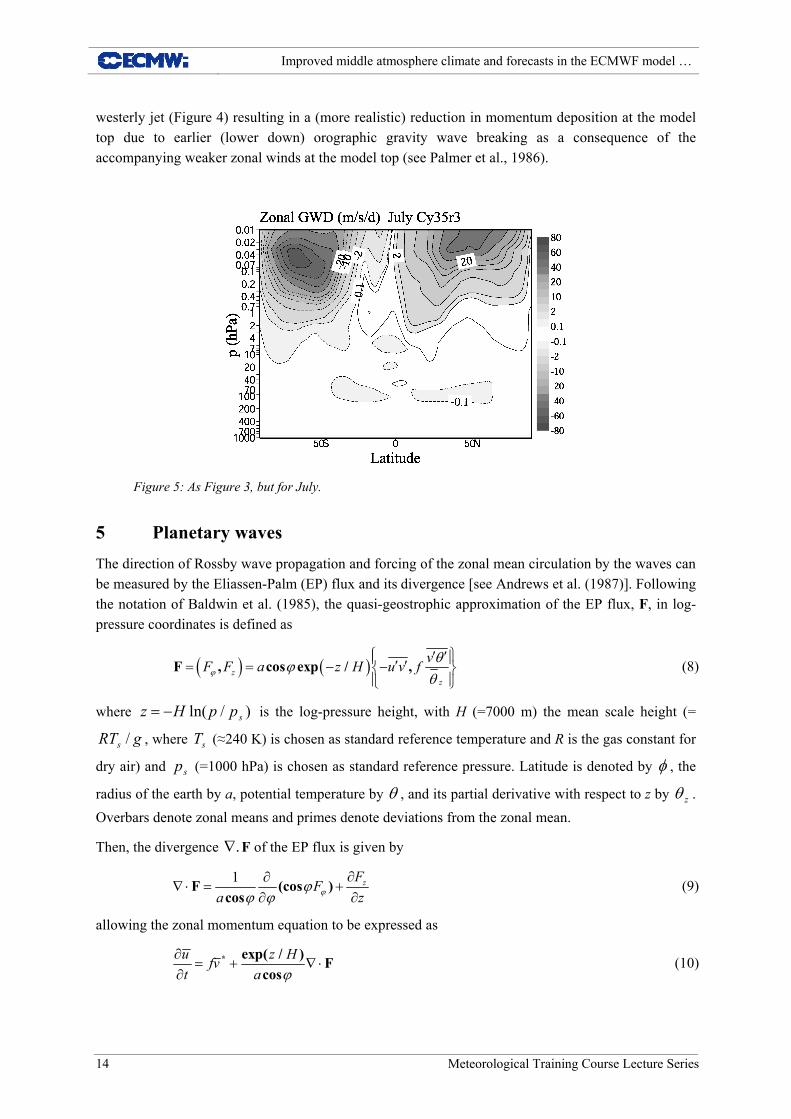
Figure 5 is analogous to Figure 3, but for July. Peak values of around -60 m s-1 d-1 in the southern winter and 40 m s-1 d-1 in the northern summer occur in the upper mesosphere. Marks (1989) estimated that in the July mid to upper-mesosphere that gravity waves contribute a peak driving of around -55 m s-1 d-1 in the southern winter and around 15 m s-1 d-1 in the northern summer. These observations are consistent with those of Pulido and Thuburn (2006) who used variational data assimilation principles to estimate GWD from MetOffice global middle atmosphere analyses. This suggests that the magnitude of the parametrized drag is realistic in the winter hemisphere but overestimated in the summer hemisphere, and that the altitude of the parametrized drag is excessively high. These biases are similar to those found in January. Cy35r3 and Cy35r3RF show peak values of average July zonal-mean zonal orographic GWD tendency of around -2 m s-1 d-1 in the southern winter mesosphere (not shown). However, in the upper mesosphere the Cy35r3 values are a factor of 2 or more smaller than those of Cy35r3RF, consistent with the improved closure of the Cy35r3 winter
Improved middle atmosphere climate and forecasts in the ECMWF model …
14 Meteorological Training Course Lecture Series
westerly jet (Figure 4) resulting in a (more realistic) reduction in momentum deposition at the model top due to earlier (lower down) orographic gravity wave breaking as a consequence of the accompanying weaker zonal winds at the model top (see Palmer et al., 1986).
Figure 5: As Figure 3, but for July.
5 Planetary waves The direction of Rossby wave propagation and forcing of the zonal mean circulation by the waves can be measured by the Eliassen-Palm (EP) flux and its divergence [see Andrews et al. (1987)]. Following the notation of Baldwin et al. (1985), the quasi-geostrophic approximation of the EP flux, F, in log-pressure coordinates is defined as
( ) ( )zz
vF F a z H u v f⎧ ⎫′ ′⎪ ′ ′= = − −⎨⎪ ⎪⎩ ⎭
F , cos exp / ,ϕθϕθ
⎪⎬ (8)
where is the log-pressure height, with H (=7000 m) the mean scale height (=
, where (≈240 K) is chosen as standard reference temperature and R is the gas constant for
dry air) and (=1000 hPa) is chosen as standard reference pressure. Latitude is denoted by , the
radius of the earth by a, potential temperature by , and its partial derivative with respect to z by . Overbars denote zonal means and primes denote deviations from the zonal mean.
)/ln( sppHz −=
g sT
sp
RTs /
φ
θ zθ
Then, the divergence F of the EP flux is given by .∇
1 zFFa z
∂∂∇ ⋅ = +
∂ ∂F (cos )
cos ϕϕϕ ϕ
(9)
allowing the zonal momentum equation to be expressed as
u z Hfvt a
∂= + ∇ ⋅
∂* exp( / ) F
cosϕ (10)

Improved middle atmosphere climate and forecasts in the ECMWF model …
Meteorological Training Course Lecture Series 15
where v * is the residual mean meridional circulation. Only stationary wave EP fluxes and their associated divergence are computed, meaning that the fields
and are monthly means.
Transient waves which include variations on time scales of less than one month are not considered. Randel (1988) points out that the stationary component of planetary waves is weaker than the transient component in southern winter. Figures 6 and 7 show average January and July cross-sections of F and the acceleration term
vu, θ
),( zFFφ
Fz HD
a=
exp( / ) Fcosϕ
∇ ⋅ (11)
which is the second term on the right-hand-side of (10) and is the wave driving of the mean zonal wind. The Cy35r3 and Cy35r3RF simulations are compared to ERAI. F decreases exponentially with height due to the factor. Following Baldwin et al. (1985) the arrows representing F in
Figures 6 and 7 are therefore scaled by so that the flux may be more easily seen in the
middle atmosphere.
)/exp( Hz−)/exp( Hz
Figure 6: Average January cross-sections of EP flux vector F (m3 s-2; ×4.0e6) and wave driving DF (shading; m s-1 d-1) associated with stationary planetary waves for ERAI (a), Cy35r3 (b), and Cy35r3RF (c). Simulation results are 6 year averages at resolution T159 and 91 vertical levels. ERAI data extends to 0.1 hPa. F is additionally scaled by
so that the arrows may be
more easily seen in the middle atmosphere (see text). Regions of easterly accelerations are denoted by dashed contours.
)/exp( Hz
Improved middle atmosphere climate and forecasts in the ECMWF model …
16 Meteorological Training Course Lecture Series
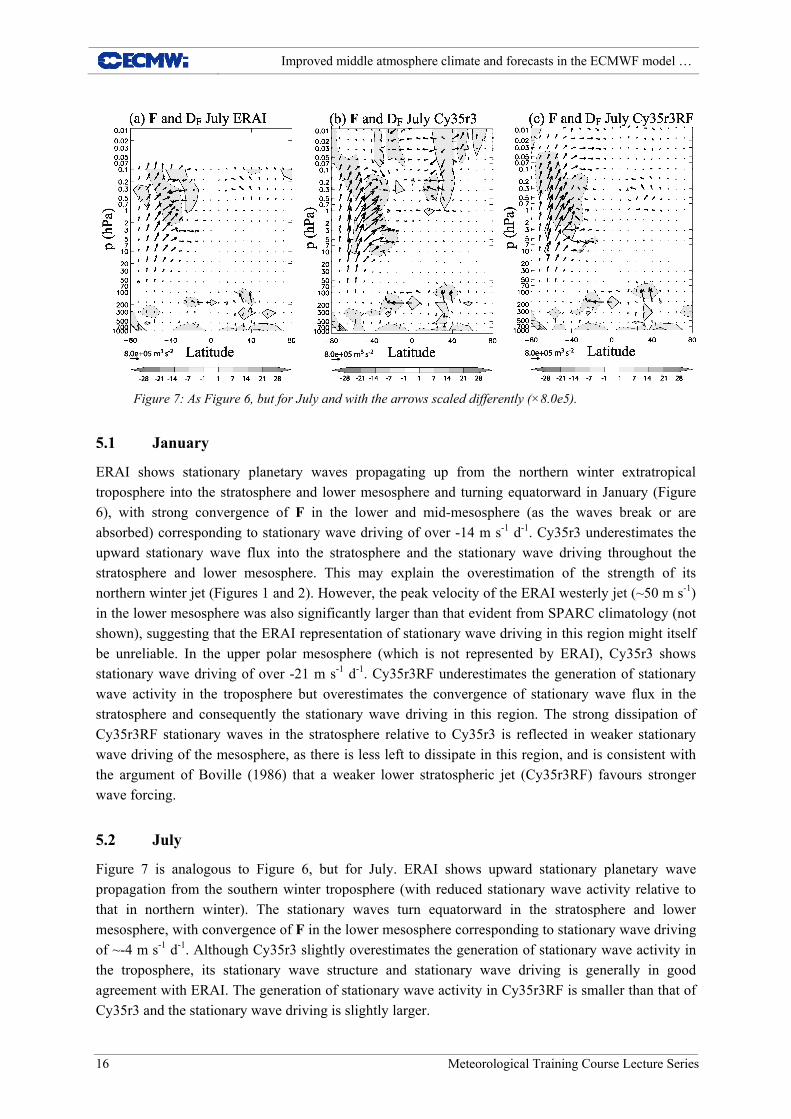
Figure 7: As Figure 6, but for July and with the arrows scaled differently (×8.0e5).
5.1 January
ERAI shows stationary planetary waves propagating up from the northern winter extratropical troposphere into the stratosphere and lower mesosphere and turning equatorward in January (Figure 6), with strong convergence of F in the lower and mid-mesosphere (as the waves break or are absorbed) corresponding to stationary wave driving of over -14 m s-1 d-1. Cy35r3 underestimates the upward stationary wave flux into the stratosphere and the stationary wave driving throughout the stratosphere and lower mesosphere. This may explain the overestimation of the strength of its northern winter jet (Figures 1 and 2). However, the peak velocity of the ERAI westerly jet (~50 m s-1) in the lower mesosphere was also significantly larger than that evident from SPARC climatology (not shown), suggesting that the ERAI representation of stationary wave driving in this region might itself be unreliable. In the upper polar mesosphere (which is not represented by ERAI), Cy35r3 shows stationary wave driving of over -21 m s-1 d-1. Cy35r3RF underestimates the generation of stationary wave activity in the troposphere but overestimates the convergence of stationary wave flux in the stratosphere and consequently the stationary wave driving in this region. The strong dissipation of Cy35r3RF stationary waves in the stratosphere relative to Cy35r3 is reflected in weaker stationary wave driving of the mesosphere, as there is less left to dissipate in this region, and is consistent with the argument of Boville (1986) that a weaker lower stratospheric jet (Cy35r3RF) favours stronger wave forcing.
5.2 July
Figure 7 is analogous to Figure 6, but for July. ERAI shows upward stationary planetary wave propagation from the southern winter troposphere (with reduced stationary wave activity relative to that in northern winter). The stationary waves turn equatorward in the stratosphere and lower mesosphere, with convergence of F in the lower mesosphere corresponding to stationary wave driving of ~-4 m s-1 d-1. Although Cy35r3 slightly overestimates the generation of stationary wave activity in the troposphere, its stationary wave structure and stationary wave driving is generally in good agreement with ERAI. The generation of stationary wave activity in Cy35r3RF is smaller than that of Cy35r3 and the stationary wave driving is slightly larger.

Improved middle atmosphere climate and forecasts in the ECMWF model …
Meteorological Training Course Lecture Series 17
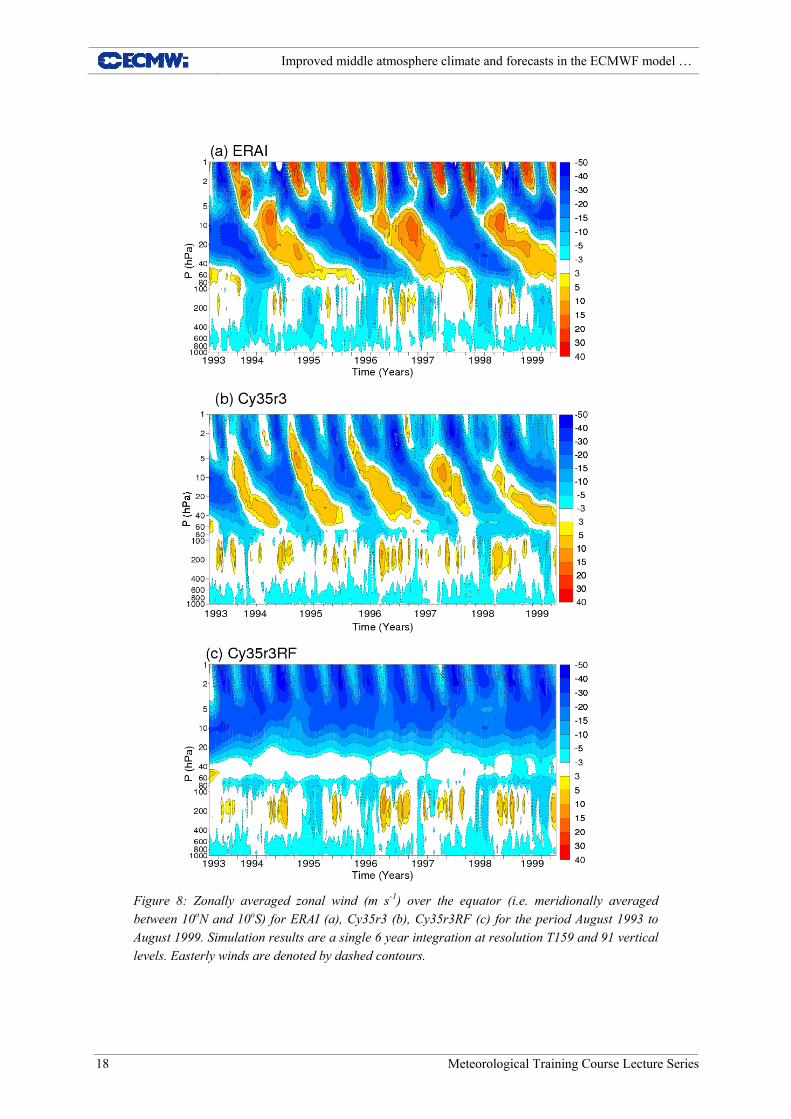
6 Tropical oscillations Further Cy35r3 and Cy35r3RF simulations at resolution T159 and 91 vertical levels comprising single 6 year integrations (to allow the low frequency QBO and SAO to develop fully) were performed (beginning 1 August 1993). The launch momentum flux is 3.75 mPa in each azimuth from a launch level of 450 hPa. Figure 8 compares simulated zonally averaged zonal winds over the equator for the 6-year period with ERAI. ERAI shows QBO westerly and easterly components, with a period of around 2 years, descending to the lower stratosphere and tropopause region (60-100 hPa), with the easterly phase (20-30 m s-1) stronger than the westerly phase (10-15 m s-1), with a longer duration and reaching a lower altitude. This is simulated relatively well by Cy35r3, which shows realistic amplitudes and minimum altitudes, although the period of these oscillations is about 1.2 years and therefore significantly shorter than observed. The period of the Cy35r3 QBO is sensitive to the amount of parametrized momentum flux near the equator (e.g. Scinocca et al., 2008), with a short period suggesting that 3.75 mPa in each azimuth is excessive, despite being low compared to observations (Sato and Dunkerton, 1987). Indeed, sensitivity tests showed that reducing the launch momentum flux had the effect of increasing the period (not shown). The period is also sensitive to other factors such as the rate of tropical upwelling (Dunkerton, 1997), with a short period consistent with the model upwelling being excessively weak (not shown). As expected, the observed SAO is characterised by a higher frequency oscillation of westerly and easterly shear zones, with the easterly phase uniform in the vertical and the westerly phase descending with time. The easterly component of this is largely captured by Cy35r3, which shows realistic amplitudes and periods. However, the westerly component is missing, suggesting that the eastward tropical wave momentum might be somewhat too weak. This will be investigated in the future.
Other studies such as Manzini et al. (1997), Scaife et al. (2000, 2002), and Scinocca et al. (2008) similarly showed an improvement in the representation of tropical variability via the implementation of a physically realistic GWD scheme. By contrast, Cy35r3RF shows a strong easterly bias, a failure to capture the descent of the easterly QBO component, and an overestimate of the frequency and amplitude of the easterly SAO component. This failure to capture the tropical variability is a well known problem associated with the use of Rayleigh friction (e.g. Manzini et al., 1997; Scaife et al., 2002).
Improved middle atmosphere climate and forecasts in the ECMWF model …
18 Meteorological Training Course Lecture Series
Figure 8: Zonally averaged zonal wind (m s-1) over the equator (i.e. meridionally averaged between 10oN and 10oS) for ERAI (a), Cy35r3 (b), Cy35r3RF (c) for the period August 1993 to August 1999. Simulation results are a single 6 year integration at resolution T159 and 91 vertical levels. Easterly winds are denoted by dashed contours.

Improved middle atmosphere climate and forecasts in the ECMWF model …
Meteorological Training Course Lecture Series 19
7 Parametrized and resolved momentum flux Ern et al. (2004, 2006) determined the amplitude and the horizontal and vertical wavelengths of stratospheric gravity waves from temperature data obtained by the Cryogenic Infrared Spectrometers and Telescopes for the Atmosphere (CRISTA) for November 1994 (CRISTA-1) and 8-14 August 1997 (CRISTA-2), allowing a direct calculation of the absolute value of gravity wave momentum flux. Average CRISTA-2 absolute values of gravity wave momentum flux for the period 8-14 August 1997 at altitudes of 25, 35, and 45 km are compared in Figure 9 to Cy35r3 absolute values of the S03 momentum flux,
(computed by adding the squares of the momentum flux in the 4 cardinal
directions and then taking the square root), and absolute values of the total modelled momentum flux, , at the nearest equivalent pressure levels of 20, 10, and 1 hPa.
is the
absolute value of the parametrized Lott and Miller (1997) orographic momentum flux (as CRISTA-2 values contain both non-orographic and orographic sources). However, the orographic gravity wave momentum flux would be expected to be small in the northern hemisphere stratosphere during the CRISTA-2 mission as there is a wind reversal in the entire northern hemisphere at about 20 km altitude (see Figure 2(b) of Ern et al., 2006) which would filter out orographic gravity waves.
03Sτ
resτ+ )( 03 LMStot τττ += LMτ
( )2vτ2
res resu res= +τ τ is the absolute value of the resolved momentum flux, with
( ) ( )[ ]nguguresu /∑−= ωωτ and ( ) ( )[ ngvgvresv /∑−= ωωτ ] the values in the zonal and
meridional directions respectively. is the summation over n time steps and is now defined as
the vertical velocity (Pa s-1). ∑ ω
Due to data processing and limb geometry, CRISTA-2 only observes gravity waves with horizontal wavelengths between about 100 and 5000 km and vertical wavelengths between about 6 and 30 km, and thus may underestimate the total gravity wave momentum flux (see Preusse et al. 2002). Therefore, as the Cy35r3 momentum flux values have not been adjusted (i.e. filtered) to only represent contributions from the limited range of wavelengths visible to CRISTA-2, any comparison is best suited to examine the relative horizontal distribution of momentum flux, rather than the magnitude. For low model launch levels Ern et al. (2005) showed good agreement between the distribution of CRISTA-2 momentum flux and both filtered and unfiltered values computed by the Warner and McIntyre (2001) scheme, suggesting that unfiltered model fluxes can be validated in this fashion. The Cy35r3 momentum fluxes shown in Figure 9 are an average for August 1997 (based on an ensemble of three 1 month T159 integrations with 91 vertical levels beginning 31 July, 1 August, and 2 August 1997), resulting in a smoother field for comparison with CRISTA-2 compared to that of the shorter (noisier) 8-14 August period. The launch momentum flux was again 3.75 mPa in each azimuth and the launch height was 450 hPa.
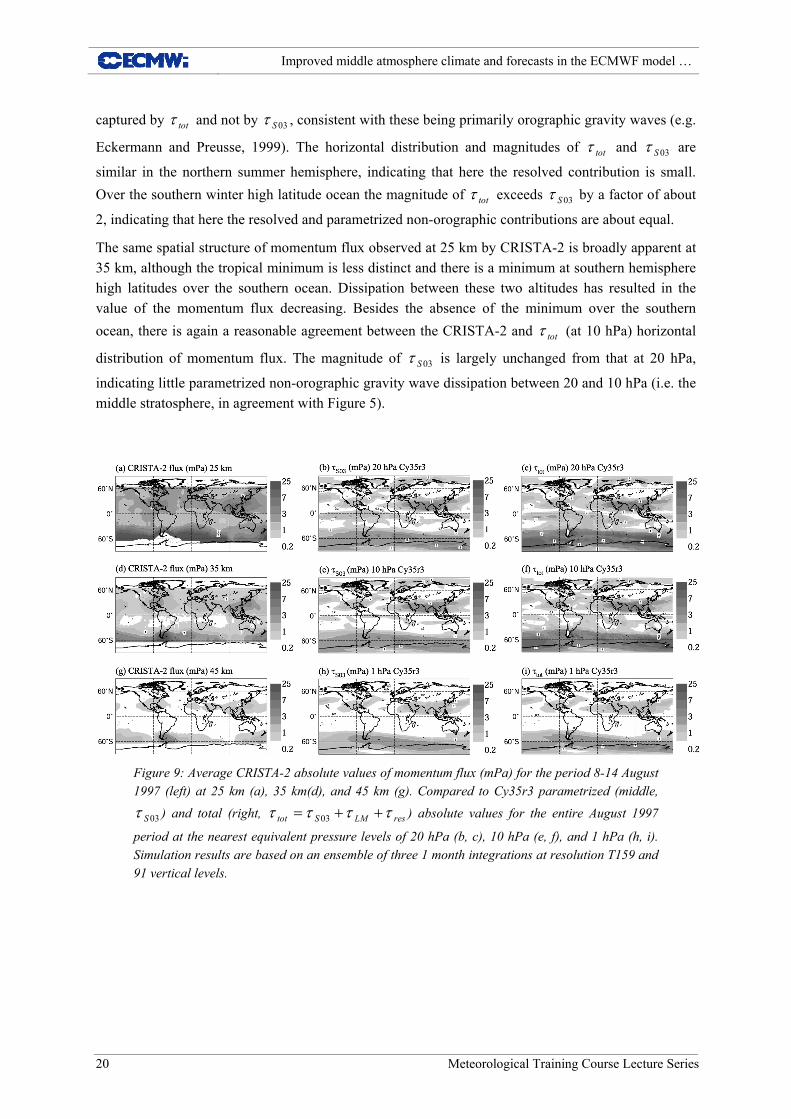
At an altitude of 25 km the CRISTA-2 momentum flux shows: i) a tropical minimum, ii) localised sub-tropical source regions (the Gulf of Mexico and east of China), iii) a maximum at southern hemisphere high latitudes (a region of strong synoptic westerlies and storm track activity), and iv) a strong localised region over the Antarctic Peninsula and southern Andes mountain ranges. Besides the absence of the tropical minimum and an underestimation of the extent of the Gulf of Mexico source region, there is a reasonable agreement between the CRISTA-2 and (at 20 hPa) horizontal
distribution of momentum flux. The maximum over the southern Andes and the Antarctic Peninsula is totτ
Improved middle atmosphere climate and forecasts in the ECMWF model …
20 Meteorological Training Course Lecture Series
captured by and not by , consistent with these being primarily orographic gravity waves (e.g.
Eckermann and Preusse, 1999). The horizontal distribution and magnitudes of and are
similar in the northern summer hemisphere, indicating that here the resolved contribution is small. Over the southern winter high latitude ocean the magnitude of exceeds by a factor of about
2, indicating that here the resolved and parametrized non-orographic contributions are about equal.
totτ 03Sτ
totτ
totτ 03Sτ
totτ 03Sτ
totτ
The same spatial structure of momentum flux observed at 25 km by CRISTA-2 is broadly apparent at 35 km, although the tropical minimum is less distinct and there is a minimum at southern hemisphere high latitudes over the southern ocean. Dissipation between these two altitudes has resulted in the value of the momentum flux decreasing. Besides the absence of the minimum over the southern ocean, there is again a reasonable agreement between the CRISTA-2 and (at 10 hPa) horizontal
distribution of momentum flux. The magnitude of is largely unchanged from that at 20 hPa,
indicating little parametrized non-orographic gravity wave dissipation between 20 and 10 hPa (i.e. the middle stratosphere, in agreement with Figure 5).
03Sτ
Figure 9: Average CRISTA-2 absolute values of momentum flux (mPa) for the period 8-14 August 1997 (left) at 25 km (a), 35 km(d), and 45 km (g). Compared to Cy35r3 parametrized (middle,
) and total (right,
) absolute values for the entire August 1997
period at the nearest equivalent pressure levels of 20 hPa (b, c), 10 hPa (e, f), and 1 hPa (h, i). Simulation results are based on an ensemble of three 1 month integrations at resolution T159 and 91 vertical levels.
03Sτ resLMS τττ ++= 03
Improved middle atmosphere climate and forecasts in the ECMWF model …
Meteorological Training Course Lecture Series 21
With the exception of the observed minimum over the southern ocean not being captured, there is an excellent agreement between the CRISTA-2 momentum flux distribution at an altitude of 45 km and that of (at 1 hPa). At this altitude (the upper stratosphere) the horizontal distribution and
magnitudes of and are mostly similar, indicating that the resolved and parametrized
orographic gravity wave contributions are small. The exception to this is over the southern Andes and the Antarctic Peninsula where there is a maximum in which is not apparent in , which again
suggests that this is from parametrized orographic gravity waves and that they are able to reach the upper stratosphere (Eckermann and Preusse, 1999).
totτ
totτ 03Sτ
totτ 03Sτ
Ern et al. (2006) similarly showed that the agreement between the horizontal distribution of CRISTA and modelled momentum fluxes are strongly dependent on the launch altitude, and they suggested that the choice of a (relatively) low altitude for the gravity wave launch spectrum (600 hPa) for the Warner and McIntyre (2001) scheme allowed the (unrealistic and constant) launch spectrum to be filtered as it propagated through the realistic upper troposphere/lower stratosphere winds, resulting in a more realistic momentum flux distribution in the upper stratosphere. The good agreement between CRISTA-2 and Cy35r3 at 45 km (1 hPa) therefore indicates that: i) the chosen launch height of 450 hPa in the S03 scheme is reasonable and ii) the zonal structure of the S03 GWD will be correct at altitudes where these waves break, i.e. the upper stratosphere and mesosphere of the model. It should be noted that the main purpose of including the S03 scheme in the ECMWF model is to improve the upper stratosphere and the mesosphere.
8 High resolution middle atmosphere forecast error and analysis The ECMWF IFS is primarily an operational numerical weather prediction (NWP) system, i.e. it uses a data assimilation suite to assimilate available observations that provide the current state of the atmosphere (analysis) for the high resolution deterministic (short-range) forecasts. Cy35r3 and Cy35r3RF data assimilation cycles at resolution T511 (grid-spacing of ~40 km) and 91 vertical levels were performed for August 2009. The Cy35r3 data assimilation suite includes tangent-linear and adjoint versions of S03 as part of the 4D-variational analysis procedure, which allows more effective assimilation of observations in the middle atmosphere. The ECMWF model currently assimilates Advanced Microwave Sounding Unit A (AMSU-A) microwave radiances in the stratosphere with the uppermost channel peaking at an altitude of around 2 hPa. However, in common with other operational NWP systems, it currently does not assimilate radiance observations in the mesosphere. This is partly because the fast radiative transfer codes used to extract the temperature information are less accurate at these altitudes, but also because prior to Cy35r3 the ‘first guess’ forecast (which is the starting point of the data assimilation system) was so biased in the upper stratosphere/mesosphere that assimilating radiances in this altitude range caused considerable problems. In these altitudes the ECMWF analysis is therefore unconstrained by observations.
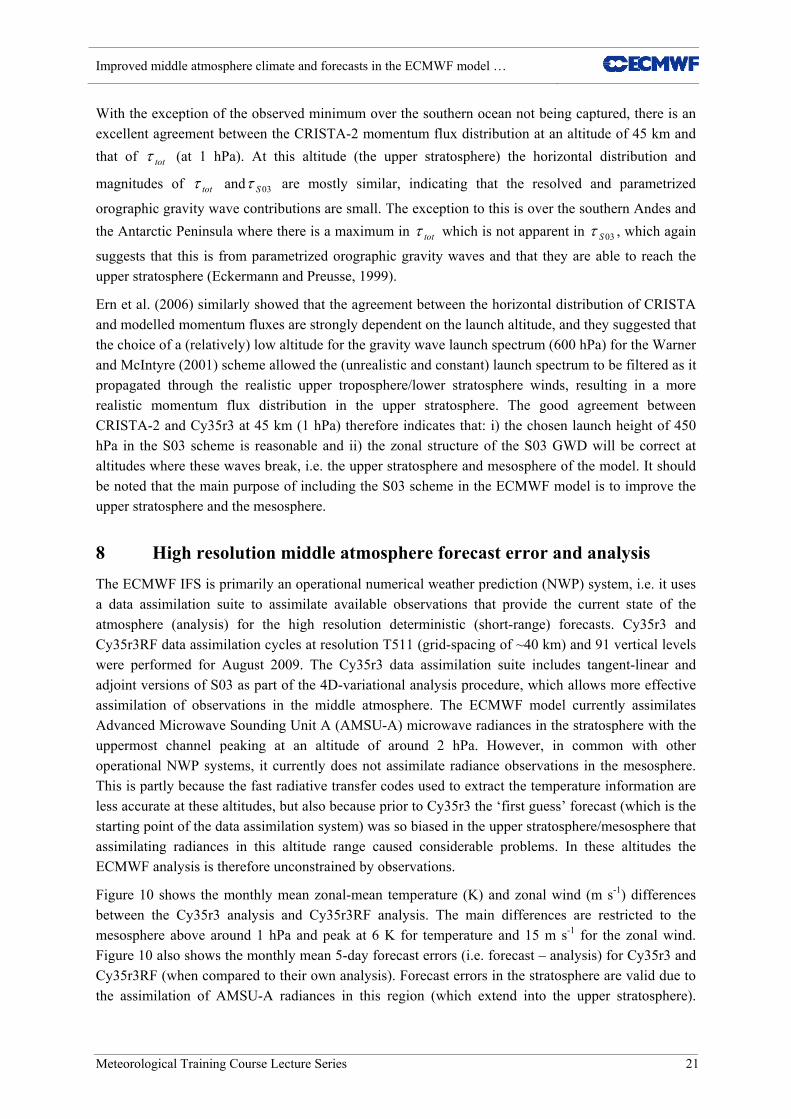
Figure 10 shows the monthly mean zonal-mean temperature (K) and zonal wind (m s-1) differences between the Cy35r3 analysis and Cy35r3RF analysis. The main differences are restricted to the mesosphere above around 1 hPa and peak at 6 K for temperature and 15 m s-1 for the zonal wind. Figure 10 also shows the monthly mean 5-day forecast errors (i.e. forecast – analysis) for Cy35r3 and Cy35r3RF (when compared to their own analysis). Forecast errors in the stratosphere are valid due to the assimilation of AMSU-A radiances in this region (which extend into the upper stratosphere).
Improved middle atmosphere climate and forecasts in the ECMWF model …
22 Meteorological Training Course Lecture Series
However, due to the lack of observational constraints in the mesosphere the errors in this region are not credible. Cy35r3RF shows a cold bias throughout the southern hemisphere polar stratosphere with an error of around -8 K at a height of 2 hPa (the height of the uppermost AMSU-A channel), consistent with the strong southern winter polar stratosphere cold bias apparent in the Cy35r3RF climate simulation (Figure 4). This bias is not apparent in Cy35r3. Away from the southern winter pole the two forecasts have largely similar stratospheric temperature biases. Similarly, Cy35r3RF shows a significant westerly bias in the southern hemisphere polar upper stratosphere, consistent with the overly strong winter westerly jet in the Cy35r3RF climate simulation (Figure 4). This bias is also not apparent in Cy35r3. In the troposphere the differences between Cy35r3 and Cy35r3RF are statistically not significant.
Figure 10: Cross-sections of monthly mean temperature (K) and zonal wind (m s-1) differences during August 2009: differences between the analysis obtained with Cy35r3 and Cy35r3RF (a, b), and differences between the 5-day forecasts and the analysis for Cy35r3 (c, d) and Cy35r3RF (e, f). Each cycle is verified against its own analysis. The analysis resolution is T511 and 91 vertical levels. Easterly and cold biases are denoted by dashed contours.Sensitivity to horizontal resolution.

Improved middle atmosphere climate and forecasts in the ECMWF model …
Meteorological Training Course Lecture Series 23
Figure 11 examines the sensitivity of Cy35r3 average August 2006 zonal-mean zonal wind at horizontal resolutions T159, T799 (grid spacing of ~25 km, which is the operational forecast resolution from February 2006 to January 2010), and T1279 (grid spacing of ~16 km, which is the operational forecast resolution since February 2010). All simulations had 91 vertical levels and a launch momentum flux of 3.75 mPa in each azimuth from a launch height of 450 hPa. S03 is called every 3600 s for resolutions higher or equal than T511. These results are compared with operational analysis based on model cycle 30r1, which at high altitudes shows a strong signal from the underlying forecast model due to the lack of observational constraints. The operational analysis winds in the mesosphere are therefore consistent with the use of Rayleigh friction and the biases evident in Cy35r3RF, such that the core of the easterly jet is near the stratopause and the westerly jet shows a poleward inclination. Comparison between the operational analysis and the SPARC August climatology (not shown) confirms that these features are erroneous. It is therefore perhaps difficult to make a meaningful comparison between the simulated winds and the operational analysis. However, it is apparent that the simulated winds are insensitive to horizontal resolution, with perhaps the main difference being that the peak velocity of the T159 easterly jet is ~10 m s-1 less than that of T799 or T1279.
Figure 11: Average August 2006 cross-sections of zonal-mean zonal wind (m s-1) for operational analysis (a) and Cy35r3 simulations at resolution T159 (b), T799 (c), and T1279 (d). The operational analysis is based on model cycle 30r1 at resolution T511 and 60 vertical levels. The simulations all have 91 vertical levels. Easterly winds are denoted by dashed contours.

Improved middle atmosphere climate and forecasts in the ECMWF model …
24 Meteorological Training Course Lecture Series
Figure 12 examines the corresponding sensitivity to horizontal resolution of
and
at 10 hPa for August 2006. Note that at upper levels may be
overestimated at T799 and T1279 as the non-hydrostatic effect of wave reflection of short gravity waves is not be captured by the hydrostatic dynamical core of the IFS. With the exception of a modest decrease at high southern latitudes,
is largely insensitive to resolution. In principal, should
reduce with increasing resolution so that is independent of resolution (e.g. Brown, 2006). As the
amount of launch momentum flux was initially tuned to T159, this would suggest the T799 and T1279 values of are excessive.
shows a significant increase over the localised source regions of the
Gulf of Mexico and a significant part of southern Asia as the resolution is increased from T159 to T799, consistent with a better representation of deep convection and a greater fraction
03Sτ
03S
)( 03 resLMStot ττττ ++=
03Sτ
resτ
03Sτ τ
totτ
totτ
Figure 12: Average August 2006 parametrized (left, ) and total (right, ) absolute values of horizontal momentum flux (mPa) at 1 hPa for
Cy35r3 at resolution T129 (a, b), T799 (c, d) and, T1279 (e, f). The simulations all have 91 vertical levels.
03Sτ
resLMStot ττττ ++= 03

Improved middle atmosphere climate and forecasts in the ECMWF model …
Meteorological Training Course Lecture Series 25
of the gravity wave spectrum explicitly resolved. Similar behaviour is evident at southern winter high latitudes, i.e. better representation of resolved waves. This is in agreement with Hamilton et al. (1999) who demonstrated that in a model without parametrized GWD the sensitivity of middle atmosphere zonal-mean winds and temperatures to horizontal resolution had still not converged by ~35 km grid spacing, i.e. resolutions greater than T799 are required to fully resolve the global gravity wave spectrum. Finally, there is a significant decrease in
over the southern Andes as the resolution is
increased from T159 to T1279. It would be expected that the magnitude of the resolved orographic momentum flux would increase with increasing resolution due to the improved representation of the resolved orography (i.e. increased height), while
would decrease through the definition of
unresolved sub-grid orography. However, the large change in points to a problem. Brown et al.
(2006) similarly showed a significant decrease in total orographic torque with increasing resolution in the ECMWF model, and suggested that it was due to excessive parametrized orographic torque at low resolution.
totτ
LMτ
totτ
9 Summary and discussion The S03 parametrization employs simplified hydrostatic non-rotational wave dynamics, making it suitably efficient for operational use. It describes the vertical evolution of a broad, constant, isotropic spectrum of gravity waves, emanating from the troposphere, and their dissipation. The resulting momentum flux deposition is used to compute the non-orographic GWD tendencies. The scheme is sufficiently simple that, once the properties of the launch spectrum are selected, in practice the only tuneable parameters are the launch level and the total amount of launch momentum flux.
The S03 scheme was implemented in Cy35r3 of the ECMWF Integrated Forecast System (IFS), becoming operational in September 2009, replacing Rayleigh friction. The resulting January and July climatology of zonal-mean temperature and zonal winds show a good qualitative agreement with the SPARC climatology, in particular, a cold summer polar upper mesosphere and a warm winter polar stratosphere, consistent with a realistic meridional circulation being driven by the inclusion of strong GWD. Other important features are: i) realistic winter and summer mid-latitude jets, ii) a separated (warm) southern winter polar stratopause in July (which was erroneously not apparent in January), iii) realistic parametrized GWD, iv) reasonable stationary planetary wave structure and stationary wave driving in July, and an underestimate of the generation of stationary wave activity in the troposphere and stationary wave driving in January, v) a reasonable representation of the variability of tropical stratospheric circulation, although the westerly component of the SAO is missing, and vi) a good agreement with the horizontal distribution of momentum flux observed by CRISTA-2, and vii) a reduction in short-range high resolution forecast error in the upper stratosphere (which is the uppermost analysis constrained by observations). By contrast, the Cy35r3RF climatology based on Rayleigh friction is characterised by temperatures much too close to radiative equilibrium, consistent with unrealistically weak forcing of the mean flow.
On time scales of weeks to months the troposphere is influenced by the stratosphere through the downward propagation of anomalies from the stratosphere (e.g. Baldwin and Dunkerton, 2001). These anomalies are forced by variations in the lower stratospheric wind and temperature structure influencing wave-mean flow interaction, e.g. the structure and strength of the winter westerly jet (Boville, 1984). Thus, the good representation of the middle atmosphere temperature and circulation using S03 might be reflected in better tropospheric weather predictability for longer forecast ranges,

Improved middle atmosphere climate and forecasts in the ECMWF model …
26 Meteorological Training Course Lecture Series
e.g. the monthly or seasonal time scale. However, preliminary ensemble seasonal forecasting experimentation (four 7 month integrations per year covering the years 1989 to 2008 with an ensemble size of 5 in each case) with the S03 scheme at a resolution of T159 and using the operational 62 vertical level configuration (model top located at 5 hPa) and the 91 vertical level configuration showed no significant impact on tropospheric forecast performance (not shown). Testing of this version of the model with a larger ensemble size which is required to obtain statistically significant results in the polar winter where interannual variability is large is ongoing.
ECMWF does not assimilate infrared radiances such as the Infrared Atmospheric Sounding Interferometer (IASI) and the Atmospheric Infrared Sounder (AIRS) in the mesosphere as emissions undergo complex non-local thermodynamical equilibrium (LTE) modifications that are not currently parametrized by fast radiative transfer models. Similarly, it does not assimilate microwave radiances from the Special Sensor Microwave Imager/Sounder (SSMIS) because the fast models do not currently have an accurate treatment for high-altitude Zeeman splitting. However, the recent development of fast radiative transfer codes suitable for high-altitude channels (Han et al., 2007) and the improved representation of the upper stratosphere/mesosphere of the ECMWF model makes assimilating these radiances operationally a possibility, as is being done by research NWP systems (e.g. Eckermann et al., 2009).
One of the difficulties of S03, and other similar schemes, is the simple treatment of the tropospheric source of non-orographic gravity waves, which accounts for only the time-mean spatial-mean spectrum of waves produced globally by the troposphere. In the absence of the full space-time behaviour of small-scale gravity waves, the goal of the current generation of such parametrizations is to simulate the leading-order features of the observed climate. It is well known, however, that the tropospheric source of non-orographic gravity waves exhibits significant spatial and temporal variability. For example, Alexander and Rosenlof (2003) used Upper Atmosphere Research Satellite (UARS) data to show that there is an enhancement of gravity wave activity in the tropics relative to the extratropics, suggesting that an improvement of the source in S03 might be realized by introducing a tropical enhancement of the launch flux (e.g. Scaife et al., 2000). However, a more realistic approach would be to parametrize the source spectrum associated with localised sources of strong gravity wave activity such as deep convection, fronts, and the jet-stream (e.g. Beres et al., 2005; Charron and Manzini, 2002). Indeed, McLandress and Scinocca (2005) concluded that the GCM response is largely insensitive to the exact details of the dissipation mechanism employed by a gravity wave scheme, suggesting that the more important issue is a better physical characterization and implementation of the source spectrum. The parametrization of gravity wave sources is a notoriously difficult problem and demonstration of the value added relative to simpler schemes requires much further investigation. This remains one of the most active areas of GWD parametrization.

Improved middle atmosphere climate and forecasts in the ECMWF model …
Meteorological Training Course Lecture Series 27
Acknowledgements
The authors thank the three anonymous reviewers who provided valuable comments which led to improvements in the final version of this paper. The authors are also grateful to T. Jung for providing code and help to analyse the EP flux and its divergence. Much assistance from T. Bracegirdle, F. Ii, S. Lamy-Thepaut and T. Phillips with producing the figures is also acknowledged. T. McNally, T. Stockdale and A. Untch provided helpful information. Finally, this work has been supported by COST Action ES0905.
References
Alexander, M. J., and T. J. Dunkerton, 1999: A spectral parameterization of mean-flow forcing due to breaking gravity waves, J. Atmos. Sci., 56, 4167-4182.
Alexander, M. J., and K. H. Rosenlof, 2003: Gravity-wave forcing in the stratosphere: Observational constraints from the Upper Atmosphere Research Satellite and implications for parameterization in global models, J. Geophys. Res., 108, doi:10.1029/2003JD003373.
Allen, S. J., and R. A. Vincent, 1995: Gravity waves in the lower atmosphere: Seasonal and latitudinal variations, J. Geophys. Res., 100, 1327-1350.
Andrews, D. G., J. R. Holton, and C. B Leovy, 1987: Middle Atmosphere Dynamics, International Geophysical Series, Vol. 40, pp. 489.
Baldwin, M. P., H. J. Edmon, and J. R. Holton, 1985: A diagnostic study of eddy-mean flow interactions during FGGE SOP-1, J. Atmos. Sci., 42, 1838-1845.
Baldwin, M. P., and T. J. Dunkerton, 2001: Stratospheric harbingers of anomalous weather regimes, Science, 294, 581-584.
Beres, J. H., R. R. Garcia, B. A. Boville, and F. Sassi, 2005: Implementation of a gravity wave source spectrum parameterization dependent on the properties of convection in the Whole Atmosphere Community Climate Model (WACCM), J. Geophys. Res., 110, D10108, doi:10.1029/2004JD005504.
Boville, B. A., 1984: The influence of the polar night jet on the tropospheric circulation in a GCM, J. Atmos. Sci., 41, 1132-1142.
Boville, B. A., 1986: Wave mean flow interactions in a general circulation model of the troposphere and stratosphere, J. Atmos. Sci., 43, 1711-1144.
Brewer, A., 1949: Evidence for a world circulation provided by measurements of helium and water vapour distribution in the stratosphere, Q. J. R. Met. Soc., 75, 351-363.
Brown, A. R., 2006: Resolution dependence of orographic torques, Q. J. R. Met. Soc., 130, 3029-3046.
Charron, M., and E. Manzini, 2002: Gravity waves from fronts: parameterization and middle atmosphere response in a general circulation model, J. Atmos. Sci., 55, 923-941.
Improved middle atmosphere climate and forecasts in the ECMWF model …
28 Meteorological Training Course Lecture Series
Dewan, E. M, and R. E. Good, 1986: Saturation and the “universal” spectrum for vertical profiles of horizontal scalar winds in the atmosphere, J. Geophys. Res., 91, 2742-2748.
Dunkerton, T., 1997: The role of gravity waves in the quasi-biennial oscillation, J. Geophys. Res., 102, 26,053-26,076.
Eckermann, S. D., and P. Preusse, 1999: Global measurements of stratospheric mountain waves from space, Science, 286, 1534-1537.
Eckermann, S. D., K. W. Hoppel, L. Coy, J. P. McCormack, D. E. Siskind, K. Nielson, A. Kochenash, M. H. Stevens, C. R. Englert, W. Singer, and M. Hervig, 2009: High-altitude data assimilation system experiments for the northern summer mesosphere season of 2007, J. Atmos. Solar Terr. Phys., 71, 531-551.
Ern, M., P. Preusse, M. J. Alexander, and C. D. Warner, 2004: Absolute values of gravity wave momentum flux derived from satellite data, J. Geophys. Res., 109, D20103, doi:10.1029/2004JD004752.
Ern, M., P. Preusse, and C. D. Warner, 2005: A comparison between CRISTA satellite data and Warner and McIntyre gravity wave parameterization scheme: Horizontal and vertical wavelength filtering of gravity wave momentum flux, Adv. Space Res., 35, 2017-2023.
Ern, M., P. Preusse, and C. D. Warner, 2006: Some experimental constraints for spectral parameters used in the Warner and McIntyre gravity wave parameterization scheme, Atmos. Chem. Phys., 6, 4361-4381.
Fritts, D. C., and G. D. Nastrom, 1992: Sources of mesoscale variability of gravity waves. Part II: frontal, convective, and jet stream excitation, J. Atmos. Sci., 49, 111-127.
Fritts, D. C., and T. E. VanZandt, 1993: Spectral estimates of gravity wave energy and momentum fluxes. Part I: Energy dissipation, acceleration, and constraints, J. Atmos. Sci., 50, 3685-3694.
Garcia, R. R., and S. Solomon, 1985: The effect of breaking gravity waves on the dynamics and chemical composition of the mesosphere and lower thermosphere, J. Geophys. Res., 90, 3850-3868.
Garcia, R. R., and B. A. Boville, 1994: “Downward Control” of the mean meridional circulation and temperature distribution of the polar winter stratosphere, J. Atmos. Sci., 51, 2238-2245.
Gardner, C. S., M. S. Miller, and C. H. Liu, 1989: Rayleigh lidar observations of gravity wave activity in the upper stratosphere at Urbana, Illinois, J. Atmos. Sci., 46, 1838-1854.
Gage, K. S., and G. D. Nastrom, 1985: On the spectrum of atmospheric velocity fluctuations seen by MST/ST radar and their interpretation, Radio Science, 20, 1339-1347.
Giorgetta, M. A., E. Manzini, and E. Roeckner, 2002: Forcing of the quasi-biennial oscillation from a broad spectrum of atmospheric waves, Geophys. Res. Lett., 29, 1245, 10.1029/2002GL014756.

Improved middle atmosphere climate and forecasts in the ECMWF model …
Meteorological Training Course Lecture Series 29
Haynes, P. H., C. J. Marks, M. E. McIntyre, T. G. Shepherd, and K. P. Shine, 1991: On the “downward control” of extratropical diabatic circulations by eddy-induced mean forces, J. Atmos. Sci., 48, 651-678.
Hamilton, K., R. J. Wilson, J. D. Mahlman, and L. J. Umscheid, 1995: Climatology of the SKYHI troposphere-stratosphere-mesosphere general circulation model, J. Atmos. Sci., 52, 5-42.
Hamilton, K., R. J. Wilson, and R. S. Hemler, 1999: Middle atmosphere simulated with high vertical and horizontal resolution versions of a GCM: Improvements in the cold pole bias and generation of a QBO-like oscillation in the tropics, J. Atmos. Sci., 56, 3829-3846.
Han, Y., F. Weng, Q. Liu, P. Van Delst, 2007: A fast radiative model for SSMIS upper atmosphere sounding channels, J. Geophys. Res., 112, D11121.
Hertzog, A., F. Vial, C. R. Mechoso, C. Basdevant, and P. Cocquerez, 2002: Quasi-Lagrangian measurements in the lower stratosphere reveal an energy peak associated with near-inertial waves, Geophys. Res. Lett., 29, 1229, 10.1029/2001GL014083.
Hines, C. O., 1991: The saturation of gravity waves in the middle atmosphere. Part I: Critique of linear-instability theory, J. Atmos. Sci., 48, 1348-1359.
Hines, C. O., 1997a: Doppler spread parameterization of gravity wave momentum deposition in the middle atmosphere. Part 1: Basic formulation, J. Atmos., Solar Terr., Phys., 59, 371-386.
Hines, C. O., 1997b: Doppler spread parameterization of gravity wave momentum deposition in the middle atmosphere. Part 2: Broad and quasi monochromatic spectra and implementation, J. Atmos., Solar Terr., Phys., 59, 387-400.
Holton, J. R., 1982: The role of gravity wave induced drag and diffusion in the momentum budget of the mesosphere, J. Atmos. Sci., 39, 791-799.
Holton, J. R., 1983: The influence of gravity wave breaking on the general circulation of the middle atmosphere, J. Atmos. Sci., 40, 2497-2507.
Jiang, J. H., S. D. Eckermann, D. L. Wu, K. Hocke, B. Wang, J. Ma, and Y. Zhang, 2005: Seasonal variation of gravity wave sources from satellite observations, Adv. Space Res., 35, 1925-1932.
Lane, T. P., J. D. Doyle, R. Plougonven, M. A. Shapiro, and R. D. Sharman, 2008: Observations and numerical simulations of inertia-gravity waves and shearing instabilities in the vicinity of a jet stream, J. Atmos. Sci., 61, 2692-2706.
Lindzen, R. S., and J. R. Holton, 1968: Theory of the stratospheric quasi-biennial oscillation, J. Atmos. Sci., 25, 1095-1107.
Lindzen, R. S., 1981: Turbulence and stress owing to gravity wave and tidal breakdown, J. Geophys. Res., 86, 9707-9714.
Lott, F., and M. J. Miller, 1997: A new subgrid-scale orographic drag parametrization: Its formulation and testing, Q. J. R. Met. Soc., 123, 101-127.
Improved middle atmosphere climate and forecasts in the ECMWF model …
30 Meteorological Training Course Lecture Series
Marks, C. J., 1989: Some features of the climatology of the middle atmosphere revealed by Nimbus 5 and 6, J. Atmos. Sci., 46, 2485-2508.
Manzini, E., N. A. McFarlane, and C. McLandress, 1997: Impact of the Doppler spread parameterization on the simulation of the middle atmosphere circulation using the MA/ECHAM4 general circulation model, J. Geophys. Res., 102, 25751-25762.
McLandress, C., and J. F. Scinocca, 2005: The GCM response to current parameterizations of nonorographic gravity wave drag. J. Atmos. Sci., 62, 2394-2413.
Medvedev, A. S., and G. P. Klaassen, 1995: Vertical evolution of gravity wave spectra and the parameterization of associated wave drag, J. Geophys. Res., 100, 25841-25853.
Meyer, W. D., 1970: A diagnostic numerical study of the semiannual variation of the zonal wind in the tropical stratosphere and mesosphere, J. Atmos. Sci., 27, 820-830.
Palmer, T. N., G. J. Shutts, and R. Swinbank, 1986: Alleviation of a systematic westerly bias in general circulation and numerical weather prediction models through an orographic gravity wave drag parameterization, Q. J. R. Met. Soc., 112, 1001-1039.
Preusse, P, A. Dörnbrack, S. D. Eckermann, M. Riese, B. Schaeler, J. T. Bacmeister, D. Broutman, and K. U. Grossmann, 2002: Space based measurements of stratospheric mountain waves by CRISTA, 1. Sensitivity, analysis method and a case study, J. Geophys. Res., 107, 8178, doi:10.1029/2001JD000699.
Pulido, M., and J. Thuburn, 2006: Gravity-wave drag estimation from global analyses using variational data assimilation principles. II: Case study, Q. J. R. Met. Soc., 132, 1527-1543.
Randel, W. J., 1988: The seasonal evolution of planetary waves in the southern hemisphere stratosphere and troposphere, Q. J. R. Met. Soc., 114, 1385-1409.
Randel, W. J., and co-authors, 2004: The SPARC intercomparison of middle atmosphere climatologies, J. Climate, 17, 986-1003.
Ray, E. A., M. J. Alexander, and J. R. Holton, 1998: An analysis of the structure and forcing of the equatorial semiannual oscillation in zonal wind, J. Geophys. Res., 103, 1759-1774.
Sato, K., and T. J. Dunkerton, 1997: Estimates of momentum flux associated with equatorial Kelvin and gravity waves, J. Geophys. Res., 102, 26,247-26,261.
Scaife, A. A., N. Butchart, C. D. Warner, D. Stainforth, W. Norton, and J. Austin, 2000: Realistic quasi-biennial oscillations in a simulation of the global climate, Geophys. Res. Lett., 27, 3481-3484.
Scaife, A. A., N. Butchart, C. D. Warner, and R. Swinbank, 2002: Impact of a spectral gravity wave parameterization on the stratosphere in the Met Office Unified Model, J. Atmos. Sci., 59, 1473-1489.
Scinocca, J. F., 2002: The effect of back-reflection in the parameterization of non-orographic gravity-wave drag, J. Met. Soc. Jap., 80, 939-962.

Improved middle atmosphere climate and forecasts in the ECMWF model …
Meteorological Training Course Lecture Series 31
Scinocca, J. F., 2003: An accurate spectral nonorographic gravity wave drag parameterization for general circulation models, J. Atmos. Sci., 60, 667-682.
Scinocca, J. F., N. A. McFarlane, M. Lazare, J. Li, and D. Plummer, 2008: The CCCma third generation AGCM and its extension into the middle atmosphere, Atmos. Chem. Phys., 8, 7055-7074.
Shaw, T. A., and T. G. Shepherd, 2007: Angular momentum conservation and gravity wave drag parameterization: implications for climate models, J. Atmos. Sci., 64, 190-203.
Shepherd, T. G., and T. A. Shaw, 2004: The angular momentum constraint on climate sensitivity and downward influence in the middle atmosphere, J. Atmos. Sci., 61, 2899-2908.
Smith, S. A., D. C. Fritts, and T. E. VanZandt, 1987: Evidence for a saturated spectrum of atmospheric gravity waves, J. Atmos. Sci., 44, 1404-1410.
Warner, C. D., and M. E. McIntyre, 1996: On the propagation and dissipation of gravity wave spectra through a realistic middle atmosphere. J. Atmos. Sci., 53, 3213-3235.
Warner, C. D., and M. E. McIntyre, 2001: An ultra-simple spectral parameterization for non-orographic gravity waves, J. Atmos. Sci., 58, 1837-1857.
Whiteway, J. A., and T. J. Duck, 1999: Enhanced Arctic stratospheric gravity wave activity above a tropospheric jet, J. Geophys. Res., 26, 2453-2456.