imprint · 2018-09-27 · imprint bureau of energy efficiency (bee), ministry of power, ... sunil...
TRANSCRIPT


ImprintBureau of Energy Efficiency (BEE), Ministry of Power, Govt. of India 4th Floor, Sewa Bhawan, Sector-1, R.K. Puram New Delhi, 110066, India
Deutsche Gesellschaft für Internationale Zusammenarbeit (GIZ) GmbH Registered offices: Bonn and Eschborn, Germany Indo-German Energy Programme (IGEN) C/o Bureau of Energy Efficiency West Block-2, Sector-1, R.K. Puram, New Delhi, 110066, India
Responsible Winfried Damm E: [email protected]
Contributing Authors Bureau of Energy Efficiency (BEE) Abhay Bakre, Pankaj Kumar, Ashok Kumar, Sunil Khandare, Abhishek Kumar Yadav, Satya Kumar Bharti
Indo-German Energy Programme (IGEN) Arvind Kumar Asthana, Rita Acharya, Nitin Jain, Piyush Sharma, Ravinder Kumar
Confederation of Indian Industry (CII) K S Venkatagiri, P V Kiran Ananth, K Muralikrishnan, Balasubramanian M B and Team
Acknowledgement NTPC Ramagundam, O P Jindal Group – Tamnar, P.D. Siwal (CEA), Chandra Shekhar (CEA)
Study by: Confederation of Indian Industry (CII) CII – Sohrabji Godrej Green Business Centre Survey No. 64, Kothaguda Post, Near Hi-tech City, Hyderabad, 500084, India
Version: New Delhi, September 2018
All rights reserved. Any use of the content is subject to consent by Bureau of Energy Efficiency (BEE), and Indo-German energy Programme (IGEN), GIZ. All content has been prepared with the greatest possible care and is provided in good faith. The data has been taken from PAT cycle-I. and the projections have been done by taking the data of Ministries, wherever available. CAGR has been considered where the data from Ministry or another authentic source was not available. Historic data for key indices has been taken from various references which has been provided in the footnote of the relevant sections. BEE, GIZ and CII accepts no liability for damage of tangible or intangible nature caused directly or indirectly by the use of or failure to use the information provided.
Dr. Winfried Damm
Head of Energy, GIZ India
Dr. Winfried Damm
Power is grown to become the fourth essential thing for living in urban areas, after air, water and food. India ranks fifth in the world with a generation capacity of 344 GW as on March, 2018. The sector has a mix of plants being of 50 years old technology to the most advanced ones. Needless to mention there exists a significant potential in renovating/ modernizing the old plants, or by simply retiring them. The Government has decided to close the old inefficient units in a phased manner giving way to the most efficient new plants. A lot of innovations in ultra-supercritical and advanced ultra-supercritical technologies are in progress which will further boost the efficiency in the sector.
Germany has been playing a very active role in promoting energy efficiency in not only its own land, but also supporting the other countries to adopt the same. Germany has been supporting India in various fields since last 60 years, with an aim of promoting cooperation and involving public-private sectors of both sides in the areas of energy, environment and sustainable economic development. The Indo-German Energy Programme (IGEN), works as a partner of Bureau of Energy Efficiency (BEE) in supporting policies and programmes envisaged under the Energy Conservation Act, 2001.
It has been a privilege to work with BEE, the organization spearheading activities on energy efficiency in India. IGEN has been involved with BEE in the Perform Achieve and Trade since its inception, and hence it is blissful to know that the outcome of this scheme led to a huge savings in terms of CO
2 emission
reduction and coal.
However, the real outcome of PAT scheme is not only the savings in terms of toe and CO2, but it is the
change in behavior towards energy efficiency. It is astonishing to see the amount of resources and concepts the industries have put together in achieving the target. Some state-of-the-art projects implemented in PAT cycle-I are cross cutting and could have significant potential across the sectors. Some of the positive outcomes of this scheme were the utilization of waste heat in generation of steam and power, adoption of cogeneration, use of alternate fuel and raw material, etc. This report analyses the outcome of PAT scheme in Thermal Power Plant sector in multidimensional ways and forecasts the future savings along with innovative case studies having high replication potential. The estimate suggests the cumulative energy savings from the sector till 2030 to be 45.45 million TOE, which is quite impressive.
We are delighted to be a part of this historic journey where India has been a forerunner in implementing an exceptional scheme, customized to the benefit of the industries as well as the nation. I personally feel that the deepening of this scheme in Thermal Power Plant sectors would prove a game changer in the times to come. This scheme has tremendous opportunities for regional synergies and its adaptation by other countries could lead to address the global climate issues.

Sectoral Expert Committee Members
S. No. Name Designation Organization
THERMAl POWER PlANT1 Shri P.D. Siwal Member (Thermal) CEA
2 Shri Narendra Singh Chief Engineer CEA
3 Dr.Lila Dhar Papney Chief Engineer CEA
4 Shri Chandra Shekhar Chief Engineer CEA
5 Shri S.C. Shrivastava Chief Engineer CERC
6 Shri Alok Shrivastava GM (OS- CenPEEP) NTPC Limited
7 Shri Sudip Nag GM (OS- CenPEEP) NTPC Limited
8 Shri Subodh Kumar AGM(CenPEEP) NTPC Limited
9 Shri Kailash M. Chirutkar ED (O&M) MAHAGENCO
10 Shri N. Sankar Director (Generation) TANGEDCO
11 Shri Praful Pathak Reg. Manager MSEB
2.2.1 Sectoral Contribution to Country’s Economic Value 5
Thermal Power Sector in India 3
3. Process description of Thermal Power Sector 8
6.
7.
8.
9.
list of Major Energy Saving Opportunities in the Sector 22
Success stories – Case Studies in Thermal Power Sector 23
list of Technology Suppliers 29
Abbreviation 30
4. Methodology Adopted for the Project 10
1.
5.5.1 Impact of PAT Cycle-I 115.2 Energy Scenario at Business as usual (BAU) vs PAT impact 125.3 Thermal power sector specific data analysis of PAT Cycle - I 16
7.1 Modifications of CT Make Up through Gravity 237.2 Low Grade Flue Gas based Vapour Absorption Machine (VAM) 25
Executive Summary 1
PAT Cycle-I and its Impact on Thermal Power Sector 11
Content
List of Tables
Figure 1: Share of energy by source 3
Figure 2: Energy Generation and growth from conventional sources 4
Figure 3: Schematic of thermal power plant 8
Figure 4 Schematic of Combined Cycle Gas Turbine power plant 9
Figure 5: Methodology followed for Impact assessment of PAT Cycle - I 10
Figure 6: Energy consumption – PAT vs BAU scenario 13
Figure 7 Business as usual (BAU) vs with PAT – Average sector net heat rate 14
Figure 8: A view of Thermal Power Plant 14
Figure 9: Comparison of no. of startups for BY and AY in PAT Cycle - I 19
Figure 10: Share of primary energy consumption in BY and AY in PAT Cycle - I 20
Figure 11: Comparison of consumption of Indian coal and imported coal 20
Figure 12: Illustration of modified project 24
Figure 13: CT makeup Pump House 24
Figure 14: New Gravity Makeup Line 24
Figure 15: Utilization of low grade flue gas in VAM 26
Figure 16: Basic working principle of VAM 27
Table 1: Thermal power sectoral achievement in PAT Cycle - I 2
Table 2: Capacity Addition of various energy sources from 2017-2027, NEP – 2018 4
Table 3: Percentage growth of units generated year on year basis 5
Table 4: India’s energy intensity 6
Table 5: Thermal power sectoral energy intensity 7
Table 6: Reduction in CO2 emissions from the PAT cycle 12
Table 7: Achievements of thermal power sector in PAT Cycle - I and projections till 2030 12
Table 8: Energy intensity with PAT and BAU for thermal power sector 15
Table 9: Net Heat Rate & APC (National Average Vs National Best) 16
Table 10: Installed capacity and operating load for BY and AY 16
Table 11: Percentage increase or decrease of operating capacity and gross generation 17
Table 12: Unit Heat Rate comparison of assessment and baseline year 17
Table 13: Percentage increase or decrease of unit heat rate 18
Table 14: APC comparison of assessment and baseline year 18
Table 15: Net heat rate comparison of assessment and baseline year 19
Table 16: List of key technologies in the sector 22
List of Figures
Thermal Power 1
1. Executive SummaryIn a bid to combat increasing energy consumption and related carbon emissions, the Government of India released the National Action Plan on Climate Change (NAPCC) in 2008 to promote and enable sustainable development of the country by promoting a low carbon and high resilience development path. Under the NAPCC, eight national missions were framed to focus on various aspects related to water, solar energy, sustainable habitat, agricultural, energy efficiency, ecosystems, etc. Perform Achieve and Trade scheme (PAT) is a component of the National Mission for Enhanced Energy Efficiency (NMEEE) which is one of the eight missions under the NAPCC.
PAT is a regulatory instrument to reduce specific energy consumption (SEC) in energy intensive industries, with an associated market-based mechanism to enhance cost effectiveness through certification of excess energy savings, which could be traded. Energy Savings Certificate (ESCerts) are issued to the industries which reduce their SEC beyond their target. Those companies which fail to achieve their target are required to purchase ESCerts for compliance, or are liable to be penalised. Trading of ESCerts are conducted on existing power exchanges.
PAT Cycle - I, which was operationalized in April 2012, included 478 units, known as “Designated Consumers” (DCs), from eight energy-intensive sectors viz. Aluminium, Cement, Chlor - Alkali, Fertilizer, Iron & Steel, Pulp & Paper, Thermal
Power Plant and Textile were included. The annual energy consumption of these DCs in eight sectors was around 164 million TOE. The overall SEC reduction target in the eight sectors was about 4.05% with an expected energy saving of 6.68 million TOE by the end of 2014-15.
With the completion of the PAT Cycle - I in 2015, the reported overall achievement was 8.67 million TOE, exceeding the target for cycle 1 by almost 30%. The total energy saving of 8.67 million TOE is equivalent to saving of about 20 million tonnes of coal and avoided emissions of about 31 million tonnes of CO
2. In terms of monetary value, saving
in energy consumption corresponds to Rs. 95,000 million.
PAT Cycle - I has witnessed an exceptional performance from all the sectors in terms of reducing their energy consumption. The DCs have made commendable efforts to achieve energy efficiency targets by adopting various improvement measures in technology, operational and maintenance practices, and application of management techniques.
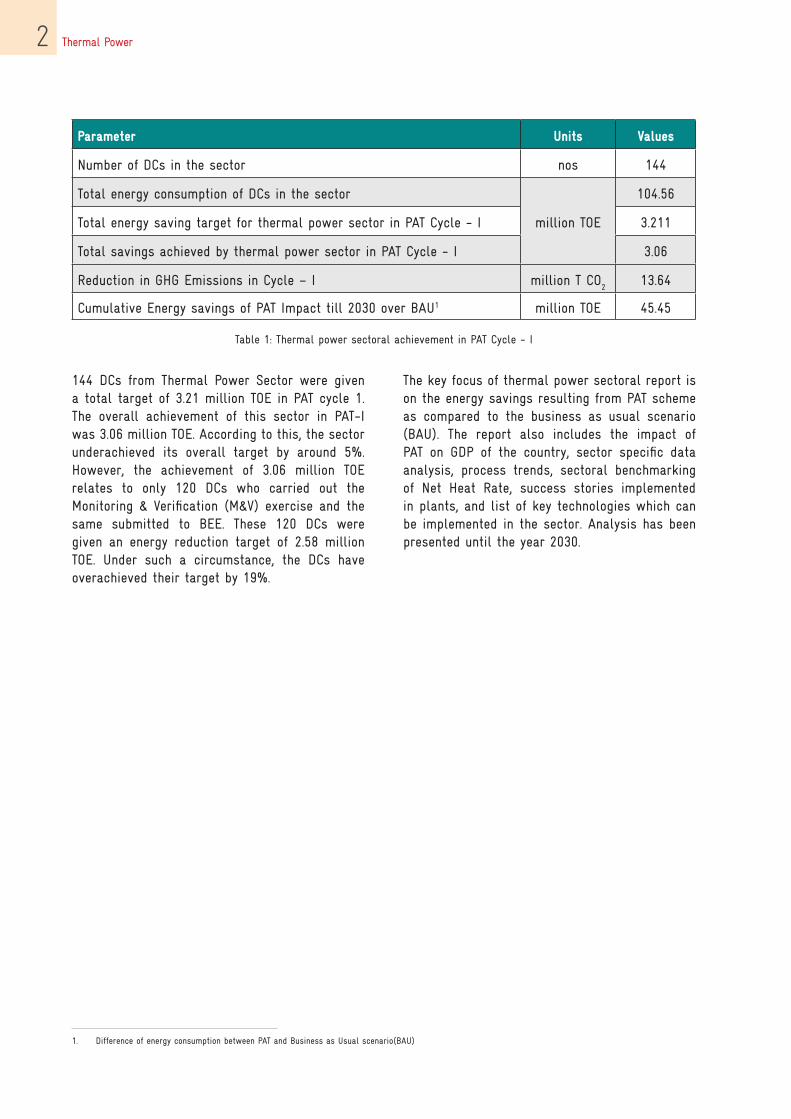
Thermal Power sector is the highest consumer of energy in PAT Cycle - I, with an annual energy consumption of 104.56 million TOE by the DCs. The summary of the achievement by the thermal power sector in PAT Cycle - I is presented in Table 1.
Thermal Power2
144 DCs from Thermal Power Sector were given a total target of 3.21 million TOE in PAT cycle 1. The overall achievement of this sector in PAT-I was 3.06 million TOE. According to this, the sector underachieved its overall target by around 5%. However, the achievement of 3.06 million TOE relates to only 120 DCs who carried out the Monitoring & Verification (M&V) exercise and the same submitted to BEE. These 120 DCs were given an energy reduction target of 2.58 million TOE. Under such a circumstance, the DCs have overachieved their target by 19%.
1. Difference of energy consumption between PAT and Business as Usual scenario(BAU)
The key focus of thermal power sectoral report is on the energy savings resulting from PAT scheme as compared to the business as usual scenario (BAU). The report also includes the impact of PAT on GDP of the country, sector specific data analysis, process trends, sectoral benchmarking of Net Heat Rate, success stories implemented in plants, and list of key technologies which can be implemented in the sector. Analysis has been presented until the year 2030.
Parameter Units Values
Number of DCs in the sector nos 144
Total energy consumption of DCs in the sector
million TOE
104.56
Total energy saving target for thermal power sector in PAT Cycle - I 3.211
Total savings achieved by thermal power sector in PAT Cycle - I 3.06
Reduction in GHG Emissions in Cycle – I million T CO2
13.64
Cumulative Energy savings of PAT Impact till 2030 over BAU1 million TOE 45.45
Table 1: Thermal power sectoral achievement in PAT Cycle - I
Thermal Power 3
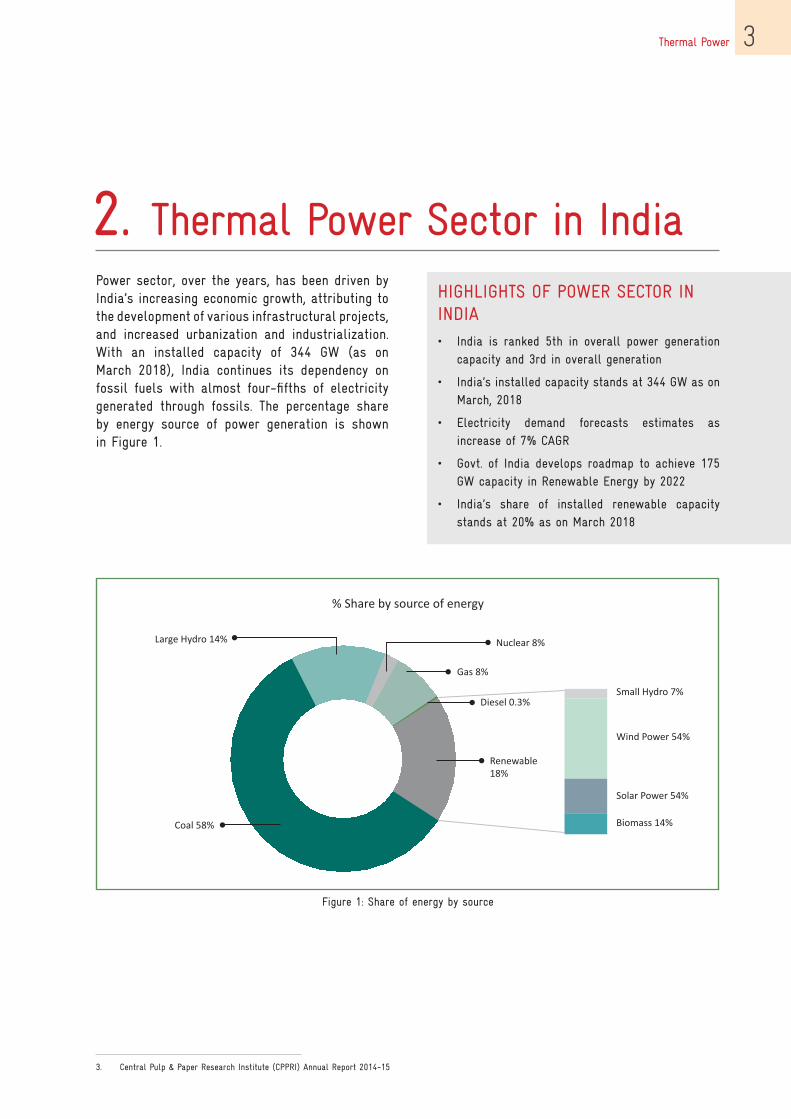
2. Thermal Power Sector in IndiaPower sector, over the years, has been driven by India’s increasing economic growth, attributing to the development of various infrastructural projects, and increased urbanization and industrialization. With an installed capacity of 344 GW (as on March 2018), India continues its dependency on fossil fuels with almost four-fifths of electricity generated through fossils. The percentage share by energy source of power generation is shown in Figure 1.
HIGHLIGHTS OF POWER SECTOR IN INDIA• India is ranked 5th in overall power generation
capacity and 3rd in overall generation
• India’s installed capacity stands at 344 GW as on March, 2018
• Electricity demand forecasts estimates as increase of 7% CAGR
• Govt. of India develops roadmap to achieve 175 GW capacity in Renewable Energy by 2022
• India’s share of installed renewable capacity stands at 20% as on March 2018
Figure 1: Share of energy by source
3. Central Pulp & Paper Research Institute (CPPRI) Annual Report 2014-15
Thermal Power4
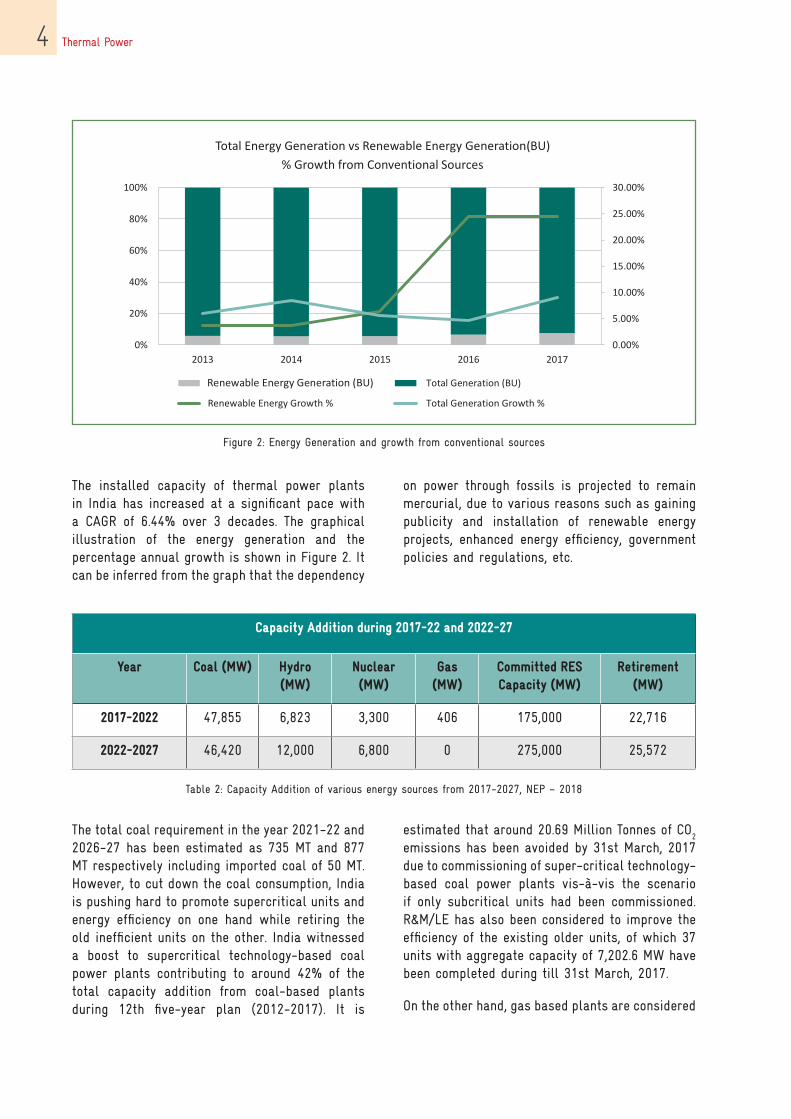
Figure 2: Energy Generation and growth from conventional sources
The installed capacity of thermal power plants in India has increased at a significant pace with a CAGR of 6.44% over 3 decades. The graphical illustration of the energy generation and the percentage annual growth is shown in Figure 2. It can be inferred from the graph that the dependency
Capacity Addition during 2017-22 and 2022-27
Year Coal (MW) Hydro (MW)
Nuclear (MW)
Gas (MW)
Committed RES Capacity (MW)
Retirement (MW)
2017-2022 47,855 6,823 3,300 406 175,000 22,716
2022-2027 46,420 12,000 6,800 0 275,000 25,572
Table 2: Capacity Addition of various energy sources from 2017-2027, NEP – 2018
on power through fossils is projected to remain mercurial, due to various reasons such as gaining publicity and installation of renewable energy projects, enhanced energy efficiency, government policies and regulations, etc.
The total coal requirement in the year 2021-22 and 2026-27 has been estimated as 735 MT and 877 MT respectively including imported coal of 50 MT. However, to cut down the coal consumption, India is pushing hard to promote supercritical units and energy efficiency on one hand while retiring the old inefficient units on the other. India witnessed a boost to supercritical technology-based coal power plants contributing to around 42% of the total capacity addition from coal-based plants during 12th five-year plan (2012-2017). It is
estimated that around 20.69 Million Tonnes of CO2
emissions has been avoided by 31st March, 2017 due to commissioning of super-critical technology-based coal power plants vis-à-vis the scenario if only subcritical units had been commissioned. R&M/LE has also been considered to improve the efficiency of the existing older units, of which 37 units with aggregate capacity of 7,202.6 MW have been completed during till 31st March, 2017.
On the other hand, gas based plants are considered
Thermal Power 5
necessary to reduce CO2 emissions and to utilize
their capability to fast ramp-up and ramp-down thereby easing the process of integration of renewable energy. Modern combined cycle gas turbines (CCGTs) have high efficiency of around 55% as compared to coal-based plants. However, the production and supply of gas had not been keeping pace with the growing demand and hence the supply for gas-based power stations in the country has been inadequate resulting in huge generation loss. Against a total domestic natural gas allocated to power projects of 87.05 MMSCMD, the total gas supplied to these gas-based power plants during the year 2016-17 was only 29.59 MMSCMD. It has been estimated that the gas-based stations shall need at least 45.27 MMSCMD of gas to meet the balancing and peaking requirement of the grid arising due to
3 All projections are based on NEP, 2018
RES integration. If the storage devices become economically viable in future, then they can also be used for the balancing. Presently, existing gas-based power plants are operating at very low PLF of about 23% and few gas-based power plants are lying idle due to non-availability of domestic natural gas.
India has set an ambitious target of 175 GW of installed capacity from renewables by 2022, of which 57,244.24 MW has already been installed till March-2017. The Renewable Energy Generation will contribute about 20.1 % and 24.4 % of the total energy in 2021- 22 and 2026-27 respectively. It is estimated that about 268 Million Tonnes of CO
2
emission will be avoided annually by the end of the year 2021-22 due to the addition of renewable energy sources.
YearGross generation (BU) % Growth
All India From Thermal All India Thermal
2012 912 859 - -
2013 967 904 5.9 5.2
2014 1049 978 8.5 8.2
2015 1107 1062 5.6 8.6
2020 1438 1129 5.4 1.2
2025 1839 1244 5.0 2.0
2030 2404 1438 5.5 3.0
Table 3: Percentage growth of units generated year on year basis3
2.1 Sectoral Contribution to Country’s Economic Value
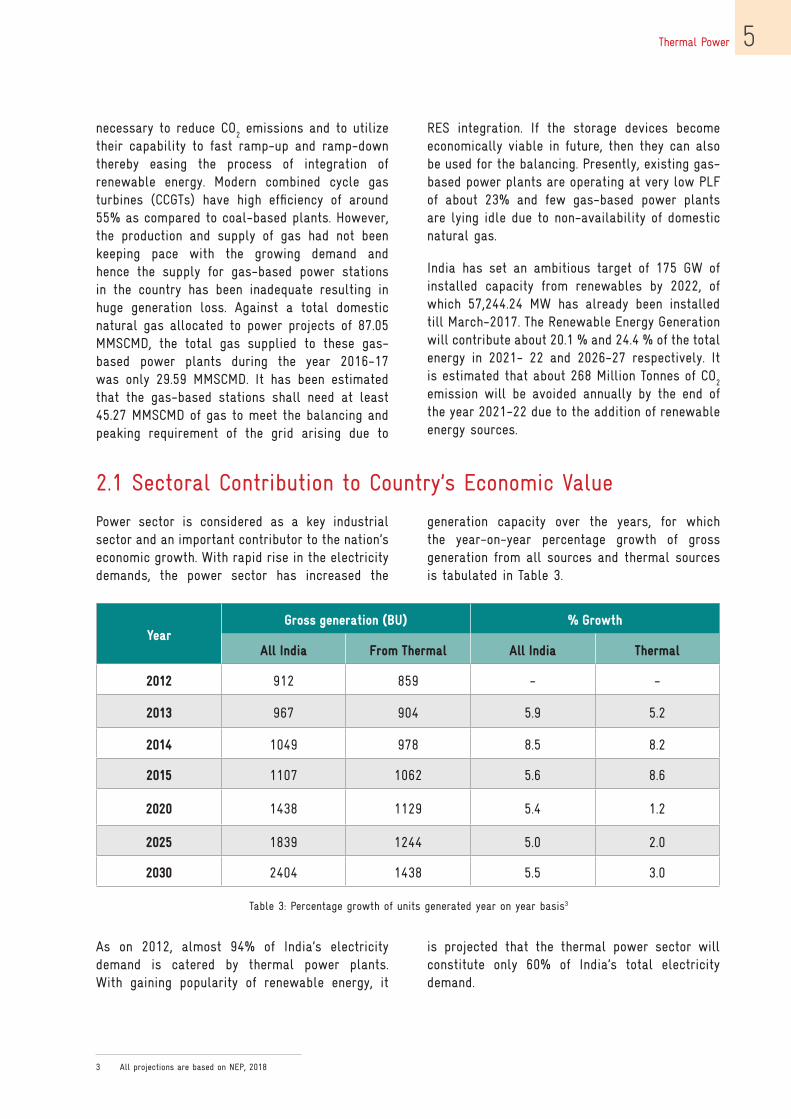
Power sector is considered as a key industrial sector and an important contributor to the nation’s economic growth. With rapid rise in the electricity demands, the power sector has increased the
generation capacity over the years, for which the year-on-year percentage growth of gross generation from all sources and thermal sources is tabulated in Table 3.
As on 2012, almost 94% of India’s electricity demand is catered by thermal power plants. With gaining popularity of renewable energy, it
is projected that the thermal power sector will constitute only 60% of India’s total electricity demand.
Thermal Power6
Financial Year Total Energy Consumption of IndiaGross Domestic Product
(GDP)Energy Intensity
million TOE Billion USD MTOE/ million USD
2008 427 1,187 360
2009 453 1,324 342
2010 512 1,657 309
Average Baseline 464 1,389 334
2015 659 2,102 313
2020 10186 3,018 337
2025 12117 4,233 286
2030 14407 5,9379 243
Table 4: India’s energy intensity
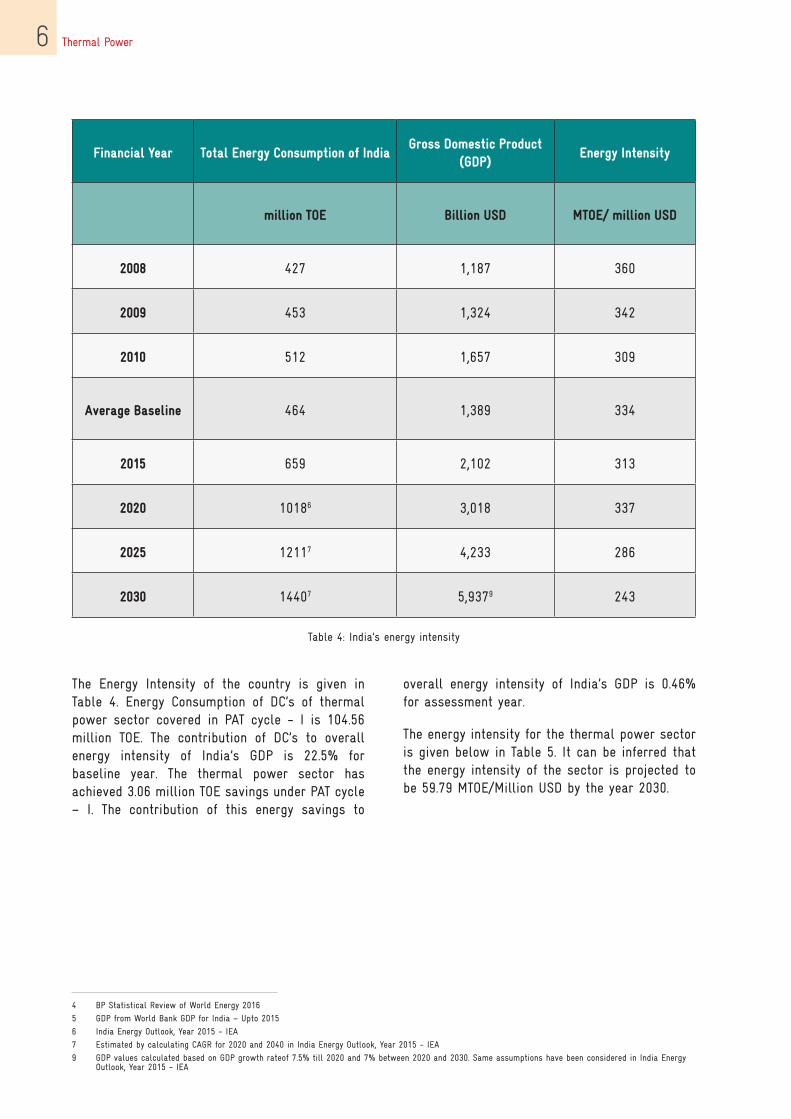
The Energy Intensity of the country is given in Table 4. Energy Consumption of DC’s of thermal power sector covered in PAT cycle - I is 104.56 million TOE. The contribution of DC’s to overall energy intensity of India’s GDP is 22.5% for baseline year. The thermal power sector has achieved 3.06 million TOE savings under PAT cycle – I. The contribution of this energy savings to
overall energy intensity of India’s GDP is 0.46% for assessment year.
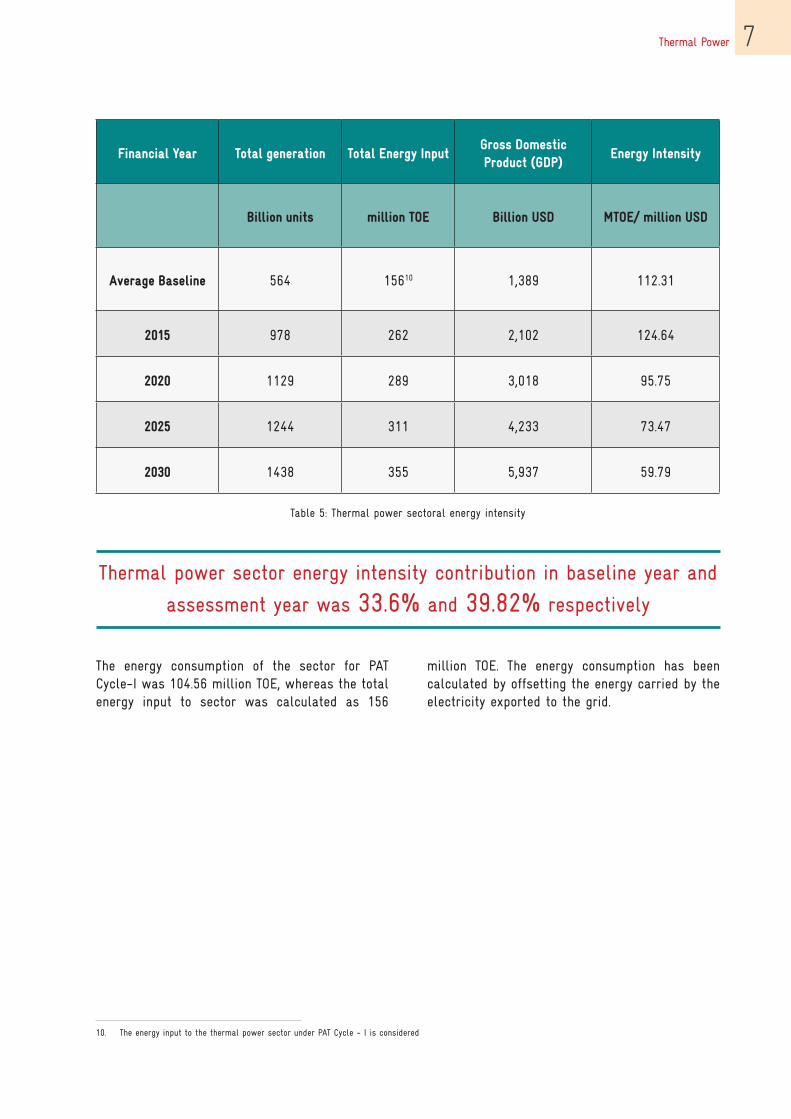
The energy intensity for the thermal power sector is given below in Table 5. It can be inferred that the energy intensity of the sector is projected to be 59.79 MTOE/Million USD by the year 2030.
4 BP Statistical Review of World Energy 2016
5 GDP from World Bank GDP for India – Upto 2015
6 India Energy Outlook, Year 2015 - IEA
7 Estimated by calculating CAGR for 2020 and 2040 in India Energy Outlook, Year 2015 - IEA
9 GDP values calculated based on GDP growth rateof 7.5% till 2020 and 7% between 2020 and 2030. Same assumptions have been considered in India Energy Outlook, Year 2015 - IEA
Thermal Power 7
Financial Year Total generation Total Energy InputGross Domestic Product (GDP)
Energy Intensity
Billion units million TOE Billion USD MTOE/ million USD
Average Baseline 564 15610 1,389 112.31
2015 978 262 2,102 124.64
2020 1129 289 3,018 95.75
2025 1244 311 4,233 73.47
2030 1438 355 5,937 59.79
Table 5: Thermal power sectoral energy intensity
Thermal power sector energy intensity contribution in baseline year and
assessment year was 33.6% and 39.82% respectively
The energy consumption of the sector for PAT Cycle-I was 104.56 million TOE, whereas the total energy input to sector was calculated as 156
million TOE. The energy consumption has been calculated by offsetting the energy carried by the electricity exported to the grid.
10. The energy input to the thermal power sector under PAT Cycle - I is considered

Thermal Power8
3. Process description of Thermal Power Sector
Coal Handling
The coal is stored in a storage yard and is then sent to the primary and secondary crushers for reducing the size of the coal to coarse size. It is stored and then fed to boiler through conveyer. Coal from nearby coalfields is transported to the plant site and crushed to the required size. This crushed coal is conveyed to boiler bunkers and from the bunkers; the coal is fed into the boiler furnace.
Steam and Turbine Systems
The generated superheated steam is sent to the turbine, wherein the energy is converted into mechanical energy. The turbine is coupled to a generator which generates electricity. In addition, the turbine consists of various extractions, which are passed through various HP and LP heaters, used to preheat the boiler feed water. This is a
Figure 3: Schematic of thermal power plant
Boiler
The boiler system is used to convert water to superheated steam under high pressure and temperature conditions. The heat necessary for boiling the feedwater is supplied by the heat obtained from combusted coal inside the boiler. Other fuels such as natural gas, diesel, lignite, etc. are also used as combustion materials. Larger sized power plants includes reheat of steam, which is extracting the outlet steam of HP turbine and reheating the steam to increase the enthalpy of the steam.
form of regenerative heat to improve the overall cycle efficiency of the plant.
Utilities
The power plant consists of a number of utilities, namely, Boiler Feed Water (BFP) pump, FD Fan, ID Fan, PA Fan, Cooling Towers, etc. In brief, the BFP is used to pump water from the deaerator to
Thermal Power 9
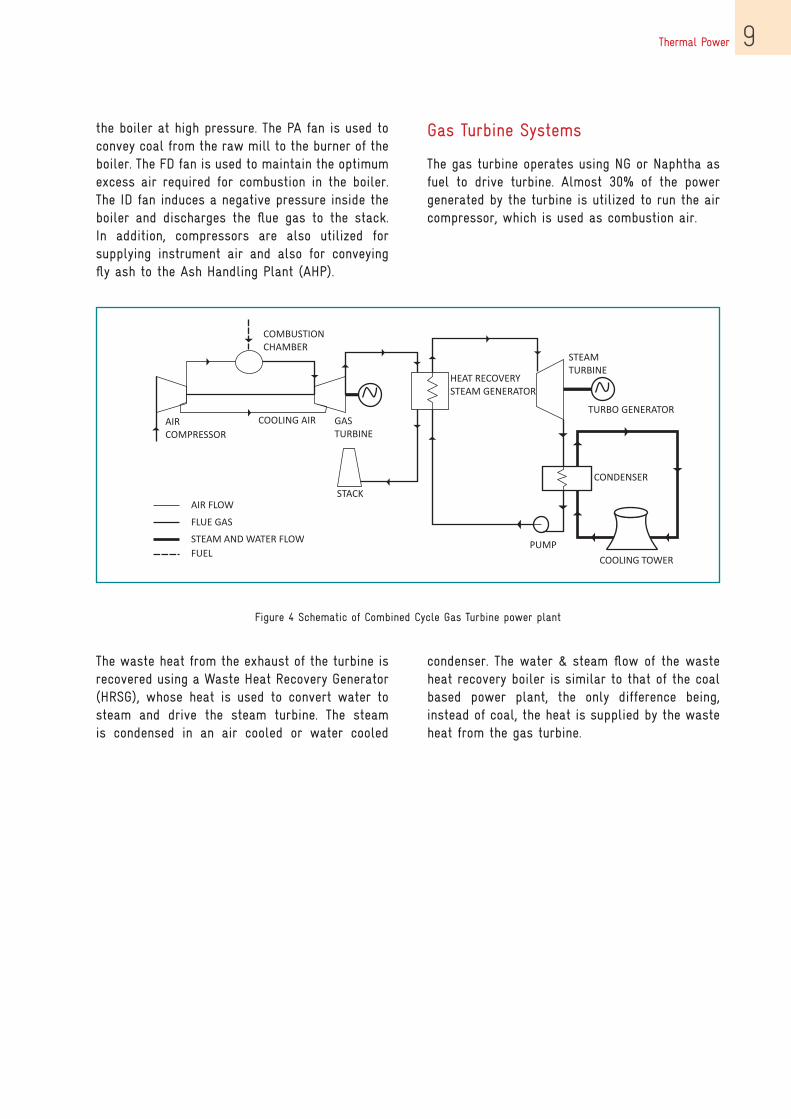
Figure 4 Schematic of Combined Cycle Gas Turbine power plant
the boiler at high pressure. The PA fan is used to convey coal from the raw mill to the burner of the boiler. The FD fan is used to maintain the optimum excess air required for combustion in the boiler. The ID fan induces a negative pressure inside the boiler and discharges the flue gas to the stack. In addition, compressors are also utilized for supplying instrument air and also for conveying fly ash to the Ash Handling Plant (AHP).
Gas Turbine Systems
The gas turbine operates using NG or Naphtha as fuel to drive turbine. Almost 30% of the power generated by the turbine is utilized to run the air compressor, which is used as combustion air.
The waste heat from the exhaust of the turbine is recovered using a Waste Heat Recovery Generator (HRSG), whose heat is used to convert water to steam and drive the steam turbine. The steam is condensed in an air cooled or water cooled
condenser. The water & steam flow of the waste heat recovery boiler is similar to that of the coal based power plant, the only difference being, instead of coal, the heat is supplied by the waste heat from the gas turbine.

Thermal Power10
4. Methodology adopted for the project
The activities initiated with collection of sector specific data from Bureau of Energy Efficiency (BEE). In addition, other additional data was also collected through secondary research. The collected data were analysed to assess the impact of PAT Cycle - I on energy intensity and Business as usual vs PAT scenario, GDP of the
country, trend analysis for energy efficiency, quantification of energy saving in terms of toe and coal saving. A feedback was also collected from designated consumers on benefits and the challenges experienced through the PAT scheme.
DATA COLLECTION
• Sector specific data from Bureau of Energy efficiency
• GDP of the country
• Benchmarking
• Miscelleneous data through Secondary research
DATA ANALYSIS
• Analysis of sector specific data and finding out Net Heat Rate of individual processes based on PAT scheme
• Identifying GDP contribution of the sector• Assumptions considered for calculations for the sector
FEEDBACK FROM PAT DESIGNATED
CONSUMERS
• Identifying key senior people from sectors
• Contacting Designated consumers and collecting feedback on PAT scheme
SUCCESS STORIES
• Shortlisting of case studies
• Visit to specific plants to obtain information on Case studies
• Preparation of case studies and sharing case studies with plant team
Figure 5: Methodology followed for Impact assessment of PAT Cycle - I
The case studies were shortlisted based on higher savings, low cost implementation, innovative and with high replication potential across the sector. With the assistance of BEE, GIZ, various plant visits were scheduled and conducted across
various sectors to study the technical benefits and challenges of implementing the projects. Based on the feedback from the respective plant team, success stories were developed on the same.
Thermal Power 11
5. PAT Cycle-I and its impact on Thermal Power Sector
PAT scheme’s primary goal is to reduce energy consumption by assigning time bound targets to the designated consumers. Any gain or shortfall in meeting the target is traded by using ESCerts, where 1 ESCert is equivalent to 1 MTOE of energy saving. This scheme is regulated by Bureau of Energy Efficiency (BEE). The existing power exchanges facilitate trading of ESCerts among DCs.
PAT Cycle – I started from 2012, with its baseline from financial years 2007 – 08 to 2009 –10. The average value of Net Heat Rate of the plant was
taken for three years. The minimum threshold considered were based on the sectors. The minimum energy consumption of thermal power sector is 30,000 MTOE above which the plant is declared as a Designated Consumer (DC).
Of the 144 nos. of designated consumers, the total reported energy consumption of these designated consumers was about 104.56 million TOE. These DCs were given a target of 3.21 million TOE energy consumption reduction, which was around 48% of the total energy reduction target under PAT Cycle - I.
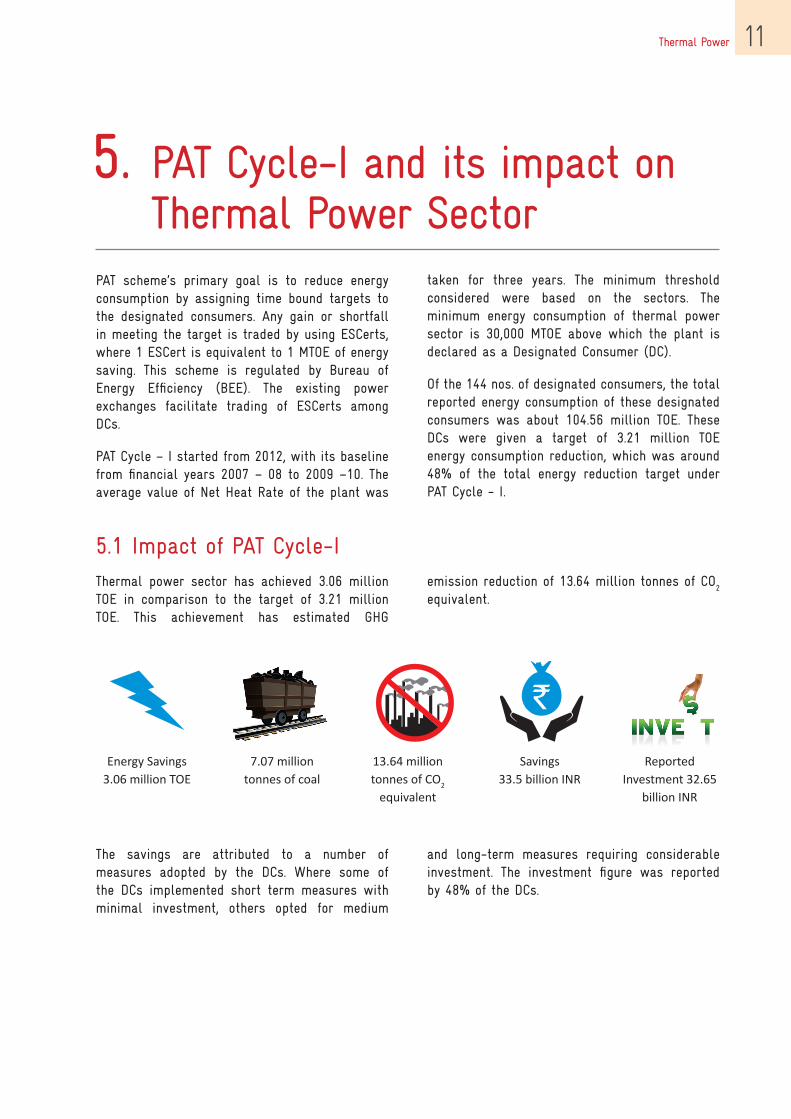
5.1 Impact of PAT Cycle-I Thermal power sector has achieved 3.06 million TOE in comparison to the target of 3.21 million TOE. This achievement has estimated GHG
emission reduction of 13.64 million tonnes of CO2
equivalent.
The savings are attributed to a number of measures adopted by the DCs. Where some of the DCs implemented short term measures with minimal investment, others opted for medium
Energy Savings2.1 million tonnesof oil equivalent
4.9 milliontonnes of
coal
6.51 milliontonnes of Co2
equivalent
Savings23 billion
INR
ReportedInvestment
61.75 billion INR
`
and long-term measures requiring considerable investment. The investment figure was reported by 48% of the DCs.
Energy Savings 3.06 million TOE
7.07 million tonnes of coal
13.64 million tonnes of CO2
equivalent
Savings 33.5 billion INR
Reported Investment 32.65
billion INR
Thermal Power12
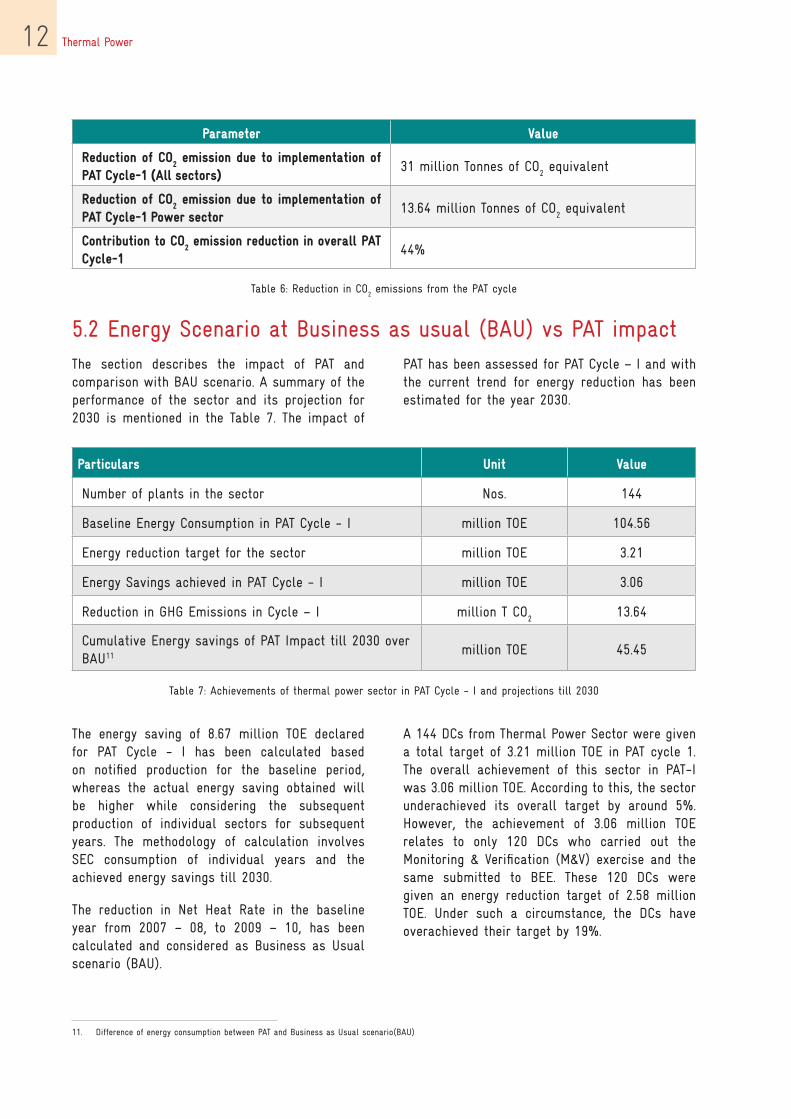
Parameter Value
Reduction of CO2 emission due to implementation of
PAT Cycle-1 (All sectors)31 million Tonnes of CO
2 equivalent
Reduction of CO2 emission due to implementation of
PAT Cycle-1 Power sector13.64 million Tonnes of CO
2 equivalent
Contribution to CO2 emission reduction in overall PAT
Cycle-144%
Table 6: Reduction in CO2 emissions from the PAT cycle
Particulars Unit Value
Number of plants in the sector Nos. 144
Baseline Energy Consumption in PAT Cycle - I million TOE 104.56
Energy reduction target for the sector million TOE 3.21
Energy Savings achieved in PAT Cycle - I million TOE 3.06
Reduction in GHG Emissions in Cycle – I million T CO2
13.64
Cumulative Energy savings of PAT Impact till 2030 over BAU11 million TOE 45.45
Table 7: Achievements of thermal power sector in PAT Cycle - I and projections till 2030
5.2 Energy Scenario at Business as usual (BAU) vs PAT impactPAT has been assessed for PAT Cycle – I and with the current trend for energy reduction has been estimated for the year 2030.
The section describes the impact of PAT and comparison with BAU scenario. A summary of the performance of the sector and its projection for 2030 is mentioned in the Table 7. The impact of
The energy saving of 8.67 million TOE declared for PAT Cycle - I has been calculated based on notified production for the baseline period, whereas the actual energy saving obtained will be higher while considering the subsequent production of individual sectors for subsequent years. The methodology of calculation involves SEC consumption of individual years and the achieved energy savings till 2030.
The reduction in Net Heat Rate in the baseline year from 2007 – 08, to 2009 – 10, has been calculated and considered as Business as Usual scenario (BAU).
A 144 DCs from Thermal Power Sector were given a total target of 3.21 million TOE in PAT cycle 1. The overall achievement of this sector in PAT-I was 3.06 million TOE. According to this, the sector underachieved its overall target by around 5%. However, the achievement of 3.06 million TOE relates to only 120 DCs who carried out the Monitoring & Verification (M&V) exercise and the same submitted to BEE. These 120 DCs were given an energy reduction target of 2.58 million TOE. Under such a circumstance, the DCs have overachieved their target by 19%.
11. Difference of energy consumption between PAT and Business as Usual scenario(BAU)
Thermal Power 13
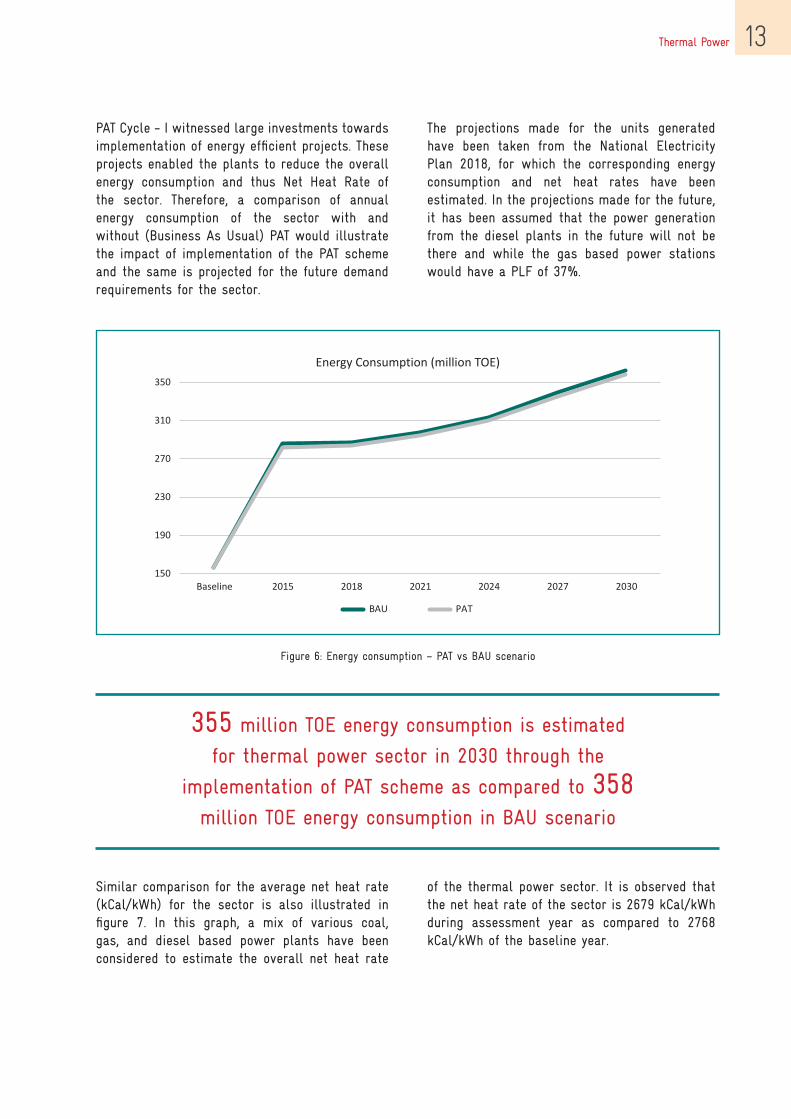
Figure 6: Energy consumption – PAT vs BAU scenario
355 million TOE energy consumption is estimated
for thermal power sector in 2030 through the
implementation of PAT scheme as compared to 358
million TOE energy consumption in BAU scenario
PAT Cycle - I witnessed large investments towards implementation of energy efficient projects. These projects enabled the plants to reduce the overall energy consumption and thus Net Heat Rate of the sector. Therefore, a comparison of annual energy consumption of the sector with and without (Business As Usual) PAT would illustrate the impact of implementation of the PAT scheme and the same is projected for the future demand requirements for the sector.
Similar comparison for the average net heat rate (kCal/kWh) for the sector is also illustrated in figure 7. In this graph, a mix of various coal, gas, and diesel based power plants have been considered to estimate the overall net heat rate
The projections made for the units generated have been taken from the National Electricity Plan 2018, for which the corresponding energy consumption and net heat rates have been estimated. In the projections made for the future, it has been assumed that the power generation from the diesel plants in the future will not be there and while the gas based power stations would have a PLF of 37%.
of the thermal power sector. It is observed that the net heat rate of the sector is 2679 kCal/kWh during assessment year as compared to 2768 kCal/kWh of the baseline year.

Thermal Power14
It can be inferred that the implementation of the PAT scheme would result in total energy reduction of 45.45 million TOE till 2030.
Figure 7 Business as usual (BAU) vs with PAT – Average sector net heat rate
Figure 8: A view of Thermal Power Plant
Thermal Power 15
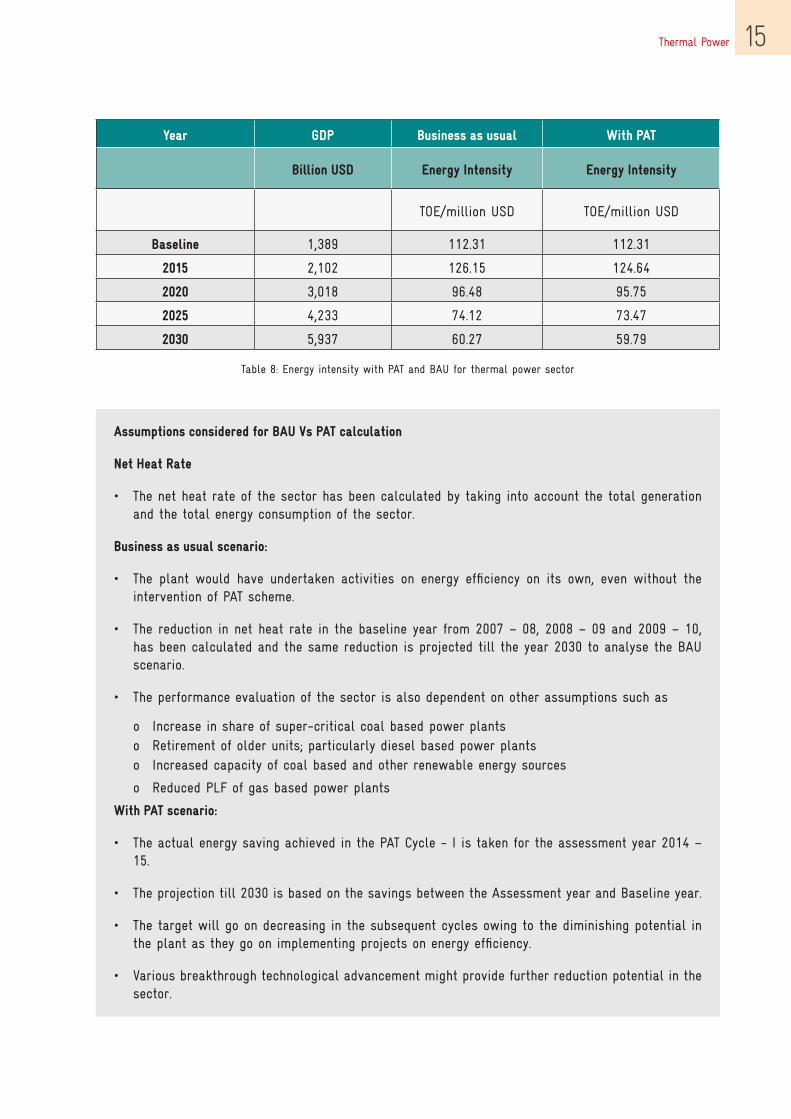
Assumptions considered for BAU Vs PAT calculation
Net Heat Rate
• The net heat rate of the sector has been calculated by taking into account the total generation and the total energy consumption of the sector.
Business as usual scenario:
• The plant would have undertaken activities on energy efficiency on its own, even without the intervention of PAT scheme.
• The reduction in net heat rate in the baseline year from 2007 – 08, 2008 – 09 and 2009 – 10, has been calculated and the same reduction is projected till the year 2030 to analyse the BAU scenario.
• The performance evaluation of the sector is also dependent on other assumptions such as
o Increase in share of super-critical coal based power plantso Retirement of older units; particularly diesel based power plantso Increased capacity of coal based and other renewable energy sources
o Reduced PLF of gas based power plants
With PAT scenario:
• The actual energy saving achieved in the PAT Cycle - I is taken for the assessment year 2014 – 15.
• The projection till 2030 is based on the savings between the Assessment year and Baseline year.
• The target will go on decreasing in the subsequent cycles owing to the diminishing potential in the plant as they go on implementing projects on energy efficiency.
• Various breakthrough technological advancement might provide further reduction potential in the sector.
Year GDP Business as usual With PAT
Billion USD Energy Intensity Energy Intensity
TOE/million USD TOE/million USD
Baseline 1,389 112.31 112.31
2015 2,102 126.15 124.64
2020 3,018 96.48 95.75
2025 4,233 74.12 73.47
2030 5,937 60.27 59.79
Table 8: Energy intensity with PAT and BAU for thermal power sector
Thermal Power16
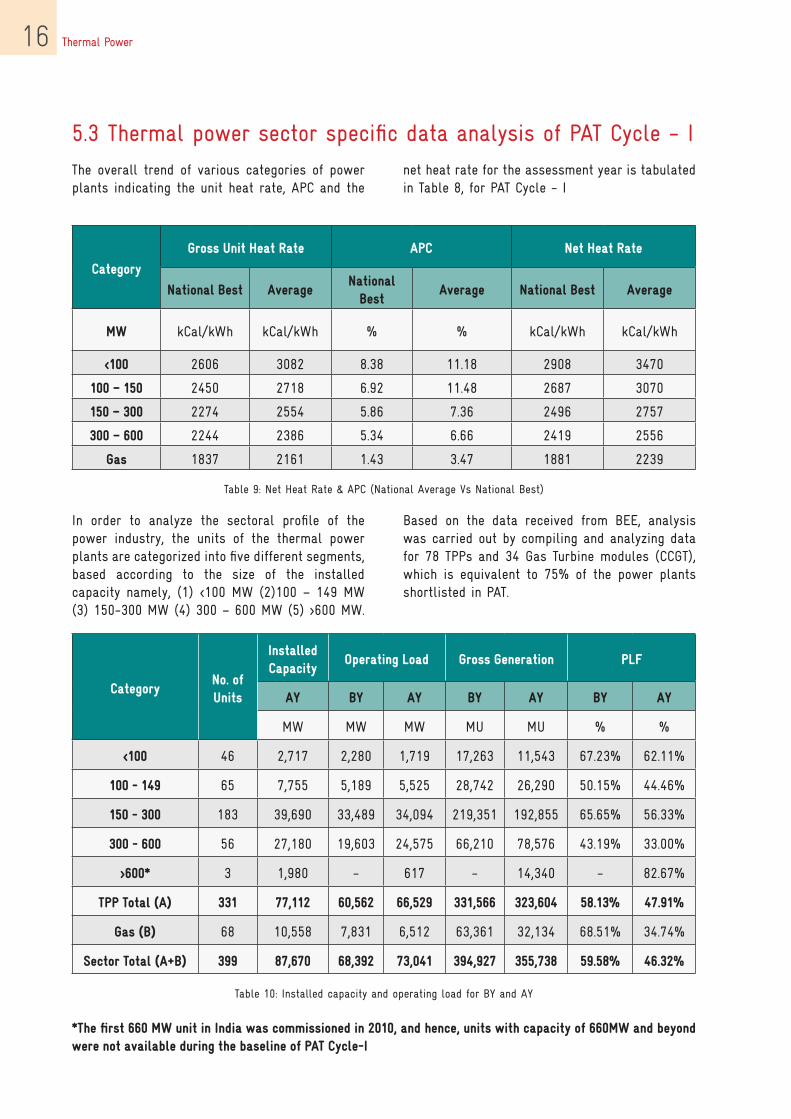
5.3 Thermal power sector specific data analysis of PAT Cycle - I The overall trend of various categories of power plants indicating the unit heat rate, APC and the
In order to analyze the sectoral profile of the power industry, the units of the thermal power plants are categorized into five different segments, based according to the size of the installed capacity namely, (1) <100 MW (2)100 – 149 MW (3) 150-300 MW (4) 300 – 600 MW (5) >600 MW.
*The first 660 MW unit in India was commissioned in 2010, and hence, units with capacity of 660MW and beyond were not available during the baseline of PAT Cycle-I
net heat rate for the assessment year is tabulated in Table 8, for PAT Cycle - I
Based on the data received from BEE, analysis was carried out by compiling and analyzing data for 78 TPPs and 34 Gas Turbine modules (CCGT), which is equivalent to 75% of the power plants shortlisted in PAT.
Category
Gross Unit Heat Rate APC Net Heat Rate
National Best AverageNational
BestAverage National Best Average
MW kCal/kWh kCal/kWh % % kCal/kWh kCal/kWh
<100 2606 3082 8.38 11.18 2908 3470
100 – 150 2450 2718 6.92 11.48 2687 3070
150 – 300 2274 2554 5.86 7.36 2496 2757
300 – 600 2244 2386 5.34 6.66 2419 2556
Gas 1837 2161 1.43 3.47 1881 2239
Table 9: Net Heat Rate & APC (National Average Vs National Best)
CategoryNo. of Units
Installed Capacity
Operating load Gross Generation PlF
AY BY AY BY AY BY AY
MW MW MW MU MU % %
<100 46 2,717 2,280 1,719 17,263 11,543 67.23% 62.11%
100 - 149 65 7,755 5,189 5,525 28,742 26,290 50.15% 44.46%
150 - 300 183 39,690 33,489 34,094 219,351 192,855 65.65% 56.33%
300 - 600 56 27,180 19,603 24,575 66,210 78,576 43.19% 33.00%
>600* 3 1,980 - 617 - 14,340 - 82.67%
TPP Total (A) 331 77,112 60,562 66,529 331,566 323,604 58.13% 47.91%
Gas (B) 68 10,558 7,831 6,512 63,361 32,134 68.51% 34.74%
Sector Total (A+B) 399 87,670 68,392 73,041 394,927 355,738 59.58% 46.32%
Table 10: Installed capacity and operating load for BY and AY

Thermal Power 17
In order to analyze the sectoral profile of the power industry, the units of the thermal power plants are categorized into five different segments, based according to the size of the installed capacity namely, (1) <100 MW (2)100 – 149 MW (3) 150-300 MW (4) 300 – 600 MW (5) >600 MW.
Similar comparisons were made to analyze the trend of average unit heat rate and the net heat of the corresponding categories. Based on the analysis, the trend of the same was also evaluated. The unit heat rate of all the categories, with the exception of 300 – 600 MW units, have decreased by at least 2% (on weighted average) for the thermal power plants. The unit heat rate
Based on the data received from BEE, analysis was carried out by compiling and analyzing data for 78 TPPs and 34 Gas Turbine modules (CCGT), which is equivalent to 75% of the power plants shortlisted in PAT.
of 300 – 600 MW segment and the gas turbine modules increased by at least 2%. Majority of the units operate with gross unit heat rates deviating by up to 10% with respect to the design heat rate, wherein the plant load factor and decreasing gross generation have been detrimental to the gross unit heat rate.
% Increase
CategoryOp. load Gross Generation
% %
<100 -24.63 -33.13
100 - 149 6.47 -8.53
150 - 300 1.81 -12.08
300 - 600 25.36 18.68
>600 - -
TPP Total 9.85 -2.4
Gas -16.84 -49.28
Sector Total 6.8 -9.92
Table 11: Percentage increase or decrease of operating capacity and gross generation
Category
Gross Unit Heat Rate (Wt. Avg)
Design BY AY Range BY Range AY
kCal/kWh kCal/kWh kCal/kWh kCal/kWh kCal/kWh
<100 3,476 3,205 3,082 2,606 – 3,886 2,606 – 3,940
100 – 149 2,802 2,967 2,718 2,321 – 3,886 2,213 – 2,678
150 – 300 2,306 2,603 2,554 2,275 – 3,182 2,273 – 3,138
300 – 600 2,263 2,326 2,386 2,226 – 2,976 2,244 – 2,835
>600 2,207 - 2,284 - 2,272 – 2,293
Gas 1,956 2,114 2,161 1,807 – 4,503 1,837 – 4,780
Table 12: Unit Heat Rate comparison of assessment and baseline year
Thermal Power18
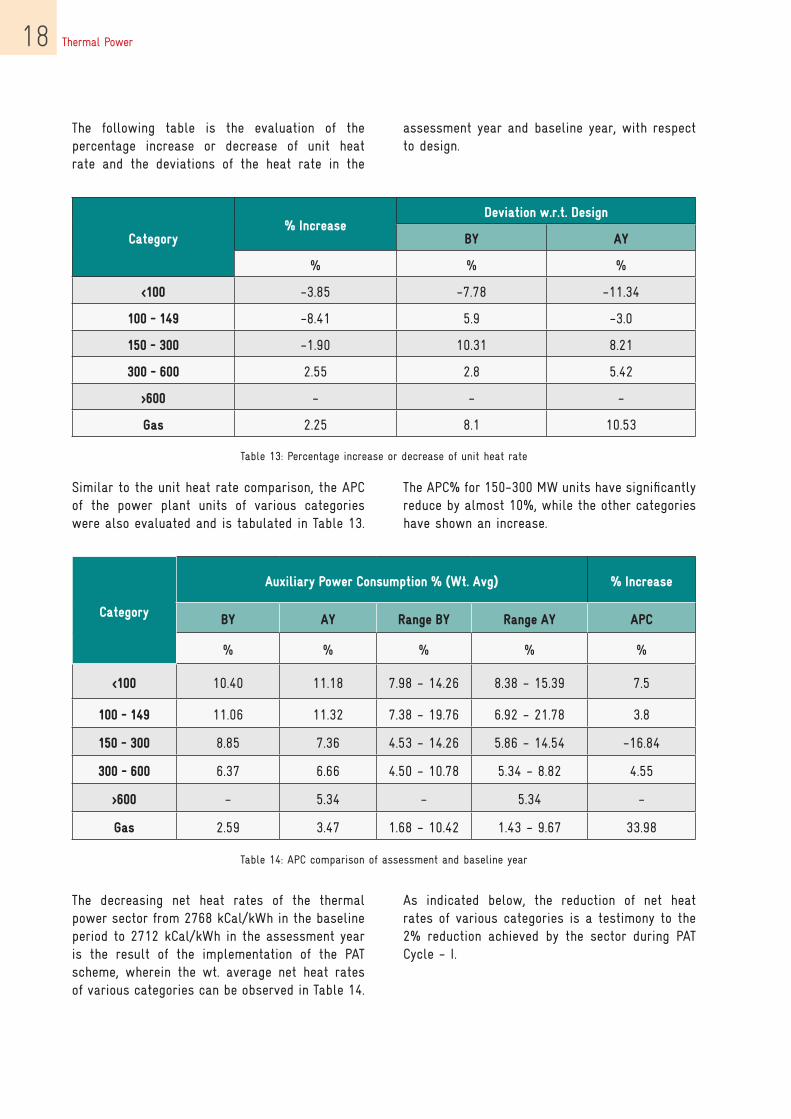
The following table is the evaluation of the percentage increase or decrease of unit heat rate and the deviations of the heat rate in the
Similar to the unit heat rate comparison, the APC of the power plant units of various categories were also evaluated and is tabulated in Table 13.
The decreasing net heat rates of the thermal power sector from 2768 kCal/kWh in the baseline period to 2712 kCal/kWh in the assessment year is the result of the implementation of the PAT scheme, wherein the wt. average net heat rates of various categories can be observed in Table 14.
assessment year and baseline year, with respect to design.
The APC% for 150-300 MW units have significantly reduce by almost 10%, while the other categories have shown an increase.
As indicated below, the reduction of net heat rates of various categories is a testimony to the 2% reduction achieved by the sector during PAT Cycle - I.
Category% Increase
Deviation w.r.t. Design
BY AY
% % %
<100 -3.85 -7.78 -11.34
100 - 149 -8.41 5.9 -3.0
150 - 300 -1.90 10.31 8.21
300 - 600 2.55 2.8 5.42
>600 - - -
Gas 2.25 8.1 10.53
Table 13: Percentage increase or decrease of unit heat rate
Category
Auxiliary Power Consumption % (Wt. Avg) % Increase
BY AY Range BY Range AY APC
% % % % %
<100 10.40 11.18 7.98 - 14.26 8.38 - 15.39 7.5
100 - 149 11.06 11.32 7.38 - 19.76 6.92 - 21.78 3.8
150 - 300 8.85 7.36 4.53 - 14.26 5.86 - 14.54 -16.84
300 - 600 6.37 6.66 4.50 - 10.78 5.34 - 8.82 4.55
>600 - 5.34 - 5.34 -
Gas 2.59 3.47 1.68 - 10.42 1.43 - 9.67 33.98
Table 14: APC comparison of assessment and baseline year
Thermal Power 19
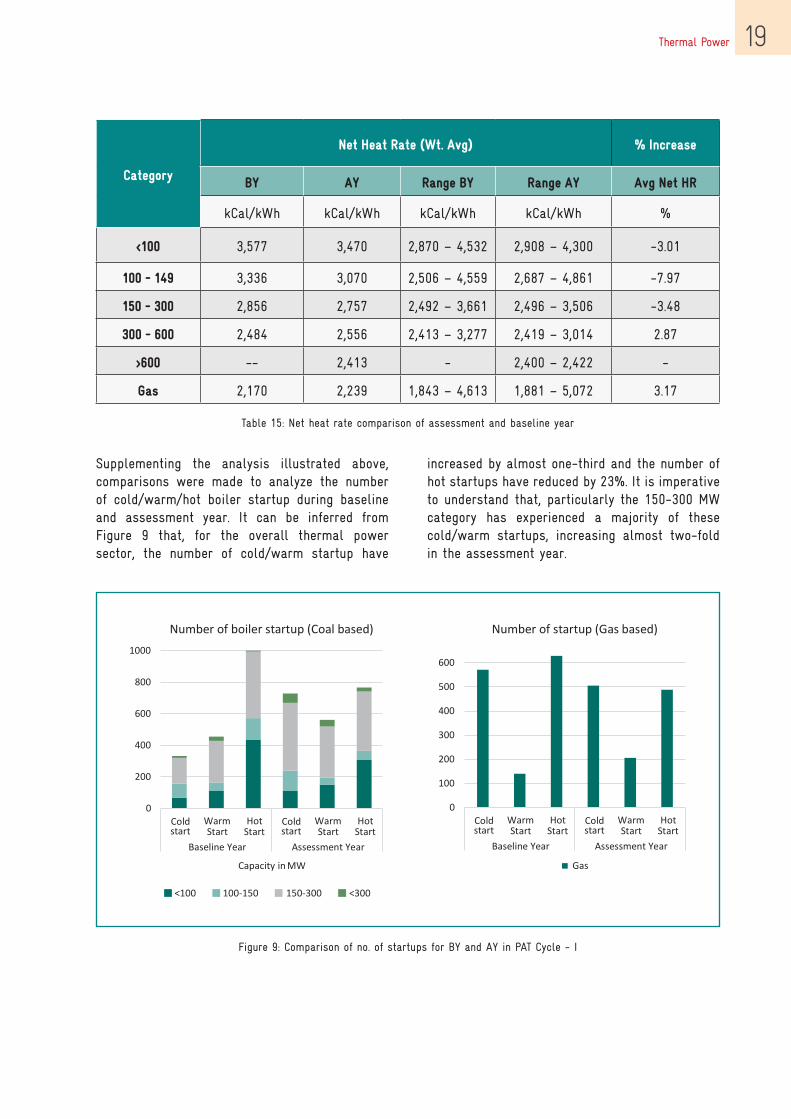
Supplementing the analysis illustrated above, comparisons were made to analyze the number of cold/warm/hot boiler startup during baseline and assessment year. It can be inferred from Figure 9 that, for the overall thermal power sector, the number of cold/warm startup have
Category
Net Heat Rate (Wt. Avg) % Increase
BY AY Range BY Range AY Avg Net HR
kCal/kWh kCal/kWh kCal/kWh kCal/kWh %
<100 3,577 3,470 2,870 – 4,532 2,908 – 4,300 -3.01
100 - 149 3,336 3,070 2,506 – 4,559 2,687 – 4,861 -7.97
150 - 300 2,856 2,757 2,492 – 3,661 2,496 – 3,506 -3.48
300 - 600 2,484 2,556 2,413 – 3,277 2,419 – 3,014 2.87
>600 -- 2,413 - 2,400 – 2,422 -
Gas 2,170 2,239 1,843 – 4,613 1,881 – 5,072 3.17
Table 15: Net heat rate comparison of assessment and baseline year
increased by almost one-third and the number of hot startups have reduced by 23%. It is imperative to understand that, particularly the 150-300 MW category has experienced a majority of these cold/warm startups, increasing almost two-fold in the assessment year.
Figure 9: Comparison of no. of startups for BY and AY in PAT Cycle - I
Thermal Power20
The variation in the number of cold/warm/hot startups can be attributed to various factors:
• Decreasing PLF of the power sector/Load scheduling
• Resource unavailability (fuel, water, etc.)
• Environmental compliances
• Surplus electricity resulting in lower peak
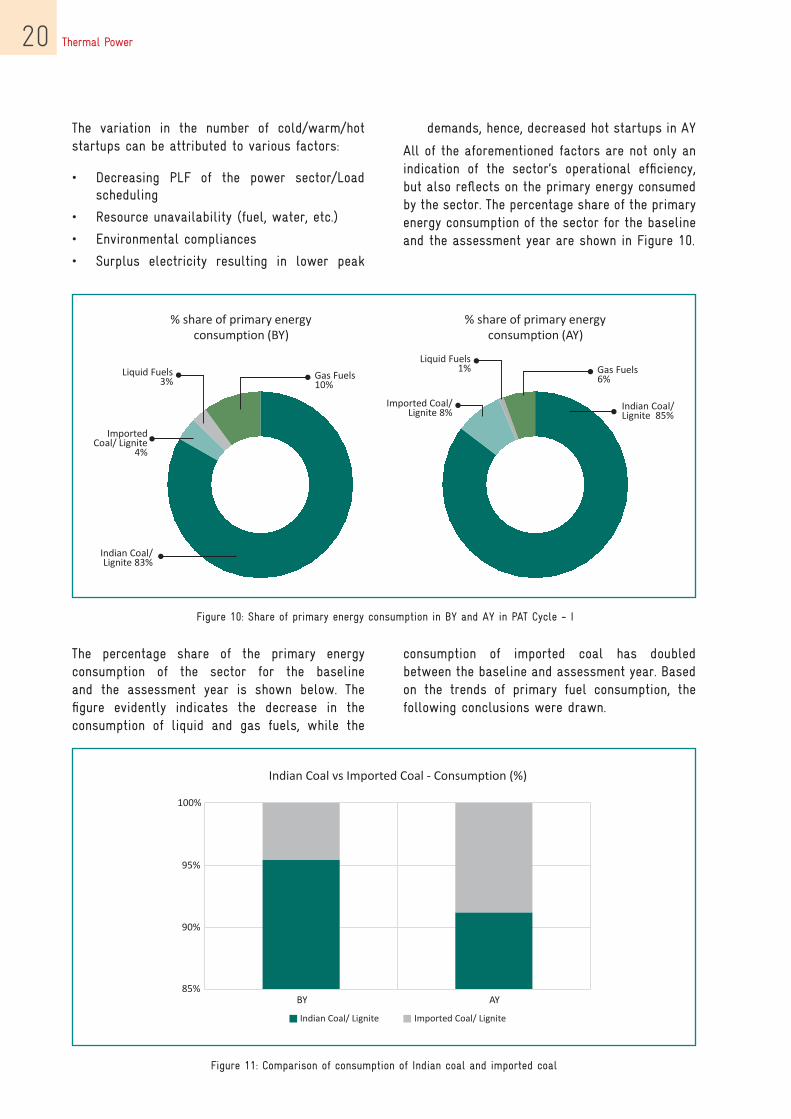
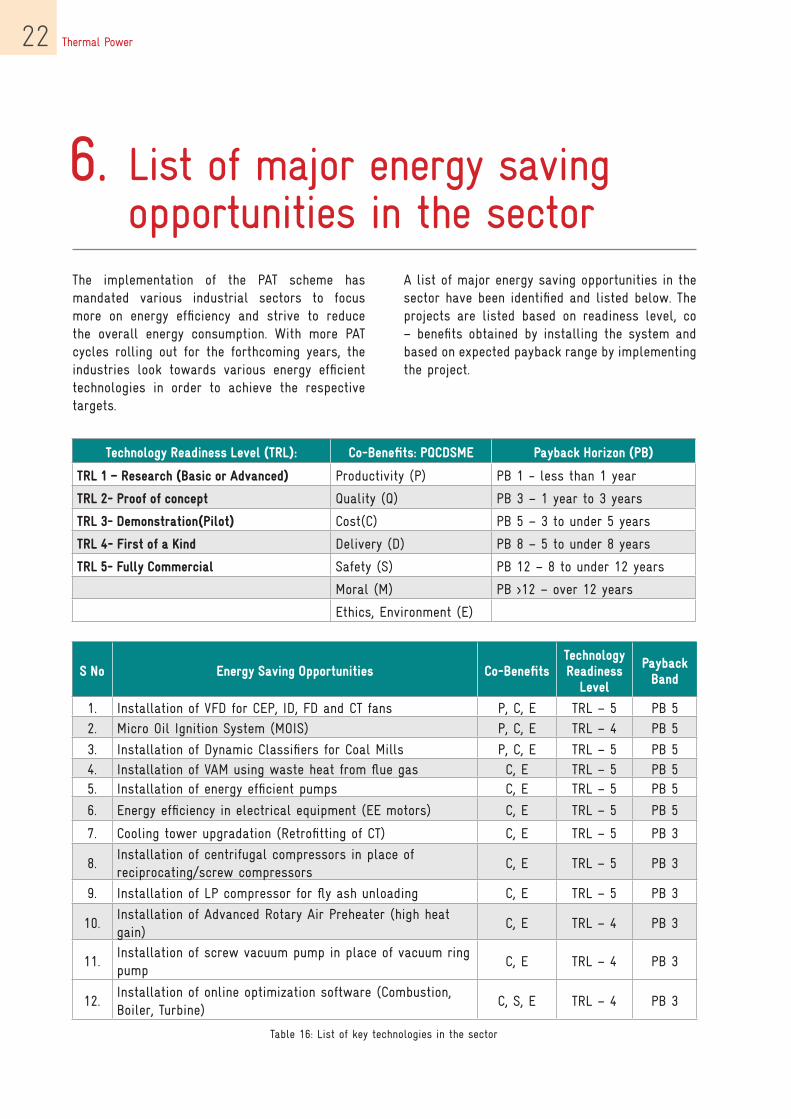
The percentage share of the primary energy consumption of the sector for the baseline and the assessment year is shown below. The figure evidently indicates the decrease in the consumption of liquid and gas fuels, while the
demands, hence, decreased hot startups in AY
All of the aforementioned factors are not only an indication of the sector’s operational efficiency, but also reflects on the primary energy consumed by the sector. The percentage share of the primary energy consumption of the sector for the baseline and the assessment year are shown in Figure 10.
Figure 10: Share of primary energy consumption in BY and AY in PAT Cycle - I
Figure 11: Comparison of consumption of Indian coal and imported coal
consumption of imported coal has doubled between the baseline and assessment year. Based on the trends of primary fuel consumption, the following conclusions were drawn.

Thermal Power 21
• Demand & Supply gap of coal: With India’s coal reserves being able to cater to only 75% of coal requirements, and the demand for coal is increasing at a CAGR of 6% every year, the imports of coal have increased substantially in order to avoid fuel shortages.
• Fuel quality of coal: India’s domestic coal is characterized as a fuel with low GCV, high ash content and high moisture content, and the alternative to blend domestic coal with imported coal provides impetus to the generating stations to operate more efficiently. The increase in imported coal consumption has increased by 4.2% as shown in Figure 11
• Increase in installed capacity: With the commissioning of larger power plants, and increase in the operating load of medium capacity (300-500 MW) power plants, has resulted in increased demand for coal
• Unavailability of gas: The utilization of NG fuel has witnessed a 4% decline between the baseline and the assessment year, majorly attributing to the low availability of gas fuel.
• Shutdown of diesel based plants: Owing to various environmental compliances and high cost of generation, various diesel based plants are also being shut down, therefore resulting in reduced consumption of liquid based fuels.
Thermal Power22
6. List of major energy saving opportunities in the sector
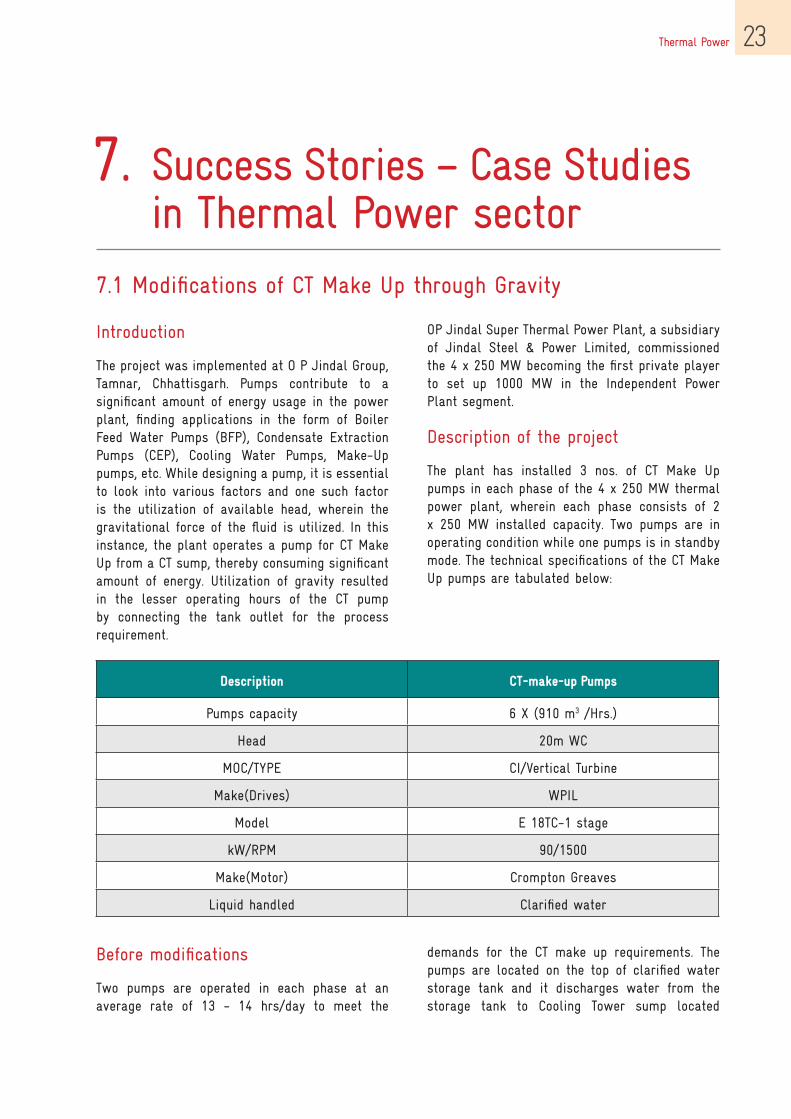
The implementation of the PAT scheme has mandated various industrial sectors to focus more on energy efficiency and strive to reduce the overall energy consumption. With more PAT cycles rolling out for the forthcoming years, the industries look towards various energy efficient technologies in order to achieve the respective targets.
A list of major energy saving opportunities in the sector have been identified and listed below. The projects are listed based on readiness level, co – benefits obtained by installing the system and based on expected payback range by implementing the project.
Technology Readiness level (TRl): Co-Benefits: PQCDSME Payback Horizon (PB)
TRl 1 – Research (Basic or Advanced) Productivity (P) PB 1 - less than 1 year
TRl 2- Proof of concept Quality (Q) PB 3 – 1 year to 3 years
TRl 3- Demonstration(Pilot) Cost(C) PB 5 – 3 to under 5 years
TRl 4- First of a Kind Delivery (D) PB 8 – 5 to under 8 years
TRl 5- Fully Commercial Safety (S) PB 12 – 8 to under 12 years
Moral (M) PB >12 – over 12 years
Ethics, Environment (E)
S No Energy Saving Opportunities Co-BenefitsTechnology Readiness
level
Payback Band
1. Installation of VFD for CEP, ID, FD and CT fans P, C, E TRL – 5 PB 52. Micro Oil Ignition System (MOIS) P, C, E TRL – 4 PB 5
3. Installation of Dynamic Classifiers for Coal Mills P, C, E TRL – 5 PB 54. Installation of VAM using waste heat from flue gas C, E TRL – 5 PB 55. Installation of energy efficient pumps C, E TRL – 5 PB 5
6. Energy efficiency in electrical equipment (EE motors) C, E TRL – 5 PB 5
7. Cooling tower upgradation (Retrofitting of CT) C, E TRL – 5 PB 3
8.Installation of centrifugal compressors in place of reciprocating/screw compressors
C, E TRL – 5 PB 3
9. Installation of LP compressor for fly ash unloading C, E TRL – 5 PB 3
10.Installation of Advanced Rotary Air Preheater (high heat gain)
C, E TRL – 4 PB 3
11.Installation of screw vacuum pump in place of vacuum ring pump
C, E TRL – 4 PB 3
12.Installation of online optimization software (Combustion, Boiler, Turbine)
C, S, E TRL – 4 PB 3
Table 16: List of key technologies in the sector
Thermal Power 23
7. Success Stories – Case Studies in Thermal Power sector
7.1 Modifications of CT Make Up through Gravity
Introduction
The project was implemented at O P Jindal Group, Tamnar, Chhattisgarh. Pumps contribute to a significant amount of energy usage in the power plant, finding applications in the form of Boiler Feed Water Pumps (BFP), Condensate Extraction Pumps (CEP), Cooling Water Pumps, Make-Up pumps, etc. While designing a pump, it is essential to look into various factors and one such factor is the utilization of available head, wherein the gravitational force of the fluid is utilized. In this instance, the plant operates a pump for CT Make Up from a CT sump, thereby consuming significant amount of energy. Utilization of gravity resulted in the lesser operating hours of the CT pump by connecting the tank outlet for the process requirement.
OP Jindal Super Thermal Power Plant, a subsidiary of Jindal Steel & Power Limited, commissioned the 4 x 250 MW becoming the first private player to set up 1000 MW in the Independent Power Plant segment.
Description of the project
The plant has installed 3 nos. of CT Make Up pumps in each phase of the 4 x 250 MW thermal power plant, wherein each phase consists of 2 x 250 MW installed capacity. Two pumps are in operating condition while one pumps is in standby mode. The technical specifications of the CT Make Up pumps are tabulated below:
Description CT-make-up Pumps
Pumps capacity 6 X (910 m3 /Hrs.)
Head 20m WC
MOC/TYPE CI/Vertical Turbine
Make(Drives) WPIL
Model E 18TC-1 stage
kW/RPM 90/1500
Make(Motor) Crompton Greaves
Liquid handled Clarified water
Before modifications
Two pumps are operated in each phase at an average rate of 13 - 14 hrs/day to meet the
demands for the CT make up requirements. The pumps are located on the top of clarified water storage tank and it discharges water from the storage tank to Cooling Tower sump located
Thermal Power24
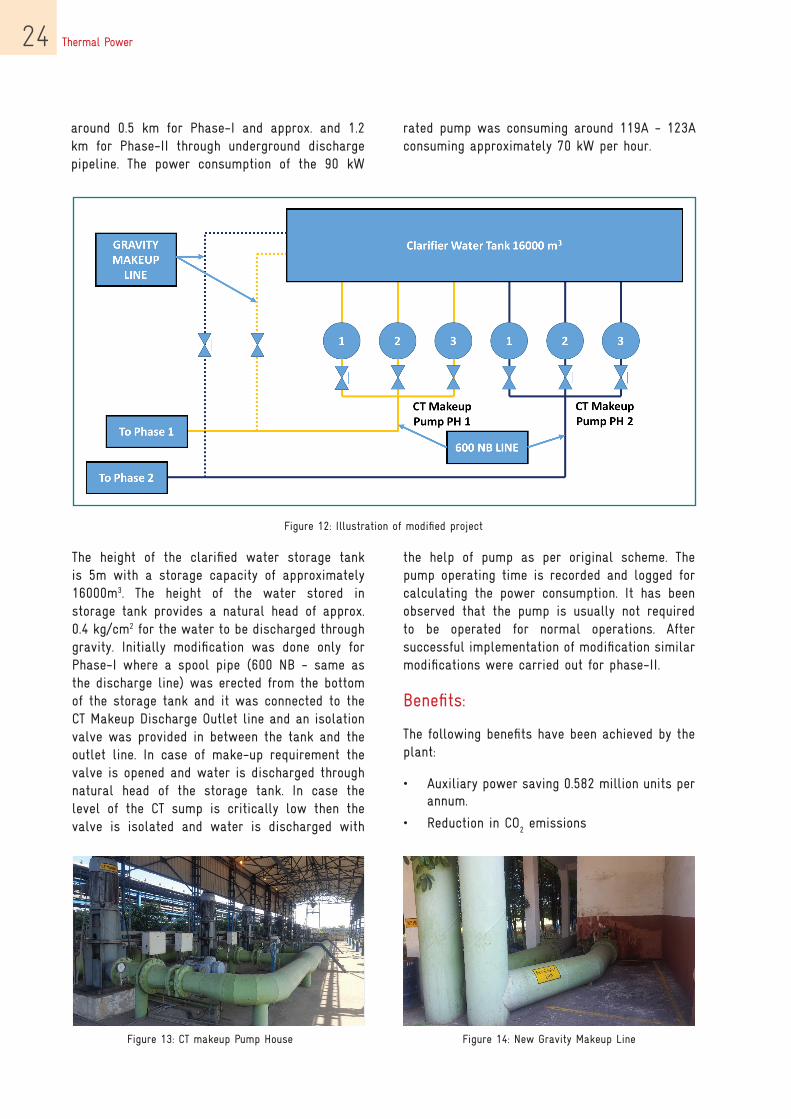
Figure 12: Illustration of modified project
Figure 13: CT makeup Pump House Figure 14: New Gravity Makeup Line
around 0.5 km for Phase-I and approx. and 1.2 km for Phase-II through underground discharge pipeline. The power consumption of the 90 kW
rated pump was consuming around 119A - 123A consuming approximately 70 kW per hour.
The height of the clarified water storage tank is 5m with a storage capacity of approximately 16000m3. The height of the water stored in storage tank provides a natural head of approx. 0.4 kg/cm2 for the water to be discharged through gravity. Initially modification was done only for Phase-I where a spool pipe (600 NB - same as the discharge line) was erected from the bottom of the storage tank and it was connected to the CT Makeup Discharge Outlet line and an isolation valve was provided in between the tank and the outlet line. In case of make-up requirement the valve is opened and water is discharged through natural head of the storage tank. In case the level of the CT sump is critically low then the valve is isolated and water is discharged with
the help of pump as per original scheme. The pump operating time is recorded and logged for calculating the power consumption. It has been observed that the pump is usually not required to be operated for normal operations. After successful implementation of modification similar modifications were carried out for phase-II.
Benefits:
The following benefits have been achieved by the plant:
• Auxiliary power saving 0.582 million units per annum.
• Reduction in CO2 emissions

Thermal Power 25
Introduction
The project was installed at NTPC, Ramagundam, Telangana. Most of the industrial process uses a lot of thermal energy by burning fossil fuel to produce steam or heat for the purpose. After the processes, heat is rejected to the surrounding as waste. This waste heat can be converted to useful refrigeration by using a heat operated refrigeration system, such as an absorption refrigeration cycle. Both vapour compression and absorption refrigeration cycles accomplish the removal of heat through the evaporation of a refrigerant at a low pressure and the rejection of
7.2 Low Grade Flue Gas based Vapour Absorption Machine (VAM)
heat through the condensation of the refrigerant at a higher pressure. The basic difference is that an electric chiller employs a mechanical compressor to create the pressure differences necessary to circulate the refrigerant whereas the absorption chillers use waste heat source and do not use a mechanical compressor.
National Thermal Power Corporation is a major power generation corporation in the country. NTPC Ramagundam, a part of National Thermal Power Corporation has installed capacity of 2600 MW; Stage 1: 3 units each of 200 MW, Stage 2: 3 units each of 500 MW, Stage 3: 1 unit of 500 MW.
Parameters Value
Energy savings 0.582 MU
MTOE equivalent savings 147.12 MTOE
Cost Savings Rs. 1.5 Million
Investment Rs. 0.06 Million
Payback(months) 1
GHG reduction 515 tCO2 equivalent of GHG reduced
Replication Potential15% of plants in the sector can opt for this technology
Reduction of 2,920 MTOE anticipated for the sector
Contact details for the project
Plant Name O P Jindal Group - Tamnar
Person to be contacted Pratik Bose
Designation Head – Technical Services
Contact number 9329444839
Email – ID [email protected]
Address for communication O P Jindal Group - Tamnar
Thermal Power26
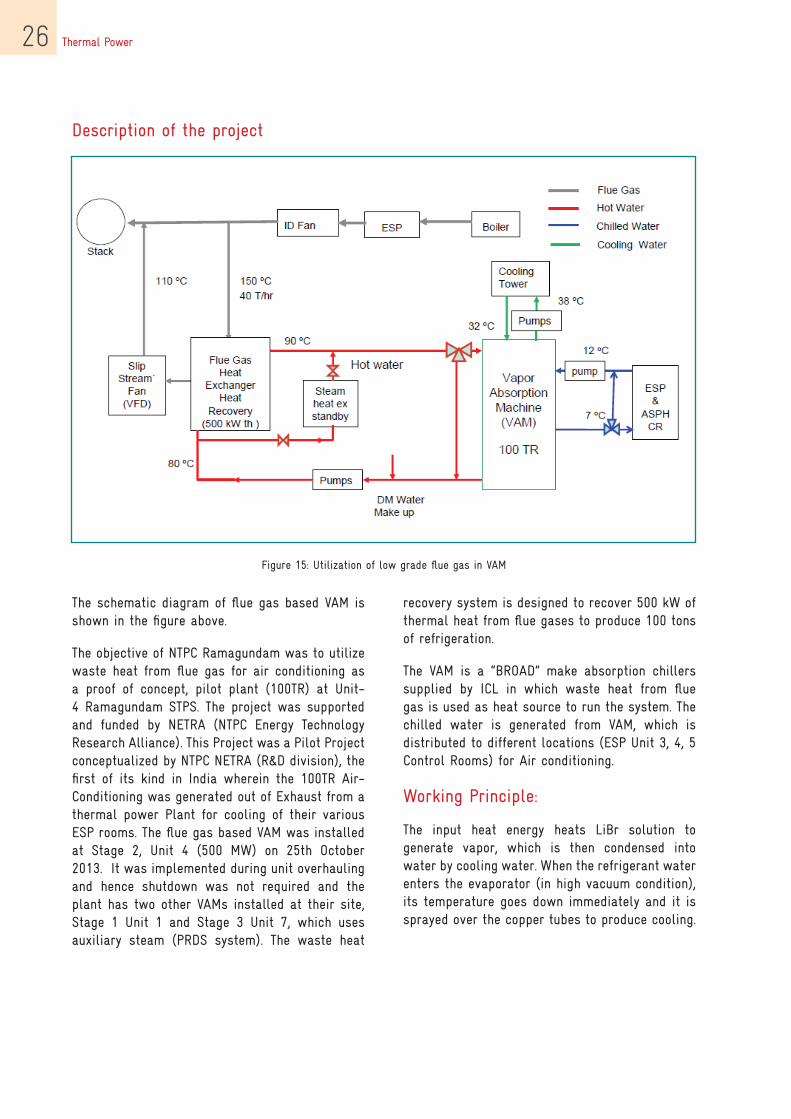
Figure 15: Utilization of low grade flue gas in VAM
Description of the project
The schematic diagram of flue gas based VAM is shown in the figure above.
The objective of NTPC Ramagundam was to utilize waste heat from flue gas for air conditioning as a proof of concept, pilot plant (100TR) at Unit-4 Ramagundam STPS. The project was supported and funded by NETRA (NTPC Energy Technology Research Alliance). This Project was a Pilot Project conceptualized by NTPC NETRA (R&D division), the first of its kind in India wherein the 100TR Air-Conditioning was generated out of Exhaust from a thermal power Plant for cooling of their various ESP rooms. The flue gas based VAM was installed at Stage 2, Unit 4 (500 MW) on 25th October 2013. It was implemented during unit overhauling and hence shutdown was not required and the plant has two other VAMs installed at their site, Stage 1 Unit 1 and Stage 3 Unit 7, which uses auxiliary steam (PRDS system). The waste heat
recovery system is designed to recover 500 kW of thermal heat from flue gases to produce 100 tons of refrigeration.
The VAM is a “BROAD” make absorption chillers supplied by ICL in which waste heat from flue gas is used as heat source to run the system. The chilled water is generated from VAM, which is distributed to different locations (ESP Unit 3, 4, 5 Control Rooms) for Air conditioning.
Working Principle:
The input heat energy heats LiBr solution to generate vapor, which is then condensed into water by cooling water. When the refrigerant water enters the evaporator (in high vacuum condition), its temperature goes down immediately and it is sprayed over the copper tubes to produce cooling.
Thermal Power 27
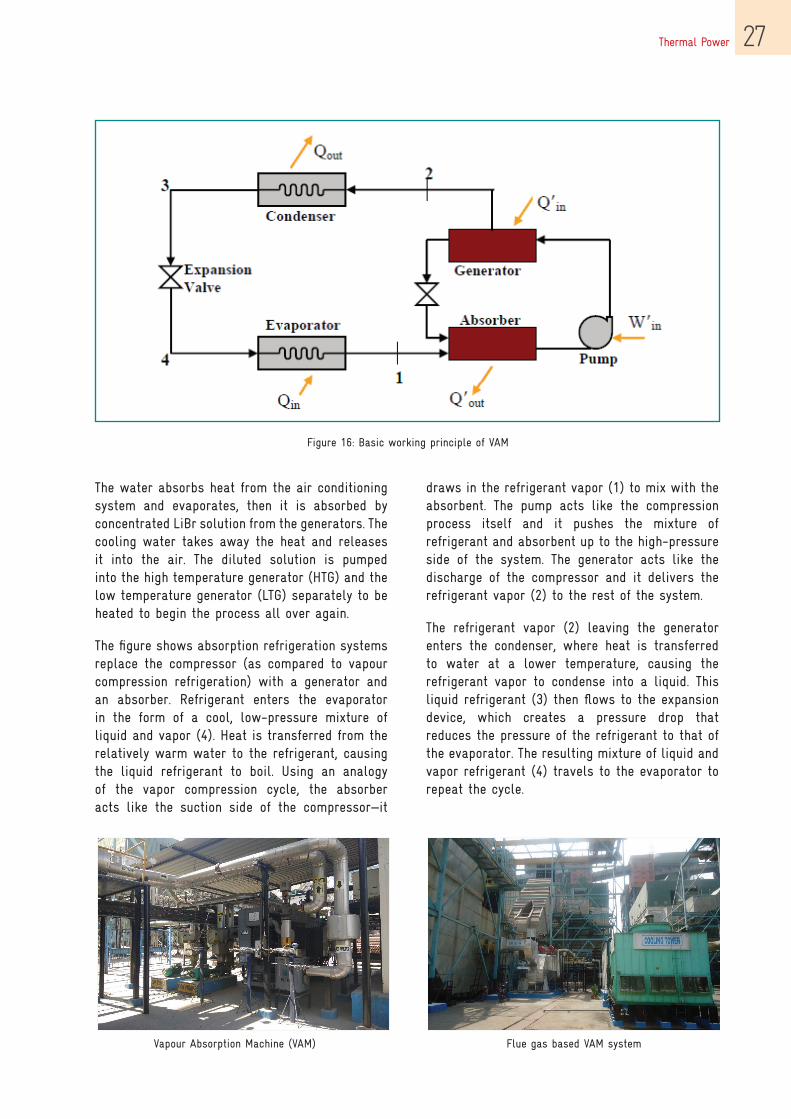
Figure 16: Basic working principle of VAM
The water absorbs heat from the air conditioning system and evaporates, then it is absorbed by concentrated LiBr solution from the generators. The cooling water takes away the heat and releases it into the air. The diluted solution is pumped into the high temperature generator (HTG) and the low temperature generator (LTG) separately to be heated to begin the process all over again.
The figure shows absorption refrigeration systems replace the compressor (as compared to vapour compression refrigeration) with a generator and an absorber. Refrigerant enters the evaporator in the form of a cool, low-pressure mixture of liquid and vapor (4). Heat is transferred from the relatively warm water to the refrigerant, causing the liquid refrigerant to boil. Using an analogy of the vapor compression cycle, the absorber acts like the suction side of the compressor—it
draws in the refrigerant vapor (1) to mix with the absorbent. The pump acts like the compression process itself and it pushes the mixture of refrigerant and absorbent up to the high-pressure side of the system. The generator acts like the discharge of the compressor and it delivers the refrigerant vapor (2) to the rest of the system.
The refrigerant vapor (2) leaving the generator enters the condenser, where heat is transferred to water at a lower temperature, causing the refrigerant vapor to condense into a liquid. This liquid refrigerant (3) then flows to the expansion device, which creates a pressure drop that reduces the pressure of the refrigerant to that of the evaporator. The resulting mixture of liquid and vapor refrigerant (4) travels to the evaporator to repeat the cycle.
Vapour Absorption Machine (VAM) Flue gas based VAM system
Thermal Power28
Benefits:
The following benefits have been achieved by the plant:
• Air conditioning using waste heat instead of electricity or auxiliary steam.
• Free from ozone depletion substances (R12/R22)
• Step toward 100% phase out of HCFC, as the VAM system is free from greenhouse gases
• Scale-up potential is good
Parameters Value
Energy savings 0.584 MU
MTOE equivalent savings 155.55 MTOE
Cost Savings Rs 1.34 Millions
Investment Rs. 10 Million
Payback(months) 90 Months
GHG reduction 525 tCO2 equivalent of GHG reduced
Replication Potential
40% of plants in the sector can opt for this technology
Reduction of 46,952 MTOE anticipated for the sector
Rs. 3,130 Million Investment potential for implementing this project in the sector
Contact details for the project
Plant Name NTPC Ramagundam
Person to be contacted Mr. Kosal Ram
Designation AGM (EEMG)
Contact number 9440918092
Email – ID [email protected]
Address for communication NTPC Ramagundam

Thermal Power 29
S No Company Name Technology Website link
1 Armstrong International Pvt. Ltd.
Steam and Condensate solutions; Utility systems & optimizations
www.armstronginternational.com
2 Cethar Ltd.Water/Waste water systems, Fuel/Material handling
www.cethar.com
3 Forbes MarshallSteam traps, Steam monitoring systems, condensate pumps, heat exchange solutions
www.forbesmarshall.com
4ISGEC Heavy Engineering Ltd.
Manufacturing & Supply of Power Plants; Boilers (Pulverized Coal fired Boilers, Oil & Gas fired Boilers, CFBC Boilers, AFBC Boilers, etc)
www.isgec.com
5L&T – MHPS Boilers Pvt Ltd
Pressure parts & pulverizers for supercritical boilers
www.lntmhps.com
6Paharpur Cooling Towers Ltd
Wet cooling towers, air cooled steam condensers, air cooled heat exchangers
www.paharpur.com
7 Lloyd Insulations
Rockwool Insulation, Ceramic Fibre, standing seam Roofing sheeting, Refractory work, Mechanical and Piping, electric Heat tracing, Fire-fighting system
lloydinsulations.com
8Sound Blast Sonic Power Co. Ltd.
Energy Efficient Technology sonic soot blowing
sound-blast.com
9 Thermax Ltd.
Heating Equipment, Absorption Chillers, Power & Captive Cogeneration Plants, Waste Heat Recovery Units, Air Pollution Control Equipment, Water & Waste Solutions
www.thermaxglobal.com
Table 17: List of key technology suppliers in Thermal Power Sector
8. List of Technology suppliers
Thermal Power30
Abbreviations
BBAU
Business as usual 2, 6, 16, 17, 18, 19
CCAGR
Compounded annual growth rate 9
CO2
Carbon dioxide 9, 10, 16
EESCerts
Energy saving certificates 5
GGDP
Gross domestic product 6, 7, 16
IIEA
International Energy Agency 9, 10
MmMTOE
million metric tonne of oil equivalent 16 million metric tonne oil equivalent 5
PPAT
Perform, Achieve and Trade 2, 3, 4, 5, 6, 10, 14, 15, 16, 17, 18, 19, 21, 1, 2, 3, 5
SSEC
Specific energy consumption 5, 16
TTOE
Tonne of oil equivalent 14, 15
UUSD
United states dollars 9, 10


Thermal Power32