impressions of china and more dr. chuanguo xu. dr. fang chen regional director ipni mr. maury keonig...
TRANSCRIPT

Impressions of China and More
Dr. Chuanguo Xu
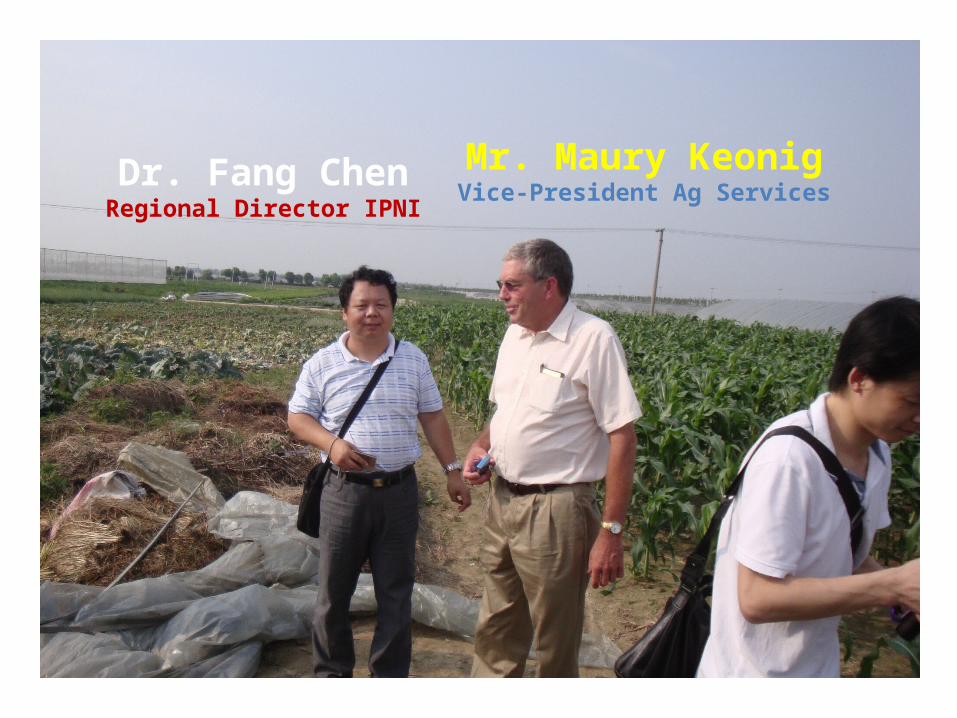
Dr. Fang ChenRegional Director IPNI
Mr. Maury KeonigVice-President Ag Services

What Do You Want from Us ?
“Tell us about recent in-season N management technologies and strategies AND how to effectively convey management information to farmers”
Xu, Chuanguo
Where to Start ?

Near InfraredWavebands
(NIR)
Photosynthesis
Biomass
e l dChlorophyll captures BLUE and RED light
Sensors Measure● Disappearance of red light● Abundance of reflected NIR
Reflects NIR
VisibleWavebands
Chlorophyll

Near InfraredWavebands
(NIR)
Photosynthesis
Chlorophyll Biomass
“VIGOR”Nutrient Status Y i e l d
Vegetation Index
VisibleWavebands

Modulation/Demodulation Using Polychromatic LEDs
LEDPD1
TARGET
SENSOR
PD2
User SelectedFilters
ACS-470
PD3
FeaturesSelect 3 wavebandsMappingExternal GPSExternal powerWaveband outputOutput to data loggerContinuous data (10 Hz)Real-time applications

Crop Circle ACS-430
or
AgLeader OptRx
CottonGreece - 2010
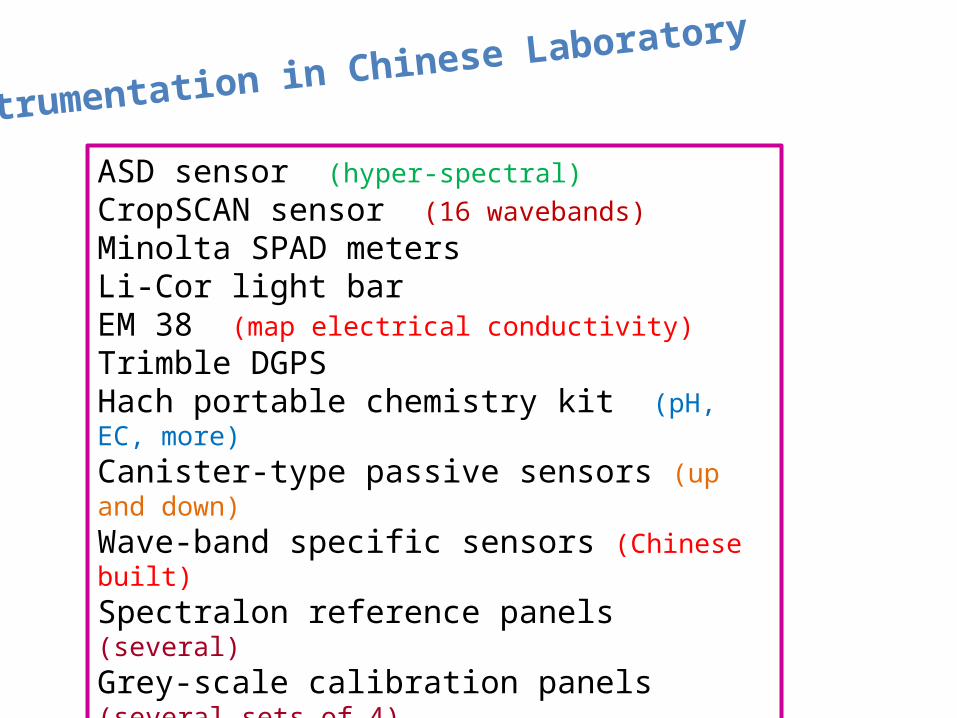
Instrumentation in Chinese Laboratory
ASD sensor (hyper-spectral)CropSCAN sensor (16 wavebands)Minolta SPAD metersLi-Cor light bar EM 38 (map electrical conductivity)Trimble DGPSHach portable chemistry kit (pH, EC, more)Canister-type passive sensors (up and down)Wave-band specific sensors (Chinese built)Spectralon reference panels (several)Grey-scale calibration panels (several sets of 4)GreenSeekerCircuit boards being developed and tested

Modulation/Demodulation Using Polychromatic LEDs
LEDPD1
TARGET
SENSOR
PD2
Red, Red-edge and NIR Filters
RapidSCAN
PD3
Built-InGPSLithium batteryWaveband output3 Meg memoryAverages data @ 10 HzStatisticsStart – Stop switch
Collects data @ 40,000 Hz

Near InfraredWavebands
(NIR)
Photosynthesis
Chlorophyll Biomass
Vegetation Index
VisibleWavebands
Affected By :
Growth stage Cultivar (variety) Previous crop Water stress Soil properties

“ X “
Reference
Sufficiency Index
“Happy Crop”
“Managed Crop”
Note : Reference value - - - remains constant
= = S I
Relative “Vigor”(i.e., 92% adequate)
i.e., 100%

0.6
07
0.8
15
81
.02
46
1.2
33
41
.44
22
1.6
51
1.8
59
82
.06
86
2.2
77
42
.48
62
2.6
95
2.9
03
83
.11
26
3.3
21
43
.53
02
3.7
39
3.9
47
84
.15
66
4.3
65
44
.57
42
4.7
83
4.9
91
85
.20
06
5.4
09
45
.61
82
5.8
27
6.0
35
8
0
50
100
150
200
250
0%
20%
40%
60%
80%
100%
120%
Histogram
Bin (vegetation index)
Fre
qu
en
cy
Mexico, 2010
95%“Happy Crop”

0.6
07
0.8
85
41
.16
38
1.4
42
21
.72
06
1.9
99
2.2
77
42
.55
58
2.8
34
23
.11
26
3.3
91
3.6
69
43
.94
78
4.2
26
24
.50
46
4.7
83
5.0
61
45
.33
98
5.6
18
25
.89
66
Mo
re
0
50
100
150
200
250
0%
20%
40%
60%
80%
100%
120%Histogram
Bin (vegetation index)
Fre
qu
en
cy
95%50%
4.47
5.21SI = = 0.85

Holland K.H. and J.S. Schepers. 2010. Derivation of a variable rate nitrogen application model for in-season fertilization of corn. Agronomy Journal 102:1415-1424.
Basic Algorithm
Nappl = ( Nopt – Ncred )
√
√ (1 – SI)
∆ SI
Farmer Rateor NEONR

0.6 0.7 0.8 0.9 1.00.0
0.2
0.4
0.6
0.8
1.0
1.2
R² = 0.986847189872485R² = 0.991268033520071
Sufficiency Index
Rela
tive
Yiel
dV9
V12
0 50 100 150 200 2500
0.1
0.2
0.3
0.4
0.5
0.6
0.7
0.8
0.9
1
R² = 0.979516070517402
N Rate (kg/ha)
Suffi
cien
cy In
dex
Fertilizer N Rates influence crop vigor
(sufficiency index)
Crop Sufficiency Index is directly related to
Relative Yield

Why Some Precision Agriculture Tools Have Slow Adoption ?
• Time• Expense• Intimidated by the technology• Inconvenient• Lack of support after the sale• Not appropriate for the situation• Profits are already adequate• Requires different equipment• Needs technical assistance and guidance

Producer Services
Grid soil samplesReview yield mapsGenerate zone maps for VRTVRT fertilizer and limeCheck preplant uniformity and deliver materialsCheck and calibrate starter fertilizer equipmentPlanter uniformity and depthSidedress nutrient deliveriesHerbicide applications (high clearance sprayers)Calibrate fertigation pumps and schedule applicationsField scouting (irrigation, weeds, insects, disease)Remote sensing (color imagery out the window)Yield monitor calibrationHelp clean up yield maps
Smoke Test
Frequent contacts
Demonstrates concern
Near real-time feedback
Charges 5-7% more
for products
N Rate (lb N/ ac)
0 50 100 150 200 250
Gra
in Y
ield
(bu/a
c)
100
120
140
160
180
200
220
240
N Rate (lb N/ ac)
0 50 100 150 200 250
Gra
in Y
ield
(bu/a
c)
100
120
140
160
180
200
220
240
N Rate (lb N/ ac)
0 50 100 150 200 250
Gra
in Y
ield
(bu/a
c)
100
120
140
160
180
200
220
240
N Rate (lb N/ ac)
0 50 100 150 200 250
Gra
in Y
ield
(bu/a
c)
100
120
140
160
180
200
220
240
N Rate (lb N/ ac)
0 50 100 150 200 250
Gra
in Y
ield
(bu/ac)
100
120
140
160
180
200
220
240
N Rate (lb N/ ac)
0 50 100 150 200 250
Gra
in Y
ield
(bu/ac)
100
120
140
160
180
200
220
240
N Rate (lb N/ ac)
0 50 100 150 200 250
Gra
in Y
ield
(bu/a
c)
100
120
140
160
180
200
220
240
N Rate (lb N/ ac)
0 50 100 150 200 250
Gra
in Y
ield
(bu/a
c)
100
120
140
160
180
200
220
240
N Rate (lb N/ ac)
0 50 100 150 200 250
Gra
in Y
ield
(bu/a
c)
100
120
140
160
180
200
220
240
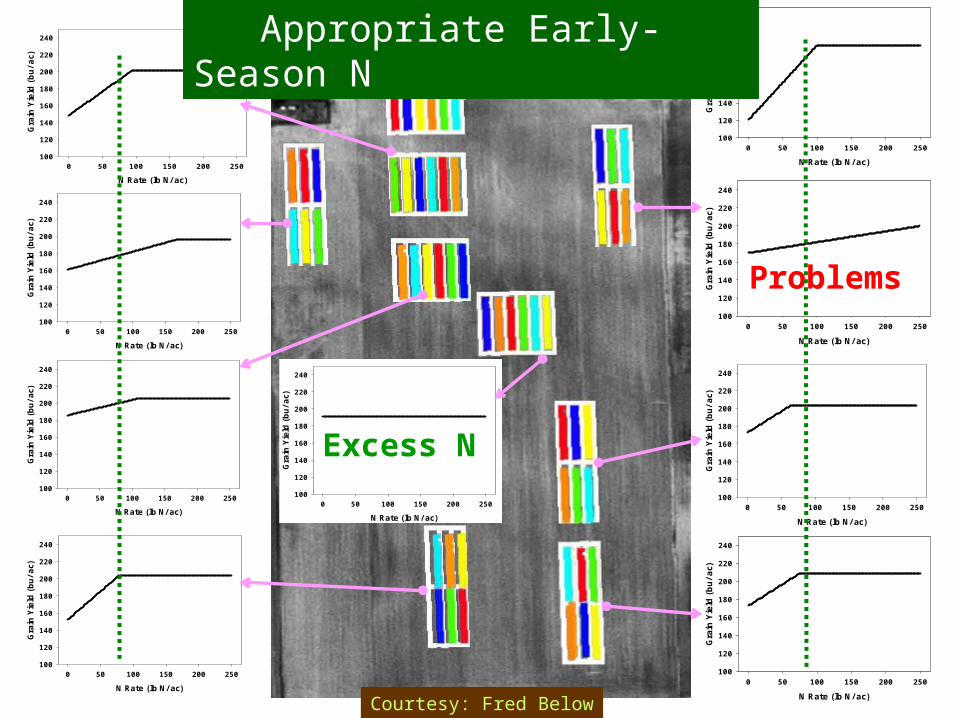
Excess N
Problems
Appropriate Early-Season N
Courtesy: Fred Below

Should we be working to -build a better mouse trap ?
ORConvincing farmers that they should try to -
catch the mouse ?
Get Involved with Producers