important tqm material
DESCRIPTION
hfhjfhjTRANSCRIPT
TOTAL QUALITY MANAGEMENT
TQM/VMSS/M.B.A/N.P.R.C.E.T
1
ISO 9001:2008
N.P.R. COLLEGE OF ENGINEERING & TECHNOLOGY N.P.R. Nagar, Natham - 624 401, Tamil Nadu, India.
AN ISO 9001:2008 Certified Institution (Approved by AICTE, New Delhi, Affiliated to Anna University, Tiruchirappalli)
No. : 04544 - 291333, 291334, 245422, 245423 & Fax No.: 04544-245392, 93 Website: www.nprcet.org, www.nprcolleges.org E-Mail: [email protected]
MBA101
Miss. VMS.Sumathy, B.Sc (Phy), M.B.A., Lecturer/M.B.A
N.P.R. College of Engineering and Technology, Natham
TOTAL QUALITY MANAGEMENT
TQM/VMSS/M.B.A/N.P.R.C.E.T
2
BA*114 TOTAL QUALITY MANAGEMENT
LT P C
3 0 0 3
UNIT I INTRODUCTION TO QUALITY MANAGEMENT 9
Definitions – TOM framework, benefits, awareness and obstacles. Quality – vision, mission and
policy statements. Customer Focus – customer perception of quality, Translating needs into
requirements, customer retention. Dimensions of product and service quality. Cost of quality.
UNIT II PRINCIPLES AND PHILOSOPHIES OF QUALITY MANAGEMENT 9
Overview of the contributions of Deming, Juran Crosby, Masaaki Imai, Feigenbaum,
Ishikawa, Taguchi techniques – introduction, loss function, parameter and tolerance design,
signal to noise ratio. Concepts of Quality circle, Japanese 5S principles and 8D
methodology.
UNIT III STATISTICAL PROCESS CONTROL AND PROCESS CAPABILITY 9
Meaning and significance of statistical process control (SPC) – construction of control charts
for variables and attributed. Process capability – meaning, significance and measurement – Six sigma
concepts of process capability. Reliability concepts – definitions, reliability in series and parallel,
product life characteristics curve.Total productive maintenance (TMP) – relevance to TQM,
Terotechnology. Business process re-engineering (BPR) – principles, applications, reengineering
process, benefits and limitations.
UNIT IV TOOLS AND TECHNIQUES FOR QUALITY MANAGEMENT 9
Quality functions development (QFD) – Benefits, Voice of customer, information organization,
House of quality (HOQ), building a HOQ, QFD process. Failure mode effect analysis (FMEA) –
requirements of reliability, failure rate, FMEA stages, design, process and documentation.
Seven old (statistical) tools. Seven new management tools. Bench marking and POKA YOKE.
UNIT V QUALITY SYSTEMS ORGANIZING AND IMPLEMENTATION 9
Introduction to IS/ISO 9004:2000 – quality management systems – guidelines for performance
improvements. Quality Audits. TQM culture, Leadership – quality council, employee
involvement, motivation, empowerment, recognition and reward- Introduction to software quality.
TOTAL: 45 PEROIDS
TEXT BOOKS
1. Dale H.Besterfield et al, Total Quality Management, Third edition, Pearson Education, 2004
REFERENCES
1. Douglas C. Montgomory, Introduction to Statistical Quality Control, Wiley Student Edition, 4th
Edition, Wiley India Pvt Limited, 2008.
2. James R. Evans and William M. Lindsay, The Management and Control of Quality, Sixth
Edition, Thomson, 2005.
3. Poornima M.Charantimath, Total Quality Management, Pearson Education, First
Indian Reprint 2003.
4. Dr.S.Rajaram and Dr.M.Sivakumar, Total Quality Management(Indian Text Edition), Biztantra
Publications(A Unit of John Wiley Publications, USA), 2008, New Delhi.

TOTAL QUALITY MANAGEMENT
TQM/VMSS/M.B.A/N.P.R.C.E.T
3
UNIT I
TOTAL QUALITY MANAGEMENT
TQM/VMSS/M.B.A/N.P.R.C.E.T
4
UNIT I INTRODUCTION TO QUALITY MANAGEMENT
Definitions – TOM framework, benefits, awareness and obstacles. Quality – vision, mission and
policy statements. Customer Focus – customer perception of quality, Translating needs into
requirements, customer retention. Dimensions of product and service quality. Cost of quality.
INTRODUCTION TO QUALITY MANAGEMENT
TOTAL QUALITY MANAGEMENT
Total Quality Management (TQM) is an enhancement to the traditional way of doing
business.
Total - Made up of the whole
Quality - Degree of Excellence a Product or Service provides.
Management - Art of handling, controlling, directing etc.
TQM is the application of quantitative methods and human resources to improve all the processes within
an organization and exceed CUSTOMER NEEDS now and in the future.
Total quality Management is defined as both as philosophy and a set of guiding principles that
represent the foundation of a continuously improving organization.
Basic Approach
TQM requires six basic concepts:
1. A commitment and involved management to provide long-term top-to-bottom organizational
support.
2. An unwavering focuses on the customer, both internally and externally.
3. Effective involvement and utilization of the entire work force.
4. Continuous improvement of the business and production process.
5. Treating suppliers as partners.
6. Establish performance measures such as uptime, percent nonconforming, absenteeism and
customer satisfaction should be determined for the process. Quantitative data are necessary to
measure the continuous quality improvement activity.
QUALITY DEFINITION
According to Deming, “Quality may be defined as an excellent product or services that fulfills or
exceeds our expectations”.
Quality can be quantified as follows
Q = P / E
TOTAL QUALITY MANAGEMENT
TQM/VMSS/M.B.A/N.P.R.C.E.T
5
where,
Q = Quality
P = Performance
E = Expectation
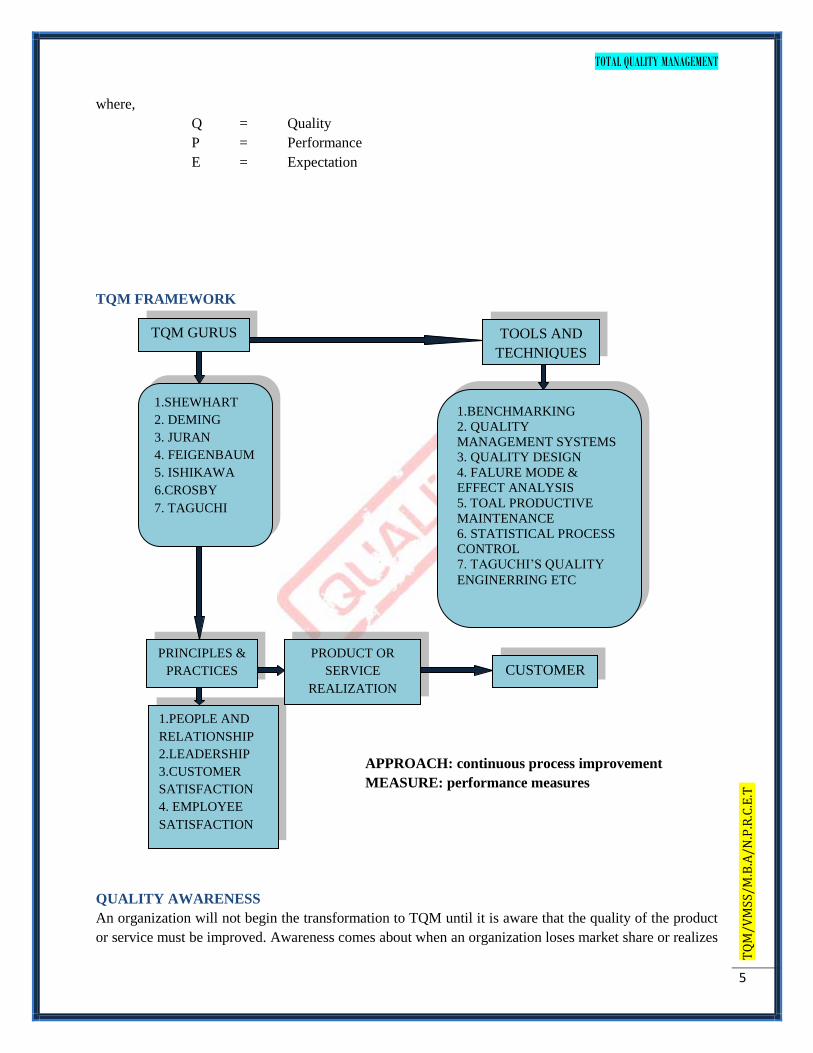
TQM FRAMEWORK
APPROACH: continuous process improvement
MEASURE: performance measures
QUALITY AWARENESS
An organization will not begin the transformation to TQM until it is aware that the quality of the product
or service must be improved. Awareness comes about when an organization loses market share or realizes
TQM GURUS TOOLS AND
TECHNIQUES
1.SHEWHART
2. DEMING
3. JURAN
4. FEIGENBAUM
5. ISHIKAWA
6.CROSBY
7. TAGUCHI
1.BENCHMARKING
2. QUALITY
MANAGEMENT SYSTEMS
3. QUALITY DESIGN
4. FALURE MODE &
EFFECT ANALYSIS
5. TOAL PRODUCTIVE
MAINTENANCE
6. STATISTICAL PROCESS
CONTROL
7. TAGUCHI‟S QUALITY
ENGINERRING ETC
1.PEOPLE AND
RELATIONSHIP
2.LEADERSHIP
3.CUSTOMER
SATISFACTION
4. EMPLOYEE
SATISFACTION
PRODUCT OR
SERVICE
REALIZATION
CUSTOMER
PRINCIPLES &
PRACTICES

TOTAL QUALITY MANAGEMENT
TQM/VMSS/M.B.A/N.P.R.C.E.T
6
that quality and productivity go hand-in-hand. Its also occurs if TQM is mandated TQM is better way to
run a business and compete in domestic and world markets.
DIMENSIONS OF QUALITY
Performance: Primary product characteristics, such as the brightness of the picture.
Features: Secondary characteristics, added features, such as remote control.
Conformance: Meeting specifications or industry standards, workmanship.
Reliability: Consistency of performance over time, average time for the unit to fail.
Durability: Useful life, includes repair.
Service: Resolution of problems and complaint, ease of repair
Reputation: Human-to-human interface, such as the courtesy of the dealer.
Aesthetics: Sensory characteristics, such as exterior finish.
Response: Past performance and other intangibles, such as being ranked first.
Therefore, quality products can be determined by using a few of the dimensions of quality.
MANUFACTURING INDUSTRIES SERVICE INDUSTRIES
Product features
Performance
Reliability
Durability
Ease of use
Serviceability
Aesthetic
Availability
Reputation
Accuracy
Timeliness
Completeness
Friendliness
Courtesy
Anticipating customer needs
Knowledge of server
Aesthetic
Reputation
NEW AND OLD CULTURES:
QUALITY ELEMENT PREVIOUS STATE TQM
Definition Product oriented Customer oriented
TOTAL QUALITY MANAGEMENT
TQM/VMSS/M.B.A/N.P.R.C.E.T
7
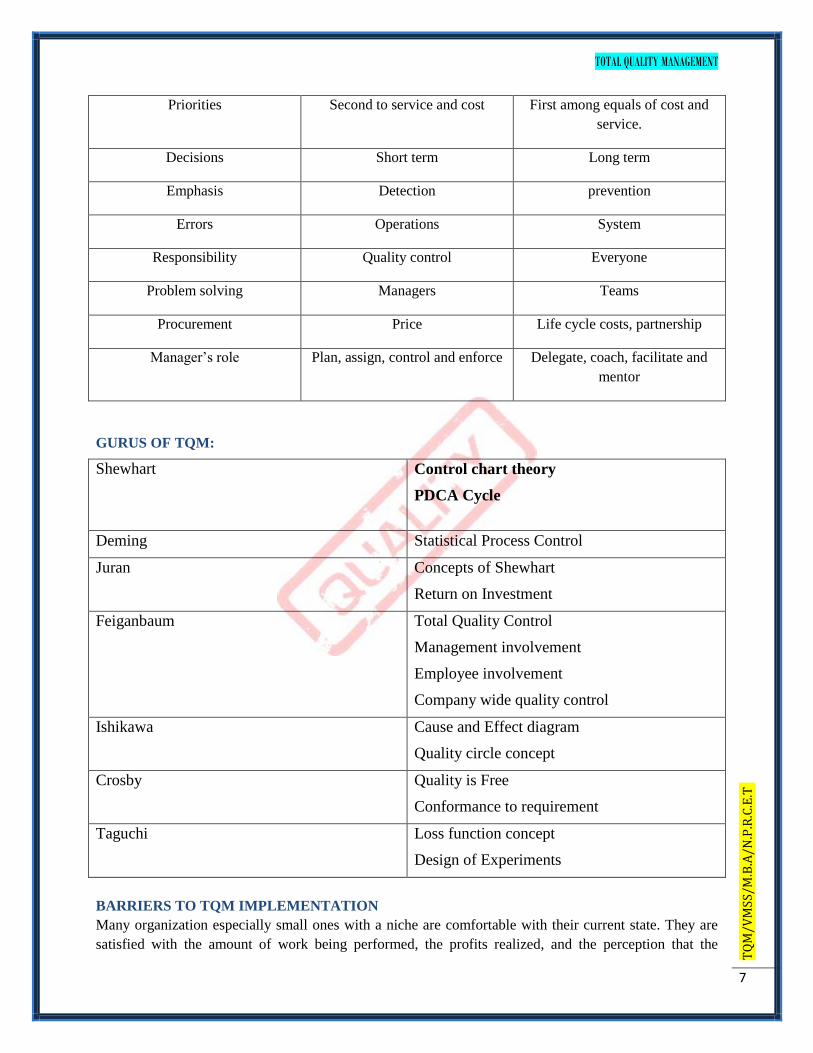
Priorities Second to service and cost First among equals of cost and
service.
Decisions Short term Long term
Emphasis Detection prevention
Errors Operations System
Responsibility Quality control Everyone
Problem solving Managers Teams
Procurement Price Life cycle costs, partnership
Manager‟s role Plan, assign, control and enforce Delegate, coach, facilitate and
mentor
GURUS OF TQM:
Shewhart Control chart theory
PDCA Cycle
Deming Statistical Process Control
Juran Concepts of Shewhart
Return on Investment
Feiganbaum Total Quality Control
Management involvement
Employee involvement
Company wide quality control
Ishikawa Cause and Effect diagram
Quality circle concept
Crosby Quality is Free
Conformance to requirement
Taguchi Loss function concept
Design of Experiments
BARRIERS TO TQM IMPLEMENTATION
Many organization especially small ones with a niche are comfortable with their current state. They are
satisfied with the amount of work being performed, the profits realized, and the perception that the

TOTAL QUALITY MANAGEMENT
TQM/VMSS/M.B.A/N.P.R.C.E.T
8
customers are satisfied. Organizations with this culture will see little need for TQM until they begin to
lose market share. Once an organization embarks on TQM, there will be obstacles to its success
implementation
The barriers to TQM Implementation were
Lack of Management Commitment: In order for any organizational effort to succeed, there must be a
substantial management commitment of management time and organizational resources. The purpose
must be clearly and continuously communicated to all personnel. Management must consistently apply
the principles of TQM.
Inability to change Organizational culture: Changing organization‟s culture is difficult and will require
as much as five years. Management must understand and utilize the basic concepts of change. They are:
o People change when they want to and to meet their own needs.
o Never expect anyone to engage in behavior that serves the organization‟s values
unless adequate reason has been given.
o For change to be accepted, people must be moved from a state of fear to trust.
Improper planning: All constituents of the organization must be involved in the development of the
implementation plan and any modifications that occur as the plan evolves.
Lack of continuous training and education: Training and education is an ongoing process for everyone
in the organization. Needs must be determined and a plan developed to achieve those needs. Training and
education are most effective when senior management conducts the training on the principles of TQM.
Incompatible organizational structure and isolated individuals and departments: differences
between departments and individuals can create implementation problems. The use of multifunctional
teams will help to break down long-standing barriers.
Ineffective measurement techniques and lack of access to data and results: Key characteristics of the
organization should be measured so that effective decisions can be made.
Paying inadequate attention to internal and external customer: organizations need to understand the
changing needs and expectations of their customers. Effective feedback mechanisms that provide data for
decision making are necessary for this understanding.
Inadequate use of empowerment and teamwork: Teams need to have the proper training and, at least
in the beginning, a facilitator, whenever possible, the team‟s recommendation should be followed.
Individuals should be empowered to make decisions that affect the efficiency of their process or the
customer satisfaction.
Failure to continually improve: It is tempting to sit back and rest on laurels. However, a lack of
continuous improvement of the processes, product, and/ or service will even leave the leader of the pack
in the dust.
BENEFITS TO TQM
Improved Quality
Employee Participation
Teamwork
Working relationships
Customer satisfaction
Employee satisfaction
Productivity
Communication
TOTAL QUALITY MANAGEMENT
TQM/VMSS/M.B.A/N.P.R.C.E.T
9
Profitability
Market share
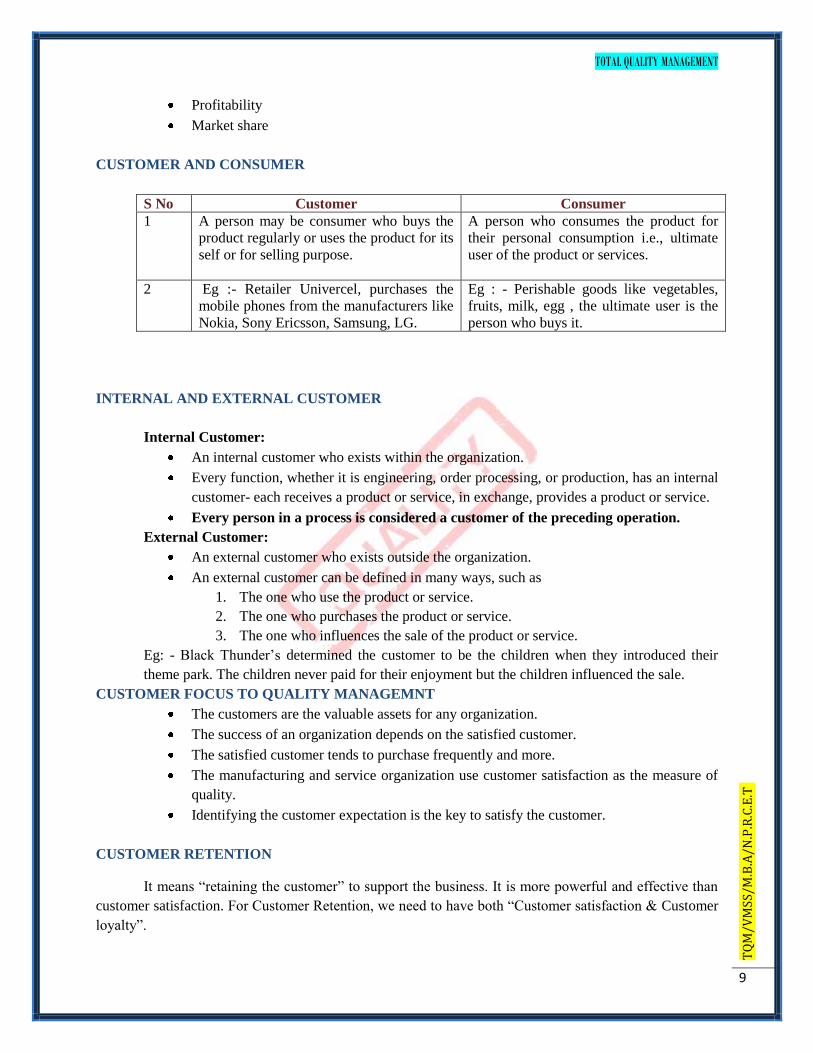
CUSTOMER AND CONSUMER
S No Customer Consumer
1 A person may be consumer who buys the
product regularly or uses the product for its
self or for selling purpose.
A person who consumes the product for
their personal consumption i.e., ultimate
user of the product or services.
2 Eg :- Retailer Univercel, purchases the
mobile phones from the manufacturers like
Nokia, Sony Ericsson, Samsung, LG.
Eg : - Perishable goods like vegetables,
fruits, milk, egg , the ultimate user is the
person who buys it.
INTERNAL AND EXTERNAL CUSTOMER
Internal Customer:
An internal customer who exists within the organization.
Every function, whether it is engineering, order processing, or production, has an internal
customer- each receives a product or service, in exchange, provides a product or service.
Every person in a process is considered a customer of the preceding operation.
External Customer:
An external customer who exists outside the organization.
An external customer can be defined in many ways, such as
1. The one who use the product or service.
2. The one who purchases the product or service.
3. The one who influences the sale of the product or service.
Eg: - Black Thunder‟s determined the customer to be the children when they introduced their
theme park. The children never paid for their enjoyment but the children influenced the sale.
CUSTOMER FOCUS TO QUALITY MANAGEMNT
The customers are the valuable assets for any organization.
The success of an organization depends on the satisfied customer.
The satisfied customer tends to purchase frequently and more.
The manufacturing and service organization use customer satisfaction as the measure of
quality.
Identifying the customer expectation is the key to satisfy the customer.
CUSTOMER RETENTION
It means “retaining the customer” to support the business. It is more powerful and effective than
customer satisfaction. For Customer Retention, we need to have both “Customer satisfaction & Customer
loyalty”.

TOTAL QUALITY MANAGEMENT
TQM/VMSS/M.B.A/N.P.R.C.E.T
10
The following steps are important for customer retention
1. Top management commitment to the customer satisfaction.
2. Identify and understand the customers what they like and dislike about the organization.
3. Develop standards of quality service and performance.
4. Recruit, train and reward good staff.
5. Always stay in touch with customer.
6. Work towards continuous improvement of customer service and customer retention.
7. Reward service accomplishments by the front-line staff.
8. Customer Retention moves customer satisfaction to the next level by determining what is truly
important to the customers.
9. Customer satisfaction is the connection between customer satisfaction and bottom line.
Customer may be satisfied with high priced product but end up in equivalent superior
product.
Customer Retention is possible only when company truly understands what the customer
expects from product and the company.
The satisfaction level results in customer retention with improve loyalty of customer
towards product and bring profit by bringing new customers.
QUALITY STATEMENTS
Quality statements includes
Vision statement: A clear declaration of what an organization aspires to be in the future.
Eg: - Disney theme park “The Happiest place on Earth”.
Mission statement: It provides as clear statement of the purpose of all those involved in
the business.
Eg : - Walmart “ We exist to provide value to our customer, which mean in addition to
quality, services, we have to save their money.
Quality policy statement: This statement serves as a guide for everyone in the
organization. It clarifies the employee about how the product and services must be
provided to the customer.
CUSTOMER PERCEPTION OF QUALITY
According to Deming, “Quality may be defined as an excellent product or services that fulfills or
exceeds our expectations”. An American Society for Quality (ASQ) survey on end user perceptions of
important factors that influenced purchases showed the following ranking:
1. Performance
2. Features
3. Service
4. Warranty
5. Price
6. Reputation
The above factors are the part of product and service quality; therefore it is evident that product quality
and service are more important than price.
Performance- involves “fitness for use” – a phrase that indicates that the product and service is ready for
the customer‟s use at the time of sale. Other considerations are
TOTAL QUALITY MANAGEMENT
TQM/VMSS/M.B.A/N.P.R.C.E.T
11
1. Availability- probability that a product will operate when needed.
2. Reliability- freedom from failure over time
3. Maintainability- ease of keeping the product operable.
Features- Identifiable features or attributes of a product or service are psychological, time- oriented,
contractual, ethical, and technological. Features are secondary characteristics of a product or service.
Service- An emphasis on customer service is emerging as a method for organizations to give customer-
added value. However is an intangible- it is made up of many small things, all geared to changing the
customer‟s perception. Providing excellent customer service is different from and more difficult to
achieve than excellent product quality.
Warranty- The product warranty represents an organization‟s public promise of a quality product backed
up by a guarantee of customer satisfaction. Warranty builds marketing muscle as it encourages customer
to buy a service by reducing the risk of the purchase decision, and it generates more sales fro/m existing
customer by enhancing loyalty.
Price- Today‟s customer is willing to pay a higher price to obtain value. Customer constantly evaluating
one organization‟s products and services against those of its competitors to determine who provides the
greatest value.
Reputation- Today customer satisfaction is based on the entire experience with the organization, not just
the product. Good experiences are repeated to six people and bad experiences are repeated to 15 people;
therefore it is more difficult to create a favorable reputation. Customers are willing to pay a premium for a
known or trusted brand name and often become customers for life.
TRANSLATING NEEDS INTO REQUIREMNTS
Translating needs into requirements is another vital part of the quality management.
Requirements management is concerned with meeting the needs of end users through
identifying and specifying what they need.
Requirements may be focused on outcomes where the main concern is to describe what is
wanted rather than how it should be delivered or requirements may be described in any way
between have an adequate understanding of what the users need and how the market is likely
to meet that need.
COST OF QUALITY
Cost of Quality is the amount of money a business loses because its product or service was not
done right in the right place (or) the cost associated in providing poor quality product and services is
known as Cost of Quality (or) Cost of Quality are defined as those costs associated with the non-
achievement of product or service quality as defined by requirements established by the organization and
its contracts with customers and society.
The four categories of Quality cost includes
Internal failure cost- The cost associated with defects that are found prior to transfer of
the product to the customer.
External failure cost- The cost associated with defects that are found after product is
shipped to the customer.
Appraisal cost- The cost incurred in determining the degree of conformance to quality
requirement.
Prevention cost- The cost incurred in keeping failure and appraisal costs to a minimum.
TOTAL QUALITY MANAGEMENT
TQM/VMSS/M.B.A/N.P.R.C.E.T
12
The companies estimate quality costs for the following reasons:
To improve communication between middle managers and upper managers
To identify major opportunities for cost reduction
To identify the opportunities for reducing customer dissatisfaction and associated threats to
product salability.
STRATEGIC QUALITY PLANNING
Goals – Long term planning (Eg : Win the war)
Objectives – Short term planning (Eg : Capture the bridge)
Goals should
Improve customer satisfaction, employee satisfaction and process
Be based on statistical evidence
Be measurable
Have a plan or method for its achievement
Have a time frame for achieving the goal
Finally, it should be challenging yet achievable
SEVEN STEPS TO STRATEGIC QUALITY PLANNING :
1. Customer needs 5. Closing the gap
2. Customer positioning 6. Alignment
3. Predict the future 7. Implementation
4. Gap analysis
2 marks questions
1. Define Total Quality?
2. Define Quality?
3. What are the Dimensions of Quality?
4. Give the Basic Concepts of TQM?
5. Give the Principles of TQM?
6. Give the Obstacles associated with TQM Implementation?
7. Define Quality Costs?
8. Give the primary categories of Quality cost?
9. Give the typical cost bases?
10. How will you determine the optimum cost?
11. Define Quality Planning?
12. Give the Objectives of TQM?
TOTAL QUALITY MANAGEMENT
TQM/VMSS/M.B.A/N.P.R.C.E.T
13
13. What are the various quality statements?
14. Give the basic steps to strategic quality planning?
15. What is a quality policy?
16. What is a mission statement?
17. What is a vision statement?
18. What are the important factors that influenced purchases?
19. Difference between Customer and Consumer?
20. Define Customer Retention?
16 marks questions
1. What is quality cost? Explain the techniques used for Quality cost?
2. Explain the principles of TQM?
3. Explain the barriers to TQM implementation?
4. Explain in detail the significance of quality from customer point of view? Give suitable
examples?
5. What are customer perceptions of quality? Explain?
6. Explain the significance of dimensions of quality?
7. Discuss various factors that should be considered in focusing on customers?
8. What is the strategic quality planning?
9. Explain the steps involved in conducting a typical PDCA cycle for a small scale organization?
10. With examples from your branch/ specialization, distinguish between chance variations and
variations due to assignable causes?
TOTAL QUALITY MANAGEMENT
TQM/VMSS/M.B.A/N.P.R.C.E.T
14
UNIT II
PRINCIPLES AND PHILOSHOPHIES
TOTAL QUALITY MANAGEMENT
TQM/VMSS/M.B.A/N.P.R.C.E.T
15
UNIT II PRINCIPLES AND PHILOSOPHIES OF QUALITY MANAGEMENT
Overview of the contributions of Deming, Juran Crosby, Masaaki Imai, Feigenbaum,
Ishikawa, Taguchi techniques – introduction, loss function, parameter and tolerance design,
signal to noise ratio. Concepts of Quality circle, Japanese 5S principles and 8D
methodology.
The future thrust of quality movement in India would be based on:
1. Application Research (Industry and Academics)
2. Experience Sharing
3. ISO certificates
4. Environmental protection, safety and consumer protection for quality
enhancement.
Contribution of W. Edwards Deming
Deming 14 principles
1. Create and publish the aims and purposes of the organization.
2. Learn the new philosophy.
3. Understand the purpose of inspection.
4. Stop awarding business based on price alone.
5. Improve constantly and forever.
6. Institute training.
7. Teach and institute leadership.
8. Drive out fear, create trust and create a climate for innovation.
9. Optimize the efforts of teams, groups and staff areas.
10. Eliminate exhortations for the work force.
11. (a) Eliminate numerical quotas for the work force.
(b) Eliminate Management by Objective.
12. Remove barriers that rob people of pride of workmanship.
13. Encourage education and self-improvement of everyone.
14. Take action to accomplish the transformation.
Deming’s cycle or PDCA cycle

TOTAL QUALITY MANAGEMENT
TQM/VMSS/M.B.A/N.P.R.C.E.T
16
P – PLAN (Process the improvement)
D – DO (Implement the plan)
C – CHECK (See how closely result meets goals)
A – ACT (Use the improved process as standard practice)
Joseph M Juran Contribution
Juran‟s Quality Trilogy
Quality Planning Identify who are the customers.
Determine the needs of those customers.
Translate those needs into our language.
Develop a product that can respond to those needs.
Optimize the product features so as to meet our needs and
customer needs.
Quality improvement Develop a process which is able to produce the product.
Optimize the process.
Quality control Prove that the process can produce the product under operating
conditions with minimal inspection.
Transfer the process to operations.
Juran’s 10 steps for quality improvement
According to him, Quality means – Fitness for use
1. Build awareness for the need and opportunity for improvement.
2. Set goals for improvement.
3. Organize people to reach the goals.
4. Provide training throughout the organization.
5. Carry out projects to solve the problems.
6. Report progress.
7. Give recognition.
8. Communicate results.

TOTAL QUALITY MANAGEMENT
TQM/VMSS/M.B.A/N.P.R.C.E.T
17
9. Keep score.
10. Maintain momentum by making annual improvement part of the regular system.
Contribution to Philip B Crosby
Worked to significantly advance the cause of the world wide quality movement through his many
personal contributions over the past four decades. He developed four absolutes of quality management.
Quality means conformance to requirements, not goodness.
Quality is achieved by prevention, not appraisal.
Quality has a performance standard of Zero Defects. Not acceptable quality levels.
Quality is measured by the Price of nonconformance, not indexes.
Masaki Imai
Founder and President of Kaizen Institute threw the word „Kaizen‟.
Kaizen
Kaizen refers to „continuous or On-going improvement‟ in Japanese, is an inseparable aspect of
Total Quality Management is required in all activities of the organization.
Kaizen has to basically do with small, step-by-step continuous improvement, smaller and
continuous improvements are more realizable, predictable, controllable, and acceptable.
Kaizen philosophy believes that people at all levels, including the lowermost levels in the
organizational hierarchy, can contribute to improvements, possible because Kaizen asks for only
small improvements.
To survive in an increasingly competitive world, top management must adopt a just-in-time(JIT)
approach and drive change down the hierarchy without yielding to resistance.
The key ideas associated with JIT were developed at the Toyota Motor Company under the
leadership of founder EIJI TOYOTO whose father had founded the successful Toyota Spinning
and weaving company.
JIT is the management philosophy that strives to eliminate sources of manufacturing waste
producing the right part in the right place at the right time.
Elements of JIT
Stabilize and level the MPS with uniform plant loading create a uniform load on all work centers
through constant daily production and mixed model assembly.
Reduce or eliminate set up times. Aim for single digit set up times less than 10 minutes or „one
touch setup. Done through better planning, process, redesign, and product redesign.
Reduce lot sizes. Reducing set up times allows economic production of smaller lots, close
cooperation with suppliers is necessary to achieve reduction.
Reduce lead times. Production lead times can be reduced by moving work stations closer
together, applying group technology and cellular manufacturing concepts, reduce queue length
and improving the coordination and cooperation between successive processes. Delivery lead
times can be reduced through close cooperation with suppliers, possibly by inducing suppliers to
be located closer to the factory.
Preventive maintenance. Use machine and worker idle time to maintain equipment and prevent
breakdown.

TOTAL QUALITY MANAGEMENT
TQM/VMSS/M.B.A/N.P.R.C.E.T
18
Flexible work force. Workers should be trained to operate several machines, to perform
maintenance tasks, and to perform quality inspections.
Require supplier quality assurance and implement a zero defect quality program.
Small lots (single unit) conveyance. Use a control system such as Kanban system (or other
signaling system) to convey parts between work stations in smaller quantities. In its larger sense,
JIT with MRP system is used to convey the parts between workstations.
Reasons for a move from batch mode to Just-in-time (JIT)
Batch production system is the most inefficient way to make products.
Difficult to meet customer requirements, which come in different orders, like different volumes in
different time frames and soon.
The batch system derives from the agricultural mentality. The batch system, purchase material
and produce in big batches and there are many processes. At every process, accumulate the batch
and at the end accumulate the finished product in a batch, which is stored in the warehouse.
This kind of production system is based on market forecast, is good when there is demand.
End up with huge inventory of unsold products and excess capacity, and then borrow money to
carry that inventory. By that time, acquired too many people for every process.
Contribution of Armand V Feigenbaum
Defined as quality as “Total quality control is an effective system for integrating the quality development,
quality maintenance, and quality improvement efforts of the various groups in an organization so as to
enable production and service at the most economical levels which allow full customer satisfaction.
Industrial cycle
Ongoing sequence to bring products or services to the customer including the activities like
marketing, purchasing, design, engineering, manufacturing, production, inspection , packaging,
delivery, installation and service.
Maintained that responsibility of quality was not the sole preserve of the quality professional but
was the responsibility of all.
The fundamental concept is „quality is everybody‟s job‟ Management and Operators cannot totally
delegate authority and responsibility and still expect a satisfactory product.
The two basic responsibilities are:
1. “Provide quality assurance for the business‟s products”.
2. “Assist in assuring optimum quality costs for those products”.
Hidden Plant
One of the more well known concepts developed by Feigenbaum was that of the “hidden plant”. He
maintained that within every company or factory a proportion of the capacity was wasted by not getting it
right first time.
Quality control
Emphasizing that human relation was a basic issue in Quality control activities, and such things
as statistics and preventive measures were only a part of the whole equation.

TOTAL QUALITY MANAGEMENT
TQM/VMSS/M.B.A/N.P.R.C.E.T
19
„Quality” is what suits the customer at the right price for both the provider and customer and a
common sense approach to quality standards, conformance, corrective actions, and planning for
improvement is the control required to gain that quality.
By stimulating and encouraging everyone in an organization to realize their responsibilities and
potential effects on the quality of a product or service.
Crucial elements of Total Quality
The elements of total quality to enable a totally customer focus (internal and external)
1. Quality is the customers‟ perception of what quality is, not what company think it is.
2. Quality and cost are the same no different.
3. Quality is an individual and team commitment.
4. Quality and innovation are interrelated and mutually beneficial.
5. Managing Quality is managing the business.
6. Quality is a principal.
7. Quality is not a temporary or quick fix but a continuous process of improvement.
8. Productivity gained by cost effective demonstrably beneficial Quality investment.
9. Implementing Quality by encompassing suppliers and customers in the system.
Contribution of Kaoru Ishikawa
Biggest contribution is in simplifying statistical techniques for quality control in an industry.
Ishikawa sees the Cause-and-effect diagram or Ishikawa Diagram, like other tools, as a device to
assist groups or quality circles in quality improvement.
Other than technical contributions to quality, Ishikawa is associated with the Company-wide
Quality control (CWQC) movement as implies that quality does not only mean the quality of
product, but also of after sales service, quality of management, the company itself and the human
life.
The outcomes of such an approach are(Company-Wide Quality benefits):
o Product quality is improved and becomes uniform. Defects are reduced.
o Reliability of goods is improved.
o Cost is reduced.
o Quantity of production is increased.
o Wasteful work and rework are reduced.
o Technique is established and improved.
o Expenses for inspection and testing are reduced.
o Contracts between vendor and vendee are rationalized.
o The sales market is enlarged.
o Better relationships are established between departments.
o False data and reports are reduced.
o Discussions are carried out more freely and democratically.
o Meetings are operated more smoothly.
o Repairs and installation of equipment and facilities are done more rationally.
o Human relations are improved.
Quality Circles

TOTAL QUALITY MANAGEMENT
TQM/VMSS/M.B.A/N.P.R.C.E.T
20
Is a main ingredient of Ishikawa‟s company-wide quality control consisting typically 5-10
personnel who meet at regular interval.
Led by supervisor or team leader, aim to contribute to and improve processes and activities, build
up job satisfaction and company loyalty and utilize existing and hidden resource potential.
Ishikawa’ s PDCA Model
Plan
o Determine goals and targets
o Determine methods of reaching goals.
Do
o Engage in education and training
o Implement work
Check
o Check the effects of implementation
Act
o Take appropriate action.
5-S: HOUSEKEEPING
CLEARING
ARRANGING
SWEEPING
CLEANLINESS
DISCIPLINE
There can be no TQM without 5-S.
A dirty factory cannot produce quality products.
Clutter hides problems. A neat workplace promotes easy discovery of abnormalities.
5-S CONTRIBUTES TO SAFETY
SEIRI
SEITON
SEIKETSU
SEISO
SHITSUKE
5-S MEANS EVERYTHING IN ITS PLACE
TOTAL QUALITY MANAGEMENT
TQM/VMSS/M.B.A/N.P.R.C.E.T
21
QUALITY
PRODUCTIVITY
5-S FACILITATES VISUAL CONTROL
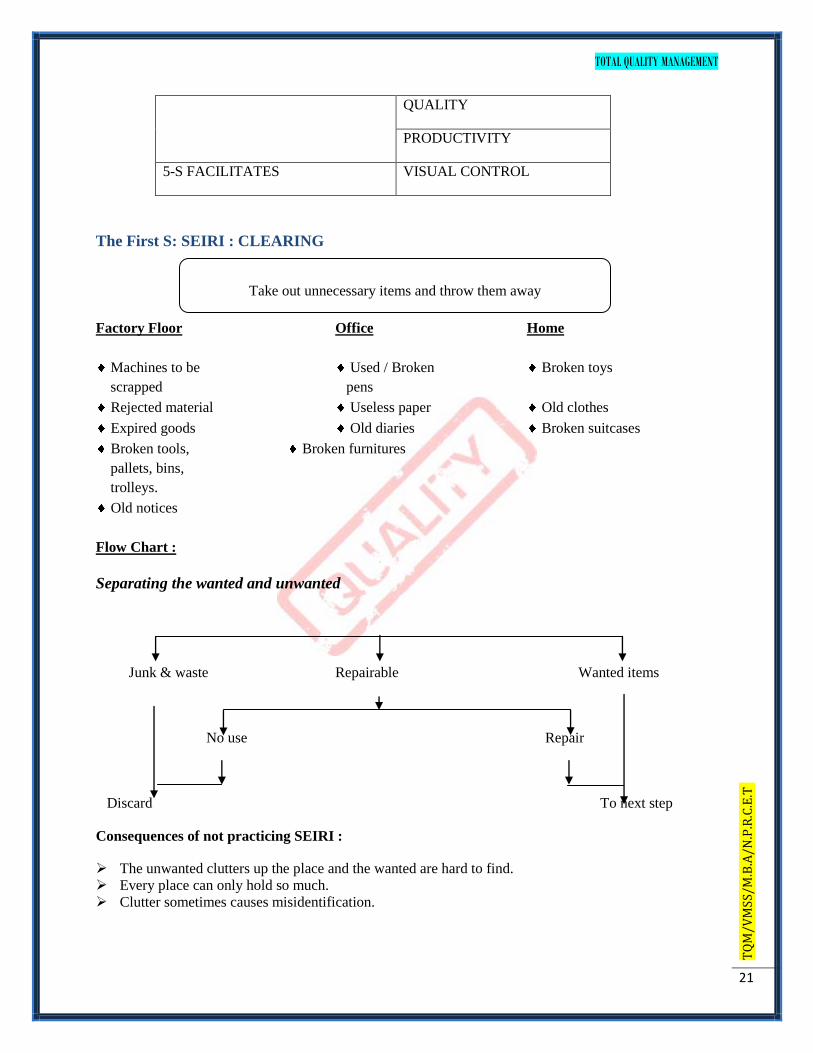
The First S: SEIRI : CLEARING
Factory Floor Office Home
Machines to be Used / Broken Broken toys
scrapped pens
Rejected material Useless paper Old clothes
Expired goods Old diaries Broken suitcases
Broken tools, Broken furnitures
pallets, bins,
trolleys.
Old notices
Flow Chart :
Separating the wanted and unwanted
Junk & waste Repairable Wanted items
No use Repair
Discard To next step
Consequences of not practicing SEIRI :
The unwanted clutters up the place and the wanted are hard to find.
Every place can only hold so much.
Clutter sometimes causes misidentification.
Take out unnecessary items and throw them away
TOTAL QUALITY MANAGEMENT
TQM/VMSS/M.B.A/N.P.R.C.E.T
22
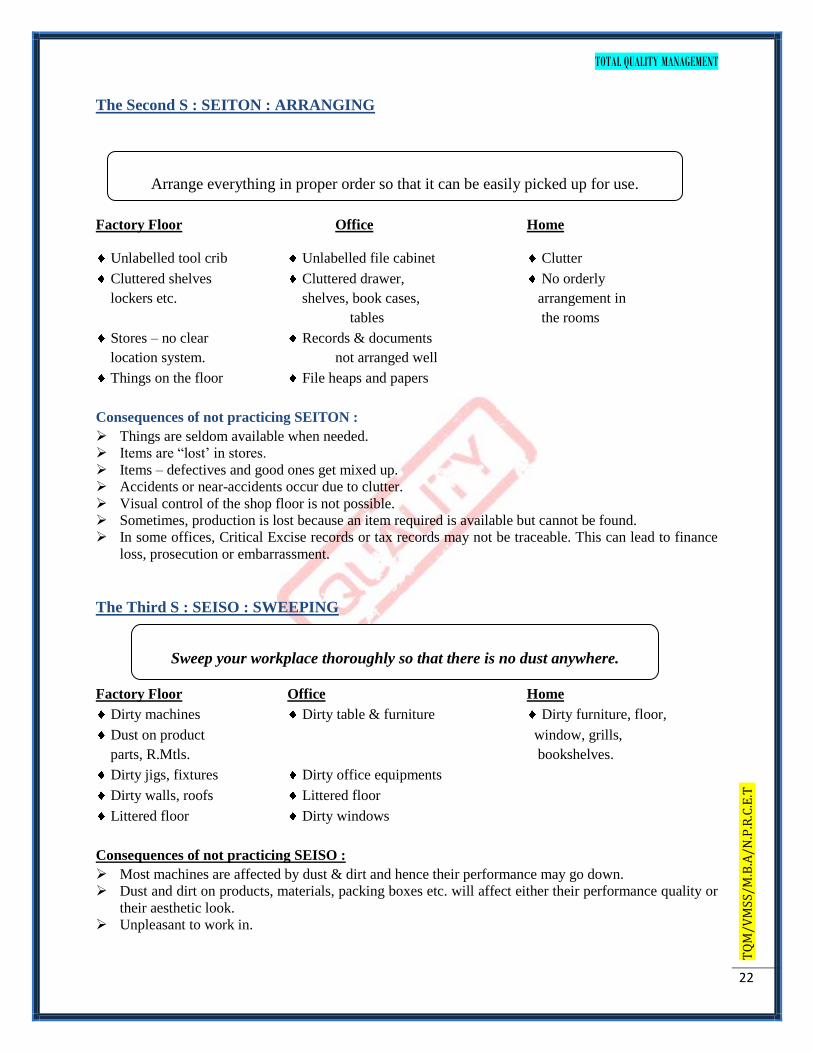
The Second S : SEITON : ARRANGING
Factory Floor Office Home
Unlabelled tool crib Unlabelled file cabinet Clutter
Cluttered shelves Cluttered drawer, No orderly
lockers etc. shelves, book cases, arrangement in
tables the rooms
Stores – no clear Records & documents
location system. not arranged well
Things on the floor File heaps and papers
Consequences of not practicing SEITON :
Things are seldom available when needed.
Items are “lost‟ in stores.
Items – defectives and good ones get mixed up.
Accidents or near-accidents occur due to clutter.
Visual control of the shop floor is not possible.
Sometimes, production is lost because an item required is available but cannot be found.
In some offices, Critical Excise records or tax records may not be traceable. This can lead to finance
loss, prosecution or embarrassment.
The Third S : SEISO : SWEEPING
Factory Floor Office Home
Dirty machines Dirty table & furniture Dirty furniture, floor,
Dust on product window, grills,
parts, R.Mtls. bookshelves.
Dirty jigs, fixtures Dirty office equipments
Dirty walls, roofs Littered floor
Littered floor Dirty windows
Consequences of not practicing SEISO :
Most machines are affected by dust & dirt and hence their performance may go down.
Dust and dirt on products, materials, packing boxes etc. will affect either their performance quality or
their aesthetic look.
Unpleasant to work in.
Arrange everything in proper order so that it can be easily picked up for use.
Sweep your workplace thoroughly so that there is no dust anywhere.

TOTAL QUALITY MANAGEMENT
TQM/VMSS/M.B.A/N.P.R.C.E.T
23
The Fourth S : SEIKETSU : CLEANLINESS
Factory Floor Office Home
Handling hazardous Free of pests Pest control
chemicals Personal hygiene Personal hygiene
Control of fumes,
hazardous dust.
Disinfecting, Personal hygiene
Consequences of not practicing SEIKETSU :
Good health and safety require the practice of Seiketsu.
Hazardous chemicals, dusty chemicals, fumes etc. can make it a dangerous place to work in.
Washing thoroughly and cleaning a place makes the workplace pleasant.
Personal hygiene is essential for healthy workforce.
The Fifth S: SHITSUKI : DISCIPLINE
Consequences of not practicing SEIKETSU :
If discipline is not practiced, then the first 4-S would backslide.
Lack of Shitsuki means not following the standards. Then, all activities related to safety and quality
will be affected.
IMPLEMENTING 5-S
1. Top Management resolve and training.
2. Formation of a top level team.
3. Understanding current circumstances.
4. Establishing priorities and targets.
5. Forming sub-teams and training.
6. Major cleaning.
7. Establishing improvement plans in each priority area.
8. Implementing the plan.
9. Verifying results.
10. Standardizing.
11. Establishing full control.
12. Looking for further improvements.
8D Methodology
8D is a problem-solving methodology for product and process improvement.
It is structured into eight disciplnes, emphasizing team synergy.
Washing with a strong overtone of keeping things disinfected as well as free of hazardous
chemicals.
Discipline especially with regard to safety rules and punctuality.

TOTAL QUALITY MANAGEMENT
TQM/VMSS/M.B.A/N.P.R.C.E.T
24
The team as a whole is better and smarter than the quality sum of the individuals
By cross-functional team, mean a group of people from different organizational vehicle that
brings together diverse talents to solve a business problem.
The cross-functional team should consists of members from management, workers on the floor
who actually perform the task, engineering, quality people and any other relevant department that
has input into the product.
The Eight disciplines
1. Use team approach
a. Establish a small group of people with the knowledge, time, authority and skill to solve
the problem and implement corrective actions. The group must select a team leader.
2. Describe the problem.
a. Describe the problem in measurable terms. Specify the internal or external customer
problem by describing it in specific terms.
3. Implement and verify short-term corrective actions.
a. Define and implement those intermediate actions that will protect the customer from the
problem until permanent corrective actions is implemented. Verify with data the
effectiveness of these actions.
4. Define and verify Root cause.
a. Identify all potential causes which could explain why the problem occurred. Test each
potential cause against the problem description and data. Identify alternative corrective
actions to eliminate root cause.
5. Verify corrective actions.
a. Confirm that the selected corrective actions will resolve the problem for the customer and
will not cause undesirable side effects.
No
Prepare for 8D Process
Select the Team- D1
Describe the Problem- D2
Implement and verify interim actions- D3
Define and verify Root causes- D4
Identify Potential causes
Describe the Problem- D2
Select likely causes
Describe the Problem- D2
Is the potential
cause a Root cause?
Identify possible corrective Action
Yes
TOTAL QUALITY MANAGEMENT
TQM/VMSS/M.B.A/N.P.R.C.E.T
25
6. Implement permanent corrective actions.
a. Define and implement the permanent corrective actions needed. Choose ongoing controls
to insure the root cause is eliminated.
7. Prevent recurrence
a. Modify specifications, update training, review work flow, and improve practices and
procedures to prevent recurrence of this and all similar problems.
8. Congratulate your team.
a. Recognize the collective efforts of your team. Publicize the achievement. Share the
knowledge and learning.
2 marks Questions
1. What are the basic ways for a continuous process improvement?
2. What are the three components of the Juran Trilogy?
3. What are the steps in the PDSA cycle?
4. Define 5S?
5. What are the phases of a Continuous Process Improvement Cycle?
6. What are the phases of a Continuous Process Improvement Cycle?
7. What are the key factors of Deming‟s Principles?
8. Compare Deming and Juran‟s Philosophy?
9. What are the differences between Kaizen and Innovation?
10. Explain the concept of Quality Circle?
11. Explain Hidden Plant?
12. Draw the schematic diagram of structure of Quality Circle for educational institution?
13. What are the seven deadly wastes that can be avoided using Kaizen Principles?
14. Explain Ishikawa PDCA model?
15. What are the crucial elements of Total Quality?
16. What is JIT?
17. What is the reason for a move from batch mode to just-in-time?

TOTAL QUALITY MANAGEMENT
TQM/VMSS/M.B.A/N.P.R.C.E.T
26
18. What is meant by Total Quality Control?
19. Draw Deming‟s cycle?
20. What are the fundamental concepts of Industrial Cycle?
16 Marks questions
1. Explain Deming‟s principles?
2. Explain the role of facilitator in quality circle?
3. Explain how Kaizen focuses on Quality improvement?
4. What are the differences between Kaizen and Innovation? Explain?
5. What are the deadly wastes that can be avoided using Kaizen principles?
6. Relate 5S concepts to ISO standards?
7. Discuss the elements of JIT?
8. Explain the Japanese concept of Kaizen. How does it differ from traditional western approaches
to improvements?
9. Explain Juran‟s trilogy?
10. Discuss 8D problem solving methodology?
UNIT III
STATISTICAL PROCESS
CONTROL
TOTAL QUALITY MANAGEMENT
TQM/VMSS/M.B.A/N.P.R.C.E.T
27
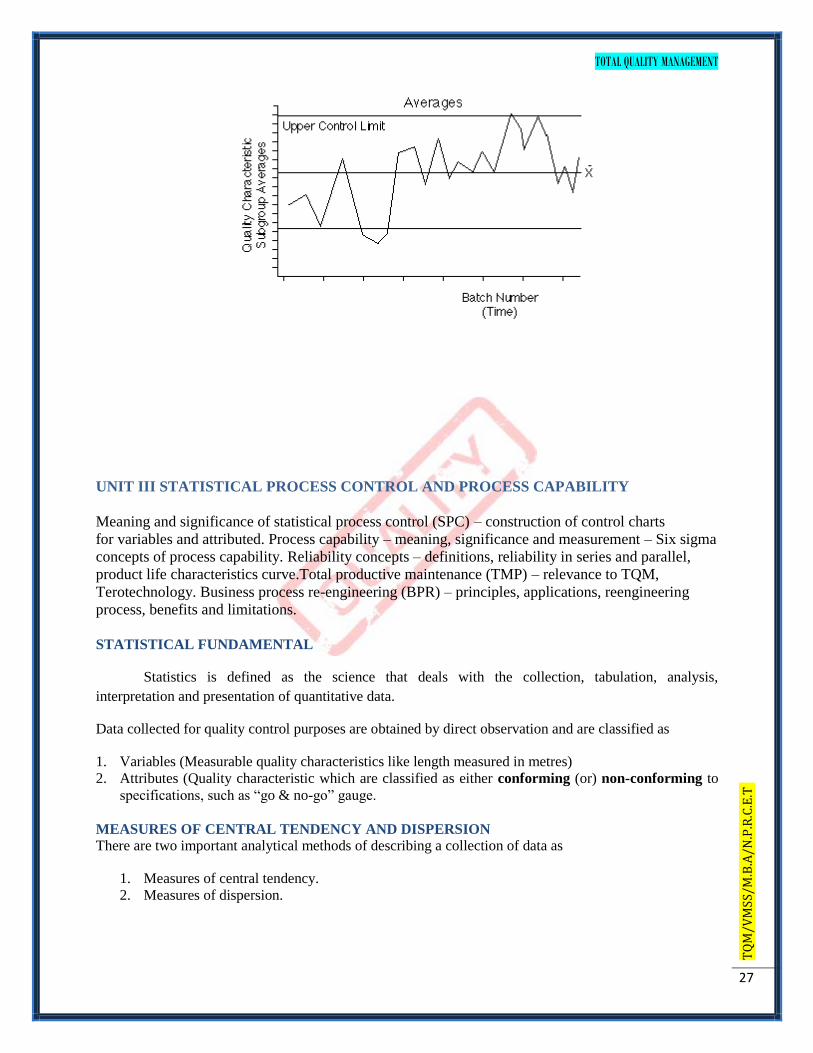
UNIT III STATISTICAL PROCESS CONTROL AND PROCESS CAPABILITY
Meaning and significance of statistical process control (SPC) – construction of control charts
for variables and attributed. Process capability – meaning, significance and measurement – Six sigma
concepts of process capability. Reliability concepts – definitions, reliability in series and parallel,
product life characteristics curve.Total productive maintenance (TMP) – relevance to TQM,
Terotechnology. Business process re-engineering (BPR) – principles, applications, reengineering
process, benefits and limitations.
STATISTICAL FUNDAMENTAL
Statistics is defined as the science that deals with the collection, tabulation, analysis,
interpretation and presentation of quantitative data.
Data collected for quality control purposes are obtained by direct observation and are classified as
1. Variables (Measurable quality characteristics like length measured in metres)
2. Attributes (Quality characteristic which are classified as either conforming (or) non-conforming to
specifications, such as “go & no-go” gauge.
MEASURES OF CENTRAL TENDENCY AND DISPERSION
There are two important analytical methods of describing a collection of data as
1. Measures of central tendency.
2. Measures of dispersion.

TOTAL QUALITY MANAGEMENT
TQM/VMSS/M.B.A/N.P.R.C.E.T
28
A measure of central tendency of a distribution is a numerical value that describes how the data tend to
build up in the centre. There are three measures in quality as
1. Average
2. Median
3. Mode
Average is the sum of observations divided by the number of observations.
i = n
Σ X i
Average = X = i=1
n
where, n = number of observations
X i = observed value
Median is the value which divides a series of ordered observations so that the number of items above it is
equal to the number of items below it
Mode is the value which occurs with the greatest frequency in a set of numbers. Mode can again
classified as
No mode
Uni mode
Bi mode
Multimode
Measure of dispersion describes how the data are spread out on each side of the central value.
The two measures of dispersion are
1. Range
2. Standard Deviation
Range is the difference between the largest and smallest values of observations in a series of numbers.
Range = R = X h – X l
Where, R = Range
X h = highest observation in a series
X l = lowest observation in a series
Standard Deviation measures the spreading tendency of the data. Larger the standard deviation, greater
the variability of data.
i = n
Σ (X i – X)2
S = i = 1
TOTAL QUALITY MANAGEMENT
TQM/VMSS/M.B.A/N.P.R.C.E.T
29
n - 1
where S = sample standard deviation
X i = observed value
n = number of observations
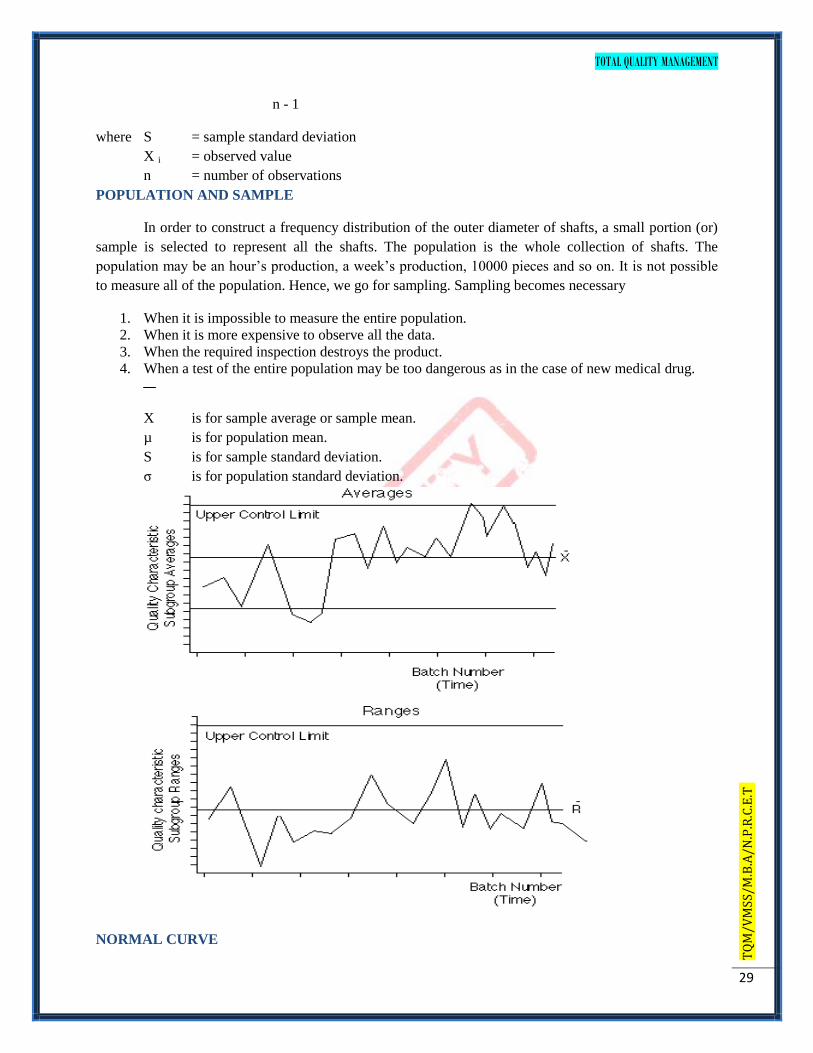
POPULATION AND SAMPLE
In order to construct a frequency distribution of the outer diameter of shafts, a small portion (or)
sample is selected to represent all the shafts. The population is the whole collection of shafts. The
population may be an hour‟s production, a week‟s production, 10000 pieces and so on. It is not possible
to measure all of the population. Hence, we go for sampling. Sampling becomes necessary
1. When it is impossible to measure the entire population.
2. When it is more expensive to observe all the data.
3. When the required inspection destroys the product.
4. When a test of the entire population may be too dangerous as in the case of new medical drug.
X is for sample average or sample mean.
µ is for population mean.
S is for sample standard deviation.
σ is for population standard deviation.
NORMAL CURVE

TOTAL QUALITY MANAGEMENT
TQM/VMSS/M.B.A/N.P.R.C.E.T
30
Normal curve is common type of population. The normal curve is symmetrical, unimodal, bell –
shaped distribution with the mean, median and mode all having the same value.
LSL, LCL
TOLERANCE
6
AVERAGEPROCESS
USL, UCLSPEC.MEAN
Figure 3.2 : Normal curve tolerance limits
CONTROL CHARTS FOR VARIABLES AND ATTRIBUTES
Variation is a law of nature because no two natural items in any category are the same. Variations
are due to the following reasons.
1. Chance causes or Natural causes.
2. Assignable causes.
Chance causes of variation are inevitable. Chance causes affect almost every production process and are
inherent in the process. They are purely random, unidentifiable sources of variations.
Hence, when only chance causes are present in a process, the process is said to be in Statistical Control.
Assignable causes result in unnatural variations. The sources of variations may be due to
Equipments
Materials
Environment
Operator etc.
The Control chart is used to look at variations, seek assignable causes and chance causes. The control
chart is a line chart with control limits.
All control charts have three basic components.
1. A centre line, usually the mathematical average of all the samples plotted.
2. Upper and Lower Control Limits that define the constraints of common cause variations.
3. Performance data plotted over time.

TOTAL QUALITY MANAGEMENT
TQM/VMSS/M.B.A/N.P.R.C.E.T
31
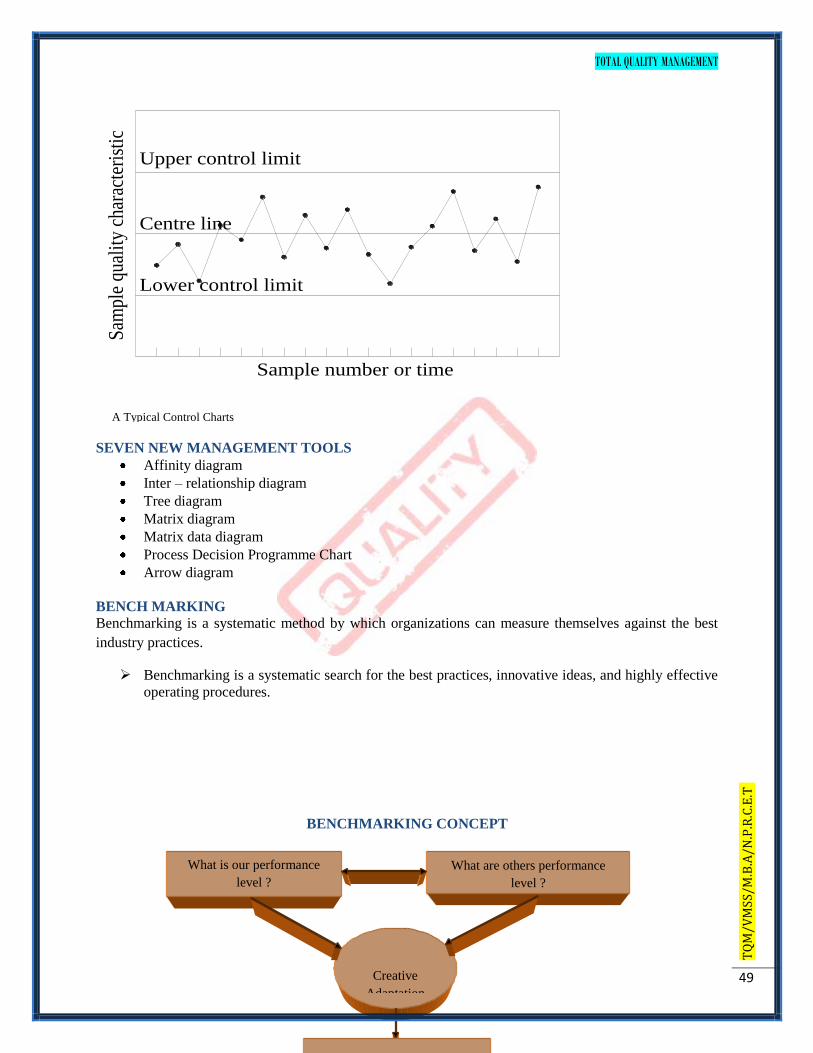
A typical control chart is a graphic display of a quality characteristic that has been measured or
computed from a sample versus sample number or time. If the process is in control, nearly all of the
sample points will fall between Upper Control Limit (UCL) and Lower Control Limit (LCL).
CONTROL CHART FOR VARIABLES
1. Mean chart – X chart & Range Chart – R Chart
X
X = ------
N
Where, N = Total number of observations.
R n = Sample size (for finding out the value of A2
R = ------ and D4 and D3 from the table)
N
Control limits for the charts are given by the following equation.
X – Chart R - Chart
CL = X CL = R
UCL X = X + A2. R UCL R = D4. R
LCL X = X - A2. R LCL R = D3. R
1. Mean chart – X chart & Standard Deviation chart – S Chart
X
X = ------
N
Where, N = Total number of observations.
S n = Sample size (for finding out the value of A3
S = ------ and B4 and B3 from the table)
N
Control limits for the charts are given by the following equation.
X – Chart S - Chart
CL = X CL = S

TOTAL QUALITY MANAGEMENT
TQM/VMSS/M.B.A/N.P.R.C.E.T
32
UCL X = X + A3. S UCL S = B4. S
LCL X = X – A3. S LCL S = B3. S
CONTROL CHART FOR ATTRIBUTES
1. p chart
2. np chart
3. c chart
4. u chart
OBJECTIVES OF THE ATTRIBUTE CHART
1. Determine the average quality level.
2. Bring to the attention of management any change in the average.
3. Improve the product quality
4. Evaluate the quality performance of operating and management personnel.
5. Suggest places to use X and R charts.
6. Determine acceptance criteria of a product before shipment to the customer.
PROCESS CAPABILITY OR SIX SIGMA
Process Capability is defined as “Minimum spread of a specific measurement variation which
will include 99.7% of the measurement from the given process”.
LSL – Lower Specification Limit
USL – Upper Specification Limit
LCL – Lower Control Limit
UCL – Upper Control Limit
USL LSL
LCL UCL

TOTAL QUALITY MANAGEMENT
TQM/VMSS/M.B.A/N.P.R.C.E.T
33
PURPOSE OF PROCESS CAPABILITY ANALYSIS
Measuring the process capability to find out whether the process is inherently capable of meeting
the specified tolerance limits.
Discovering why a process „capable‟ is failing to meet specifications.
RELIABILITY CONCEPTS
Reliability is ordinarily associated with the performance of the product.
4 factors associated with reliability are
Numerical value of probability
Intended function( statement defining successful product performance)
Life
Environmental conditions.
Reliability may also define as the probability of no failure throughout a prescribed operating period.
Formally defined as the probability that a product, piece of equipment, or system performs its
intended function for a stated period of time under specified operating conditions.
TYPES OF FAILURES
Functional failure – failure that occurs at the start of product life due to manufacturing or
material detects
Reliability failure – failure after some period of use
TYPES OF RELIABILITY
Inherent reliability – predicted by product design
Achieved reliability – observed during use
RELIABILITY MEASUREMENT
Failure rate (l) – number of failures per unit time
Alternative measures
o Mean time to failure (MTTF)
o Mean time between failures (MTBF)
FAILURE RATE CURVE OR BATH TUB CURVE

TOTAL QUALITY MANAGEMENT
TQM/VMSS/M.B.A/N.P.R.C.E.T
34
RELIABILITY PREDICTION
Many electronic components commonly exhibit a high, but decreasing, failure rate early in their
lives (as evidenced by the steep slope of the curve), followed by a period of a relatively constant failure
rate, and ending with an increasing failure rate.
PRODUCT LIFE CHARACTERISTIC CURVE
Three distinct time period
– Early failure
– Useful life
– Wear out period
PREDICTING SYSTEM RELIABILITY
Series system
Parallel system
SERIAL SYSTEM RELIABILITY
Fault Coverage is the probability that a system will recover from a failure. This can be
derived approximately by examining the design, and making reliable estimates. This number will
be difficult to determine exactly because it is based on real and often unpredictable phenomenon.
Reliability can be determined with individual system components as a function of
probabilities. The two main categories of systems are series, and parallel (redundant). In the best
case a high reliability system would have many parallel systems in series.
In terms of design, a system designer must have an intuitive understanding of the concept of
series/parallel functions. We can consider a series system where if any of the units fails, then the
system becomes inoperative. Here the reliabilities of each of the system component is chained
(ANDed) together.
RS = 1- R1 R2 R3 ….. Rn
PARALLEL SYSTEM RELIABILITY
When a ‟parallel‟ component fails the reliability of the overall system is reduced, but the
system remains completely or partially functional.
• This type of reliability adds cost, so it is normally only used in critical systems where failure is
not acceptable.
• Examples of systems using parallel reliability include,
brakes on a car - 4 brakes
electronic brakes, also have mechanical backups
lights - in dark places multiple bulbs are used so a failed bulb does not leave it dark.
• If any of the units fails the system will continue to operate. Failure will only come when all of
the modules fail. Here we are concerned with complements of the chained unreliabilities.

TOTAL QUALITY MANAGEMENT
TQM/VMSS/M.B.A/N.P.R.C.E.T
35
RS = 1- (1-R1 ) ( 1-R2 )….. (1-Rn)
Total Productive Maintenance (TPM) is defined as keeping the running plant and equipment at it
highest productive level with the co-operation of all areas of the organization.
Predictive and Preventive maintenance are essential to building a foundation for a successful TPM
environment. Predictive Maintenance is the process of using data and statistical tools to determine when
a piece of equipment will fail. Preventive Maintenance is the process of periodically performing
activities such as lubrication on the equipment to keep it running.
OBJECTIVES OF TPM
1. To maintain and improve equipment capacity.
2. To maintain equipment for life.
3. To use support from all areas of the operation.
4. To encourage input from all employees.
5. To use teams for continuous improvement.
TPM PHILOSOPHY – CONCEPT OF TPM :
Total Productive Maintenance (TPM) is an extension of the Total Quality Management (TQM)
philosophy to the maintenance function.
TPM has the following steps:
1. Management should learn the new philosophy of TPM.
2. Management should promote the new philosophy of TPM.
3. Training should be funded and developed for everyone in the organization.
4. Areas of needed improvement should be identified.
Loss measurements to identify improvement needs are
Down time losses
Reduced speed losses
Poor quality losses
5. Performance goals should be formulated.
6. An implementation plan should be developed.
7. Autonomous worth groups should be established.

TOTAL QUALITY MANAGEMENT
TQM/VMSS/M.B.A/N.P.R.C.E.T
36
Hammer and Champy (1993) define BPR as "... the fundamental rethinking and radical redesign of
business processes to achieve dramatic improvements in critical contemporary measures of performance,
such as cost, quality, service, and speed."
WHY REENGINEERING?
Customers
o Demanding
o Sophistication
o Changing Needs
Competition
o Local
o Global
Change
o Technology
o Customer Preferences
KEY PRINCIPLES OF REENGINEERING
Five key principles of BPR are:
1. Strategic redesign of process
2. Involvement of right teams of people.
3. Wise use of information technology.
4. Changed management style
5. Continuous improvement of process.
THE REENGINEERING PROCESS
Reengineering is applied to any business process. The steps involved are
STEP 1 – State a case for action
STEP 2 – Identify the process.

TOTAL QUALITY MANAGEMENT
TQM/VMSS/M.B.A/N.P.R.C.E.T
37
STEP 3 – Evaluate enables for reengineering
STEP 4 – Understand the current process.
STEP 5 – Create a new process design
STEP 6 – Implement the reengineered process.
2 marks Questions
1. Define Statistics?
2. What is a measure of central tendency?
3. What is a normal curve?
4. What is the use of the control chart?
5. Give the objectives of the attribute charts?
6. Define Six Sigma Problem Solving Method?
7. Difference between Production and Productivity?
8. Define Run chart?
9. Define Control chart?
10. Define Process Capability?
11. Explain the various charts involved in QC Tools?
12. Distinguish between X chart and R chart?
13. Explain TPM and the needs of TPM?
14. Define Business process engineering?
15. Explain about employee motivation in an organization?
16. How to implement TPM in industries?
17. Explain Reengineering process and its relevance to TQM?
18. What are the various goals of TPM?
19. Explain the Reengineering process?
20. What are the three R‟s in Reengineering?
16 marks Questions
1. Explain the significance of X chart, R chart, and C chart in improving the productivity?
2. State the steps to be followed in implementing TPM?
3. A machine is set to deliver the packets of a given weight. Ten samples of size five each were
examined and the following results were obtained
Sample: 1 2 3 4 5 6 7 8 9 10
Mean : 15 17 15 18 17 14 18 15 15 5
Range : 7 7 4 9 8 7 12 4 11 5
Calculate the values for the central line and control limits for the mean charts and range charts.
4. How we can successfully improve the team building concept in our organization?
5. Discuss the need for TPM?
6. Explain the application of Reengineering and process reengineering in a Manufacturing
organization?
7. Discuss the objectives of attribute chart?
8. What are the possible objectives of the control charts?
9. Explain the six sigma concepts of Process capability?
10. What are the benefits and limitations of BPR

TOTAL QUALITY MANAGEMENT
TQM/VMSS/M.B.A/N.P.R.C.E.T
38
UNIT IV
TOOLS AND TECHNIQUES
FOR
QUALITY MANAGEMENT
TOTAL QUALITY MANAGEMENT
TQM/VMSS/M.B.A/N.P.R.C.E.T
39
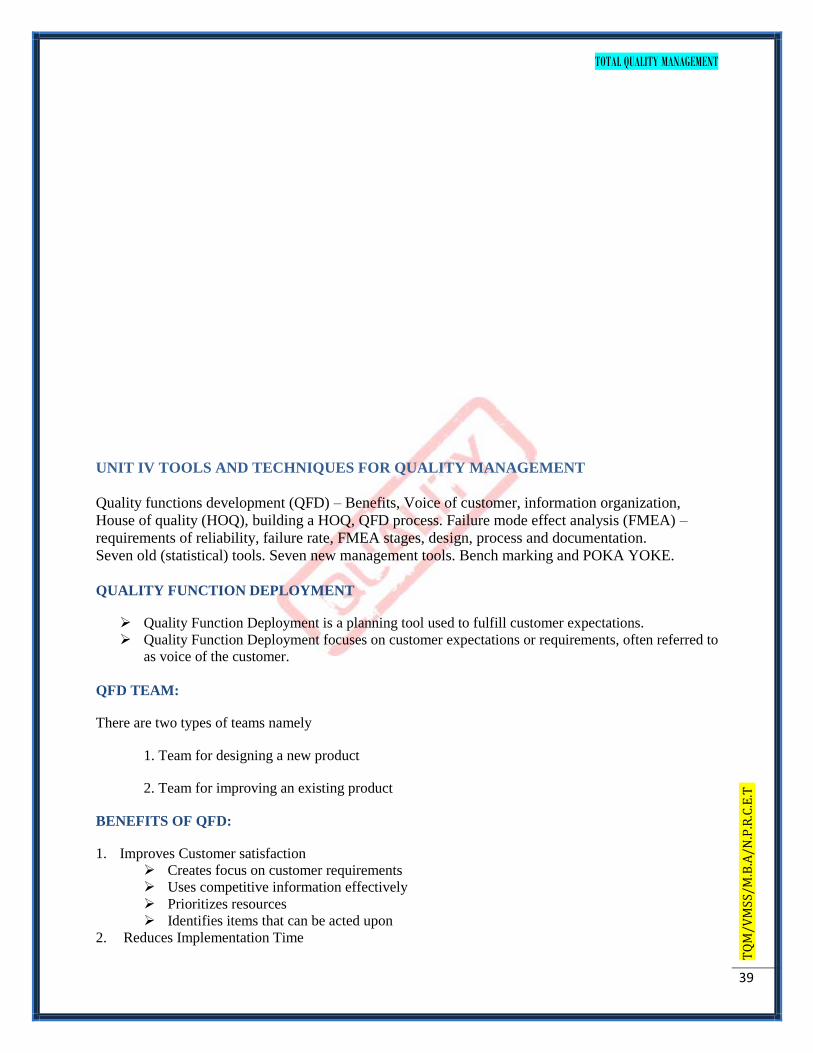
UNIT IV TOOLS AND TECHNIQUES FOR QUALITY MANAGEMENT
Quality functions development (QFD) – Benefits, Voice of customer, information organization,
House of quality (HOQ), building a HOQ, QFD process. Failure mode effect analysis (FMEA) –
requirements of reliability, failure rate, FMEA stages, design, process and documentation.
Seven old (statistical) tools. Seven new management tools. Bench marking and POKA YOKE.
QUALITY FUNCTION DEPLOYMENT
Quality Function Deployment is a planning tool used to fulfill customer expectations.
Quality Function Deployment focuses on customer expectations or requirements, often referred to
as voice of the customer.
QFD TEAM:
There are two types of teams namely
1. Team for designing a new product
2. Team for improving an existing product
BENEFITS OF QFD:
1. Improves Customer satisfaction
Creates focus on customer requirements
Uses competitive information effectively
Prioritizes resources
Identifies items that can be acted upon
2. Reduces Implementation Time

TOTAL QUALITY MANAGEMENT
TQM/VMSS/M.B.A/N.P.R.C.E.T
40
Decreases midstream design changes
Limits post introduction problems
Avoids future development redundancies
3. Promotes Team Work
Based on consensus
Creates communication
Identifies actions
4. Provides Documentation
Documents rationale for design
Adds structure to the information
Adapts to changes (a living document)
THE STEPS IN BUILDING A HOUSE OF QUALITY ARE :
1. List Customer Requirements (WHAT‟s)
2. List Technical Descriptors (HOW‟s)
3. Develop a Relationship Matrix Between WHAT‟s and HOW‟s
4. Develop an Inter-relationship Matrix between HOW‟s
5. Competitive Assessments
a. Customer Competitive Assessments
b. Technical Competitive Assessments
6. Develop Prioritized Customer Requirements
7. Develop Prioritized Technical Descriptors
Interrelationship
Between
Technical Descriptors
Technical Descriptors
(Voice of the organization)
Relationship between
Requirements and
Descriptors
Prioritized
Technical Descriptors
Cust
om
er R
equir
emen
ts
(Voic
e of
the
cust
om
er)
Pri
ori
tize
d
Cust
om
er R
equir
emen
ts
TOTAL QUALITY MANAGEMENT
TQM/VMSS/M.B.A/N.P.R.C.E.T
41
COMPONENTS OF HOQ DIAGRAM
1. customer requirements
o derived from customer statements
2. customer importance
o numeric rating of customer's priority for each requirement
3. technical requirements
o measurable specification defined by manufacturing company/project team
o define how customer's requirements will be met
4. interrelationship matrix
o design team's perception of relationship between customer requirements and technical
requirements
o usually rated as weak, medium, or strong
5. technical priorities
o usually rated 1-5
o details priorities, measure of competing product performance and difficulty developing
technical requirement
6. technical correlation matrix
o relationship between technical requirements
o usually classified as positive, negative, strong positive, or strong negative
PHASES
1. Product planning
a. customer specification turned into requirements
2. Part deployment
a. requirements turned into parts requirements
3. Process planning
a. process selected to meet part requirements
4. Process control
a. process control, inspection and test methods developed

TOTAL QUALITY MANAGEMENT
TQM/VMSS/M.B.A/N.P.R.C.E.T
42
FAILURE MODE EFFECT ANALYSIS (FMEA)
FMEA is an analytical technique that combines the technology and experience of people in identifying
foreseeable failure modes of a product or process and planning for its elimination.
It is a group of activities comprising the following:
1. Recognize the potential failure of a product or process.
2. Identify actions that eliminate / reduce the potential failure.
3. Document the process.
Two important types of FMEA are
Design FMEA
Process FMEA
INTENT OF FMEA:
Continually measuring the reliability of a machine, product or process.
To detect the potential product - related failure mode.
FMEA evaluation to be conducted immediately following the design phase.
BENEFITS OF FMEA:
Having a systematic review of components failure modes to ensure that any failure produces
minimal damage.
TOTAL QUALITY MANAGEMENT
TQM/VMSS/M.B.A/N.P.R.C.E.T
43
Determining the effects of any failure on other items.
Providing input data for exchange studies.
Determining how the high-failure rate components can be adapted to high-reliability components.
Eliminating / minimizing the adverse effects that failures could generate.
Helping uncover the misjudgments, errors etc.
Reduce development time and cost of manufacturing.
FMEA TEAM:
Engineers from
- Assembly
- Manufacturing
- Materials
- Quality
- Service
- Supplier
- Customer
FMEA DOCUMENTATION:
The purpose of FMEA documentation is
To allow all involved Engineers to have access to others thoughts
To design and manufacture using these collective thoughts (promotes team approach)
CONCEPT FMEA (CFMEA)
The Concept FMEA is used to analyze concepts in the early stages before hardware is defined
(most often at system and subsystem).
It focuses on potential failure modes associated with the proposed functions of a concept
proposal.
This type of FMEA includes the interaction of multiple systems and interaction between the
elements of a system at the concept stages.
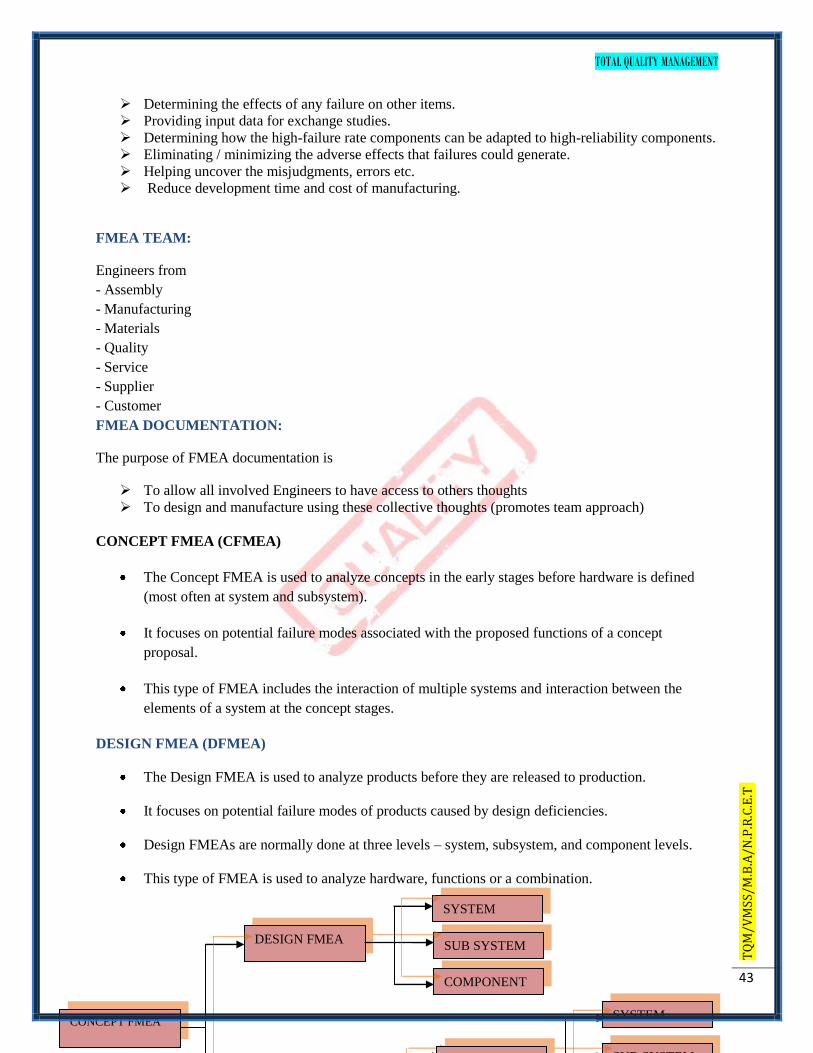
DESIGN FMEA (DFMEA)
The Design FMEA is used to analyze products before they are released to production.
It focuses on potential failure modes of products caused by design deficiencies.
Design FMEAs are normally done at three levels – system, subsystem, and component levels.
This type of FMEA is used to analyze hardware, functions or a combination.
CONCEPT FMEA
DESIGN FMEA
SYSTEM
SUB SYSTEM
COMPONENT
ASSEMBLY
SYSTEM
SUB SYSTEM

TOTAL QUALITY MANAGEMENT
TQM/VMSS/M.B.A/N.P.R.C.E.T
44
DESIGN FMEA (DFMEA)
The Design FMEA is used to analyze products before they are released to production.
It focuses on potential failure modes of products caused by design deficiencies.
Design FMEAs are normally done at three levels – system, subsystem, and component levels.
This type of FMEA is used to analyze hardware, functions or a combination.
PROCESS FMEA (PFMEA)
The Process FMEA is normally used to analyze manufacturing and assembly processes at the
system, subsystem or component levels.
This type of FMEA focuses on potential failure modes of the process that are caused by
manufacturing or assembly process deficiencies.
SEVEN OLD STATISTICAL TOOLS
• Kaoru Ishikawa developed seven basic visual tools of quality so that the average person could
analyze and interpret data.
• These tools have been used worldwide by companies, managers of all levels and employees.
The seven basic statistical tools are
HISTOGRAMS
SCATTER DIAGRAM AND STRATIFICATION
PARETO DIAGRAM
CHECK-SHEET

TOTAL QUALITY MANAGEMENT
TQM/VMSS/M.B.A/N.P.R.C.E.T
45
CAUSE AND EFFECT DIAGRAM
FLOW CHART
CONTROL CHARTS
1. HISTOGRAMS
Number of Errors Tally of Number of Errors
------------------------------- -------------------------------------------------------------------
0 1 3 0 1 0 1 0 Number Non Tabulation Freq.
1 5 4 1 2 1 2 0 -conforming
1 0 2 0 0 2 0 1 -------------------------------------------------------------------
2 1 1 1 2 1 1 0 IIII IIII IIII 15
0 4 1 3 1 1 1 1 IIII IIII IIII IIII 20
1 3 4 0 0 0 0 2 IIII III 8
1 3 0 1 2 2 3 3 IIII 5
------------------------------- 4 III 3
5 I 1
-------------------------------------------------------------------
It represents variation in sets of data through bar charts, thus demonstrating „distribution‟ in the
level of variation
It is characterized by three constituents a centre, a width, and an overall shape.
0 1 2 3 4 50
5
10
15
20
Number Non-confirming
Frequency
SCATTER DIAGRAM AND STRATIFICATION
In scatter diagram, three types of co-relations exist.
1. Positive correlation.
2. Negative correlation.
3. No correlation.
Purpose of the scatter diagram is thus; to display what happens to one variable when another
variable is changed.
The diagram is used to test a theory, that the two variables are related.

TOTAL QUALITY MANAGEMENT
TQM/VMSS/M.B.A/N.P.R.C.E.T
46
PARETO DIAGRAM
Joseph Juran observed that most of the quality problems are generally created by only a few causes.
For example, 80% of all internal failures are due to one (or) two manufacturing problems.
Identifying these “vital few” and ignoring the “trivial many” will make the corrective action give a
high return for a low money input.
5
10
15
20
25
30
35
40 36.4 %
27.3 %
22.7 %
2% 3%1% 2%
4% 3%
Inco
mpl
ete
Surf
ace
scar
s
Cra
cks
Surf
ace
pits
Rou
gh S
urfa
ce
Scra
tche
s
Less
pol
ishi
ng
Mis
s sha
rpen
Oth
ers
VITAL FEW
TRIVIAL MANY
PARETO DIAGRAM
CHECK-SHEET
CHECK SHEET
Product : Bicycle
Nonconformity Type Check Total
----------------------------------------------------------------------------------------------------------------
Blister IIII IIII IIII IIII I 21
Light spray IIII IIII IIII 15
Drips IIII IIII IIII IIII IIII 25
Others IIII IIII IIII IIII IIII 25
----------------------------------------------------------------------------------------------------------------
TOTAL 86
----------------------------------------------------------------------------------------------------------------

TOTAL QUALITY MANAGEMENT
TQM/VMSS/M.B.A/N.P.R.C.E.T
47
CAUSE AND EFFECT DIAGRAM
STEPS IN CONSTRUCTING A CAUSE & EFFECT DIAGRAM:
a. Define the problem or effect to be analyzed.
b. Form the team to perform the analysis. Often the team will uncover potential causes through
brainstorming.
c. Draw the effect box and the centerline.
d. Specify the major potential cause categories and join them as boxes connected to the centerline.
e. Identify the possible causes and classify them into the categories in step d. Create new categories,
if necessary.
f. Ranks order the causes to identify those that seem most likely to impact the problem.
g. Take corrective action.
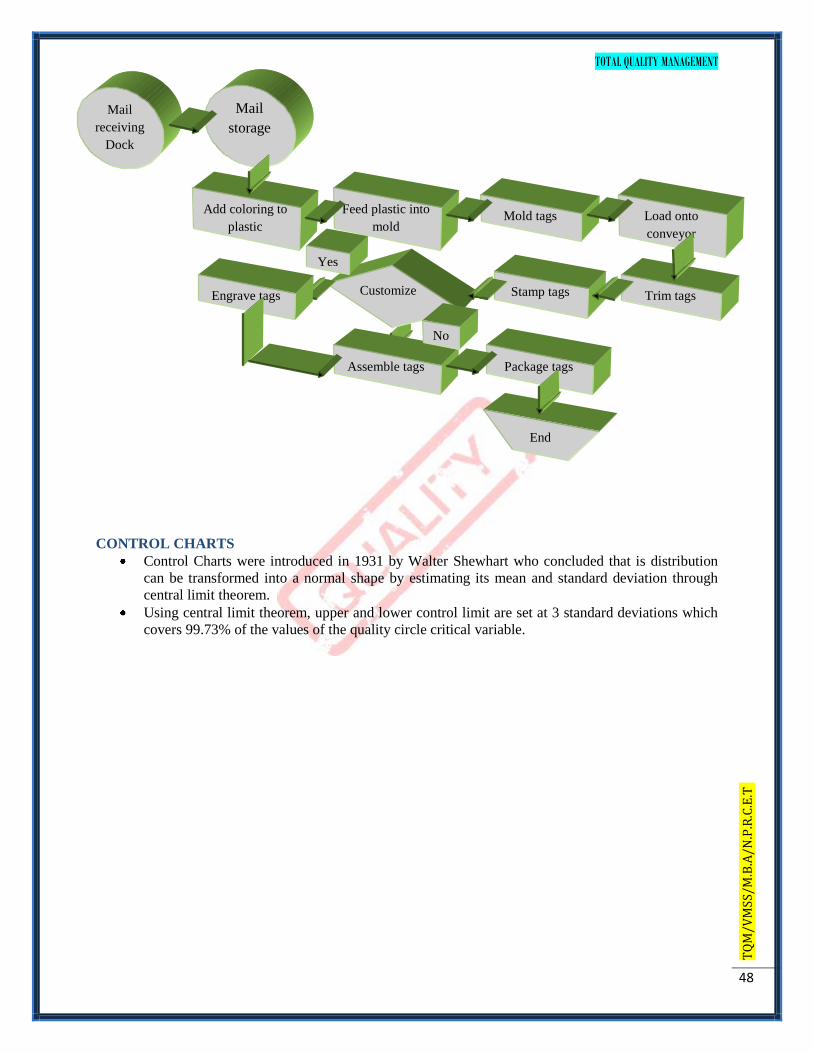
FLOW CHART
Flowcharts are pictorial representation of a process.
By breaking the process down into its constituent steps, flowcharts can be useful in identifying
where errors are likely to be found in the system.
Example , the flowchart simplifies the analysis and gives some indication as to what event may
be adversely impacting the process.
VARIATION IN
STEAM
GENERATION
FUEL
INCREASED
MOISTURE
CONTENT
SUGAR
CONTENT
INCREASED
NATURE OF
BAGASSE
FIBRE
NON-UNIFORM
FLOW OF FUEL
BOILER
WATER
QUALITY
VARIATION
IN BOILER
WATER pH
VARIATION
IN BOILER
WATER TDS
VARIATION IN
FEED WATER
TEMPERATURE
WATER
VARIATION IN
WATER LEVEL
IN DRUM
DRAUGHT
SYSTEM
IMPROPER
FUNCTION
OF ID FAN
OF SA FAN
FUNCTION
IMPROPER
FUNCTION
OF FD FAN
IMPROPER
CAUSE AND EFFECT DIAGRAM
TOTAL QUALITY MANAGEMENT
TQM/VMSS/M.B.A/N.P.R.C.E.T
48
CONTROL CHARTS
Control Charts were introduced in 1931 by Walter Shewhart who concluded that is distribution
can be transformed into a normal shape by estimating its mean and standard deviation through
central limit theorem.
Using central limit theorem, upper and lower control limit are set at 3 standard deviations which
covers 99.73% of the values of the quality circle critical variable.
Stamp tags Trim tags Customize
Add coloring to
plastic
Feed plastic into
mold Mold tags Load onto
conveyor
receiving
Dock
storage
Engrave tags
Assemble tags Package tags
End
Yes
No
TOTAL QUALITY MANAGEMENT
TQM/VMSS/M.B.A/N.P.R.C.E.T
49
Upper control limit
Centre line
Lower control limit
Sample number or time
Sam
ple
qual
ity
char
acte
rist
ic
SEVEN NEW MANAGEMENT TOOLS
Affinity diagram
Inter – relationship diagram
Tree diagram
Matrix diagram
Matrix data diagram
Process Decision Programme Chart
Arrow diagram
BENCH MARKING
Benchmarking is a systematic method by which organizations can measure themselves against the best
industry practices.
Benchmarking is a systematic search for the best practices, innovative ideas, and highly effective
operating procedures.
BENCHMARKING CONCEPT
A Typical Control Charts
What is our performance
level ?
How do we do it ?
What are others performance
level ?
How did they get there?
Creative
Adaptation
Breakthrough
TOTAL QUALITY MANAGEMENT
TQM/VMSS/M.B.A/N.P.R.C.E.T
50
REASONS TO BENCHMARK:
It is a tool to achieve business and competitive objectives
It can inspire managers (and Organizations) to compete
It is time and cost effective
It constantly scans the external environment to improve the process
Potential and useful technological breakthroughs can be located and adopted early
TYPES OF BENCHMARKING
a. Strategic Benchmarking
a. Used where organizations seek to improve their overall performance by examining the
long-term strategies and general approaches that have enabled high-performers to
succeed.
b. Performance Benchmarking
a. Or competitive Benchmarking is used where organizations consider their positions in
relation to performance characteristics of key products and services.
c. Process Benchmarking
a. Used when the focus is on improving specific critical processes and operations.
d. Functional Benchmarking
a. Or Generic Benchmarking is used when organizations look to benchmark with partners
drawn from different business sectors or areas of activity to find ways of improving
similar functions or work processes.
e. Internal Benchmarking
a. Involves seeking partners from within the same organization, i.e., from business units
located in different areas.
f. External Benchmarking
a. Involves seeking outside organizations that are known to be best in class.
g. International Benchmarking
a. Used where partners are sought from other countries because best practitioners are
located elsewhere in the world and/ or there are too few benchmarking partners within the
same country to produce valid results.
PROCESS OF BENCHMARKING
The following six steps contain the core techniques of Benchmarking
1. Decide what to benchmark

TOTAL QUALITY MANAGEMENT
TQM/VMSS/M.B.A/N.P.R.C.E.T
51
Benchmarking can be applied to any business or production process
The strategy is usually expressed in terms of mission and vision statements
Best to begin with the mission and critical factors
Choosing the scope of the Benchmarking study
Pareto analysis – what process to investigate
Cause and Effect diagram – for tracing outputs back
2. Understand current performance
Understand and document the current process
Those working in the process are the most capable of identifying and correcting problems
While documenting, it is important to quantify
Care should be taken during accounting information
3. Plan
A benchmarking team should be chosen
Organizations to serve as the benchmark need to be identified
Time frame should be agreed upon for each of the benchmarking tasks
There are three types of benchmarking
a. Internal
b. Competitive
c. Process
4. Study Others
Benchmarking studies look for two types of information
How best the processes are practiced
Measurable results of these practices
Three techniques for conducting the research are
Questionnaires
Site visits
Focus groups
5. Learn from the data
Answering a series of questions like
Is there a gap between the organization‟s performance and the performance of the best-in-class
organizations?
What is the gap? How much is it?
Why is there a gap? What does the best-in-class do differently that is better?
If best-in-class practices were adopted, what would be the resulting improvement?
Benchmarking studies can reveal three different outcomes
Negative gap
Parity
Positive gap
6. Using the findings
The objective is to close the gap. For this
Findings must be communicated to the people within the organization
Action plans must be developed to implement new processes
Groups that must agree on the change

TOTAL QUALITY MANAGEMENT
TQM/VMSS/M.B.A/N.P.R.C.E.T
52
Process owners
Upper management
Steps for the development and execution of action plans are
1. Specify tasks
2. Sequence tasks
3. Determine resources needs
4. Establish task schedule
5. Assign responsibility for each task
6. Describe expected results
7. Specify methods for monitoring results
PITFALLS AND CRITICISMS OF BENCHMARKING:
Idea of copying others
It is not a cure or a business philosophy
Some process have to be benchmarked repeatedly
It is not a substitute for innovation
BENEFITS FROM BENCHMARKING
Step changes in performance and innovation
Improving quality and productivity
Improving performance measurement
Benchmarking can also have a beneficial effect on aspects needed to support continuous improvement,
such as:
Raised awareness about performance and greater openness about relative strengths and
weaknesses;
Learning from others and greater confidence in developing and applying new approaches.
Greater involvement and motivation of staff in change programmes
Increase in willingness to share solutions to common problems and build consensus about what is
needed to accommodate changes;
Better understanding of the „big picture‟ and gaining a broader perspective of the interplay of the
factors (or enablers) that facilitate the implementation of good practice; and
Increasing collaboration and understanding of the interactions within and between organizations.
POKA YOKE
Japanese term coined by a Japanese engineer named Shingeo Shingo originally called as Baka-
Yoke means „FOOL PROOFING‟, developed based on the answers to the following questions pertaining
to a defect on a product/part.
1. What is the defect?
2. When is the defect discovered?
3. What are the standard elements involved in making the part or assembly?
4. What mistakes or errors are made?
5. Why are the mistakes made?
TOTAL QUALITY MANAGEMENT
TQM/VMSS/M.B.A/N.P.R.C.E.T
53
CHARACTERISTICS
1. Capable of being used all the time by all workers.
2. Usually installed with low implementation cost.
3. Provides instantaneous feedback, prevention or correction.
4. A component is not having the correct shape or form, then the production process should defect it
before performing any operation on it.
CLASSIFICATION
1. Prevention based Poka Yoke
2. Detection based Poka Yoke
3. Places where Poka works well
STEPS OF Poka Yoke
The key steps of Poka Yoke are as listed below:
1. Select a pilot process or a trouble-some area of the facility of interest.
2. Ask the workers to make a list of most common mistakes that result in the loss of
materials/unproductive time in these areas.
3. Workers should use Pareto analysis to rank order these errors according to their frequency of
occurrence.
4. Workers should rank the errors according to their importance and impact on the process and the
environment.
5. Workers should develop Poka Yoke devices in consultation with engineering and design staff that
eliminate the top ranked errors from both lists.
6. The implementation team should analyze the errors, frequency and their respective cost before
any Poka Yoke methods.
BENEFITS OF Poka Yoke
The important benefits are listed below
1. Reduction in waste and associated machining as nonconforming material is identified at each
stage rather than an inspection stage between several pairs of stages.
2. Reduction of waste in the system leads to reduction in Inventory holdings.
3. Extended life of machines is possible if the production is set for a specific production rate since
they always produce good quality product. This avoids unnecessary run of the machines to cope
up with the defective production of parts.
4. Improvement in customer satisfaction levels because better quality product is delivered to them.
5. Improvement in employee‟s relationship as it encourages more involvement of operators and
team members.
LIMITATIONS
Certain limitations are
1. It increases the time of inspection that the operator would spend on his job.
2. Increased time of inspection does not mean reduced cost of scrap in the long run.
3. In short term, there will be a sharp increase in scrap materials cost.
2 marks Questions
1. Define Benchmarking?

TOTAL QUALITY MANAGEMENT
TQM/VMSS/M.B.A/N.P.R.C.E.T
54
2. Enumerate the steps to benchmark?
3. What are the types of benchmarking?
4. What is a QFD?
5. What are the benefits of QFD?
6. What are the parts of house of quality?
7. How will you build a house of quality?
8. Define FMEA?
9. What are the stages of FMEA?
10. What are the phases of QFD process?
11. What are the several types of FMEA?
12. Give the seven tools of quality?
13. What are the new seven management tools?
14. Give the usage of C&E diagrams?
15. What are the various histogram shapes?
16. Define Six Sigma?
17. What are Poka yoke?
18. What are the benefits of Poka yoke?
19. List out the limitations of Poka yoke?
20. Write the steps of Poka yoke principles?
16 marks questions
1. What is FMEA?Explain the stages of FMEA?
2. Explain the House of Quality in Quality Function Deployment?
3. Explain the QFD process?
4. explain the concepts of Six Sigma?
5. Explain the Seven Management Tools?
6. Explain the QC or SPC tools?
7. Explain how the employee will be involved in doing a process?
8. Relate PDCA with 5S and explain?
9. Briefly explain the various types of FMEA/
10. Select an Electric motor of a specific application and draw a comprehensive house of quality
matrix?
UNIT V

TOTAL QUALITY MANAGEMENT
TQM/VMSS/M.B.A/N.P.R.C.E.T
55
QUALITY SYSTEMS ORGANIZING
AND IMPLEMENTATION
UNIT V QUALITY SYSTEMS ORGANIZING AND IMPLEMENTATION
Introduction to IS/ISO 9004:2000 – quality management systems – guidelines for performance
improvements. Quality Audits. TQM culture, Leadership – quality council, employee
involvement, motivation, empowerment, recognition and reward- Introduction to software quality.
INTRODUCTION TO IS/ISO 9004:2000
International standardization began in the electro technical field: the international electro
Commission (IEC) was established in 1906.
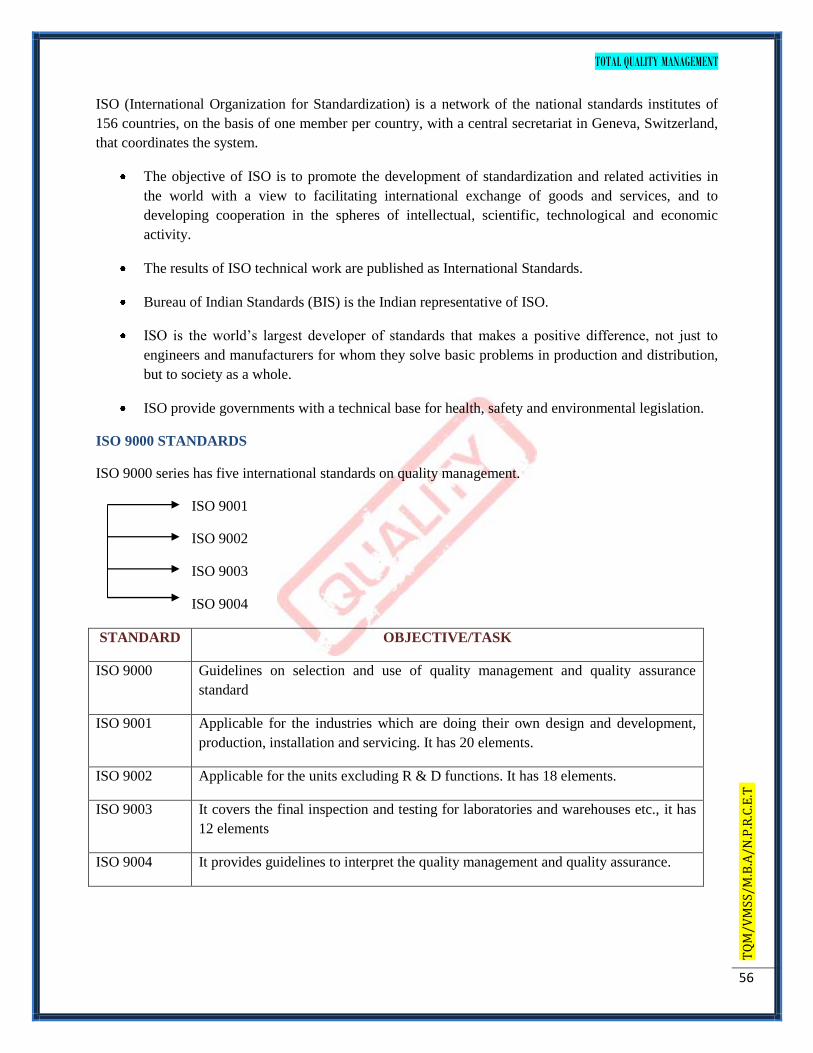
TOTAL QUALITY MANAGEMENT
TQM/VMSS/M.B.A/N.P.R.C.E.T
56
ISO (International Organization for Standardization) is a network of the national standards institutes of
156 countries, on the basis of one member per country, with a central secretariat in Geneva, Switzerland,
that coordinates the system.
The objective of ISO is to promote the development of standardization and related activities in
the world with a view to facilitating international exchange of goods and services, and to
developing cooperation in the spheres of intellectual, scientific, technological and economic
activity.
The results of ISO technical work are published as International Standards.
Bureau of Indian Standards (BIS) is the Indian representative of ISO.
ISO is the world‟s largest developer of standards that makes a positive difference, not just to
engineers and manufacturers for whom they solve basic problems in production and distribution,
but to society as a whole.
ISO provide governments with a technical base for health, safety and environmental legislation.
ISO 9000 STANDARDS
ISO 9000 series has five international standards on quality management.
ISO 9001
ISO 9002
ISO 9003
ISO 9004
STANDARD OBJECTIVE/TASK
ISO 9000 Guidelines on selection and use of quality management and quality assurance
standard
ISO 9001 Applicable for the industries which are doing their own design and development,
production, installation and servicing. It has 20 elements.
ISO 9002 Applicable for the units excluding R & D functions. It has 18 elements.
ISO 9003 It covers the final inspection and testing for laboratories and warehouses etc., it has
12 elements
ISO 9004 It provides guidelines to interpret the quality management and quality assurance.
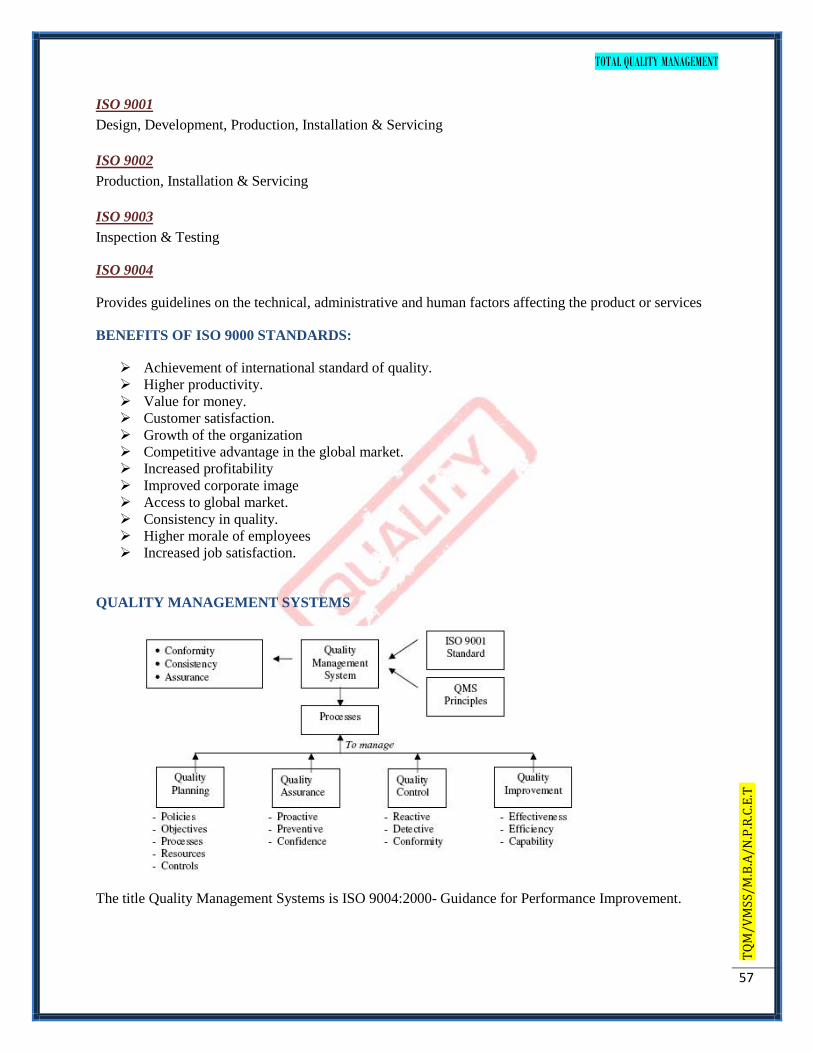
TOTAL QUALITY MANAGEMENT
TQM/VMSS/M.B.A/N.P.R.C.E.T
57
ISO 9001
Design, Development, Production, Installation & Servicing
ISO 9002
Production, Installation & Servicing
ISO 9003
Inspection & Testing
ISO 9004
Provides guidelines on the technical, administrative and human factors affecting the product or services
BENEFITS OF ISO 9000 STANDARDS:
Achievement of international standard of quality.
Higher productivity.
Value for money.
Customer satisfaction.
Growth of the organization
Competitive advantage in the global market.
Increased profitability
Improved corporate image
Access to global market.
Consistency in quality.
Higher morale of employees
Increased job satisfaction.
QUALITY MANAGEMENT SYSTEMS
The title Quality Management Systems is ISO 9004:2000- Guidance for Performance Improvement.

TOTAL QUALITY MANAGEMENT
TQM/VMSS/M.B.A/N.P.R.C.E.T
58
It provides guidance on quality management systems as a means for continual improvement of
processes that contribute to the satisfaction of an organization‟s customers and other interested
parties.
The eight quality management principles are defined in ISO 9000:2000, Quality management systems
Fundamentals and vocabulary, and in ISO 9004:2000, Quality management systems guidelines for
performance improvements.
GUIDELINES FOR PERFORMANCE MEASUREMENT
PRINCIPLE STATEMENT KEY BENEFITS
11 Customer Focus Organizations depends on their
customers and therefore should
understand current and future
customer needs, should meet
customer requirements and
strive to exceed customer
expectations.
Increased revenue.
Increased customer
satisfaction
Improved customer
loyalty.
12 Leadership Leaders establish unity of
purpose and direction of the
organization. They should
create and maintain the internal
environment in which people
can become fully involved in
achieving the organization‟s
objectives
Employee motivation
Minimization in
miscommunication
between the levels of
organization.
Activities are evaluated,
aligned and
implemented.
13 People involvement People at all levels are the
essence of an essence of
organization and their full
involvement enables their
abilities to be used for the
organization‟s benefit.
People involvement,
commitment and
motivation within
organization.
Innovation and
creativity in furthering
the organization‟s
objectives.
People performance
being accounted.
People‟s participation.

TOTAL QUALITY MANAGEMENT
TQM/VMSS/M.B.A/N.P.R.C.E.T
59
14 Process approach A desired result is achieved
more efficiently when activities
and related resources are
managed as a process.
Lower cost and shorter
cycle times through use
of resources.
Improved, consistent
and predictable results.
Focused and prioritized
improvement
opportunities.
15 System approach to
management
Identifying, understanding and
managing interrelated processes
as a system contributed to the
organization‟s effectiveness and
efficiency in achieving its
objectives
Integration and
alignment of the
process.
Ability to focus on the
key process.
Provide confidence to
interested parties.
16 Continuous
improvement
Continual improvement of the
organization‟s overall
performance should be a
permanent objective of the
organization.
Performance advantage.
Alignment of
improvement activities
at all levels
Flexibility to react
quickly to
opportunities.
17 Factual approach to
decision making
Effective decisions are based on
the analysis of data and
information
Informed decisions.
Increased ability to
demonstrate the
effectiveness of past
decisions through
reference to factual
records.
Increased ability to
review, challenge, and
change opinions and
decisions.
18 Mutually beneficial An organization and its
suppliers are interdependent and
Increased ability to
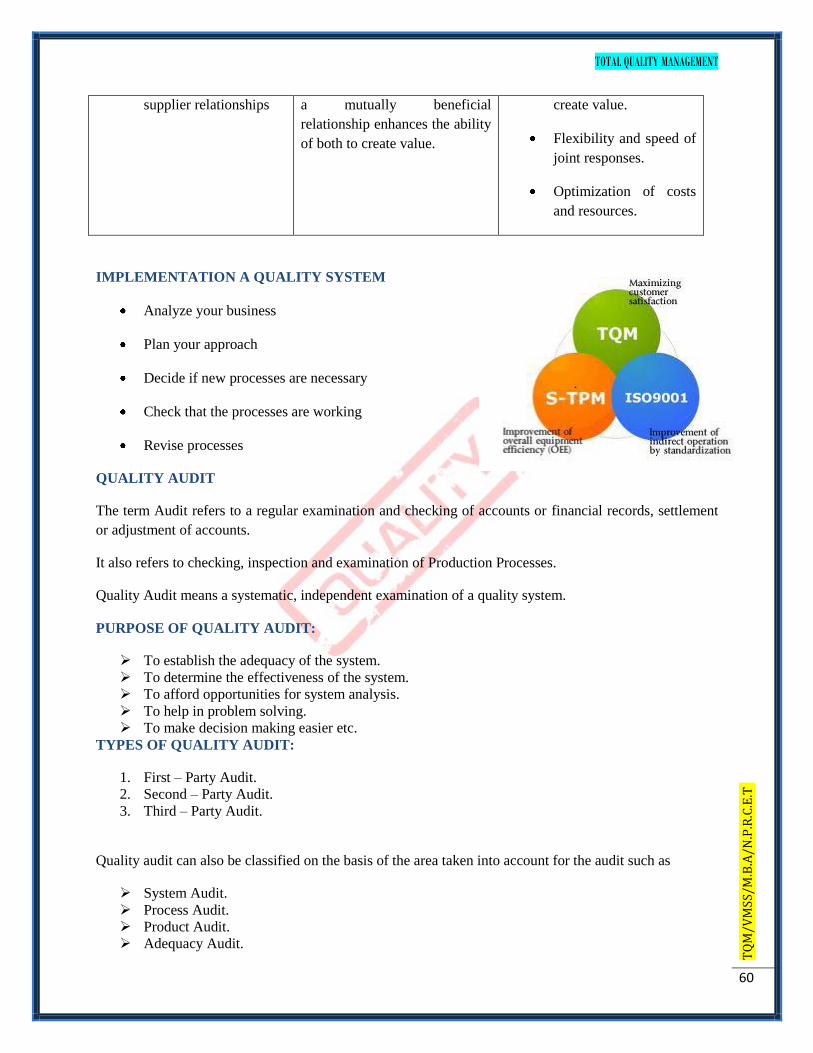
TOTAL QUALITY MANAGEMENT
TQM/VMSS/M.B.A/N.P.R.C.E.T
60
supplier relationships a mutually beneficial
relationship enhances the ability
of both to create value.
create value.
Flexibility and speed of
joint responses.
Optimization of costs
and resources.
IMPLEMENTATION A QUALITY SYSTEM
Analyze your business
Plan your approach
Decide if new processes are necessary
Check that the processes are working
Revise processes
QUALITY AUDIT
The term Audit refers to a regular examination and checking of accounts or financial records, settlement
or adjustment of accounts.
It also refers to checking, inspection and examination of Production Processes.
Quality Audit means a systematic, independent examination of a quality system.
PURPOSE OF QUALITY AUDIT:
To establish the adequacy of the system.
To determine the effectiveness of the system.
To afford opportunities for system analysis.
To help in problem solving.
To make decision making easier etc.
TYPES OF QUALITY AUDIT:
1. First – Party Audit.
2. Second – Party Audit.
3. Third – Party Audit.
Quality audit can also be classified on the basis of the area taken into account for the audit such as
System Audit.
Process Audit.
Product Audit.
Adequacy Audit.

TOTAL QUALITY MANAGEMENT
TQM/VMSS/M.B.A/N.P.R.C.E.T
61
Compliance Audit.
QUALITY AUDIT DOCUMENTATION
In every organization, the quality system must be documented properly. The documentation of the system
can be seen as a hierarchical format as shown.
1
POLICY
2
PROCEDURE
3
PRACTICE
4
PROOF
There are 3 documents
1. Audit plan
a. The audit plan is sent to the department being audited a few days prior, it should include
the date of the audit, the planned time, duration, auditors names, location and the policies
and procedures that will be used during the audit.
2. Audit notes
a. The notes are the Auditor‟s questions that will be asked during the audit.
3. Audit report
a. The audit report is the official document used to report the findings of the audit.
TQM CULTURE
Total Quality Management is an approach to the art
of management that originated in Japanese industry
in the 1950‟s and has become steadily more popular
in the west since 1980‟s.
Total Quality is a description of the culture, attitude
and organization of a company that aims to provide,
and continue to provide, its customers with products
and services that satisfy their needs.
TOTAL QUALITY MANAGEMENT
TQM/VMSS/M.B.A/N.P.R.C.E.T
62
The culture requires quality in all aspects of the company‟s operations, with things being done
right first time, and defects and waste eradicated from operation.
TQM has achieved either significant or even tangible improvements in quality, productivity,
competitiveness or financial return.
INFORMATION FROM RESULTS OF TQM IMLEMENTATION
Look at the world class companies.
Train top management, people involve in new product development, and people involved with
customers.
Easy to introduce TQM culture than in one without TQM.
Some important aspects of TQM include
Customer-driven quality
TM leadership from top management
Continuous improvement
Fast response
Action based on facts
Employee participation
Developing a TQM culture
Product development in a TQM environment
Awards for quality achievement
Leadership in TQM
LEADERSHIP CONCEPT
A leader should have the following concepts
1. People, Paradoxically, need security and independence at the
same time.
2. People are sensitive to external and punishments and yet are also
strongly self - motivated.
3. People like to hear a kind word of praise. Catch people doing
something right, so you can pat them on the back.
4. People can process only a few facts at a time; thus, a leader needs
to keep things simple.
5. People trust their gut reaction more than statistical data.
6. People distrust a leader‟s rhetoric if the words are inconsistent
with the leader‟s actions.
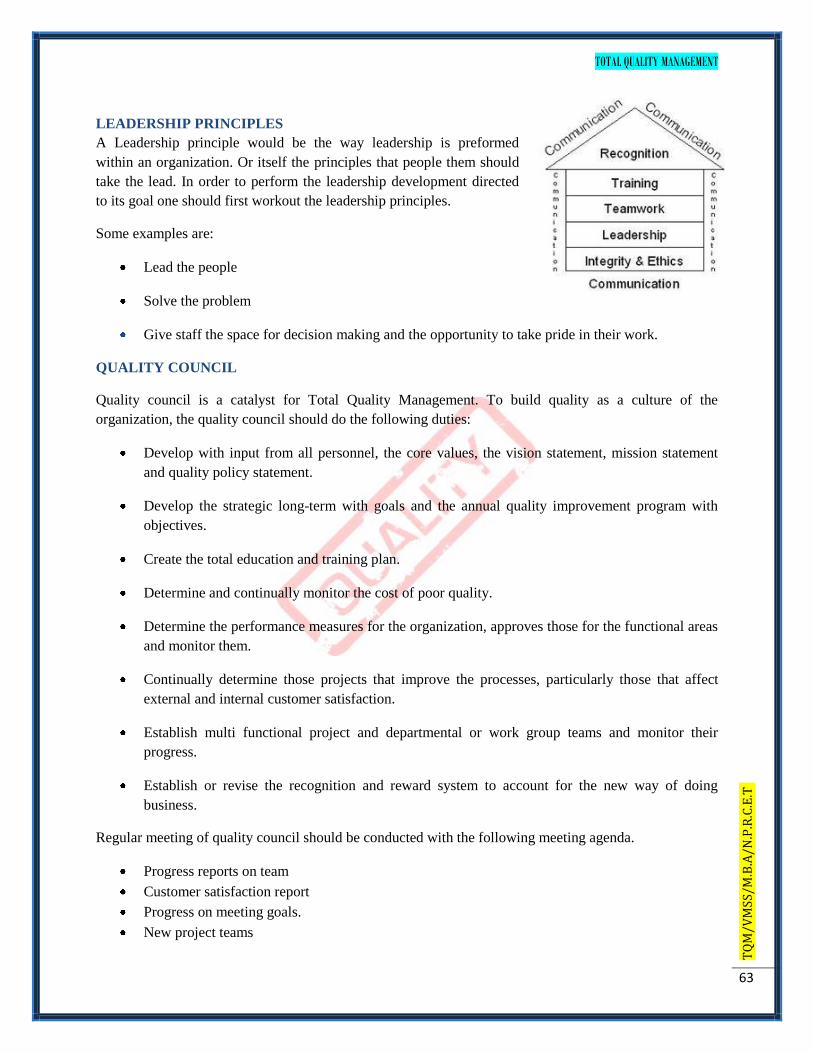
TOTAL QUALITY MANAGEMENT
TQM/VMSS/M.B.A/N.P.R.C.E.T
63
LEADERSHIP PRINCIPLES
A Leadership principle would be the way leadership is preformed
within an organization. Or itself the principles that people them should
take the lead. In order to perform the leadership development directed
to its goal one should first workout the leadership principles.
Some examples are:
Lead the people
Solve the problem
Give staff the space for decision making and the opportunity to take pride in their work.
QUALITY COUNCIL
Quality council is a catalyst for Total Quality Management. To build quality as a culture of the
organization, the quality council should do the following duties:
Develop with input from all personnel, the core values, the vision statement, mission statement
and quality policy statement.
Develop the strategic long-term with goals and the annual quality improvement program with
objectives.
Create the total education and training plan.
Determine and continually monitor the cost of poor quality.
Determine the performance measures for the organization, approves those for the functional areas
and monitor them.
Continually determine those projects that improve the processes, particularly those that affect
external and internal customer satisfaction.
Establish multi functional project and departmental or work group teams and monitor their
progress.
Establish or revise the recognition and reward system to account for the new way of doing
business.
Regular meeting of quality council should be conducted with the following meeting agenda.
Progress reports on team
Customer satisfaction report
Progress on meeting goals.
New project teams

TOTAL QUALITY MANAGEMENT
TQM/VMSS/M.B.A/N.P.R.C.E.T
64
Benchmarking report
Recognition dinner
EMPLOYEE INVOLVEMENT
Employee involvement is a vital factor for implementing and improving quality and productivity.
Employee involvement, participation, and empowerment form the cornerstone of TQM.
EMPLOYEE MOTIVATION
Motivation has been defined as: the psychological process that gives behavior purpose and
direction; Motivation is operationally defined as the inner force that drives individuals to accomplish
personal and organizational goals.
NEED FOR EMPLOYEE MOTIVATION
Motivated employees are needed in our rapidly changing workplaces.
Motivated employees help organizations survive.
Motivated employees are more productive.
Managers need to understand what motivates employees within the context of the roles they perform.
THEORIES ON MOTIVATION:
Five approaches that have led to our understanding of motivation are:
Maslow‟s need- hierarchy theory
Herzberg‟s two-factor theory
Vroom‟s expectancy theory
Adam‟s equity theory, and
Skinner‟s reinforcement theory
MASLOW’S NEED HIERARCHY OF MOTIVATION

TOTAL QUALITY MANAGEMENT
TQM/VMSS/M.B.A/N.P.R.C.E.T
65
Maslow argued that lower level needs had to be satisfied before the next higher level need would
motivate employees.
HERZBERG‟S work categorized motivation into two factors, namely:
Motivation – intrinsic factors such as achievement and recognition
Hygiene – extrinsic factors such as pays and job security.
VROOM‟S theory is based on the belief that employee effort will lead to performance and performance
will lead to rewards.
ADAM‟S theory states that employees strive for equity between themselves and other workers.
SKINNER‟S theory simply states those employees‟ behaviors that lead to positive outcomes will be
repeated and behaviors that lead to negative outcomes will not be repeated.
EMPLOYEE EMPOWERMENT
The concept of empowerment is to delegate responsibility to the lowest levels in the organization.
The decision making should be to a high degree decentralized and individuals or work designed
teams should be responsible for a complete part of work processes.
Participative management has become a key word in empowerment.
TOTAL QUALITY MANAGEMENT
TQM/VMSS/M.B.A/N.P.R.C.E.T
66
The most crucial critical success factor in TQM is to recognize the importance of living up to
customers‟ expectation.
Internal satisfaction can be achieved in the following ways:
Establish a high degree of participative management.
Decentralization of hierarchy power structures.
Create a large degree of autonomy throughout the organization.
Development of effective work groups.
The employee empowerment can have the following phases:
Training
Suggestion scheme
Measurement and recognition
Excellence teams
RECOGNITION AND REWARD
Employee recognition is a communication tool that reinforces and rewards the most important
outcomes people create for our business.
When we consider employee recognition processes, we need to develop recognition that is
equally powerful for both the organization and the employee.
Five important tips for effective recognition
Establish criteria for what performance constitutes reward able behavior.
All employees must be eligible for the recognition.
Anyone who then performs at the level or standard stated in the criteria receives the reward.
REWARDING:
Rewarding means providing incentives to and recognition of employees, individually and as
members of group, for their performance and acknowledging their contributions to the organization‟s
mission.
ROLE OF INFORMATION TECHNOLOGY IN QUALITY MANAGEMENT
Information Technology (IT) or information and communication technology (ICT) is the
technology required for information processing.
Computers can contribute to quality functions in many ways and they are classified as
Provide access to design by the experts.
Simulate the production process and the sensitivity of the design.
Evaluate a production design for manufacturability, etc.
Indicate possible problems and suggest remedies during design.
Plan a manufacturable production process, etc.
Act as a continuously updated quality engineering record.
TOTAL QUALITY MANAGEMENT
TQM/VMSS/M.B.A/N.P.R.C.E.T
67
Generally the software packages for quality function are available in the following category.
Calibration
Capability studies
Data acquisition
Design of experiment
Inspection
Management
Measurement
Quality assurance.
Quality cost
Simulation
Statistical process control
Taguchi techniques,
Different forms of programs like CAD, FEM, and knowledge based systems intended for quality
functions.
QUALITY INFORMATION SYSTEM
A quality information system is an organized method of collecting, storing, analyzing and reporting
information on quality to assist decision makers at all levels of management.
The inputs for quality information system include:
Market research information on quality
Product design test data
Information on design evaluation for quality
Information on purchased parts and materials
Process data
Final inspection data
Field performance data
Result of quality measurement
INFORMATION QUALITY ISSUES
In creating new software, the primary issue is the lack of sufficient
communication between the user and the software developer. To overcome this problem we can adopt
project management approach to plan and control quality software development..
The main elements of such programs draw upon some of the techniques used in controlling the quality
and reliability of physical products. Emphasis is on both detection and prevention of errors. The elements
usually include:
Design review
Documentation review
Validation of software rests.
Corrective action system
Configuration management.

TOTAL QUALITY MANAGEMENT
TQM/VMSS/M.B.A/N.P.R.C.E.T
68
2 marks Questions
1. Give the ISO 9000 Series of Standards?
2. What is the need for ISO 9000?
3. Give the objectives of the internal audit?
4. What are the requirements of ISO 14001?
5. Analyze TQM?
6. Define Quality Audits ?
7. What are the benefits of ISO?
8. Give the ISO 9001 requirements?
9. What are the methods of actual audit?
10. What is needed for a leader to be effective?
11. What is the important role of senior management?
12. What are the general duties of a quality council?
13. Define Employee Involvement?
14. State Maslow‟s Hierarchy of Needs?
15. State Frederick Herzberg‟s Two-factor theory?
16. What does an employee want?
17. What are the concepts to achieve a motivated work force?
18. Define Empowerment?
19. What are the three conditions necessary to create the empowered environment?
20. What are the stages of team development?
16 marks Questions
1. Explain in detail the examples of ISO/QS 9000?
2. Explain the quality management systems?
3. Describe how the ISO auditing system works?
4. Explain how motivation helps in TQM?
5. Explain the required qualities of a team leader?
6. How and when should we empower people/
7. Explain the Bench marking Process and reasons to Benchmark?
8. Explain the elements of ISO 9000:2000?
9. Explain the implementation and documentation of Quality System?
10. Discuss about ISO 9000:2000 Quality Systems?
TOTAL QUALITY MANAGEMENT
TQM/VMSS/M.B.A/N.P.R.C.E.T
69
Model Question Paper – 1
Part A (10 x 2 = 20 Marks)
1. Define Quality as per Ed. Deming?
2. What do you understand by quality statement?
3. Explain: Empowerment?
4. Explain: Supplier selection?
5. List out various measurements of dispersion in SPC?
6. Explain the rules to be followed in sample selection?
7. List down the pillars of TPM?
8. Expalin: Taguchi Quality Loss Function?
9. Explain about NCR?
10. Explain the need for the quality systems in an organization?
Part B (5x16=80 Marks)
11. (a).(i) List out the barriers of TPM implementation?[ 8]
(ii). Discuss about the analysis techniques for the quality cost?[ 8]
(or)
(b). (i). Explain the principles of TQM?[ 8] (ii) Explain about the strategic planning?[ 8]
12. (a). Explain the following:(i). 5S[ 5] (ii) Kaizen[ 5] (iii) Supplier rating and relationship diagram[ 6]
(or)
(b) Discuss about Maslow's need hierarchy theory and Herzberg's two factor theory for motivation?[16]
13. (a). Explian in detail: (i). Process capability[ 8] (ii). Six sigma[ 8]
(or)
(b) Discuss the need, construction and applications of control charts for variables. [16]
14. (a). Discuss the objectives, process, outcome and benefits of FMEA?[16]
(or)
(b). Explain about the following :(i). QFD process[8] (ii). Benchmarking process[8]
15.(a). (i). Explain about quality system auditing?[8]
(ii) Discuss the implementation of ISO:9000:2000 quality systems?[8]
(or)
TOTAL QUALITY MANAGEMENT
TQM/VMSS/M.B.A/N.P.R.C.E.T
70
(b).(i). Explain about the documentation process in ISO 9000:2000 systems? [8]
(ii) Discuss ISO 14000 requirements and its benefits?[ 8]
Model Question Paper - 2
Answer ALL questions
PART A —— (10 x 2 = 20 marks)
1. What are the activities of quality planning
2. What is the philosophy behind „Management by Wandering Around‟ (MBWA)?
3. What are the important factors that influence purchase?
4. Is cleanliness the only benefit of implementing „5 S‟ practices?
5. What is the purpose of Pareto Diagrams?
6. How are the measures of central tendency used in quality analysis?
7. What are the reasons for benchmarking?
8. What are the losses reduced by TPM?
9. What is the purpose of ISO 9000 quality system?
10. How does the conceptual approach to ISO 14001 differ from ISO 9001?
PART B —— (5 X16 = 80 marks)
11. (a) (i) 'What are the dimensions of quality? Discuss eight of them. (8)
(ii) What are the duties of quality council? (8)
(Or)
(b) (i). What are the steps in strategic planning? l (8)
(ii) What are the barriers to TQM., implementation? How are they eliminated?(8)
12. (a) (i) What is the concern of most consumer? Is it price of the product or
service? Explain in detail.(4)
(ii) What are the different ways of receiving customer feedback? How are the feedback used? (12)
(or)
(b)(i) What are the types of teams formed in industries? Discuss the functions of any four of them(8)
(ii) How is PDSA cycle used? Discuss with a case study. • (8)

TOTAL QUALITY MANAGEMENT
TQM/VMSS/M.B.A/N.P.R.C.E.T
71
13. (a) (i) Draw cause and effect diagram for an engineering problem. (8) .
(ii) What are the interpretations of different shapes of histograms? (8) . `
(or)
(b) (i) An industrial product was subjected to inspection with a batch size of 5-00 for ten consecutive
days- The number of defective pieces found are 33, 42, 44, 56, 60, 43, 55, 42, 28.and 70. Draw a p-chart
and discuss. (12)
(ii) How is Process Decision Program Chart (PDPC) used? Give an example. (4)
14. (a) Draw the house of quality for an industrial product. Explain various 4
stages. . (16)
(or)
(b) How is FMEA performed? Discuss with an example; Draw the table and give details. (16)
15. (a) (What are the steps in the implementation of ISO 9000 quality system. Discuss in detail. (16)
(or)
(b) (i) Discuss the environmental management system model with a block diagram.(10)
(ii) What are the global benefits of environmental management system? Discuss-in detail.(6)