important text characteristics for early-grades text ...€¦ · which text characteristics are...
TRANSCRIPT

Running Head: EARLY-GRADES TEXT COMPLEXITY
Important Text Characteristics for Early-Grades Text Complexity
Jill Fitzgerald
MetaMetrics and The University of North Carolina at Chapel Hill
Emerita and Research Professor
Jeff Elmore
MetaMetrics
Heather Koons
MetaMetrics and The University of North Carolina at Chapel Hill
Elfrieda H. Hiebert
TextProject and The University of California at Santa Cruz
Kimberly Bowen
Eleanor E. Sanford-Moore
MetaMetrics
A. Jackson Stenner
MetaMetrics and The University of North Carolina at Chapel Hill
May 7, 2014
ThisistheacceptedmanuscriptofanarticlepublishedintheJournalofEducationalPsychology,January,2015.DOI:10.1037/a0037289.APAholdsthecopyright.ThismanuscriptmaynotexactlyreplicatethefinalversionpublishedintheAPAjournal.Itisnotthecopyofrecord.Pleaseretrievethepublishedversionforcitationorquotes.
Early‐GradesTextComplexity
2
Abstract
The Common Core set a standard for all children to read increasingly complex texts throughout
schooling. The purpose of the present study was to explore text characteristics specifically in
relation to early-grades text complexity. Three-hundred-fifty primary-grades texts were selected
and digitized. Twenty-two text characteristics were identified at four linguistic levels, and
multiple computerized operationalizations were created for each of the 22 text characteristics. A
researcher-devised text-complexity outcome measure was based on: teacher judgment of text
complexity in the 350 texts; and text complexity as gauged from student responses using a maze
task for a subset of the 350 texts. Analyses were conducted using a logical analytical progression
typically used in machine-learning research. Random forest regression was the primary statistical
modeling technique. Nine text characteristics were most important for early-grades text
complexity including word structure (decoding demand and number of syllables in words), word
meaning (age of acquisition, abstractness, and word rareness), and sentence and discourse-level
characteristics (intersentential complexity, phrase diversity, text density/information load, and
non-compressibility). Notably, interplay among text characteristics was important to explanation
of text complexity, particularly for subsets of texts.
Keywords: Text complexity, early-grades reading, random forest regression, machine-learning
Early‐GradesTextComplexity
3
Important Text Characteristics for Early-Grades Text Complexity
The United States Common Core State Standards (CCSS) for English Language Arts
(National Governors Associate Center for Best Practices [NGACBP] & Council of Chief State
School Officers [CCSSO], 2010) bring unprecedented attention to the nature of texts that
students read. The goal of the Standards is for high school graduates to be well prepared for
college and workplace careers. The ability to read college-and-workplace texts plays a prominent
role in the Standards for that preparation. Citing prior evidence of a current-day gap between the
text-complexity levels at high-school graduation and college and workplace (e.g., ACT, 2006;
Williamson, 2008), the CCSS authors set a challenging standard for all students to be able to
“comprehend texts of steadily increasing complexity as they progress through school . . .” (NGA
& CCSSO, 2010, Appendix A). The foundation for students’ ability to read increasingly complex
texts begins in early-reading exposure, and considerable controversy and debate has focused
attention on the potential impact of the text-complexity Standard for young readers (e.g., Hiebert,
2012; Mesmer, Cunningham, & Hiebert, 2012). As educators attempt to support youngsters to
read increasingly complex texts, early-grades teachers need a sound understanding of what
makes texts more or less complex for young students who are beginning to learn to read. An
empirically-based understanding of text complexity for early-grades readers is critical for
practical reasons and should also contribute to development of theoretical modeling of text
complexity. The purpose of the present study was to explore text characteristics specifically in
relation to early-grades text complexity. The research questions addressed in the study were: a)
Which text characteristics are most important for early-grades text complexity; b) Is there
interplay of text characteristics in relation to text complexity, and if there is, can any aspects of
Early‐GradesTextComplexity
4
the interplay be described? The research questions were addressed using computer-based
analysis of texts. The present study makes an additional contribution to the educational research
literature in that a statistical approach and methodological sequence unique in the educational
research literature were used—random forest regression in conjunction with a machine-learning
research paradigm.
What is Text Complexity?
On a broad stage, in science writ large, “complexity” has overtaken “parsimony” as a
focal interest in both physical and social sciences. Scientists increasingly aim to understand
complexity as it exists naturally in the world—as opposed to more traditional efforts to reduce
natural occurrences to some fundamental simplicity (e.g., Bar-Yam, 1997). The seminal
philosophical definition of complexity may be attributed to Rescher (1998, p. 1)—“Complexity
is . . . a matter of the number and variety of an item’s constituent elements and of the
elaborateness of their interrelational structure, be it organizational or operational.” Complexity
theory suggests that although the complexity of some objects, events, or actions may not be fully
understood, three essential elements of complex systems can be pinpointed and characterized
(Bar-Yam, 1997; Kauffman, 1995). First, in general, complex systems involve a large number of
mutually interacting parts, but even a small number of interacting components can behave in
complex ways (Bar-Yam, 1997; Albert & Barabási, 2002). When complexity occurs, a reciprocal
relationship exists between parts and wholes. Ensembles are influenced by the distinct elements,
but the distinct elements are also influenced by the whole of the ensemble (Merlini Barbaresi,
2003). Second, however, there is usually a limit to the number of parts the researcher has
primary interest in, and paradoxically, for practical and research purposes, often summative
description of a complicated system may require description as a particular few-part system
Early‐GradesTextComplexity
5
where the few-part system retains the character of the whole (Bar-Yam, 1997). Third, most
complex systems are purposive, and there is often a sense in which the systems are engineered
(Bar-Yam, 1997).
Following suit, for the present study, a dynamic systems definition of text complexity
was embraced. First, “text” is defined as “. . . an organized unit, whose various components or
levels are recognized to give autonomous contributions to the global effect . . .” (Merlini
Barbaresi, 2002, p. 120). Second, text complexity is “. . . a dynamic configuration resulting from
the contributions of complex phenomena, as they occur at the various text levels” and across text
levels (Merlini Barbaresi, 2003, p. 23). The CCSS text-complexity definition further undergirded
the present work—text complexity is “the inherent difficulty of reading and comprehending text
combined with consideration of the reader and task variables” (NGA & CCSSO, 2010, Appendix
A, Glossary of Key Terms, p. 43). The Common Core definition is embedded in a systems
outlook in which complexity arises among reader, printed text, and situation during the whole of
a reading act. That is, when engaged in a specific reading encounter, complexity is in some
degree relative to an individual and to contextual characteristics (such as age or developmental
reading level or degree of teacher support while reading). Concomitantly, complexity of
particular texts is relative to populations of readers at different ages or reading ability levels (cf.
Miestamo, 2006 and Kusters, 2008 on relative versus absolute complexity; van der Sluis & van
den Broek, 2010). That is, when viewed on a continuum of complexity in relation to many
readers’ developmental levels, texts have an emergent nature and can be assigned a “complexity
level” to situate them on an entire continuum. The stance is consistent with theories of reading
dating back to Rosenblatt’s expositions on reading as transactional (1938; 2005) and Rumelhart’s
(1985) explanation of reading as interactive, and more recently to the widely accepted Rand

Early‐GradesTextComplexity
6
Reading Study Group model of reading (Snow, 2002). For example, in the Rand Reading Study
Group model, text is squarely rooted in an interaction with the reader as reading happens during
an activity within a particular social context. The stance is also consistent with Mesmer,
Cunningham, and Hiebert’s (2012) exposition of early-grades text characteristics in that they
also address text complexity as situated within individual and social/instructional contexts.
Commensurate with the three essential elements named above for complex systems, for
the present study, we assumed: (a) that early-grades texts are complex systems consisting of
many mutually interacting characteristics and ensembles of characteristics that interplay to
impact text complexity, and the characteristics can be quantitatively measured; (b) to begin to
understand the text-characteristic functioning, we would need to consider an organizational
scheme for the characteristics and explore whether and how characteristics interact; and (c) the
complexity of early-grades texts purposefully exists, that is, it is in some sense engineered, to
support young children to learn to read with as much ease as possible. As well, exploration of
interplay among text characteristics would be essential to successful explanation of text
complexity.
Which Text Characteristics Might Matter Most for Early-Grades Text Complexity?
An “optimal” text is one in which text characteristics are configured such that readers can
construct meaning while engaged with the text with the greatest amount of ease and the greatest
depth of processing (cf. Merlini Barbaresi, 2003 on optimality theory and Juola, 2003 on the
necessity of complex systems to reflect “process,” including cognitive process). Text authors
may consciously or unconsciously use optimality when creating texts for particular audiences.
Generally, authors must make trade-off choices between favoring readers’ processing ease
(efficiency) and readers’ processing depth (effectiveness), and the point of balance between the
Early‐GradesTextComplexity
7
two is constrained by intended uses of the text, including intended readers of the text (cf. Merlini
Barbaresi, 2003 who references the trade-offs, but in recognition of how an author develops a
text rather than in reference to readers/audience). For example, in content-laden disciplinary
texts, readers’ processing depth (effectiveness) is often given preference over readers’ processing
ease (efficiency). Early-grades texts are generally created to heighten certain factors related to
children’s processing ease (such as word decodability), while simultaneously requiring a
relatively low level of processing depth, that is, requiring little effort for meaning creation.
Further, some evidence suggests that text characteristics do influence the early word-reading
strategies that young children develop (Compton, Appleton, & Hosp, 2004; Juel & Roper-
Schneider, 1985). For example, in one study, when tested on novel words, young students who
read highly decodable texts outperformed other students who primarily read texts with repetition
of high-frequency words (Juel & Roper-Schneider, 1985).
The concept of optimality suggests that different text characteristics might be more
important at certain levels of students’ reading development than at others, leading directly to
consideration of which characteristics of text might be related to the development of students’
emergent reading ability. A deep research base suggests that, while meaning creation is at the
heart of learning to read, “cracking the code” requires focal effort for beginning readers, and
critical cognitive factors inherent in the early learning-to-read phase are development of
phonological awareness and word recognition (e.g., Adams, 1990; Fitzgerald & Shanahan,
2000). As a result, hypothetical critical text characteristics that would support early word-reading
development are, for example, texts that are comprised of: repetition of simple words which
likely facilitates sight word development and orthographic-pattern knowledge (e.g., Metsala,
1999; Vadasy, Sanders, & Peyton, 2005); words with relatively simple orthographic
Early‐GradesTextComplexity
8
configurations which facilitates orthographic-pattern knowledge (e.g., Bowers & Wolf, 1993);
rhyming words which may advance phonological awareness (e.g., Adams, 1990); words that are
familiar in meaning in oral language which likely reduce challenges to meaning creation while
reading, permitting more attention to word recognition (e.g., Muter, Hulme, Snowling, &
Stevenson, 2004); and repeated refrains or repetitive phrases which likely reinforce phonological
awareness and development of sight words along with varied word recognition strategies such as
using context to make guesses at unknown words (e.g., Ehri & McCormick, 1998; cf.
Bazzanella, 2011 on multiple of functions of repetition in oral discourse, including cognitive
facilitation). Moreover, inclusion of several types of text-characteristic support might
exponentially boost students’ ease of learning about code-related facets of reading.
Consequently, to describe early-grades text complexity, it is theoretically necessary to
consider several text characteristics at multiple linguistic levels (Graesser & McNamara, 2011;
Graesser, McNamara, & Kulikowich, 2011; Kintsch, 1998; Snow, 2002). Studying linguistic
levels in text complexity is compatible with research that suggests that hierarchy is one of the
central architectures of complexity (Simon, 1962). The research base supporting the importance
of multiple levels of texts characteristics for early phases of learning to read is extensive and
comprehensive (Mesmer, et al., 2012). Only illustrative citations are provided in the following
summary (which compares to Mesmer, et al., 2012).
Beginning readers learn to attach specific sounds to graphemes and vice versa (e.g.,
Fitzgerald & Shanahan, 2000), and the research base on the importance of phonological activity
is extensive (e.g., Schatschneider, Fletcher, Francis, Carlson, & Foorman, 2004). Other aspects
of word-level features have also received wide attention in early-grades texts. In particular, word
structure (how a word is configured) and word frequency (the degree to which a word occurs in
Early‐GradesTextComplexity
9
spoken or written language) have deep research bases. With regard to word structure, letter-
sound regularity in words is highlighted in decodable and linguistic texts where significant
attention is paid to word rimes and bigrams and trigrams (two and three letter units). Such texts
have been shown to have positive impact on oral reading accuracy, but not on comprehension or
other global measures of reading (e.g., Compton, et al., 2004). With regard to word familiarity,
many early grades texts are designed to include repetition of high-frequency words. Children’s
accuracy and speed of recognition is influenced by word frequency (e.g., Howes & Solomon,
1951).
The importance of knowing key meanings in texts has been well substantiated in relation
to its impact on comprehension (e.g., Stanovich, 1986), and some evidence suggests that young
students may benefit from texts with easier and more familiar vocabulary (e.g., Hiebert & Fisher,
2007). However, current-day early-grades texts may contain a fairly large amount of challenging
word meanings (e.g., Foorman, Francis, Davidson, Harm, & Griffin, 2004). In general, words
that occur with higher frequency are processed more quickly and tend to be associated with
networks of knowledge (Graesser, McNamara, & Kulikowich, 2011). In addition to word
frequency, other word meaning factors, including imageability, concreteness, and age of word
acquisition, have been shown to be significant for students’ comprehension and/or word
recognition during reading (e.g., Woolams, 2005).
Within-sentence syntax is primarily related to the ease or challenge for creating meaning
while reading as opposed to word recognition (Mesmer, et al., 2012). The importance of within-
sentence syntax in texts is likely due to the extent to which complexity within a sentence places
demands on children’s working memory (Graesser, et al., 2011).
Early‐GradesTextComplexity
10
Discourse-level text characteristics impact aspects of reading in general (Graesser, et al.,
2011) and are likely to be related to early reading. For example, referential cohesion—occasions
when a noun, pronoun, or noun phrase reference another element in the text—has been shown to
be related to reading time and comprehension (e.g., McNamara & Kintsch, 1996). More cohesive
texts tend to facilitate comprehension, likely because they support mental model building
(Kintsch, 1998). It has long been known that even young readers have expectations for story
structures that they tend to use to guide comprehension, although young students tend to reveal
such expectations to a lesser extent than do older students (e.g., Whaley, 1981; Mandler &
Johnson, 1977). As well, better readers make use of informational text structures for
comprehension and recall (Britton, Glynn, Meyer, & Penland, 1982). A final potential discourse-
level text characteristic is genre, generally considered by linguists and discourse analysts to be a
slippery construct (Rudrum, 2005; Steen, 1999). However, questions remain about the
relationship between genres and text complexity, especially with regard to identification of
various genres according to specific text features (e.g., Mesmer, et al., 2012). For instance,
findings on the view that narratives are easier texts than other genres are mixed (e.g., Langer,
Campbell, Neuman, Mullis, Persky, & Donahue [1995] supported the view, while Duke [2000]
did not).
In addition to considering which sorts of text characteristics might be especially
important for examining early-grades text complexity, it is essential to embrace potential
interplay among various text characteristics. Theoretically, the emergent nature of text
complexity is in part due to the challenge level of the constituent elements, but it may also
develop through the interplay of the elements (Merlini Barbaresi, 2003). Complex systems tend
to have subsystems that may conflict depending on their “targets,” and to attain a successful
Early‐GradesTextComplexity
11
result, subsystems need to co-operate towards a compromise solution (Merlini Barbaresi, 2003;
cf. Gamson et al., 2013 on text characteristic “trade offs”; Gervasi & Ambriola, 2003). That is,
text characteristics at different linguistic levels may have conflicting impact on readers (their
“targets”). For instance, an author may choose to write a text for second-grade students about a
content-area topic, such as sound waves, requiring heavily laden vocabulary meanings that may
make the text quite complex for young readers. But the words may also be technically
challenging for word recognition. As an ensemble, difficult vocabulary meanings coupled with
high decoding demand can magnify complexity exponentially. The author might consider ways
of lessening the burden on the reader by employing other text-level characteristics, such as using
a within-sentence syntactic pattern that is generally familiar to typically-developing second-
grade students or inserting parenthetical definitions after difficult word meanings, or at the
discourse level, placing main ideas first in paragraphs. As another example, there is evidence that
concreteness/abstractness, or imageability interacts with structural complexity and word
familiarity to influence readers’ word recognition (e.g., Schwanenflugel & Akin, 1994). In short,
constellations of co-occurring linguistic characteristics may contribute to variation in text
complexity (Biber, 1988).
Measuring Text Complexity Quantitatively
Several established computerized systems address text-complexity beyond the early
grades through quantitative measurement. They are summarized here to provide context for the
present study: readability formulae that are typically focused on word frequency, word length,
and/or sentence length (e.g., Klare, 1974-1975; ATOS, n.d.; REAP Readability Tool, n.d.);
conjoint measurement systems that relate students’ reading levels to text-complexity levels on
the same scale, identifying collections of text characteristics (typically a small set such as word
Early‐GradesTextComplexity
12
frequency and within-sentence syntax) that serve as “best predictors” of text complexity levels
(e.g., the Lexile Framework for Reading [Stenner, Burdick, Sanford, & Burdick, 2006] and
Degrees of Reading Power [DRP] [Koslin, Zeno, & Koslin, 1987]); and natural language
processing analyses involving multiple text characteristics (e.g., Coh-Metrix [Graesser,
McNamara, & Kulikowich, 2011; McNamara, Graesser, McCarthy, & Cai, 2014], Reading
Maturity Metric [n.d.], and SourceRater [Sheehan, Kostin, Futagi, & Flor, 2010]). The systems
may be differentiated in the following ways: (a) All measures except Coh-Metrix provide a
single text-complexity quantitative judgment of texts’ complexity levels. Some do so using grade
levels, others use their own leveling system. (b) Only Lexile and DRP measures are relational to
readers, that is, they are originally based on individuals’ reading of the texts—except that the
SourceRater measure uses an “inheritance principle” in which the original outcome variable used
in the predictor equation was educators’/publishers’ assignment of text grade levels. Other
measures examine text characteristics and then use a form of dimension reduction, such as
Principal Components Analysis to determine essential components of text complexity. (c) Coh-
Metrix and SourceRater quantify the broadest number of text characteristics and include
discourse-level text characteristics in their analyses.
Across the various systems, the most common text characteristics that are best predictors
of text complexity are word familiarity, word length, sentence syntax, and/or sentence length.
The SourceRater system involves eight dimensions—syntactic complexity, vocabulary difficulty,
level of abstractness, referential cohesion, connective cohesion, degree of academic orientation,
degree of narrative orientation, and paragraph structure. Coh-Metrix employs 53 text
characteristic measures reduced to five dimensions—narrativity, syntactic simplicity, word
concreteness, referential cohesion, and deep cohesion. Importantly, none of the currently existing
Early‐GradesTextComplexity
13
common metrics specifically provides explanation of what constitutes early-grades text
complexity (cf. Graesser, et al., 2011 and van der Sluis & van den Broek, 2010).
Summary
As the Common Core text-complexity standard is implemented in schools, educators and
researchers alike need an empirically-based understanding of text complexity for early-grades
readers. Complexity theory provides a foundation for studying early-grades text complexity. Key
principles of complex systems are that: they involve a large number of mutually interacting parts;
interplay among components can be locally, rather than globally, relevant; they often may be
described by hierarchical organization; and they are purposive, that is engineered for particular
purposes. A relational outlook on text complexity implies complexity of particular texts is
relative to particular individuals, reading occasions, and developmental reading levels. However,
theoretically, texts have an emergent “developmental” complexity such that they can be assigned
a complexity level in relation to an entire continuum of complexity. Using an “optimality”
concept in conjunction with what is known about critical cognitive factors for the early learning-
to-read phase and prior findings about the importance of selected text characteristics during early
reading, not only should many text characteristics at multiple linguistic levels be investigated,
but interplay among text characteristics should be hypothesized. Few of the prior text-complexity
measurement systems encompass discourse-level characteristics, few address text complexity as
relational within either specific reading occasion or in the sense of student reading-ability
development, none addresses the interplay or potential interactive nature of text characteristics,
and importantly, none specifically addresses early-grades text complexity. In the present study, a
relational frame is used to explore text characteristics that matter most for early-grades texts, and
the potential interplay of text characteristics is naturally accounted for through use of a statistical
Early‐GradesTextComplexity
14
modeling technique that is prevalent in many fields, but novel to educational research, that is,
random forest regression.
Methods
Overview
Three-hundred-fifty primary-grades texts were selected and digitized. Twenty-two text-
characteristics were identified at four linguistic levels. Multiple computerized variable
operationalizations were created for each of the 22 text characteristics, totaling 238 variables.
The variables were automated so that a computer could examine the digitized texts and produce
text-complexity measures for each operationalization. Analyses were conducted using a logical
analytical progression typically used in machine-learning research (Mohri, Rostamizadeh, &
Talwalker, 2012). Three phases of analyses were: variable selection to find a subset of the most
important text characteristics out of the 238 operationalizations; using 80% of the texts,
“training” a random forest regression model (Breiman, 2001a) of the most important text
characteristics associated with text-complexity level; and validating the model on a 20% “hold-
out” set of texts. Follow-up analyses were done to explore the data structure.
Texts
Three-hundred-fifty texts (148,068 words in total) intended for kindergarten through
second-grade constituted the text base. An existing larger corpus of early-grades texts was made
available for the study (MetaMetrics, n. d.a), and maximum-variation purposive selection
(Patton, 1990) was used to choose texts from the corpus. As well, 18 kindergarten through
second-grade Common Core State Standards (NGA & CCSSO, 2010, Appendix B) exemplar
texts (that were not present in the available corpus) were purchased. The goal of maximum-
variation purposive selection was to ensure comprehensive representation of a wide variety of

Early‐GradesTextComplexity
15
early-grades text types, text levels, and publishers that currently exist in U. S. early-grades
classrooms. We chose 350 texts for two main reasons: (a) to include a sufficiently large number
of texts that would adequately represent the domain and to ensure sound statistical analyses
(following the suggested sample size in Heldsinger & Humphry, 2010); and (b) to include a
manageable set of texts to accomplish teacher and student tasks needed for development of the
text-complexity-level variable (described below in the section, “Text-Complexity Level”). All
texts were reproduced in authentic form (including pictures) and digitized.
Six categories for commonly occurring early-grades text types for independent reading
were determined: code-based (decodable, phonics), whole-word (texts that include many words
that appear in early-grades texts with high frequency), trade books (books commonly sold for
library, supplementary materials for classroom use, or private sale), leveled books (texts that are
sequenced in difficulty level), texts of assessments, and other (e.g., label books). The first four
text types had been previously identified in studies of classroom texts as reasonably
comprehensive categories of early-grades texts intended for independent reading in primary-
grade classrooms (Aukerman, 1984; Hiebert, 2011). The last two categories were included
because texts appearing in assessments also commonly occur in early-grades classrooms, and
texts of assessments may become even more prominent with the advent of the Common Core
State Standards (NGA & CCSSO, 2010). Some commonly occurring early-grades texts, such as
label books, do not fit well into the previous categories. The first four category labels are
common terms used by educators and publishers (Mesmer, 2006).
It was not possible to consider proportional representation of types as they exist in United
States classrooms because to our knowledge there is no direct evidence of the degree to which
different categories of early-grades texts are present or used in United States classrooms, though
Early‐GradesTextComplexity
16
at least one survey of United States primary grades teachers suggested that use of the first four
categories of texts is widespread (Mesmer, 2006). Consequently, we selected “prototypes” to
represent each category (Hiebert & Pearson, 2010), using texts and, where series existed, texts
were sampled from the range in the series. In reality, many early-grades texts fall into two or
more of the category types (Mesmer, 2006). For example code-based texts are often “leveled.”
However, for our purposes of ensuring wide representation of text types, each text was assigned
to a single category. If a text was labeled “decodable” or “phonics” by the publisher, it was
labeled “code-based.” If a publisher characterized a text as primarily attending to high-frequency
words or sight words, it was labeled “whole word.” A text was labeled “trade book” if it was
available in the trade market and not just in the school market, and it was not identified by the
publisher as decodable, phonics, or high-frequency. A text was labeled “leveled” if the text was
assigned a level (other than grade level) by the publisher and was not labeled “decodable,”
“phonics,” or “high frequency.”
Text levels were determined by using publisher-designated grade, level, or age ranges.
Texts were labeled: easy if they were designated kindergarten, kindergarten levels (as noted on
publisher websites), or typical ages for kindergarten; moderately hard if designated first grade,
first-grade levels, or first-grade ages; and hard if designated second grade, second-grade levels,
or second-grade ages.
Thirty-two publishers were represented in the 350 texts, ranging from 3 to 15 different
publishers for each of five of the six text types, with one publisher for the text-of-assessment
type.
Text genre (narrative, informational, hybrid) was determined using a modification of
Duke’s (2000) procedures. Two primary text characteristics were used to discern narrative,
Early‐GradesTextComplexity
17
informational, and hybrid text—purpose and textual attributes. Narrative text was defined as
follows (Duke, 2000; Rudrum, 2005): It is a series or sequence of events, with the intention or
purpose to evoke an element of reader response. It tells a “story” and/or has characters, places
events, and things that are familiar, and is closely related to oral conversation. Informational was
defined as text that conveys information about the natural or social world, and is typically written
by someone who is presumed to know the information to someone who is presumed to not know
it (Duke, 2000). Textual attributes for narratives included for instance, events, actions with
temporal or causal links, characters, dialogue. Textual attributes for informational texts included
for example facts, timeless verb constructions, technical vocabulary, descriptions of attributes,
definitions. A set of rules modified from Duke (2000) was devised for determining genre
classification, using a decision tree process that began by determining the purpose of the book
and then addressing attributes of the text. Inter-classifier reliability between two individuals for
20% of the 350 books was .96.
Finally, the text corpus could be described as follows. Caution should be exercised when
interpreting the following figures for the text categories—again, because the categories are not
mutually exclusive. Rather, using the publisher designation in concert with the researcher-
devised system described above for when a text could belong to two or more categories, 41% of
the texts were leveled, 17% were code-based, 15% were trade books, 10% were whole-word, 9%
were texts of tests, and 8% were other. Approximately 36% of the 350 texts were labeled easiest,
37% moderately hard, and 27% hardest. Sixty-six percent were labeled narrative, 24%
informational, and 10% hybrid or other.
Variables
Early‐GradesTextComplexity
18
Text-Complexity Level. The outcome variable was early-reader text-complexity level
measured using a continuous, developmental scale, with scores ranging from 0 to 100. An
overview of the scale-building procedures is as follows. (Further details of the procedures are
provided in Journal of Educational Psychology Supplementary Material 1 online at [LINK].)
Because text complexity was defined at the intersection of printed texts with students reading
them for particular purposes and doing particular tasks, a multiple-perspective measure of text
complexity was created using student responses during a reading task and teachers’ ordering of
texts according to complexity. In doing so, we represented students and teachers as readers, and
teachers as important context for student reading instruction, as well as two different tasks into
the final measure. Then the magnitude and strength of the association between the two logit
scales was examined, and to arrive at a single scale, a linear equating linking procedure (Kolen &
Brennan, 2004) was used to bring the student results onto a common scale with the teacher
results. Finally, for ease of interpretability, the logit scale was linearly transformed to a 0 to 100
scale.
In the first substudy, through Rasch modeling (Bond & Fox, 2007) a text-complexity
logit scale was created from the interface of 1,258 children from 10 U.S. states reading passages
from a subset of the 350 texts and responding to a maze task (Shin, Deno, & Espin, 2000 for task
validity). Cronbach’s alpha estimates of reliability for test all forms ranged from .85 to .96. Also,
dimensionality assessments for text genre and for differential text ordering according to student
ethnicity, gender, or free-reduced-lunch status suggested no evidence of measurement multi-
dimensionality. After creation of the logit scale, each text in the subset was assigned a text-
complexity level.
Early‐GradesTextComplexity
19
In the second substudy, also through Rasch modeling, a second text-complexity logit
scale was created from 90 practicing primary-grades teachers’ (from 33 states and 75 school
districts) evaluations of texts’ complexity. Teachers ordered random pairs of the 350 texts seen
side by side on a computer screen. For each pair, teachers clicked on the text they thought was
more complex. Using the Separation Index method (Wright & Stone, 1999), measurement
reliability was .99. After creation of the logit scale, each of the 350 texts was assigned a text-
complexity level.
Next, the correlation between the two logit scales (N = 89 texts) was .79 (p < .01),
suggesting that the texts ordered on text complexity similarly whether teachers or students were
involved. The relatively high correlation was also evidence of concurrent validity in that it
suggested that the two logit scales were measuring the same construct. Consequently, a linking
equating procedure was used to link the two logit scales (Kolen & Brennan, 2004). Finally, a
linear transformation was done resulting in measures that could range from 0 to 100 on a text-
complexity scale. That is, the 350 texts ordered by teachers could be assigned a measure from 0
to 100, and the texts read by students could be assigned a measure from 0 to 100.
Text characteristics and their variable operationalizations. Twenty-two text
characteristics were identified at four linguistic levels—sounds in words, words, within-sentence
syntax, and across-sentences or discourse level. Discourse-level characteristics captured
repetition, redundancy, and patterning (of letters, words, phrases, and/or sentences) that occurred
in the texts. In an effort to capture a wide variety of ways of representing the text characteristics,
multiple computerized variable operationalizations were created for many of the 22 text-
characteristics, totaling 238 variable operationalizations. The rationale for including as many
variable operationalizations as possible was that different metrics may pinpoint different aspects
Early‐GradesTextComplexity
20
of a text characteristic (Baca-Garcia, Perez-Rodriguez, Saiz-Gonzalez, Basurte-Villamor, Saiz-
Ruiz, Leiva-Murillo, et al., 2007). By including as many operationalizations as possible, the
chances of capturing critical text characteristics for text complexity were increased.
Table 1 shows the 22 text characteristics according to linguistic level, along with
definitions, the number of variable operationalizations for each, and selected examples of
operationalizations and their possible score ranges and interpretations. A complete list and
description of operationalizations is available as Journal of Educational Psychology
Supplementary Material 2 online at (LINK).
Operationalizations were accomplished using four logical approaches.
First, several types of computational metrics were considered. In addition to traditional
metrics such as counts, mean, and percentage, six specialized computational linguistic techniques
were used to produce other metrics. One specialized computational linguistic technique was
distributional semantics (Landauer & Dumais, 1997), a method for quantifying semantic
similarities between linguistic items. Three additional specialized computational linguistics
techniques were: part-of-speech tagging (Collins, 2002); syntactic parsing (Sleator & Temperly,
1991); and a Levenshtein (1965/1966) metric, which gauges the minimum number of
substitutions, insertions, or deletions required to turn one linguistic unit (e.g., a written word)
into another. Also, two unique metrics that specifically capture text characteristics in relation to
student readers were applied to all of the sounds-in-words variables and most of the word-level
variables—types- (unique words in a text) as-test and words- (all words in a text) as-test. Both
metrics treat the text characteristic of interest as test items, while considering a potential student
who might be reading the text to have a trait level for the characteristic of interest. Both represent
an alternative way to measure central tendency for a distribution of values, and both are more
Early‐GradesTextComplexity
21
impacted by outliers than an average. For instance, for a types-as-test operationalization for
syllables (the text characteristic of interest) in a text, the unique words in the text are listed, and
the number of syllables is counted in each word. Then one might hypothesize that a student has a
“syllable-level reading ability” for reading the text. The unique words (types) form a test for
measuring a student’s ability to use syllables to read the text. Each unique word is given an item
difficulty level that is the number of syllables in the word. A target level of hypothetical student
performance is set (50%, 75%, 100% of the items predicted to be correct), and then using Rasch
modeling (Bond & Fox, 2007) the metric determines what level of reader ability would be
expected to attain the percentage that was set. The overall metric (derived from a mathematical
formula) therefore summarizes a “syllable” level of complexity for the text.
A second logical approach was that discourse text characteristics were systematically
treated as follows. The main focus of discourse-level variables was to capture linkages among
words and meanings in text (e.g., cohesion), redundancy, and patterning that occur across a
whole text or parts of text but more than just within sentences. For each discourse text
characteristic, first, variable operationalizations were considered that would reflect a lexical
emphasis or a syntactic (part of speech) emphasis. Second, whether an operationalization
employed lexical or syntactic emphasis, operationalizations could also involve linear activity,
that is adjacent sentences, or they could involve a Cartesian product over sentences (that is,
context beyond adjacent sentences), or they could address both types of activity. As an example,
for the text characteristic, Linear Edit Distance, the lexical-emphasis operationalization uses the
words in two adjacent sentences whereas a syntactical-emphasis operationalization uses parts of
speech for replacement judgments. (Further detail is provided in Supplementary Material 3
online at [LINK].)
Early‐GradesTextComplexity
22
A third logical approach was to use existing databases and resources where possible to
create variable operationalizations. The following databases were used. The MRC
Psycholinguistic Database (Coltheart, 1981) “. . . is a machine usable dictionary containing
150,837 words with up to 26 linguistic and psycholinguistic attributes for each . . .” (MRC
Psycholinguistic Database, n. d.). Number of phonemes in words, number of syllables in words,
and indices of word abstractness were extracted from the MRC Psycholinguistic Database. The
Carnegie Mellon University Pronouncing Dictionary (Carnegie Mellon University, n. d.) “ . . . is
a machine-readable pronunciation dictionary for North American English that contains over
125,000 words and their transcriptions.” It was used for variable operationalizations of the text
characteristic, mean internal phonemic predictability. The Kuperman, Stadthagen-Gonzalez, and
Brysbaert (2012) age-of-acquisition ratings for 30,000 English words was used for
operationalizations of the age-of-acquisition text characteristic. The rating indicates the age at
which a word’s meaning is first known. Word frequencies for running text in a corpus of
1.39billion words from 93,000 kindergarten through university texts (MetaMetrics, n.d.b)
normalized to link to Carroll, Davies, and Richman (1971) word frequencies, were used to create
operationalizations for word rareness. The Link Grammar Parser (Link Grammar, n. d.; Sleator
& Temperley, 1991) was used for operationalizations of Grammar. The Parser “. . . is a syntactic
parser of English, based on link grammar, an original theory of English syntax. Given a
sentence, the system assigns to it a syntactic structure, which consists of a set of labeled links
connecting pairs of words” (Link Grammar, n .d.).
Additional existing resources were as follows. The Menon and Hiebert (1999)
decodability scale was slightly modified for operationalizations of the text characteristic,
decoding demand. The scale provides numeric values for varying degrees of within-word
Early‐GradesTextComplexity
23
structural complexity. The Dolch (n. d.) lists and the first 660 words on the Fry (n. d.) lists were
used in operationalizations of the text characteristic, Sight Words.
A fourth logical approach was to use techniques to control for factors that might be
considered irrelevant to the measurement of specific text characteristics. One technique used for
some operationalizations of sounds-in-words and word-level text characteristics was stop listing
(Luhn, 1958), which is commonly used in natural language processing computations. Stop listing
means deletion of the highest frequency words that tend to have low semantic value. However,
because it is not known in advance whether deleting highly frequent words matters for
examining text complexity, when stop listing was used for selected text characteristic
operationalizations, the same text characteristics were also operationalized without stop listing.
Another technique was aimed at addressing possible impact of text length on a text-
characteristic value. In general, longer discourse units can be related to increased complexity in
part because inclusion of more material offers more opportunity for additional text characteristics
or higher-levels of individual text characteristics, but also because each addition in a longer
progression of discourse may require additional cognitive integration on the part of the reader
(Merlini Barbaresi, 2003). Many text-characteristic operationalizations employed length control
by using “slices” or “chunks” of text. When slices/chunks were employed, multiple slices/chunks
were obtained from a text, covering the entire text, and then the final metrics were averaged over
slices/chunks.
Analyses
Analyses were accomplished using a machine-learning logical analytical progression
(Mohri, et al., 2012). Random forest regression was used for statistical modeling. The analyses
Early‐GradesTextComplexity
24
performed for the present study are among the first to appear in the educational research
literature and therefore deserve some added attention and description here.
The statistical modeling approach. The interdisciplinary team of researchers who
accomplished the present study worked from a statistical modeling approach that is not
commonly used in educational research, but it is an approach that holds promise for some kinds
of educational problems (Strobl, Malley, & Tutz, 2009). Two cultures of statistical modeling
derive from diverse epistemological terrains in which different ways of knowing undergird
different paradigms and procedures (Breiman, 2001b). A classical statistical modeling paradigm
in educational research progresses in a top-down fashion. A theory is created detailing which
constructs hypothetically matter in relation to some outcome(s) and how the constructs are
related to one another. Consideration is given to how the constructs can be measured, a relatively
small set of “predictors” is selected, and the relationships are examined. Often a few interactions
among predictors are hypothesized and represented in the statistical model. The resulting model
is tested statistically through fit of the data to the originating model.
In another statistical culture, the one used in the present research, the counter-culture to
the predominant educational statistical paradigm, although theory can be involved initially (and
was in our work), modeling works in a bottom-up fashion—starting with data (Breiman, 2001b).
In the past years, multivariate data exploration methods have become increasingly popular in
many scientific fields, including health sciences, biology, biostatistics, medicine, epidemiology,
genetics, and most recently, psychology, and in machine-learning communities (Grömping,
2009; Strobl et al., 2009). “Machine learning” references construction, exploration, and study of
algorithms and models that are “learned” or “trained” from data (Mitchell, 1997). Large amounts
of data are processed, patterns are discovered, and predictor models are built. While some
Early‐GradesTextComplexity
25
theoretical background is certainly helpful in discerning key constructs involved in a particular
problem, there is no limit on the number of variables. Rather, all variables that can be imagined
and measured are included as potential predictors. Sometimes, depending on modeling choice,
any and all possible interactions among variables can be accounted for. The result is a model of
the important predictors (and interactions) associated with the outcome. The “goodness” of the
model is tested through its predictive capacity using a previously “unseen” set of data.
Random forest regression. The statistical modeling technique used in the present
research was random forest regression—a non-parametric statistical analysis that involves an
ensemble (or set) of regression trees (often referred to as CART—Classification and Regression
Tree) (Breiman, 2001a; Breiman, Friedman, Olshen, & Stone, 1984). Random forest regression
overcomes limitations of a single regression tree and linear regression for particular
circumstances such as when large numbers of variables are involved (Hastie, Tibshirani, &
Friedman, 2009; Strobl, et al., 2009). It is called an ensemble procedure because predictions
from many decision trees are aggregated to produce a single prediction. Decision tree regression
is based on the principle of recursive partitioning, where the feature space (defined by the
predictor variable operationalizations) is recursively split into regions containing observations (in
our case, texts) with similar response values. The predicted value for a text in a region is the
mean of the response variables for all texts in that region. For example in our study, the many
regressions produce regions or classes where texts have similar text characteristics in relation to
their text-complexity levels. (For a detailed explanation of recursive partitioning, see Strobl, et
al., 2009.) The procedure is called random forest because each individual decision tree is
“trained” using a different random bootstrap sample of the texts and because each split within
each tree is created using a random subset of candidate variables (Grömping, 2009).
Early‐GradesTextComplexity
26
(Bootstrapping is a process of repeated resampling of the data, with each sample randomly
obtained with replacement from the original dataset.) Ultimately, from the forest (ensemble) of
trees, a single prediction can be made by calculating a mean of predictions output by the
individual trees (Grömping, 2009).
Essentially, using the available data (in our case, the text-complexity level as outcome
and 238 variable operationalizations for each text as predictors), random forest regression builds
a final model “from the ground up” by aggregating over many individually “trained” models. (To
better understand random forest regression, and partly to better understand why it is potentially
beneficial for analyzing text complexity, comparison to linear regression can be informative. A
detailed comparison is provided in the Journal of Educational Psychology Supplementary
Material 4 online at [LINK?].)
Steps in analyses. Initially, an automated computer analysis was conducted for the 350
digitized texts and the 89 passages that students read, resulting in values for each text and
passage for text-complexity level and for the 238 text-characteristic variable operationalizations.
Then, four analytical phases were accomplished. (a) The first step in analysis was to set baseline
performance. Eighty percent of the texts were randomly selected, and a three-pronged training
phase was conducted using random forest regression. Three random forest regressions were
conducted for: the 80% of the 350 texts that teachers ordered (n = 279 [one text was discarded
due to poor digitization]); the 80% of the 89 student passages (n = 71); and the two sets of texts
combined (n = 350). Each of the three random forest regressions yielded Importance values for
each of the 238 variables in relation to the text-complexity outcome variable. Model prediction
capacity (correlation) and prediction error were calculated for each of the three models on “out-
of-bag” samples (Grömping, 2009). b) To determine whether a more parsimonious set of
Early‐GradesTextComplexity
27
variables could predict text complexity as well as, or nearly as well as, the 238 variables, a two-
stage iterative variable-selection procedure was used (Grömping, 2009). First, for each of the
three models, the least important variable was removed from the model, random forest regression
was re-run, and prediction error was re-calculated. The process was repeated until model
prediction error began to increase, resulting in a moderately sized set of predictors for each of the
three models. Then the union of predictors in the three models was selected creating a
moderately sized set of predictors. Second, in a next round of variable elimination, redundant
operationalizations of text characteristics in the moderately sized set were identified, and the
least important of the correlated redundant variables were trimmed out using a combination of
strength of redundant operationalizations cut-point while maintaining model prediction capacity.
c) In a validation phase, the predictive capacity for the trimmed model was investigated, using
texts not employed for the variable selection and “training” phases—a 20% hold-out set of texts.
d) Follow-up analyses were done to explore the data structure.
Results
Preliminary Random Forest Regression Decisions
The following decisions were made for conducting the random forest regressions using
scikit-learn (Pedregosa, Varoquaux, Gramfort, Michel, Thirion, Grisel, et al., 2011): (a) At each
node, the computer selected just one variable to make a split. (b) A constant predictor split point
was used in each leaf. (c) Mean Square Error was used as the splitting objective to optimize in
each node. (d) Randomness was injected into the trees using “bagging,” a method that allows all
variables to be available for selection at a given node. During the training phase, “mtry” (the
number of predictors available for selection) was set at 238. During the validation phase, “mtry”
was set at three (or the square root of “p” where “p” was nine predictors). The larger “mtry” was
Early‐GradesTextComplexity
28
used when there was a moderate or large number of correlated predictors, because in the case of
many predictors more power is concentrated in a relatively small subset of predictors. For
variable selection, concentration of power is desirable, and as well, large mtry results in more
stable variable selection because the most powerful variables tend to emerge repeatedly. (e) For
variable selection, each random forest model was conducted with 100 trees. In the validation
phase, random forest regressions were conducted with 500 trees. (f) The Importance values were
normalized random-permutation-based. (g) During training, out-of-bag model error (Root Mean
Square Error [RMSE], for which error is normalized relative to the number of texts) was
calculated as an estimate of generalizability error (Breiman, 2001a). During the validation phase,
non-out-of-bag RMSE was calculated (Breiman, 2001a).
Phase 1: Training Phase Results: Baseline Model Performance
For the model using the 279 texts that teachers ordered and all 238 text-characteristic
operationalizations, the mean correlation of text complexity as predicted from the model with the
empirical text-complexity measures from 10 analytical runs of 100 trees each was .89, and the
model error (RMSE) was 8.66. For the model using the 71 passages that students read and the
238 text-characteristic operationalizations, the mean correlation was .69, and the RMSE was
10.58. For the model combining the two sets of texts (n = 350), the mean correlation was .87,
and the RMSE was 8.72. For each of the three models, predictive power was high, and error was
low. (Importance values were computed for all 238 predictor variables in each of the three
models, but given the large number of variables, only the final model variable Importance values
are reported in a following section.)
Phase 2: Trimmed Model and Final Operationalization Descriptives
Early‐GradesTextComplexity
29
First, Figure 1 shows that for two of the three models, as the least Important
operationalizations were dropped from the model, one by one, model correlation, that is, the
predictive capacity, began to visibly drop for the teacher and combined models when
approximately 25 variable operationalizations were left in the model. For the student model, it
dropped with approximately 10 variables remaining. The union of the top 25 operationalizations
in each of the three models was then selected, resulting in 45 predictor operationalizations. Then
one model was created for the next step using the 45 predictor variable operationalizations.
Second, the first trim included redundant variable operationalizations for single text
characteristics. To eliminate redundancies that were highly correlated, the inter-correlations of
all 45 predictors were computed, using the combined dataset. Then in the top of Figure 2
potential correlational thresholds are shown on the x-axis, and the y-axis shows what the model
correlation would be if redundant variable operationalizations were removed using different
magnitudes of threshold correlation as cut-points to delete redundant variables. Through visual
inspection of the top graph, .70 was chosen as the correlational cut-point because it appeared that
doing so would result in only very slight model correlation drop while removing a significant
number of redundant predictors.
Then, as shown in the bottom graph in Figure 2, using the threshold cut-point of a .70
correlation, 11 variable operationalizations remained in the model. Among the 11, two sets of
operationalizations were highly similar, and in each case, the least Important of the two was
dropped. In sum, the model trimming procedure resulted in a nine-predictor model: for word
structure—decoding demand, number of syllables in words; for word meaning—age of
acquisition, abstractness, and word rareness; and for sentence and discourse level—
Early‐GradesTextComplexity
30
intersentential complexity, phrase diversity, text density/information load, and non-
compressibility.
After variable selection, a final set of three random forest regression models was trained
using only the nine variables (mtry = 3) with the teacher text-complexity assignments, the
student assignments, and the two combined together. The resulting correlations (and RMSEs) for
the teacher, student, and combined models were: .89 (8.40), .71 (10.35), and .88 (8.59),
respectively.
Phase 3: Model Validation
To validate the model, the hold-out set of 20% of books (n= 71) and 20% of the passages
for student reading (n = 19) was combined. A final random forest regression (mtry = 3) was run
with the nine selected variables as predictors and the empirical text-complexity variable from the
combined (teacher and student) data as the outcome. The model was validated with a correlation
of .85 and RMSE of 9.68. Figure 3 shows the generally tight relationship among the nine
predictors and text complexity level. Variance explained by the model was 71.98%. Of note, the
validation model error was similar to the combined dataset model during training (8.72),
suggesting minimal, if any, model overfit.
Variable Importance Values, Descriptives (Including Text Complexity), and Inter-
Correlations
Finally, after the validation phase, mean Importance values were obtained from 10 final
random forest regressions with 500 trees and mtry set at 3, using the 350 texts (Grömping, 2009).
The variable Importance values, mean, standard deviation, and range for the final nine variables
along with mean, standard deviation, and range for the text-complexity variable, are shown in
Table 2. The order of text-characteristic Importance was: intersentential complexity (the linear
Early‐GradesTextComplexity
31
edit distance operationalization) (most Important), text density/information load, phrase diversity
(the longest common string operationalization), age of acquisition, number of syllables in words,
abstractness, decoding demand, non-compressibility, and word rareness. Notably, three
discourse-level characteristics appeared near the top of the Importance order suggesting relative
strength of discourse-level characteristics for predicting text complexity. Also included were
word-structure and word-meaning text characteristics. While no variable that represented within-
sentence text characteristic alone emerged, the discourse-level variables indirectly included
facets of within-sentence characteristics—because to create measures across sentences, within-
sentence characteristics had to be taken into account.
The text-characteristic variable operationalization means for the word structure variables
(decoding demand and number of syllables in a word) suggested that across the entire set of texts
word structure was moderately challenging, though the range for decoding demand was wide—
up to 7.91 (out of 9). (See Table 2 for summary statistics.) The means for the word meaning
variable operationalizations (age of acquisition, abstractness, and word rareness) again suggested
that on the whole, the abstractness of the words in the text was moderate (approximately at the
middle of the possible range of scores), but as would be expected, word rareness was minimal
and age of acquisition tended to be low—though again, for all three variables, the standard
deviations suggested a wide range of values. Means for the discourse level variable
operationalizations suggested that the text corpus involved a fair amount of repetition,
redundancy, and patterning in that means for three of the variables ranged from .55 (for Non-
Compressibility, a compression ratio that could range from 0 to 1) to .80 (Phrase Diversity:
Longest Common String that could range from 0 to 1), with intersentential complexity reflecting
such features more modestly. In all four cases, nearly the complete range of values was

Early‐GradesTextComplexity
32
represented in the corpus, suggesting a fair amount of variability on the discourse-level text
characteristics. Finally, the full range of text-complexity values was witnessed, with a mean of
50.10.
The correlations in Table 3 indicate moderately positive relationships of all nine variable
operationalizations with text complexity, ranging from .35 to .73 with the exception of non-
compressibility (.18, though significant). Next, on the whole, variable operationalizations within
word structure, within word meaning (see the left-most triangle in Table 3), and within discourse
level (see the right-most triangle in Table 3) were, on the whole, moderately correlated with each
other, though in each of the three groups, there were one or two low correlations, suggesting that
within linguistic level variable operationalizations tended to capture similar text characteristics.
Also, on the whole, the cross-group correlations tended to be somewhat lower than within-group
correlations, suggesting to some degree that each group of variables was measuring a unique set
of characteristics (see the boxes in Table 3). That is, correlations of decoding demand and
number of syllables in words correlated with the three word meaning variable operationalizations
from .06 to .54, all lower than .66, the correlation of decoding demand with number of syllables
in words. The top right-most box shows a similar pattern. For the comparison of the word-
meaning variable within-group correlations (the left-most triangle in Table 3) versus the cross-
group correlations of word meaning with discourse level variable operationalizations (the bottom
box in Table 3) again, on the whole, the within-group word-meaning correlations (.34 to .57), not
including the low correlation of abstractness with word rareness (.05), tended to be similar to, or
higher than, the cross-group comparison to the discourse-level correlations (with the exception of
the correlation of age of acquisition with intersentential complexity, .12 to .53).
Exploring the Data Structure and the Text-Characteristic Interplay
Early‐GradesTextComplexity
33
Several follow-up analyses (using all 350 texts and the teacher-based empirical text-
complexity levels) were done to explore the data structure, the degree of text-characteristic
variability in high versus low text-complexity levels, the interplay of text characteristics in
relation to text complexity levels (decision trees and quintiles), and the interplay of text
characteristics in relation to genre. The analyses were conducted using visualization
methodology from CARTscans (a graphical tool that displays predicted values across multi-
dimensional subspaces [Nason, Emerson, & LeBlanc, 2004]), along with additional visualization
techniques recommended by Cook and Swayne (2008) and by Cohen, Cohen, Aiken, and West,
(2003). A strong theme permeated findings—the interplay of text characteristics was an
important factor for explaining text complexity.
The general structure of text characteristics in relation to text complexity. In a
traditional approach, principal components analysis or factor analysis might be used to describe
the data structure, but those techniques assume a linear relationship among variables. We
hypothesized non-linearity and used an unsupervised, nonlinear dimension-reduction
technique—modified locally linear embedding analysis (Zhang & Wang, 2006). The technique
accounts for the intrinsic geometric properties of each neighborhood of texts that share text-
characteristic profiles. Essentially, in the analysis, the nine text characteristic operationalizations
were re-expressed in a three-dimensional space by finding local planes of best fit for the
neighborhood around each text (set at 15 neighbors [Vanderplas & Connolly, 2009]) and then
stitching them together to describe the entire 350-text space. The planes of best fit need not share
the same parameters across neighborhoods. Once the dimension-reduced text space was
constructed, the text-complexity levels were noted in colors, warmer colors represent higher text-
complexity levels, and cooler colors represent lower text-complexity levels. The result is shown
Early‐GradesTextComplexity
34
in Figure 4. The three locally linear dimensions are not in themselves interpretable. Each is
associated to varying degrees with the nine text characteristics. All 350 texts are represented as
dots in the space. The main conclusion of the visual analysis was that there was a clear thread of
text-characteristic relationships with each other and with text complexity that moved through the
space, a thread that suggested an essentially unidimensional construct in measurement terms, but
the text-characteristic relationships with text complexity were not globally linear. Instead, text-
characteristic relationships interplayed differently in different local neighborhoods.
Degree of text-characteristic variability in high versus low text-complexity levels. To
examine the extent to which text-characteristic variability was different according to text-
complexity level, the nine text-characteristic variables were standardized as z-scores, and texts
were split into high and low text-complexity groups using the following procedures (outlined in
Cohen, Cohen, Aiken, and West [2003] and Green and Salkind [2001]). Centers for the high and
low texts were determined at one standard deviation above and below the total text-set mean,
respectively. Next, bands for high and low texts were created at plus and minus half of a standard
deviation around the mean of the center points, respectively, so as to filter out texts close to the
mean (Cook & Swayne, 2008). Finally the split plots in Figure 5 were generated.
A main conclusion was that for most sets of relationships, there was more variability in
lower text-complexity texts than in high ones. For the two word-structure relationships with text-
complexity level, the decoding-demand levels for the low-complexity texts ranged widely, while
most decoding-demand levels for high-complexity texts were tightly collected around the mean.
For the two of the three word meaning characteristic operationalizations (age of acquisition and
word rareness), the variability patterns were highly similar for low and high text-complexity
texts, but for higher complexity, the word meaning values were shifted upward by approximately
Early‐GradesTextComplexity
35
two standard deviations. On the other hand, for three of the four discourse-level variables
(intersentential complexity, phrase diversity, and text density) there was little to no overlap in the
two patterns, signaling a dramatic shift in the degree of repetition, redundancy, and patterning—
less of it (higher values) in the higher-complexity texts.
Also evident in the split plots are outlier texts. For instance, in the low text-complexity
group for age of acquisition, there were some texts that had relatively high age-of-acquisition
values, leading to the question of how a book with such high values on that text characteristic
might receive a low value on text complexity. A general pattern appeared from examination of
complete profiles of text characteristics for some randomly selected “outlier” texts. Where
extreme values were present in low text-complexity texts, generally, the high values tended to be
compensated by low values on other text characteristics. For example, a text’s relatively high
value on a word structure or word meaning characteristic was modulated and supported by a high
degree of repetition, sufficiently enough to effect a relatively low text-complexity level.
Interplay of text characteristics: Generalized interactions or regions of interactions?
Two ways to explore the potential for text characteristics to function together in relation to text-
complexity level were visualization of a single regression tree and contour plots (Nason et al.,
2004). First, we created a single regression tree (See Figure 6) using standardized z-score values
for the predictor variable operationalizations, with the tree grown to five levels of depth and
restricting nodes to a minimum of 10 texts. The goal was to visualize the degree to which text
characteristics might be conditioned on one another when predicting text complexity—not to
determine which variables interacted with one another in the classic statistical sense. While
information can be gleaned from exploring a single regression tree, generalization to early-reader
Early‐GradesTextComplexity
36
texts at large is cautioned because of the possibility of single-tree overfit to a dataset (Breiman
2001a).
Two main findings from examination of the decision tree were that the interplay of text
characteristics mattered for text complexity and that micro-interactions among text
characteristics were regional rather than generally applicable to the whole body of text
characteristics and text complexity. The tree depicts several localized interactions (some are
noted in circles in Figure 6), or ways that text-complexity values may be predicted from
combinations of certain text characteristics such that the impact of a text characteristic is
conditioned by the value of one or more other text characteristics (two are circled in the figure).
As an example, the far right side of the regression tree in Figure 6 depicts a localized
asymmetrical interaction. Starting at the top of the regression tree in Figure 6, the computer
algorithm made the first split using intersentential complexity as the predictor that would result
in the least error in predicting text complexity. To the right are texts that have intersentential
complexity values higher than -.3045, that is, not much repetition, redundancy, or patterning.
Moving farther to the right to Node B (which split the high intersentential complexity texts into
even further subgroups of higher and lower intersentential complexity) and then Node C, the 109
texts at Node C have the least amount of repetition, redundancy, or patterning of the 350 texts.
At Node C abstractness was selected as the predictor that conditioned intersentential complexity
so as to achieve the smallest error in predicting text complexity. Notice that for 11 of the 109
texts, the ones with the lowest abstractness values, no further predictors were required to arrive
at the final text complexity value with the smallest error. However, 98 of the 109 texts that had
higher values on abstraction were further conditioned by non-compressibility and after that by
Early‐GradesTextComplexity
37
age of acquisition. That is, the effect of abstractness is different for the two branches created by
intersentential complexity.
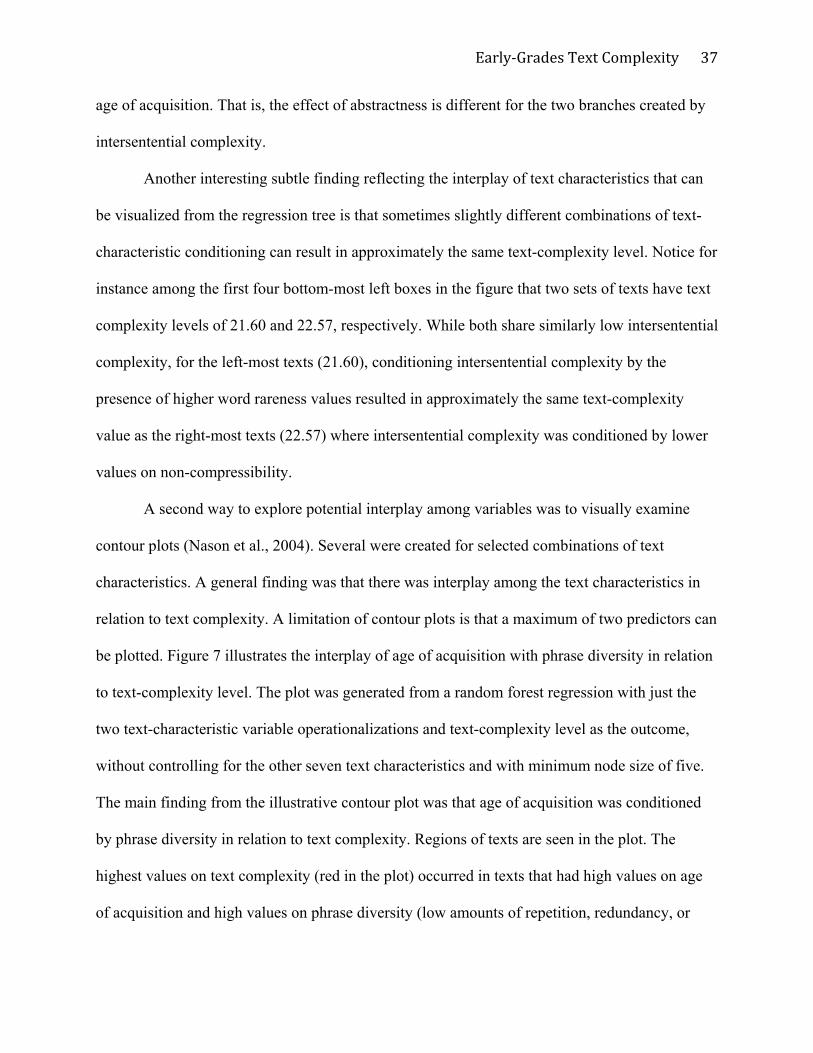
Another interesting subtle finding reflecting the interplay of text characteristics that can
be visualized from the regression tree is that sometimes slightly different combinations of text-
characteristic conditioning can result in approximately the same text-complexity level. Notice for
instance among the first four bottom-most left boxes in the figure that two sets of texts have text
complexity levels of 21.60 and 22.57, respectively. While both share similarly low intersentential
complexity, for the left-most texts (21.60), conditioning intersentential complexity by the
presence of higher word rareness values resulted in approximately the same text-complexity
value as the right-most texts (22.57) where intersentential complexity was conditioned by lower
values on non-compressibility.
A second way to explore potential interplay among variables was to visually examine
contour plots (Nason et al., 2004). Several were created for selected combinations of text
characteristics. A general finding was that there was interplay among the text characteristics in
relation to text complexity. A limitation of contour plots is that a maximum of two predictors can
be plotted. Figure 7 illustrates the interplay of age of acquisition with phrase diversity in relation
to text-complexity level. The plot was generated from a random forest regression with just the
two text-characteristic variable operationalizations and text-complexity level as the outcome,
without controlling for the other seven text characteristics and with minimum node size of five.
The main finding from the illustrative contour plot was that age of acquisition was conditioned
by phrase diversity in relation to text complexity. Regions of texts are seen in the plot. The
highest values on text complexity (red in the plot) occurred in texts that had high values on age
of acquisition and high values on phrase diversity (low amounts of repetition, redundancy, or
Early‐GradesTextComplexity
38
patterning). As well, texts with the lowest text-complexity values (dark blue) tended to have low
values for age of acquisition and phrase diversity. However, some texts (e.g., light blue in the
lower right quadrant) that had high values on age of acquisition had low text-complexity values
when age of acquisition was moderated or conditioned by low values on phrase diversity, that is,
when a fair amount of repetition, redundancy, or patterning was present. The point is, again,
there is interplay of text characteristics in relation to text-complexity level.
Text characteristic profile changes as text-complexity level increased. Another
visualization method to understand text-characteristic collective patterning was to examine text
characteristic profiles as text-complexity level increased (Cohen et al., 2003). The nine text
characteristics were standardized as z-scores, texts were formed into quintile groups, and a graph
was plotted using the within group means. As shown in Figure 8, first, the lowest quintile texts
had a profile pattern that is markedly different from the other patterns. On average, the texts were
characterized by less complex word structure (low decoding demand and relatively few
syllables), relatively low-level vocabulary (younger age of acquisition, not very abstract words,
and words that were not as rare as what appeared in more complex texts), coupled with, on the
whole, highly redundant and repetitive texts (the exception is non-compressibility) (recall that
lower scores on the discourse level variables mean more redundancy and patterning). Moving up
the graph, the next two quintile patterns were highly similar to one another, and the highest two
quintile profiles were nearly flat with minor exceptions. In essence, text-characteristic profiles
gradually changed as text complexity increased. Second, word structure became increasingly
complex with each rising quintile. As well, on the whole, word meanings became harder and
harder as text complexity increased. The exception was word rareness, which was similar in the
bottom two quintiles. Also, on the whole, discourse-level redundancy and repetition decreased as
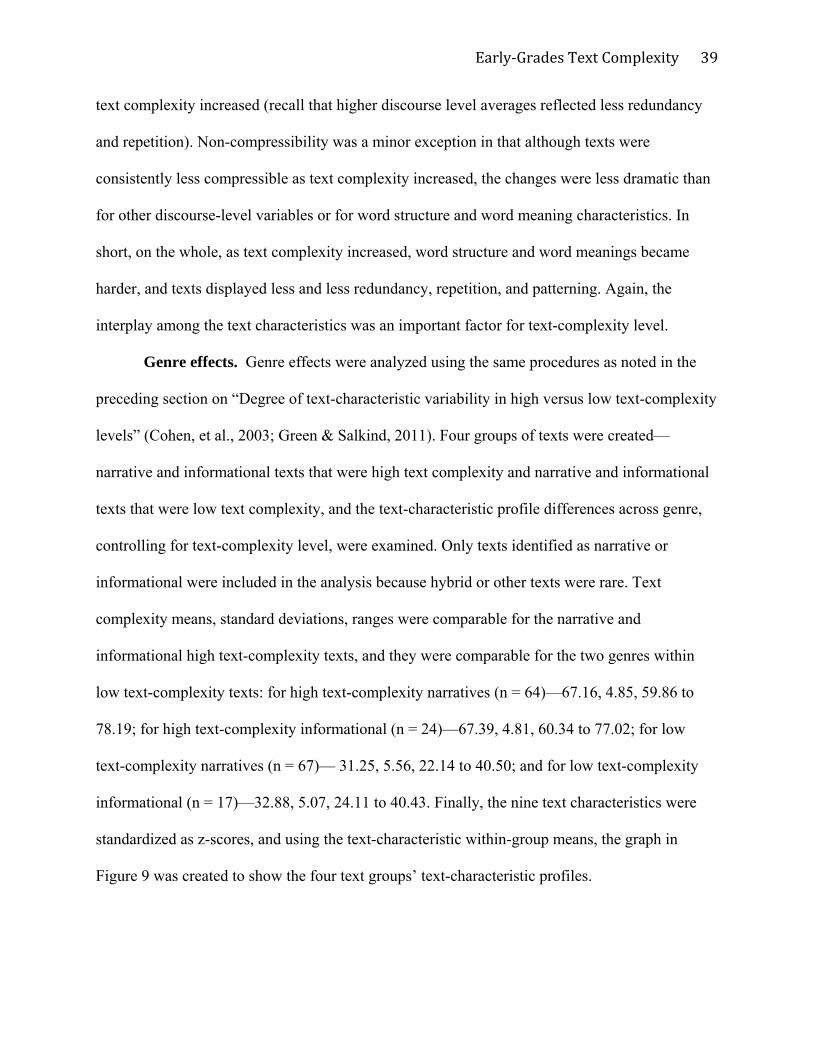
Early‐GradesTextComplexity
39
text complexity increased (recall that higher discourse level averages reflected less redundancy
and repetition). Non-compressibility was a minor exception in that although texts were
consistently less compressible as text complexity increased, the changes were less dramatic than
for other discourse-level variables or for word structure and word meaning characteristics. In
short, on the whole, as text complexity increased, word structure and word meanings became
harder, and texts displayed less and less redundancy, repetition, and patterning. Again, the
interplay among the text characteristics was an important factor for text-complexity level.
Genre effects. Genre effects were analyzed using the same procedures as noted in the
preceding section on “Degree of text-characteristic variability in high versus low text-complexity
levels” (Cohen, et al., 2003; Green & Salkind, 2011). Four groups of texts were created—
narrative and informational texts that were high text complexity and narrative and informational
texts that were low text complexity, and the text-characteristic profile differences across genre,
controlling for text-complexity level, were examined. Only texts identified as narrative or
informational were included in the analysis because hybrid or other texts were rare. Text
complexity means, standard deviations, ranges were comparable for the narrative and
informational high text-complexity texts, and they were comparable for the two genres within
low text-complexity texts: for high text-complexity narratives (n = 64)—67.16, 4.85, 59.86 to
78.19; for high text-complexity informational (n = 24)—67.39, 4.81, 60.34 to 77.02; for low
text-complexity narratives (n = 67)— 31.25, 5.56, 22.14 to 40.50; and for low text-complexity
informational (n = 17)—32.88, 5.07, 24.11 to 40.43. Finally, the nine text characteristics were
standardized as z-scores, and using the text-characteristic within-group means, the graph in
Figure 9 was created to show the four text groups’ text-characteristic profiles.
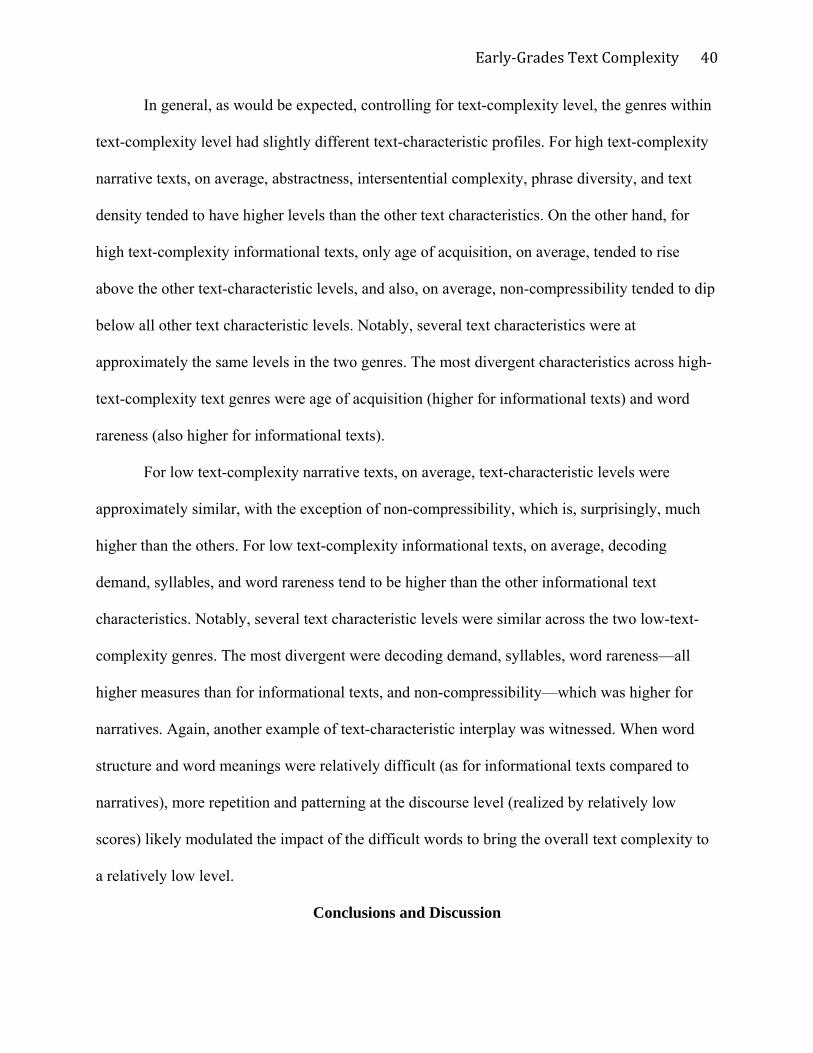
Early‐GradesTextComplexity
40
In general, as would be expected, controlling for text-complexity level, the genres within
text-complexity level had slightly different text-characteristic profiles. For high text-complexity
narrative texts, on average, abstractness, intersentential complexity, phrase diversity, and text
density tended to have higher levels than the other text characteristics. On the other hand, for
high text-complexity informational texts, only age of acquisition, on average, tended to rise
above the other text-characteristic levels, and also, on average, non-compressibility tended to dip
below all other text characteristic levels. Notably, several text characteristics were at
approximately the same levels in the two genres. The most divergent characteristics across high-
text-complexity text genres were age of acquisition (higher for informational texts) and word
rareness (also higher for informational texts).
For low text-complexity narrative texts, on average, text-characteristic levels were
approximately similar, with the exception of non-compressibility, which is, surprisingly, much
higher than the others. For low text-complexity informational texts, on average, decoding
demand, syllables, and word rareness tend to be higher than the other informational text
characteristics. Notably, several text characteristic levels were similar across the two low-text-
complexity genres. The most divergent were decoding demand, syllables, word rareness—all
higher measures than for informational texts, and non-compressibility—which was higher for
narratives. Again, another example of text-characteristic interplay was witnessed. When word
structure and word meanings were relatively difficult (as for informational texts compared to
narratives), more repetition and patterning at the discourse level (realized by relatively low
scores) likely modulated the impact of the difficult words to bring the overall text complexity to
a relatively low level.
Conclusions and Discussion
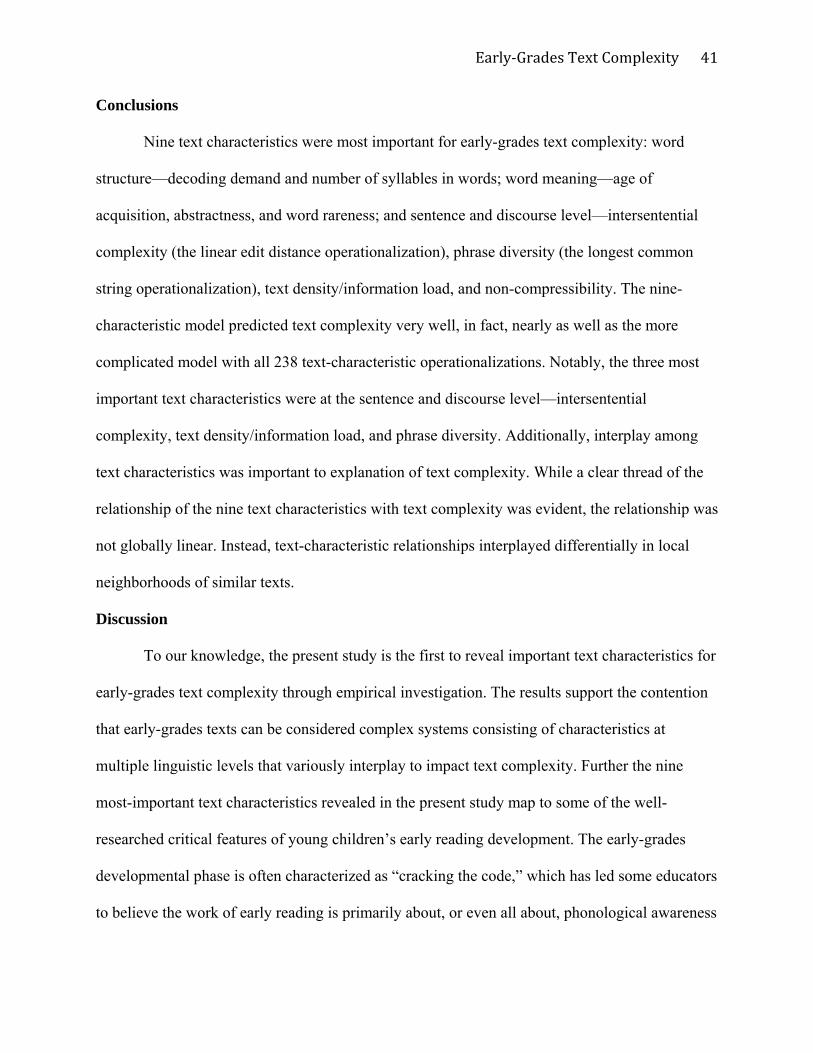
Early‐GradesTextComplexity
41
Conclusions
Nine text characteristics were most important for early-grades text complexity: word
structure—decoding demand and number of syllables in words; word meaning—age of
acquisition, abstractness, and word rareness; and sentence and discourse level—intersentential
complexity (the linear edit distance operationalization), phrase diversity (the longest common
string operationalization), text density/information load, and non-compressibility. The nine-
characteristic model predicted text complexity very well, in fact, nearly as well as the more
complicated model with all 238 text-characteristic operationalizations. Notably, the three most
important text characteristics were at the sentence and discourse level—intersentential
complexity, text density/information load, and phrase diversity. Additionally, interplay among
text characteristics was important to explanation of text complexity. While a clear thread of the
relationship of the nine text characteristics with text complexity was evident, the relationship was
not globally linear. Instead, text-characteristic relationships interplayed differentially in local
neighborhoods of similar texts.
Discussion
To our knowledge, the present study is the first to reveal important text characteristics for
early-grades text complexity through empirical investigation. The results support the contention
that early-grades texts can be considered complex systems consisting of characteristics at
multiple linguistic levels that variously interplay to impact text complexity. Further the nine
most-important text characteristics revealed in the present study map to some of the well-
researched critical features of young children’s early reading development. The early-grades
developmental phase is often characterized as “cracking the code,” which has led some educators
to believe the work of early reading is primarily about, or even all about, phonological awareness
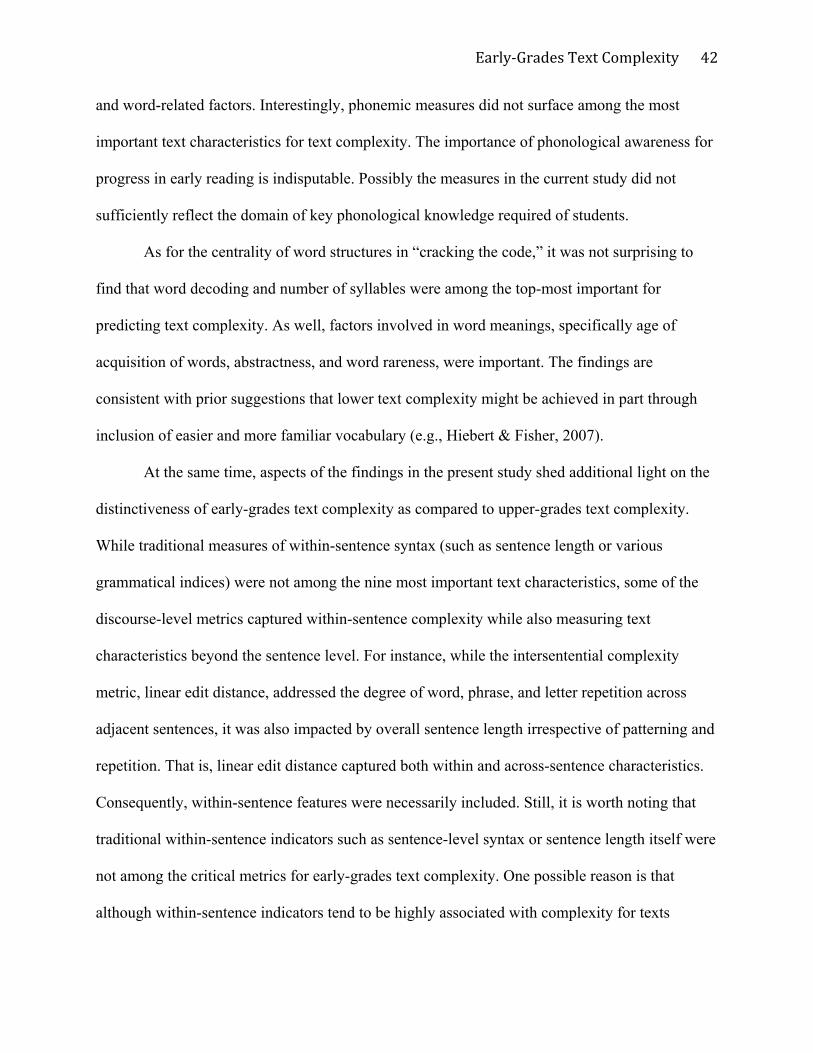
Early‐GradesTextComplexity
42
and word-related factors. Interestingly, phonemic measures did not surface among the most
important text characteristics for text complexity. The importance of phonological awareness for
progress in early reading is indisputable. Possibly the measures in the current study did not
sufficiently reflect the domain of key phonological knowledge required of students.
As for the centrality of word structures in “cracking the code,” it was not surprising to
find that word decoding and number of syllables were among the top-most important for
predicting text complexity. As well, factors involved in word meanings, specifically age of
acquisition of words, abstractness, and word rareness, were important. The findings are
consistent with prior suggestions that lower text complexity might be achieved in part through
inclusion of easier and more familiar vocabulary (e.g., Hiebert & Fisher, 2007).
At the same time, aspects of the findings in the present study shed additional light on the
distinctiveness of early-grades text complexity as compared to upper-grades text complexity.
While traditional measures of within-sentence syntax (such as sentence length or various
grammatical indices) were not among the nine most important text characteristics, some of the
discourse-level metrics captured within-sentence complexity while also measuring text
characteristics beyond the sentence level. For instance, while the intersentential complexity
metric, linear edit distance, addressed the degree of word, phrase, and letter repetition across
adjacent sentences, it was also impacted by overall sentence length irrespective of patterning and
repetition. That is, linear edit distance captured both within and across-sentence characteristics.
Consequently, within-sentence features were necessarily included. Still, it is worth noting that
traditional within-sentence indicators such as sentence-level syntax or sentence length itself were
not among the critical metrics for early-grades text complexity. One possible reason is that
although within-sentence indicators tend to be highly associated with complexity for texts
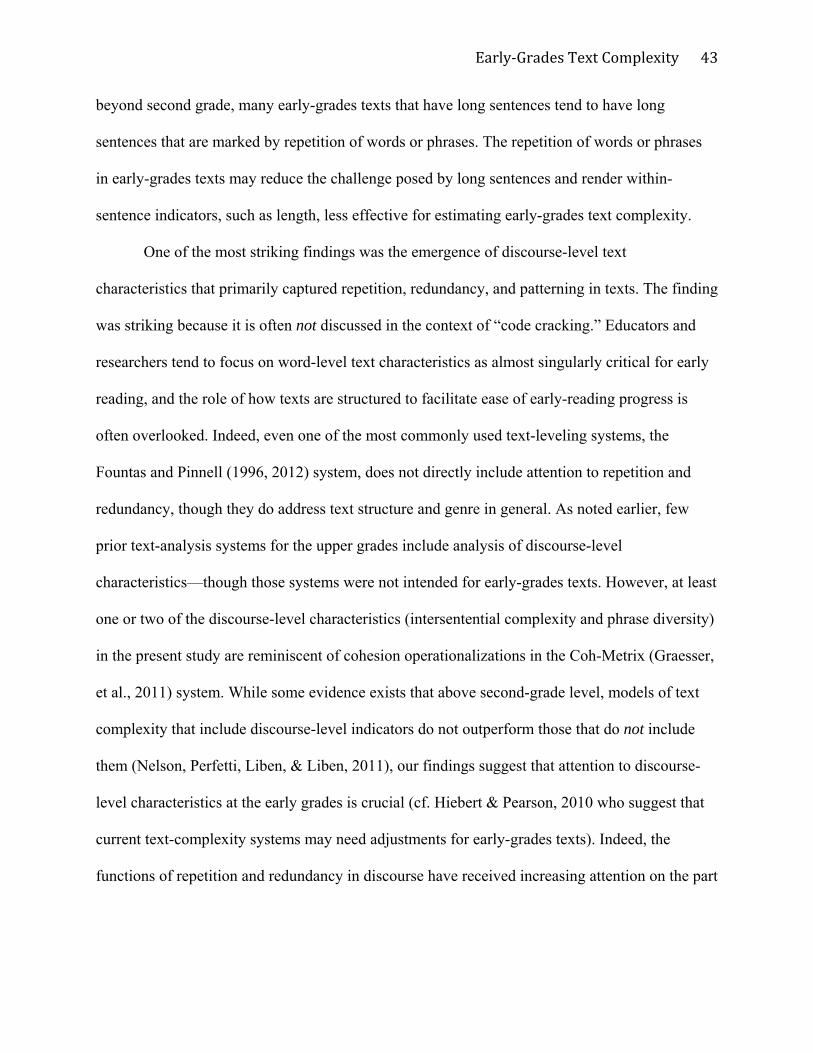
Early‐GradesTextComplexity
43
beyond second grade, many early-grades texts that have long sentences tend to have long
sentences that are marked by repetition of words or phrases. The repetition of words or phrases
in early-grades texts may reduce the challenge posed by long sentences and render within-
sentence indicators, such as length, less effective for estimating early-grades text complexity.
One of the most striking findings was the emergence of discourse-level text
characteristics that primarily captured repetition, redundancy, and patterning in texts. The finding
was striking because it is often not discussed in the context of “code cracking.” Educators and
researchers tend to focus on word-level text characteristics as almost singularly critical for early
reading, and the role of how texts are structured to facilitate ease of early-reading progress is
often overlooked. Indeed, even one of the most commonly used text-leveling systems, the
Fountas and Pinnell (1996, 2012) system, does not directly include attention to repetition and
redundancy, though they do address text structure and genre in general. As noted earlier, few
prior text-analysis systems for the upper grades include analysis of discourse-level
characteristics—though those systems were not intended for early-grades texts. However, at least
one or two of the discourse-level characteristics (intersentential complexity and phrase diversity)
in the present study are reminiscent of cohesion operationalizations in the Coh-Metrix (Graesser,
et al., 2011) system. While some evidence exists that above second-grade level, models of text
complexity that include discourse-level indicators do not outperform those that do not include
them (Nelson, Perfetti, Liben, & Liben, 2011), our findings suggest that attention to discourse-
level characteristics at the early grades is crucial (cf. Hiebert & Pearson, 2010 who suggest that
current text-complexity systems may need adjustments for early-grades texts). Indeed, the
functions of repetition and redundancy in discourse have received increasing attention on the part
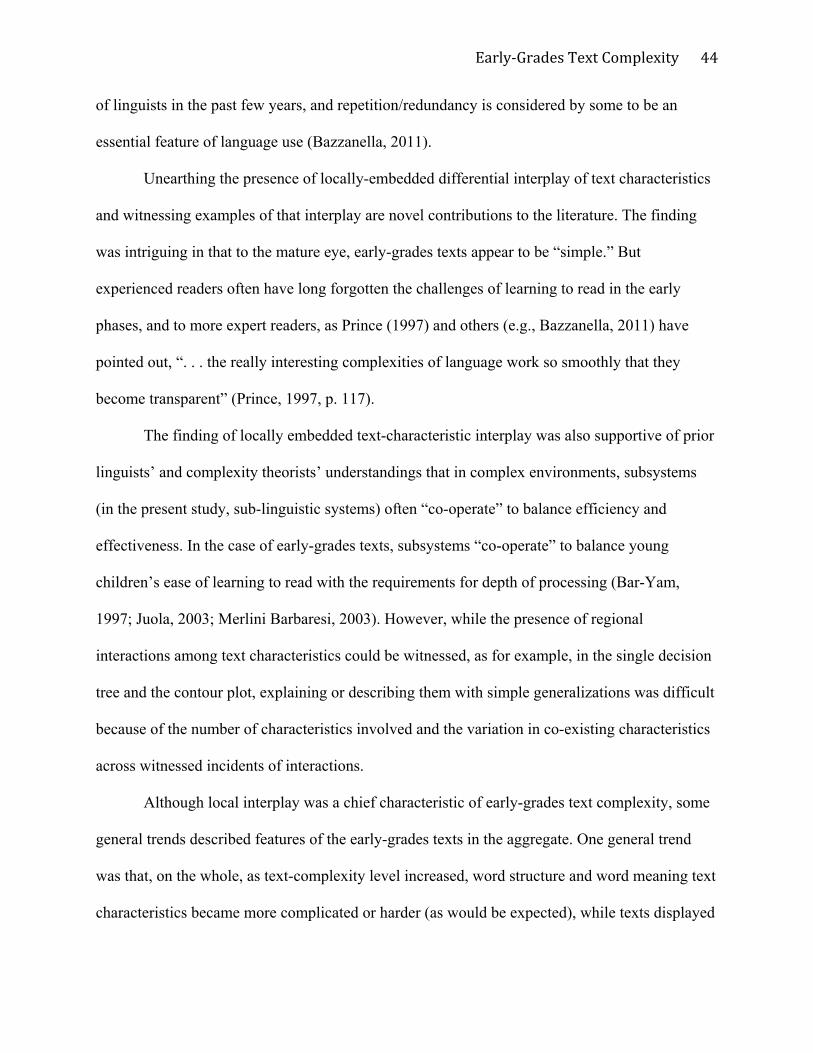
Early‐GradesTextComplexity
44
of linguists in the past few years, and repetition/redundancy is considered by some to be an
essential feature of language use (Bazzanella, 2011).
Unearthing the presence of locally-embedded differential interplay of text characteristics
and witnessing examples of that interplay are novel contributions to the literature. The finding
was intriguing in that to the mature eye, early-grades texts appear to be “simple.” But
experienced readers often have long forgotten the challenges of learning to read in the early
phases, and to more expert readers, as Prince (1997) and others (e.g., Bazzanella, 2011) have
pointed out, “. . . the really interesting complexities of language work so smoothly that they
become transparent” (Prince, 1997, p. 117).
The finding of locally embedded text-characteristic interplay was also supportive of prior
linguists’ and complexity theorists’ understandings that in complex environments, subsystems
(in the present study, sub-linguistic systems) often “co-operate” to balance efficiency and
effectiveness. In the case of early-grades texts, subsystems “co-operate” to balance young
children’s ease of learning to read with the requirements for depth of processing (Bar-Yam,
1997; Juola, 2003; Merlini Barbaresi, 2003). However, while the presence of regional
interactions among text characteristics could be witnessed, as for example, in the single decision
tree and the contour plot, explaining or describing them with simple generalizations was difficult
because of the number of characteristics involved and the variation in co-existing characteristics
across witnessed incidents of interactions.
Although local interplay was a chief characteristic of early-grades text complexity, some
general trends described features of the early-grades texts in the aggregate. One general trend
was that, on the whole, as text-complexity level increased, word structure and word meaning text
characteristics became more complicated or harder (as would be expected), while texts displayed
Early‐GradesTextComplexity
45
less and less redundancy, repetition, and patterning. That is, linguistic levels interplayed such
that text characteristics tended to coalesce in one way for less complex texts and in another way
for more complex texts.
Another general trend was for high-complexity informational texts to have somewhat
higher age-of-acquisition and word rareness measures as compared to narrative texts. On the
other hand, low-complexity informational texts tended to have somewhat higher decoding
demand, more syllables, and rarer words than narratives, but narratives were less compressible.
For both high- and low-complexity texts, interestingly, discourse-level text characteristics were
fairly similar across the two genres with informational texts having slightly lower discourse-level
values, indicating more repetition, redundancy, or patterning. The result again supports the
interplay of variables in that the presence of more difficult words was compensated by increased
scaffolding in the form of repetition or patterning. The difference should be considered with
caution, as a relatively small number of books constituted the genre analysis. Rather than
assuming the result is generalizable, it is more appropriate to consider it sufficiently provoking to
warrant further analysis in future studies.
However, taken at face value, the genre result is consistent with logical expectations. In
general, at the early-grades levels, informational texts might tend to have more difficult
vocabulary than narratives, and at the lowest text complexity levels, it would be challenging to
lower decoding demand for content-laden material. It is worth noting that when using random
forest regression with the nine-characteristic text-complexity model, random forest regression
easily accounts for any localized or general text characteristic collections that might be related to
genre.
The Promise of Random Forest Regression and Machine-Learning Research Methods
Early‐GradesTextComplexity
46
The successful use of random forest regression for modeling text complexity in early-
grades texts demonstrates the potential for the random forest regression advantage when
addressing a high-dimensional educational problem. In the case of early-grades text complexity,
a modeling technique such as linear regression may not satisfactorily allow for investigations
employing either the large number of variables required for text analysis or the potentially huge
number of complex text-characteristic interactions that likely permeate early-grades texts. It is
important to note however, that we did not accomplish a comparison of results from a theorized
linear regression model and a random forest model, and consequently our statement here about
the possible random forest regression advantage is hypothetical. At the same time, it is difficult
to imagine how such a comparison could be tested—because there is no way to tap a priori
localized interactions among text characteristics in traditional linear regression.
As well, random forest can be a more robust model than some other traditional modeling
techniques in that it accounts for exceptional cases. To comprehensively study early-grades texts,
where many different types of text exist, it is important to include even those texts that might
traditionally be considered “outliers,” that is, texts that might have text-characteristic
configurations that fall in the long tails of early-grades text distributions. For instance, label
books do not contain connected text, but instead one word is shown beside a picture. In a
traditional analysis, such books might be considered outliers because they have text
characteristics that are quite different from a majority of texts. However, label books are
commonly used in early-grades classrooms, and any study of text complexity should take them
into consideration. As well, random forest regression automatically handles conditionality that
can occur in ensembles of text characteristics, and as such it brings the tails of distributions “into
the fold.”
Early‐GradesTextComplexity
47
Finally random forest regression can take advantage of a weak predictor by using it only
when it is needed. In the present study, non-compressibility might be considered a weak
predictor in that it was not highly correlated with other characteristics (except for phrase
diversity) or with text complexity. However, non-compressibility tended to locate repetition,
redundancy, and patterning where the other three discourse-level characteristics did not locate it.
Such texts were rare in the present study, but on those rare occasions, there was important value
in the non-compressibility measure.
High-dimensional problems are common in educational arenas in cases where large
numbers of variables are at play and large amounts of data are generated, and random forest
regression is a statistical modeling technique that could innovate the repertoire of educational
statistical modeling. Where pressing educational problems involve large numbers of variables
and/or potentially large numbers of interactions among variables, random forest regression could
provide uniquely satisfying solutions (Baca-Garcia et al., 2007).
The machine-learning techniques used in the present study uniquely revealed early-
grades text complexity. While prior text-complexity systems existed, theorization about text
complexity, especially early-grades text complexity, was limited (Mesmer et al., 2012), and
debates about construct coverage in the existing measurement systems proliferated (e.g.,
Sheehan, et al., 2010). As a consequence, employing a wide array of possible operationalizations
of text characteristics, each of which might capture a nuanced sense of any text characteristic,
was important, as was the use of a logical investigative progression to narrow the most important
characteristics. That is, through machine learning techniques, the data could “speak,” and a text-
complexity model could be constructed from the data themselves (Wasserman, in press).
Early‐GradesTextComplexity
48
Further, the interactive, dynamic graphics used to explore data structure are common in
machine-learning communities, but not as common in educational research. While no statistical
significance was attached to the visualization techniques, they tended to be very useful in
understanding functional relationships among text characteristics and text complexity.
Limitations of the Study
The following limitations of the study should be considered as context for interpreting the
findings. First, although random forest provided many advantages for the study of early-grades
text complexity, the resulting functional shape of the data was interpretable only to a certain
degree. That is, the complexity of text-characteristic interactions was acknowledged, but it could
not be described in simple ways or with a parsimonious set of rules. Whether lack of a final
specified statement detailing local interactions is a failure or a limitation is debatable. For those
who embrace complexity theory, tensions between chaos and parsimony, between complexity
and simplicity are natural—they exist in the natural world, and attempts to over-specify distort
reality.
Second, text selection for study was extremely important. The population of classroom
texts should be broadly represented. While every attempt was made to accomplish broad
representation, the texts selected for the study may set boundaries on the generalizability of
findings, and readers of the study should draw their own conclusions about the text
representation.
A third limitation is that a traditionalist statistician working in the fields of psychology or
education might consider the process of trimming variables awkward or imprecise. Lacking
statistical estimation of variable “significance,” logical analysis was necessary. Some may
question the reliability of the logical analysis. Certainly, when such methodology is used, it is
Early‐GradesTextComplexity
49
critical that detailed description is provided so that readers may glean whether conclusions are
warranted.
A fourth possible limitation is that because pictures could not be analyzed digitally, the
role of pictures in early-grades text complexity was not directly assessed. However, pictures
were indirectly involved in that they were present in both the teacher and student substudies for
creation of the text-complexity metric.
Implications for Practice
One major practical implication of the present results is that educators should consider
discourse-level text characteristics in early-grade readers perhaps more than is the current case.
Some researchers and teacher educators advocate that educators should account for text
“organization” (e.g., Shanahan, Fisher, & Frey, 2012), or in the case of Coh-Metrix, discourse-
level features such as cohesion (Graesser, et al., 2011), when assigning texts to students. Given
that “code-cracking” is prevalent during the early-grades, it is likely that in everyday classroom
instruction, word-level characteristics are favored, and discourse-level text characteristics may be
given short shrift. Instead, attention to discourse-level features such as repetition, redundancy,
and patterning would appear to be in order.
As well, few teacher educators or researchers espouse the significance of the interplay
among text characteristics for text complexity in general, even above the early grades. While the
important text characteristics often, if not typically, make unique contributions to text
complexity, in many texts, their interplay is equally important, if not more important.
Consequently, it is critical that, when selecting texts for young children, educators consider ways
in which characteristics can modulate one another’s challenges. For example, presence of
repetition, redundancy, and patterning can ease reading progress for children when texts have
Early‐GradesTextComplexity
50
somewhat challenging word structures and/or word meanings. In light of evidence that present-
day core-reading programs tend to have somewhat difficult vocabulary (Foorman, et al., 2004),
teachers might particularly observe degrees of repetition and patterning in core readers and
provide additional instructional support for students as needed.
The finding of more variability in lower text-complexity texts than in higher ones was
interesting in that some might anticipate the opposite—less variability (more control over) the
characteristics for students who are just beginning to learn to read, with more variability (less
control over) characteristics as students advance their reading ability. Educators might need to
consider the lowest level texts especially carefully when choosing texts for students’ independent
reading versus for instructional settings where teachers can provide more support.
Finally, publishers of early-grades texts should account for multiple text characteristics
when creating and/or leveling early-grades texts. Some current-day leveling systems that are
commonly used by publishers and/or classroom teachers, such as Fountas and Pinnell’s (2012)
system, do take into account text characteristics at multiple linguistic levels, but many publishers
rely solely on measurement of word frequency and sentence length. While the latter two factors
can be useful for many reasons, creation of optimal texts that ease young students’ reading
growth and use of optimal leveling systems likely requires consideration of a wider gamut of
early-grades text characteristics.
Implications for Future Research
The present findings lend credence to a complexity theory of early-grades texts. One
challenge for future research is further exploration of potential classes of early-grades texts
where, within class, selected ensembles of characteristics condition one another in similar ways.
If such classes of texts are identifiable, through professional development sessions, educators
Early‐GradesTextComplexity
51
might come to a fuller understanding of the importance of selecting texts with certain
characteristics to enhance particular cognitions as students begin to learn to read.
The results of the present work suggest that a tool, an automated analyzer, could be
created from the final nine-variable predictor model using random forest regression. The
development of such a tool could be potentially useful to researchers who are interested in
evaluating existing reading materials or to guide the development of new materials.
Finally, the present text-complexity model of text characteristics might also be used in
intervention efforts. Texts could be theoretically configured as “best texts to facilitate young
children’s reading progress.” Then in a controlled comparison-group intervention design,
children’s reading progress could be examined when reading instruction occurs with such texts
as compared to other classes of texts that exist widely in current-day classrooms.
Early‐GradesTextComplexity
52
References
ACT. (2006). Reading between the lines: What the ACT reveals about college readiness in
reading. Iowa City, IA: Author.
Adams, M. (1990). Beginning to read: Thinking and learning about print. Cambridge, MA: MIT
Press.
Albert, R., & Barabási, A-L. (2002). Statistical mechanics of complex networks. Reviews of
Modern Physics, 74, 47-97.
ATOS. (n.d.). http://www.renlearn.com/atos/
Aukerman, R. C. (1984). Approaches to beginning reading (2nd ed.). New York: John Wiley &
Sons.
Baca-Garcia, E., Perez-Rodriguez, M. M., Saiz-Gonzalez, D., Basurte-Villamor, I., Saiz-Ruiz, J.,
Leiva-Murillo, J. M., et al. (2007). Variables associated with familial suicide attempts in a
sample of suicide attempters. Progress in Neuro-Pscyhopharmacology & Biological
Psychiatry, 31, 1312-1316.
Bar-Yam, Y. (1997). Dynamics of complex systems. Reading, MA: Addison Wesley.
Bazzanella, C. (2011). Redundancy, repetition, and intensity in discourse. Language Sciences,
33, 243-254.
Biber, D. (1988). Variation across speech and writing. Cambridget, England: Cambridge
University Press.
Bond, T. G., & Fox, C. M. (2007). Fundamental measurement in the human sciences (2nd
Edition). Mahwah, NJ: Erlbaum.
Early‐GradesTextComplexity
53
Bowers, P. G., & Wolf, M. (1993). Theoretical links among naming speed, precise timing
mechanisms and orthographic skill in dyslexia. Reading and Writing: An Interdisciplinary
Journal, 5, 69-85.
Breiman, L. (2001a). Random forests. Machine Learning, 45, 5-32.
Breiman, L. (2001b). Statistical modeling: The two cultures. Statistical Science, 16, 199-231.
Breiman, L., Friedman, J. H., Olshen, R. A., & Stone, C. J. (1984). Classification and regression
trees. New York: Chapman & Hall.
Britton, B. K., Glynn, S. M., Meyer, B. J., & Penland, M. J. (1982). Effects of text structure on
use of cognitive capacity during reading. Journal of Educational Psychology, 74, 51-61.
Burrows, M., & Wheeler, D. J. (1994). A block sorting lossless data compression algorithm
(Technical Rep. No. 124). Maynard, MA: Digital Equipment Corporation.
Carnegie Mellon University. (n.d.) CMU Pronouncing Dictionary.
http://www.speech.cs.cmu.edu/cgi-bin/cmudict
Carroll, J. B., Davies, P. & Richman, B. (1971). The American Heritage Word Frequency Book.
New York: American Heritage.
Cohen, J., Cohen, P., Aiken, L. S., & West, S. H. (2003). Applied multiple regression/correlation
analysis for the behavioral sciences. Hillsdale, NJ: Erlbaum.
Cohesion (Linguistics). (n. d.) http://en.wikipedia.org/wiki/Cohesion_%28linguistics%29
Collins, M. (2002, July). Discriminative training methods for hidden Markov models: Theory
and experiments with perceptron algorithms. In Hajič, J. & Matsumoto, Y. (Eds.),
Proceedings of the Conference on Empirical Methods in Natural Language Processing
(EMNLP) (pp. 1-8). Philadelphia: Special Interest Group on Linguistic Data and Corpus-
Based Approaches to NLP (SIGDAT).
Early‐GradesTextComplexity
54
Coltheart, M. (1981). The MRC psycholinguistic database. The Quarterly Journal of
Experimental Psychology, Section A: Human Experimental Psychology, 33, 497-505. The
MRC Psycholinguistic Database is available at: www.psych.rl.ac.uk. [It is a machine usable
dictionary containing 150,837 words with up to 26 linguistic and psycholinguistic attributes
for each.]
Compton, D. L., Appleton, A. G., & Hosp, M. K. (2004). Exploring the relationship between
text-leveling systems and reading accuracy and fluency in second-grade students who are
average and poor decoders. Learning Disabilities Research & Practice, 19, 176-184.
Cook, D., & Swayne, D. F. (2008). Interactive and dynamic graphics for data analysis with R
and Ggobi. New York: Springer.
Deerwester, S., Dumais, S. T., Furnas, G. W., Landauer, T. K., Harshman, R. (1990). Indexing
by Latent Semantic Analysis. Journal of the American Society for Information Science, 41,
391-407.
Dolch Word List. (n.d.). http://en.wikipedia.org/wiki/Dolch_word_list
Duke, N. K. (2000). 3.6 minute per day: The scarcity of informational texts in first grade.
Reading Research Quarterly, 35, 202-224.
Ehri, L. C., & McCormick, S. (1998). Phases of word learning: Implications for instruction with
delayed and disabled readers. Reading & Writing Quarterly: Overcoming Learning
Difficulties, 14, 135-163.
Fitzgerald, J., & Shanahan, T. (2000). Reading and writing relations and their development.
Educational Psychology, 93, 3-22.
Early‐GradesTextComplexity
55
Foorman, B. R., Francis, D. J., Davidson, K. G., Harm, M. W., & Griffin, J. (2004). Variability
in text features in six grade 1 basal reading programs. Scientific Studies of Reading, 8, 167-
197.
Fountas, I. C., & Pinnell, G. S. (1996). Guided reading: Good first teaching for all children.
Portsmouth, NH: Heinemann.
Fountas, I. C., & Pinnell, G. S. (2012). Guided reading: The romance and the reality. The
Reading Teacher, 66, 268-284.
Fry Word List. (n.d.). http://www.k12reader.com/fry-word-list-1000-high-frequency-words/
Gamson, D. A., Lu, X., & Eckert, S. A. (2013). Challenging the research base of the Common
Core State Standards: A historical reanalysis of text complexity. Educational Researcher,
42, 381-391.
Gervasi, V., & Ambriola, V. (2003). Quantitative assessment of textual complexity. In L. Merlini
Barbaresi (Ed.), Complexity in language and text (pp. 1999-230). Pisa: Edizioni Plus.
Graesser, A. C., & McNamara, D. S. (2011). Computational analyses of multilevel discourse
comprehension. Topics in Cognitive Science, 3, 371-398.
Graesser, A. C., McNamara, D. S., & Kulikowich, J. M. (2011). Coh-Metrix: Providing
multilevel analyses of text characteristics. Educational Researcher, 40, 223-234.
Green, S. B., & Salkind, N. J. (2011). Using SPSS for Windows and Macintosh: Analyzing and
Understanding Data (6th ed.). Upper Saddle River, NJ: Prentice Hall.
Grömping, U. (2009). Variable importance assessment in regression: Linear regression versus
random forest. The American Statistician, 63, 308-319.
Early‐GradesTextComplexity
56
Gusfield, D. (1997, reprinted 1999). Algorithms on strings, trees and sequences: Computer
science and computational biology. Cambridge, England, New York, and Melbourne,
Australia: University of Cambridge.
Halliday, M. A. K., & Hasan, R. (1976). Cohesion in English. London: Longman.
Hastie, T., Tibshirani, R., & Friedman, J. H. (2009). The elements of statistical learning (2nd ed.).
New York: Springer.
Heldsinger, S., & Humphry, S. (2010). Using the method of pairwise comparison to obtain
reliable teacher assessments. The Australian Educational Researcher, 37, 1-19.
Hiebert, E. H. (2011). Texts for beginning readers: The search for optimal scaffolds. In C.
Conrad & R. Serlin (Eds.), The SAGE Handbook for Research in Education: Pursuing Ideas
as the Keystone of Exemplary Inquiry (pp. 413-428). Thousand Oaks, CA: SAGE.
Hiebert, E. H. (2012). The Common Core’s staircase of text complexity: Getting the size of the
first step right. Reading Today, 29(3), 26-27.
Hiebert, E. H., & Fisher, C. W. (2007). The critical word factor in texts for beginning readers.
Journal of Educational Research, 101, 3-11.
Hiebert, E. H., & Pearson, P. D. (2010). An examination of current text difficulty indices with
early reading texts. (Reading Research Report 10-01). Santa Cruz, CA: TextProject, Inc.
Howes, D. H., & Solomon, R. L. (1951). Visual duration thresholds as a function of word
probability. Journal of Experimental Psychology, 92, 248-255.
Juel, C., & Roper-Schneider, D. (1985). The influence of basal readers on first grade reading.
Reading Research Quarterly, 20, 134-152.
Early‐GradesTextComplexity
57
Juola, P. (2003). Assessing linguistic complexity. In M. Miestamo, K. Sinne Sinnemäki, & F.
Karlsson (Eds.), Language complexity: Typology, contact, change (pp. 89-108). Amsterdam,
The Netherlands and Philadelphia: John Benjamins Publishing Co.
Kauffman, S. A. (1995). At home in the universe: The search for laws of self-organization and
complexity. New York and Oxford: Oxford University Press.
Kintsch, W. (1998). Comprehension: A paradigm for cognition. Cambridge, UK: Cambridge
University Press.
Klare, G. R. (1974-1975). Assessing readability. Reading Research Quarterly, 10, 62-102.
Kolen, M. M., & Brennan, R. L. (2004). Test equating, scaling, and linking: Methods and
practices (2nd ed.). New York: Springer-Verlag.
Koslin, B. I., Zeno, S., & Koslin, S. (1987). The DRP: An effective measure in reading. New
York: College Entrance Examination Board.
Kruskal, J. B. (1999). An overview of sequence comparison. In D. Sankoff & J. B. Kruskal
(Eds.), Time warps, string edits, and macromolecules: The theory and practice of sequence
comparison (pp. 1-44). Stanford, CA: Center for the Study of Language and Information.
Kuperman, V., Stadthagen-Gonzalez, H., & Brysbaert, M. (2012). Age-of-acquisition ratings for
30,000 English words. Behavior Research Methods, 44, 978-990.
Kusters, W. (2008). Complexity in linguistic theory, language learning and language change. In
M. Miestamo, K. Sinnemäki, & F. Karlsson (Eds.), Language complexity: Typology,
contact, change (pp. 3-22). Amsterdam, The Netherlands and Philadelphia: John Benjamins
Publishing Co.
Early‐GradesTextComplexity
58
Landauer, T. K., & Dumais, S. T. (1997). A solution to Plato’s problem: The Latent Semantic
Analysis theory of acquisition, induction and representation of knowledge. Psychological
Review, 104, 211-240.
Langer, J. A., Campbell, J. R., Neuman, S. B., Mullis, I. V. S., Persky, H. R., & Donahue, P. S.
(1995). Reading assessment redesigned: Authentic texts and innovative instruments in
NAEP’s 1992 survey. Washington, DE: U. S. Department of Education, Office of
Educational Research and Improvement.
Levenshtein, V. I. (1965, translated to English 1966). Binary codes capable of correcting
deletions, insertions, and reversals. Doklady Akademii Nauk SSSR, 163, 845-848.
Link Grammar. (n.d.). http://www.link.cs.cmu.edu/link/
Luhn, H. P. (1958). The automatic creation of literature abstracts. IBM Journal of Research and
Development, 2, 159-165.
Malvern, D. D., Richards, B. J., Chipere, N., & Durán, P. (2009). Lexical diversity and language
development: Quantification and assessment. New York: Palgrave Macmillan.
Mandler, M. J., & Johnson, N. S. (1977). Remembrance of things parsed: Story structure and
recall. Cognitive Psychology, 9, 111-151.
McNamara, D. S., Graesser, A. C., McCarthy, P. M., & Cai, Z. (2014). Automated evaluation of
text and discourse with Coh-Metrix. New York: Cambridge University Press.
McNamara, D. S., & Kintsch, W. (1996). Learning from text: Effects of prior knowledge and
text coherence. Discourse Processes, 22, 247-287.
Menon, S., & Hiebert, E. H. (1999). Literature anthologies: The task for first-graders. Ann
Arbor, MI: Center for the Improvement of Early Reading Achievement.
Early‐GradesTextComplexity
59
Merlini Barbaresi, L. M. (2002). Text linguistics and literary translation. In A. Riccardi (Ed.),
Translation studies: Perspectives on an emerging discipline (pp. 120-132).
Merlini Barbaresi, L. M. (2003). Towards a theory of text complexity. In L. Merlini Barbaresi
(Ed.), Complexity in language and text (pp. 23-66). Pisa, Italy: Edizioni Plus.
Mesmer, H. A. (2006). Beginning reading materials: A national survey of primary teachers’
reported uses and beliefs. Journal of Literacy Research, 38, 389-425.
Mesmer, H. A., Cunningham, J. W., & Hiebert, E. H. (2012). Toward a theoretical model of text
complexity for the early grades: Learning from the past, anticipating the future. Reading
Research Quarterly, 47, 235-258.
MetaMetrics. (n.d.a). Text corpus. Durham, NC: MetaMetrics.
MetaMetrics. (n.d.b). Word corpus. Durham, NC: MetaMetrics.
Metsala, J. L. (1999). Young children’s phonological awareness and non-word repetition as a
function of vocabulary development. Journal of Educational Psychology, 91, 3-19.
Miestamo, M. (2006). Implicational hierarchies and grammatical complexities. In G. Sampson,
D. Gil, & P. Trudgill (Eds.), Language complexity as an evolving variable. Oxford: Oxford
University Press.
Mitchell, T. (1997). Machine learning. Columbus, Ohio: McGraw Hill.
Mohri, M., Rostamizadeh, A., & Talwalkar, A. (2012). Foundations of machine learning
(adaptive computation and machine learning series). Cambridge, MA: MIT Press.
Muter, V., Hulme, C., Snowling, M. J., Stevenson, J. (2004). Phonemes, rimes, vocabulary, and
grammatical skills as foundations of early reading development: Evidence from a
longitudinal study. Developmental Psychology, 40, 665-681.
Early‐GradesTextComplexity
60
Nason, M., Emerson, S., & LeBlanc, M. (2004). CARTscans: A tool for visualizing complex
models. Journal of computational and graphical statistics, 13, 807-825.
National Governors Association (NGA) Center for Best Practices & Council of Chief State
School Officers (CCSSO). (2010). Common Core State Standards for English language
arts and literacy in history/social studies, science, and technical subjects. Washington,
DC: Authors. www.corestandards.org/assets/CCSSI_ELA%20Standards.pdf
Nelson, J., Perfetti, C., Liben, D., & Liben, M. (2011). Measures of text difficulty: Testing their
predictive value for grade levels and student performance. Technical Report to the
Gates Foundation.
www.ccsso.org/Documents/2012/Measures%20ofText%20Difficulty_final.2012.pdf
Nerbonne, J., & Heeringa, W. J. (2001). Computational comparison and classification of dialects.
Dialectologia et Geolinguistica, 9, 69-83.
Paivio, A., Yuille, J. C., & Madigan, S. A. (1968). Concreteness, imagery, and meaningfulness
values for 925 nouns. Journal of Experimental Psychology, 76(1, P. 2), 1-25.
Patton, M. (1990). Qualitative evaluation research methods. Beverly Hills, CA: Sage.
Pedregosa, F., Varoquaux, G., Gramfort, A., Michel, V., Thirion, B., Grisel, O., et al. (2011).
Scikit-learn: Machine learning in Python. Journal of Machine Learning Research, 12, 2825-
2830.
Prince, E. (1997). On the functions of the left-dislocation in English discourse. In A. Kamio
(Ed.), Directions in functional linguistics (pp. 117-144). Philadelphia and Amsterdam: John
Benjamins.
Reading Maturity Metric. (n.d.). http://www.readingmaturity.com/rmm-web/#/
REAP Readability Tool. (n.d.). www.reap.cs.cmu.edu/
Early‐GradesTextComplexity
61
Rescher, N. (1998). Complexity: A philosophical overview. New Brunswick and
London:Transaction Publishers.
Rosenblatt, L. M. (1938). Literature as exploration. New York: D. Appleton-Century.
Rosenblatt, L. (2005). Making meaning with texts: Selected essays. Portsmouth, NH:
Heinemann.
Rudrum, D. (2005). From narrative representation to narrative use: Towards the limits of
definition. Narrative, 13, 195-204.
Rumelhart, D. E. (1985). Toward an interactive model of reading. In H. Singer & R. B. Ruddell
(Eds.), Theoretical models and processes of reading (pp. 722-750). Newark, DE:
International Reading Association.
Sanders, N. C., & Chinn, S. B. (2009). Phonological distance measures. Journal of Quantitative
Linguistics, 16, 96-114.
Schwanenflugel, P. J., & Akin, C. E. (1994). Developmental trends in lexical decisions for
abstract and concrete words. Reading Research Quarterly, 29, 250-264.
Schatschneider, C., Fletcher, J. M., Francis, D. J., Carlson, C. D., & Foorman, B. R. (2004).
Kindergarten prediction of reading skills: A longitudinal comparative analysis. Journal of
Educational Psychology, 96, 265-282.
Sheehan, K. M., Kostin, I., Futagi, Y., & Flor, M. (2010, December). Generating automated text
complexity classifications that are aligned with targeted text complexity standards (ETS
RR-10-28). Princeton, NJ: Educational Testing Service.
Shanahan, T. Fisher, D., & Frey, N. (2012). The challenge of challenging text. Educational
Leadership, 69(6), 58-62.
Early‐GradesTextComplexity
62
Shin, J., Deno, S. L., & Espin, C. (2000). Technical adequacy of the maze task for curriculum-
based measurement of reading growth. The Journal of Special Education, 34, 164-172.
Simon, H. A. (1962). The architecture of complexity. Proceedings of the American Philosphical
Society, 106, 467-582.
Sleator, D., & Temperley, D. (1991, October). Parsing English with a Link Grammar (Carnegie
Mellon University Computer Science Technical Report CMU-CS-91-196). Pittsburgh:
Carnegie Mellon University.
Snow, C. (2002). Reading for understanding: Toward an R&D program in reading
comprehension. Santa Monica, CA: RAND Corporation.
Solso, R. L., Barbuto, P. F. Jr., & Juel, C. L. (1979). Methods & Designs: Bigram and trigram
frequencies and versatilities in the English language. Behavior Research Methods &
Instrumentation, 11, 475-484.
Stanovich, K. E. (1986). Matthew effects in reading: Some consequences of individual
differences in the acquisition of literacy. Reading Research Quarterly, 21, 360-406.
Steen, G. (1999). Genres of discourse and definition of literature. Discourse Processes, 28, 109-
120.
Stenner, A. J., Burdick, H., Sanford, E., & Burdick, D. (2006). How accurate are Lexile text
measures? Journal of Applied Measurement, 7, 307-322.
Strobl, C., Malley, J., & Tutz, G. (2009). An introduction to recursive partitioning: Rationale,
application, and characteristics of classification and regression trees, bagging, and random
forests. Psychological Methods, 14, 323-348.
Early‐GradesTextComplexity
63
Vadasy, P. F., Sanders, E. A., Peyton, J. A. (2005). Relative effectiveness of reading practice or
word-level instruction in supplemental tutoring: How text matters. Journal of Learning
Disabilities, 38, 364-382.
Vanderplas, J., & Connolly, A. (2009). Reducing the dimensionality of data: Locally linear
embedding of Sloan Galaxy Spectra. The Astronomical Journal, 138, 1365-1379.
van der Sluis, F., & van den Broek, E. L. (2010). Using complexity measures in information
retrieval. In Proceedings of the third symposium on information interaction in context (pp.
18-22). New Brunswick, N: ACM.
Wasserman, L. (in press). Rise of the machines. In L. Xihong, D. L. Banks, C. Genest, G.
Molenberghs, D. W. Scott, & J-L. Want (Eds.). Past, present and future of statistical
sicence. New York: Taylor and Francis.
Whaley, J. F. (1981). Readers’ expectations for story structures. Reading Research Quarterly,
17, 90-114.
Williamson, G. L. (2008). A text readability continuum for postsecondary readiness. Journal of
Advanced Academics, 19, 602-632.
Woolams, A. M. (2005). Imageability and ambiguity effects in speeded naming: Convergence
and divergence. Journal of Experimental Psychology: Learning, Memory, an dCognition,
31, 878-890.
Wright, B., & Stone, M. (1999). Measurement essentials (2nd ed.). Wilmington, DE: Wide Range
Incorporated.
Yarkoni, T., Balota, D., & Yap, M. (2008). Moving beyond Coltheart’s N: A new measure of
orthographic similarity. Psychonomic Bulletin & Review, 15, 971-979.
Early‐GradesTextComplexity
64
Zhang, Z., & Wang, J. (2006). MLLE: Modified locally linear embedding using multiple
weights. In Advances in neural information processing systems 19, Proceedings of the
twentieth annual conference on neural information processing systems, Vancouver. Trier,
Germany: DBLP (Database and Language Programming) at Universität Trier.
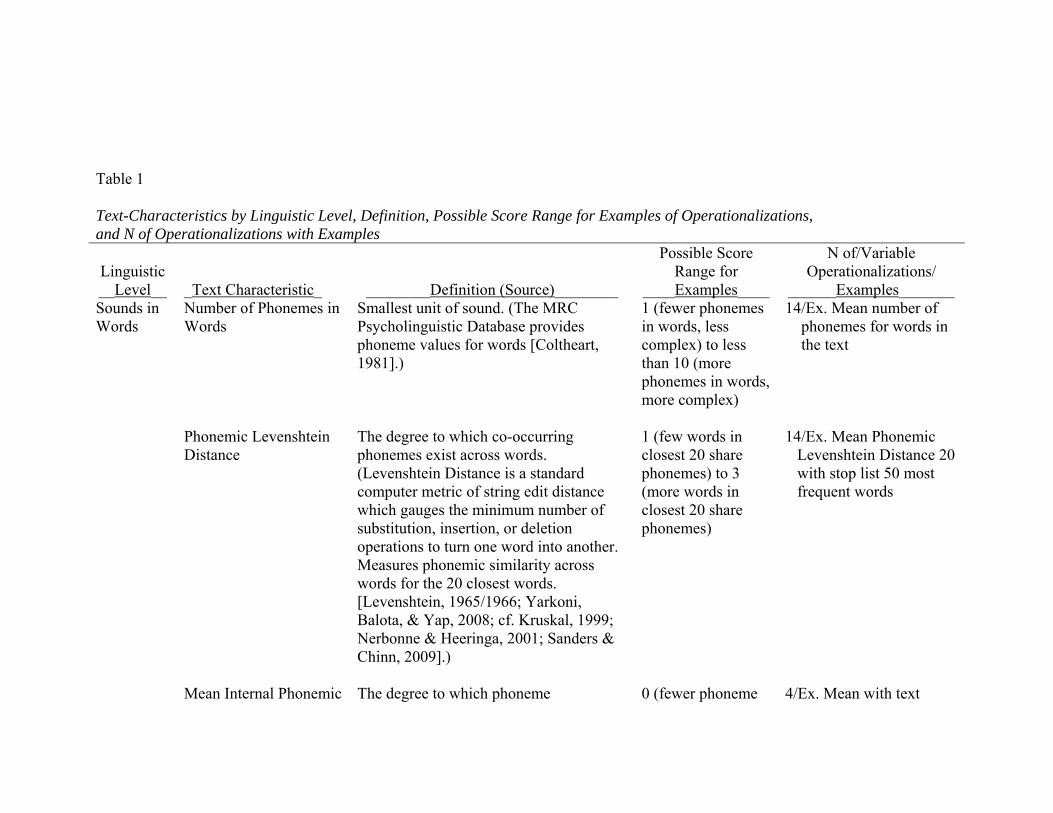
Table 1
Text-Characteristics by Linguistic Level, Definition, Possible Score Range for Examples of Operationalizations, and N of Operationalizations with Examples
Linguistic __Level__
_Text Characteristic_
________Definition (Source)________
Possible Score Range for
____Examples____
N of/Variable Operationalizations/
______Examples_______ Sounds in Words
Number of Phonemes in Words Phonemic Levenshtein Distance Mean Internal Phonemic
Smallest unit of sound. (The MRC Psycholinguistic Database provides phoneme values for words [Coltheart, 1981].) The degree to which co-occurring phonemes exist across words. (Levenshtein Distance is a standard computer metric of string edit distance which gauges the minimum number of substitution, insertion, or deletion operations to turn one word into another. Measures phonemic similarity across words for the 20 closest words. [Levenshtein, 1965/1966; Yarkoni, Balota, & Yap, 2008; cf. Kruskal, 1999; Nerbonne & Heeringa, 2001; Sanders & Chinn, 2009].) The degree to which phoneme
1 (fewer phonemes in words, less complex) to less than 10 (more phonemes in words, more complex) 1 (few words in closest 20 share phonemes) to 3 (more words in closest 20 share phonemes) 0 (fewer phoneme
14/Ex. Mean number of phonemes for words in the text 14/Ex. Mean Phonemic Levenshtein Distance 20 with stop list 50 most frequent words 4/Ex. Mean with text
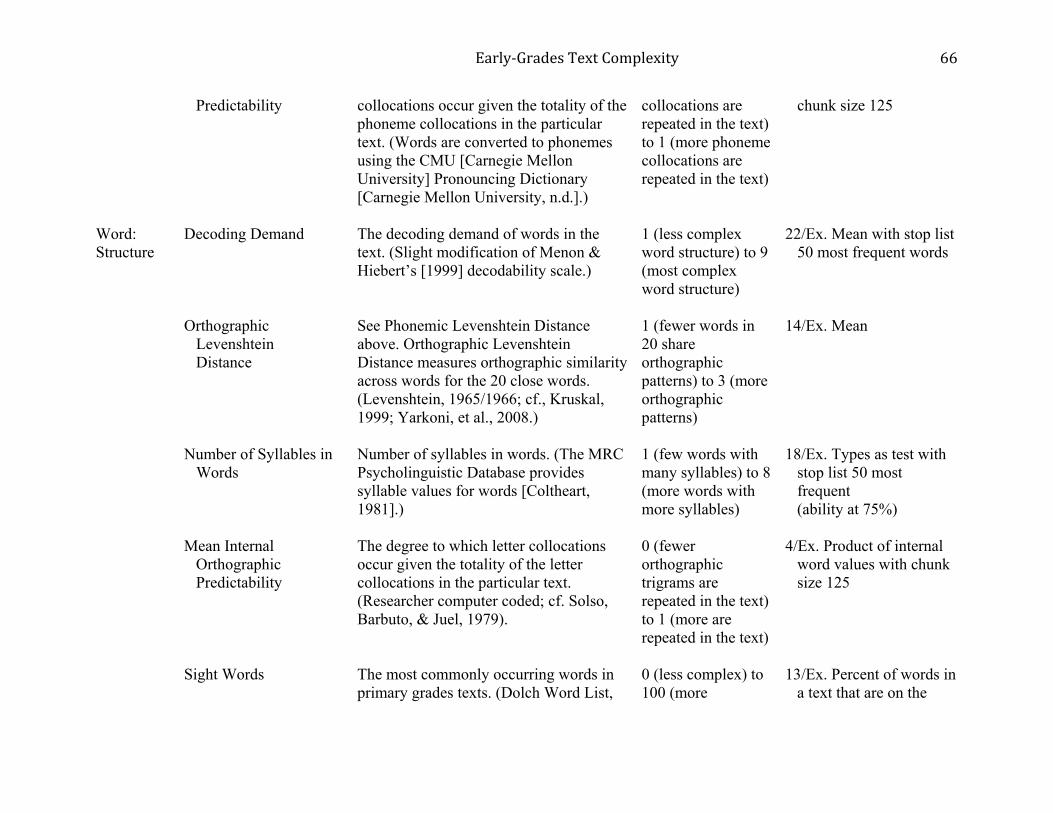
Early‐GradesTextComplexity 66
Predictability collocations occur given the totality of the phoneme collocations in the particular text. (Words are converted to phonemes using the CMU [Carnegie Mellon University] Pronouncing Dictionary [Carnegie Mellon University, n.d.].)
collocations are repeated in the text) to 1 (more phoneme collocations are repeated in the text)
chunk size 125
Word: Structure
Decoding Demand Orthographic Levenshtein Distance Number of Syllables in Words Mean Internal Orthographic Predictability Sight Words
The decoding demand of words in the text. (Slight modification of Menon & Hiebert’s [1999] decodability scale.) See Phonemic Levenshtein Distance above. Orthographic Levenshtein Distance measures orthographic similarity across words for the 20 close words. (Levenshtein, 1965/1966; cf., Kruskal, 1999; Yarkoni, et al., 2008.) Number of syllables in words. (The MRC Psycholinguistic Database provides syllable values for words [Coltheart, 1981].) The degree to which letter collocations occur given the totality of the letter collocations in the particular text. (Researcher computer coded; cf. Solso, Barbuto, & Juel, 1979). The most commonly occurring words in primary grades texts. (Dolch Word List,
1 (less complex word structure) to 9 (most complex word structure) 1 (fewer words in 20 share orthographic patterns) to 3 (more orthographic patterns) 1 (few words with many syllables) to 8 (more words with more syllables) 0 (fewer orthographic trigrams are repeated in the text) to 1 (more are repeated in the text) 0 (less complex) to 100 (more
22/Ex. Mean with stop list 50 most frequent words 14/Ex. Mean 18/Ex. Types as test with stop list 50 most frequent (ability at 75%) 4/Ex. Product of internal word values with chunk size 125 13/Ex. Percent of words in a text that are on the

Early‐GradesTextComplexity 67
n.d.; Fry Word List, n. d.)
complex) Dolch Preprimer list
Word: Meaning
Age of Acquisition Abstractness Word Rareness
Age at which a word’s meaning is first known. (Kuperman, Stadthagen-Gonzalez, & Brysbaert, 2012.) Degree to which the text contains words that reference general or complex concepts such as “honesty” and cannot be seen or imaged. (Paivio, Yuille, & Madigan, 1968, updated by Coltheart, 1981.) The inverse of the frequency with which a word appears in running text in a corpus of 1.39billion words from 93,000 kindergarten through university texts normalized to equate to the frequencies in the Carroll, Davies, & Richman frequency 5million word list. (MetaMetrics, n.d.b; Carroll, Davies, & Richman, 1971.)
1 to 25 in our study (lower means more of the words are known by younger readers and a higher score means fewer are known by younger readers) 0 (less abstract, less complex) to 700 (more abstract, more complex) .10 (less rare, less complex) to 6 (more rare, more complex)
13/Age of Acquisition types as test with stop list 50 most frequent words (ability at 50%) 20/Degree of Abstractness types as test with stop list 50 most frequent words (ability at 50%) 14/Word rareness types as test (ability at 90%)
Syntax: Within Sentence
Sentence Length
Number of characters, words, unique words, or phrases in a sentence. (Researcher computer coded.)
1 (fewer characters, words, unique words, or phrases) and above 1 (more characters, words,
6/Ex. Mean number of letters and spaces in sentences
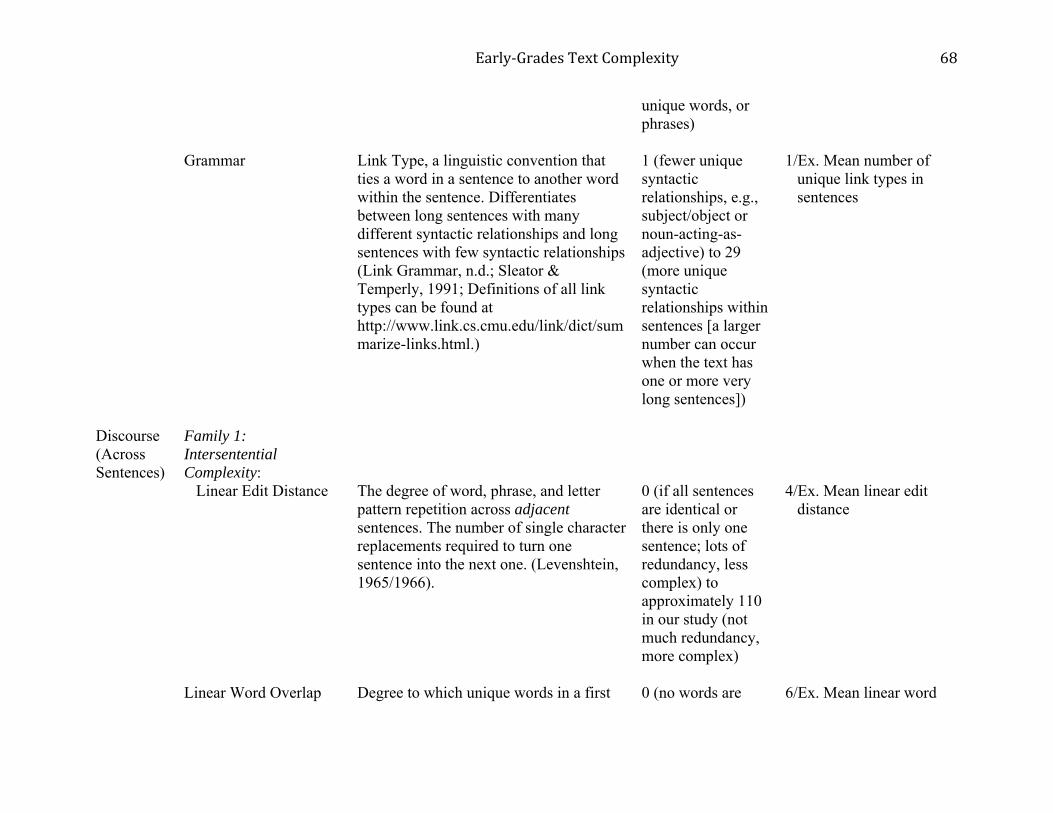
Early‐GradesTextComplexity 68
Grammar
Link Type, a linguistic convention that ties a word in a sentence to another word within the sentence. Differentiates between long sentences with many different syntactic relationships and long sentences with few syntactic relationships (Link Grammar, n.d.; Sleator & Temperly, 1991; Definitions of all link types can be found at http://www.link.cs.cmu.edu/link/dict/summarize-links.html.)
unique words, or phrases) 1 (fewer unique syntactic relationships, e.g., subject/object or noun-acting-as-adjective) to 29 (more unique syntactic relationships within sentences [a larger number can occur when the text has one or more very long sentences])
1/Ex. Mean number of unique link types in sentences
Discourse (Across Sentences)
Family 1: Intersentential Complexity: Linear Edit Distance
The degree of word, phrase, and letter pattern repetition across adjacent sentences. The number of single character replacements required to turn one sentence into the next one. (Levenshtein, 1965/1966).
0 (if all sentences are identical or there is only one sentence; lots of redundancy, less complex) to approximately 110 in our study (not much redundancy, more complex)
4/Ex. Mean linear edit distance
Linear Word Overlap Degree to which unique words in a first 0 (no words are 6/Ex. Mean linear word
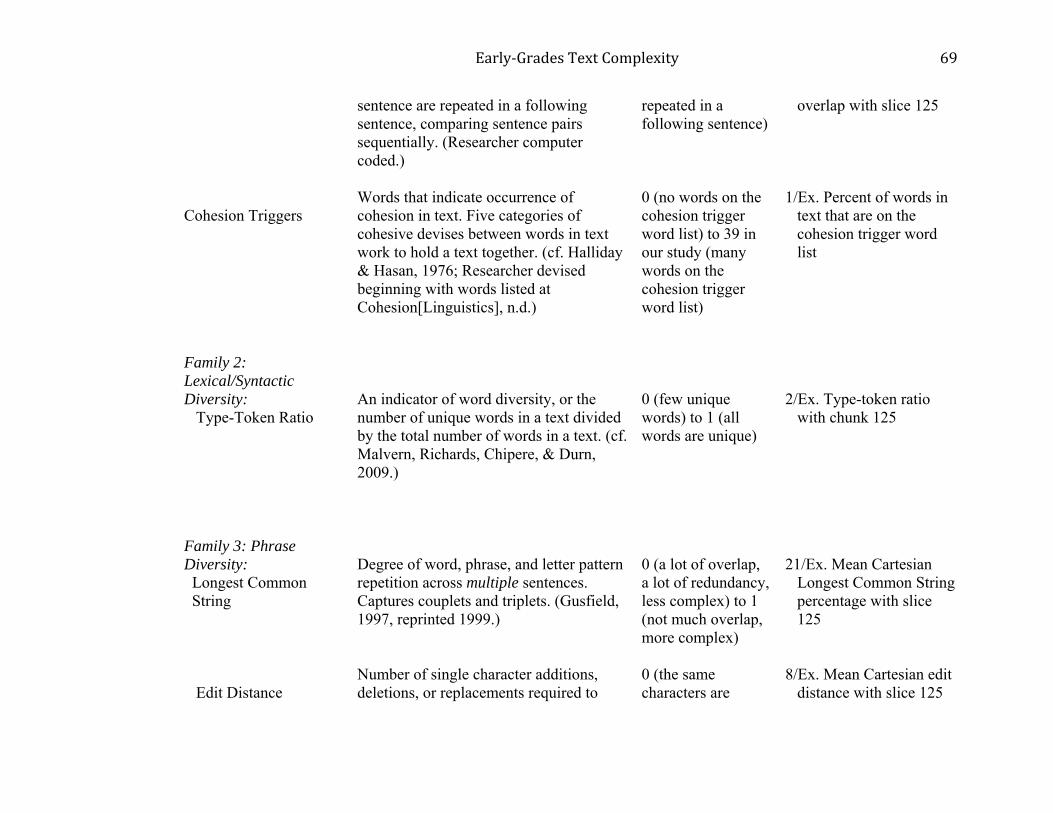
Early‐GradesTextComplexity 69
Cohesion Triggers Family 2: Lexical/Syntactic Diversity: Type-Token Ratio Family 3: Phrase Diversity: Longest Common String Edit Distance
sentence are repeated in a following sentence, comparing sentence pairs sequentially. (Researcher computer coded.) Words that indicate occurrence of cohesion in text. Five categories of cohesive devises between words in text work to hold a text together. (cf. Halliday & Hasan, 1976; Researcher devised beginning with words listed at Cohesion[Linguistics], n.d.) An indicator of word diversity, or the number of unique words in a text divided by the total number of words in a text. (cf. Malvern, Richards, Chipere, & Durn, 2009.) Degree of word, phrase, and letter pattern repetition across multiple sentences. Captures couplets and triplets. (Gusfield, 1997, reprinted 1999.) Number of single character additions, deletions, or replacements required to
repeated in a following sentence) 0 (no words on the cohesion trigger word list) to 39 in our study (many words on the cohesion trigger word list) 0 (few unique words) to 1 (all words are unique) 0 (a lot of overlap, a lot of redundancy, less complex) to 1 (not much overlap, more complex) 0 (the same characters are
overlap with slice 125 1/Ex. Percent of words in text that are on the cohesion trigger word list 2/Ex. Type-token ratio with chunk 125 21/Ex. Mean Cartesian Longest Common String percentage with slice 125 8/Ex. Mean Cartesian edit distance with slice 125

Early‐GradesTextComplexity 70
________________________________________________________________________________________________________
Cartesian Word Overlap Family 4: Text Density Information Load Family 5: Non-Compressibility Compression Ratio
turn one string (or sentence) into another. (Levenshtein, 1965/1966; Kruskal, 1999.) Degree to which unique words in a first sentence are repeated in a following sentence comparing all possible pairs in a 125 slice. (Researcher computer coded). Total information load in text. Denser texts have more information load, less redundancy, and are more complex. Also taps overlap of groups of co-occurring word repetition. (Researcher devised incorporating Latent Semantic Analysis [Deerwester, Dumais, Furnas, Landauer, Harshman, 1990; Landauer & Dumais, 1997].)) The degree to which information in the text can be compressed. Novel text is less compressible. (Burrows & Wheeler, 1994.)
repeated, high redundancy) to 127 in our study (very few characters are repeated, low redundancy) 4 (unique words not repeated much in a following sentence) to 6 (unique words repeated more) 0 (low density, low information load, lots of novel co-occurring word-group repetition) to 1 (denser text, higher information load, not as much novel co-occurring word-group repetition) 0 (more compressible, more redundancy, less complex) to 1 (less compressible)
4/Ex. Percentage of Mean Cartesian word overlap with slice 125 for part of speech 12/Normalized percent reduction of information load across sentences for 10 dimensions with slice 500 2/Ex. Compression ratio with chunk 125
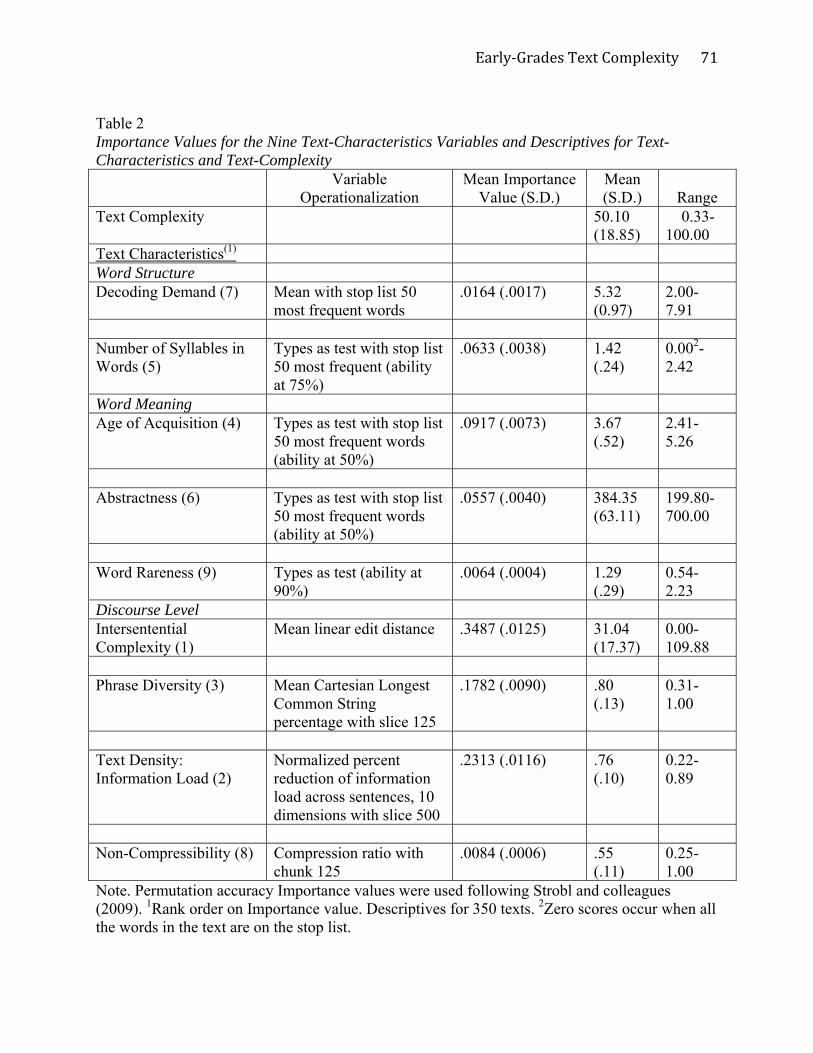
Early‐GradesTextComplexity
71
Table 2 Importance Values for the Nine Text-Characteristics Variables and Descriptives for Text-Characteristics and Text-Complexity Variable
Operationalization Mean Importance
Value (S.D.) Mean (S.D.)
Range
Text Complexity 50.10 (18.85)
0.33-100.00
Text Characteristics(1) Word Structure Decoding Demand (7) Mean with stop list 50
most frequent words .0164 (.0017) 5.32
(0.97) 2.00- 7.91
Number of Syllables in Words (5)
Types as test with stop list 50 most frequent (ability at 75%)
.0633 (.0038) 1.42 (.24)
0.002- 2.42
Word Meaning Age of Acquisition (4) Types as test with stop list
50 most frequent words (ability at 50%)
.0917 (.0073) 3.67 (.52)
2.41- 5.26
Abstractness (6) Types as test with stop list
50 most frequent words (ability at 50%)
.0557 (.0040) 384.35 (63.11)
199.80-700.00
Word Rareness (9) Types as test (ability at
90%) .0064 (.0004) 1.29
(.29) 0.54- 2.23
Discourse Level Intersentential Complexity (1)
Mean linear edit distance .3487 (.0125) 31.04 (17.37)
0.00-109.88
Phrase Diversity (3) Mean Cartesian Longest
Common String percentage with slice 125
.1782 (.0090) .80 (.13)
0.31- 1.00
Text Density: Information Load (2)
Normalized percent reduction of information load across sentences, 10 dimensions with slice 500
.2313 (.0116) .76 (.10)
0.22- 0.89
Non-Compressibility (8) Compression ratio with
chunk 125 .0084 (.0006) .55
(.11) 0.25- 1.00
Note. Permutation accuracy Importance values were used following Strobl and colleagues (2009). 1Rank order on Importance value. Descriptives for 350 texts. 2Zero scores occur when all the words in the text are on the stop list.
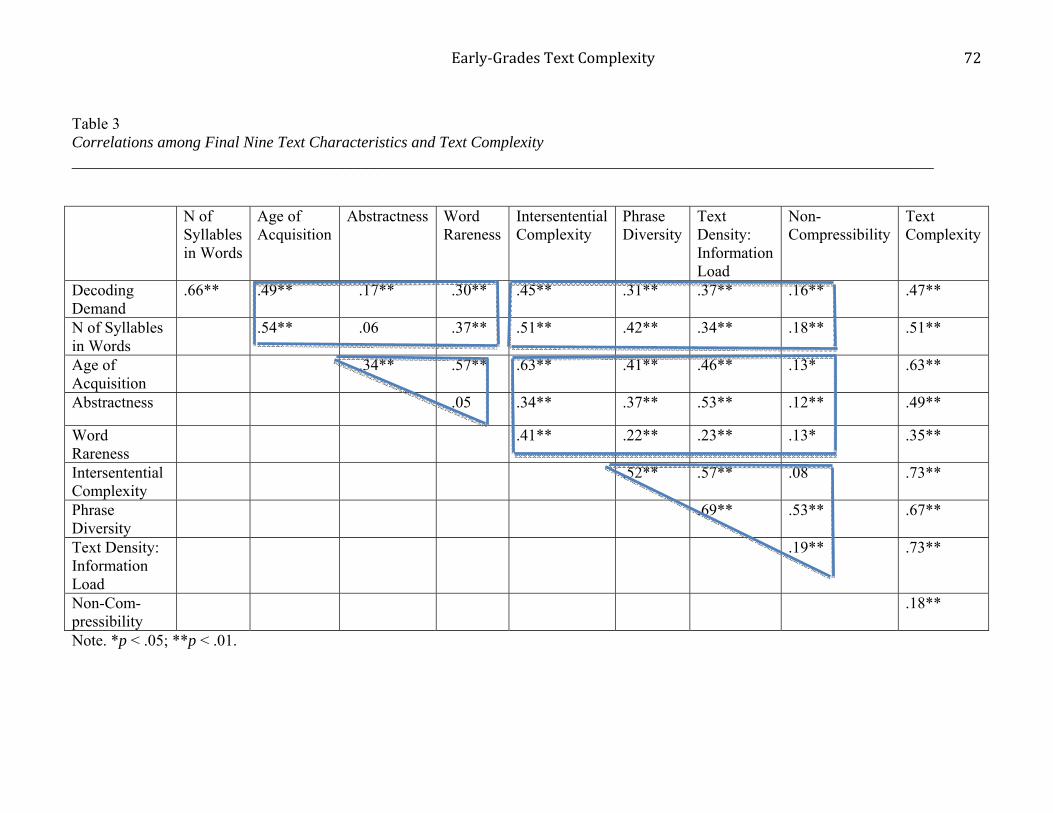
Early‐GradesTextComplexity
72
Table 3 Correlations among Final Nine Text Characteristics and Text Complexity ____________________________________________________________________________________________________________ N of
Syllables in Words
Age of Acquisition
Abstractness Word Rareness
Intersentential Complexity
Phrase Diversity
Text Density: Information Load
Non-Compressibility
Text Complexity
Decoding Demand
.66** .49** .17** .30** .45** .31** .37** .16** .47**
N of Syllables in Words
.54** .06 .37** .51** .42** .34** .18** .51**
Age of Acquisition
.34** .57** .63** .41** .46** .13* .63**
Abstractness .05 .34** .37** .53** .12** .49**
Word Rareness
.41** .22** .23** .13* .35**
Intersentential Complexity
.52** .57** .08 .73**
Phrase Diversity
.69** .53** .67**
Text Density: Information Load
.19** .73**
Non-Com-pressibility
.18**
Note. *p < .05; **p < .01.
Early‐GradesTextComplexity
73
NOTE to COPY EDITOR: Please make this figure black and white for both print and online. (No charge) Figure 1 Correlation of Predicted with Empirical Text-Complexity in Relation to Least Important Variable Deletion from Each of Three Models
Note. The top line represents correlational changes for teacher judgment, the middle line represents correlational changes for the combined teacher and student text-complexity assignments, and the bottom line represents correlational changes for the student text-complexity assignments. Also, out-of-bag correlation is used.

Early‐GradesTextComplexity
74
Figure 2 Trimming Variables: Relationship between Potential Correlational Threshold Cut-Points (X-Axis) with Model Correlation (Y-Axis) (Top Figure), and the Relationship between Potential Correlational Threshold Cut-Points (X-Axis) with Number of Remaining Variables (Y-Axis)
Note. Correlation is the correlation of the predicted with the empirical text-complexity measure.
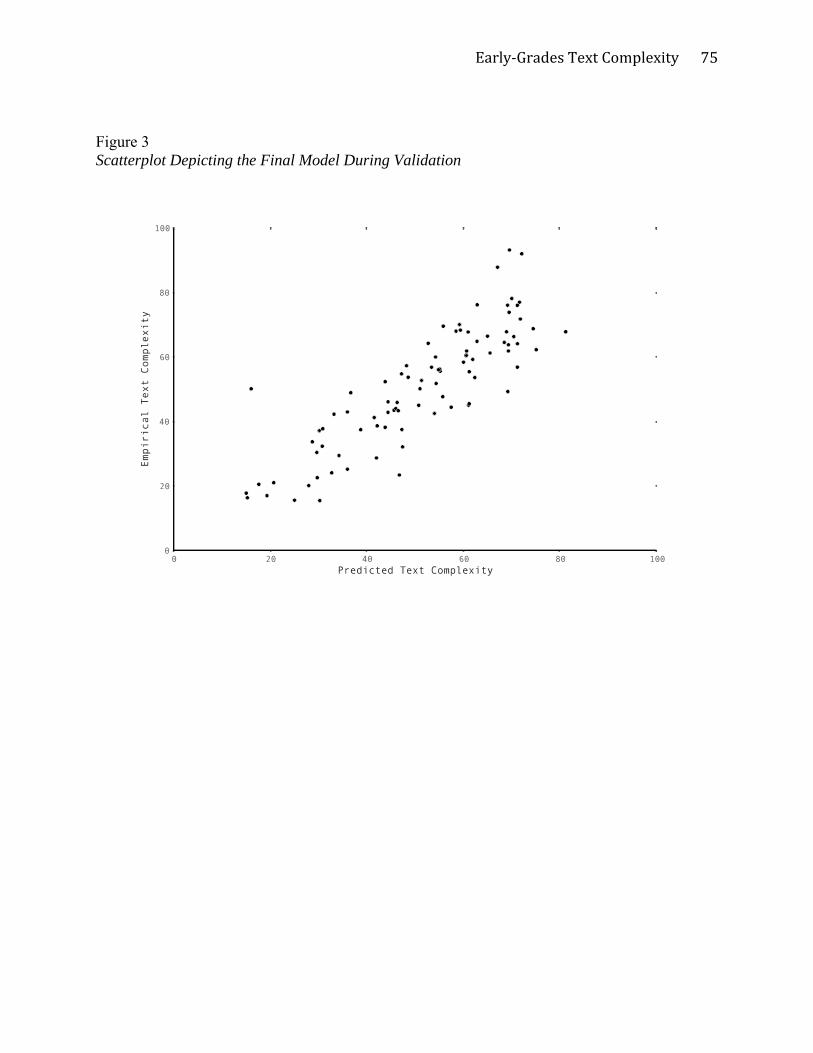
Early‐GradesTextComplexity
75
Figure 3 Scatterplot Depicting the Final Model During Validation
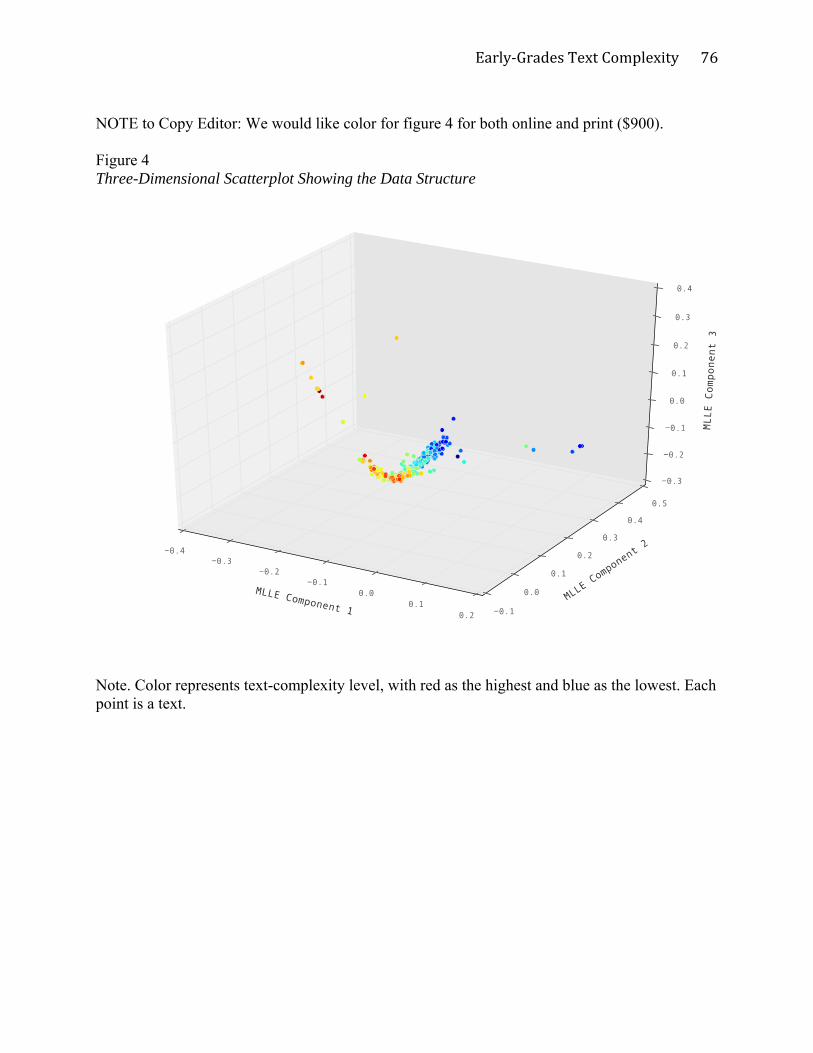
Early‐GradesTextComplexity
76
NOTE to Copy Editor: We would like color for figure 4 for both online and print ($900). Figure 4 Three-Dimensional Scatterplot Showing the Data Structure
Note. Color represents text-complexity level, with red as the highest and blue as the lowest. Each point is a text.
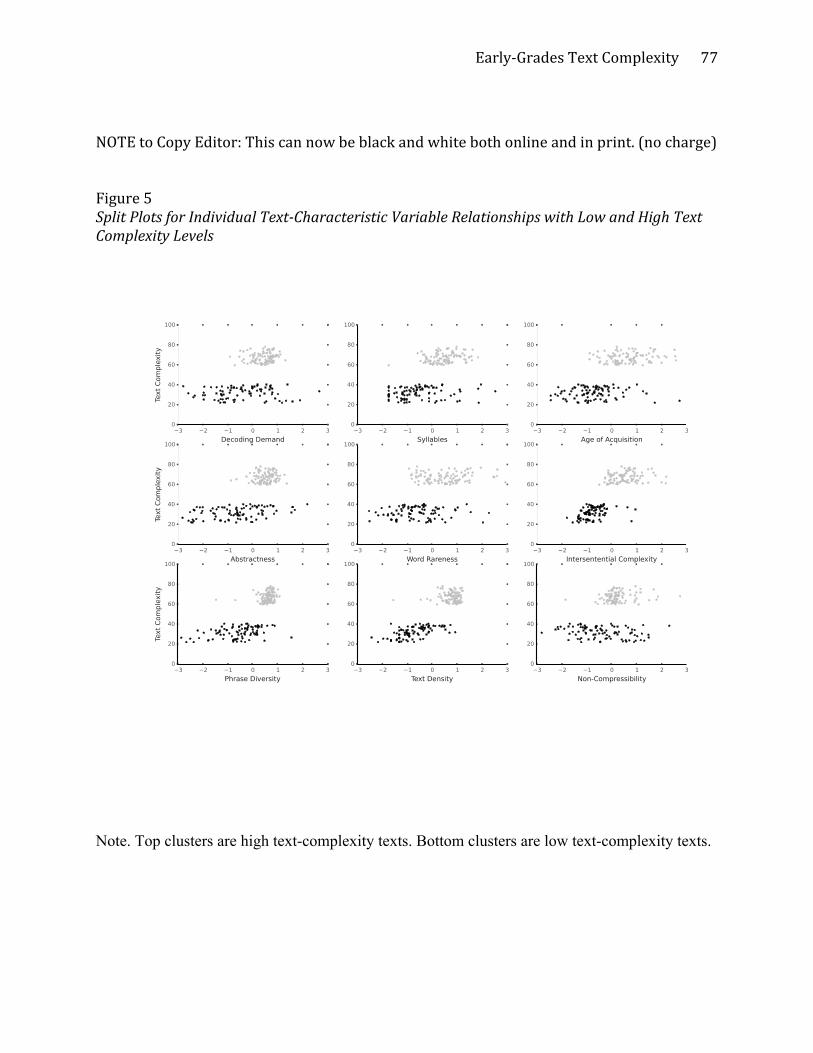
Early‐GradesTextComplexity
77
NOTEtoCopyEditor:Thiscannowbeblackandwhitebothonlineandinprint.(nocharge)Figure5SplitPlotsforIndividualText‐CharacteristicVariableRelationshipswithLowandHighTextComplexityLevels
Note. Top clusters are high text-complexity texts. Bottom clusters are low text-complexity texts.
Early‐GradesTextComplexity
78Figure 6 NOTE to Copy Editor: Please do black and white for both online and print (no charge) Single Regression Tree
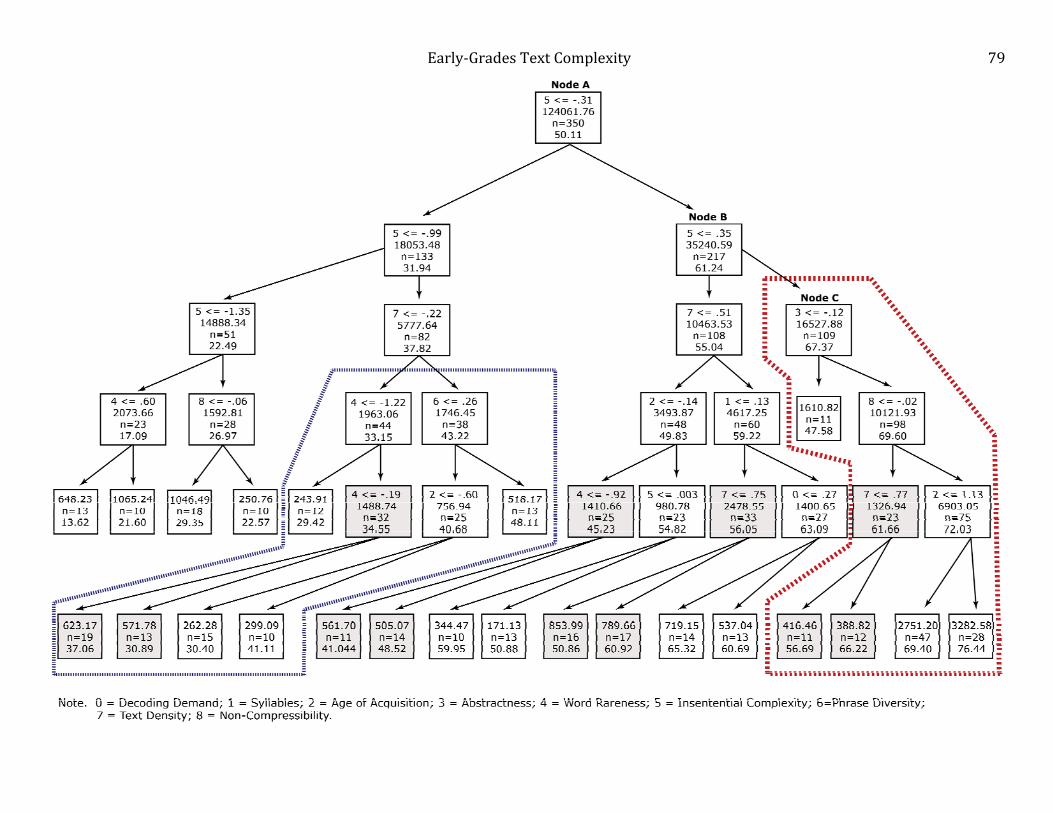
Early‐GradesTextComplexity
79
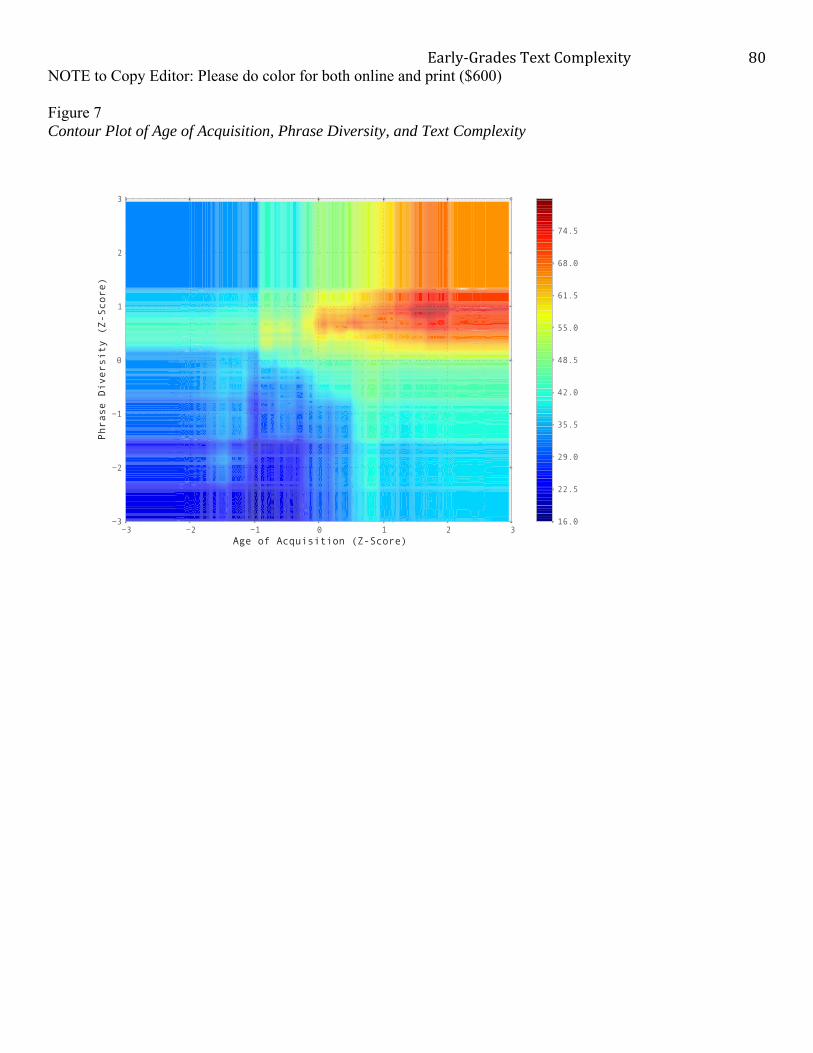
Early‐GradesTextComplexity
80NOTE to Copy Editor: Please do color for both online and print ($600) Figure 7 Contour Plot of Age of Acquisition, Phrase Diversity, and Text Complexity
Early‐GradesTextComplexity
81 Figure 8 Text-Characteristic Profiles by Text-Complexity Quintile Group.
Early‐GradesTextComplexity
82 Figure 9 Text-Characteristic Profiles according to Text-Complexity Level and Genre.
Note. The top two lines represent high text-complexity levels. The bottom two lines represent low text-complexity levels. Solid lines represent narrative texts, and dotted lines represent informational text.