important inventory terms
TRANSCRIPT

Asia Pacific Management Review (2004) 9(1), 1-22
1
Inventory management in distribution systems – case of an Indian FMCG company
Subrata Mitra∗ and A. K. Chatterjee∗
(received April 2003; revision received October 2003; accepted October 2003)
Abstract Managing inventory in distribution systems involves taking decisions on the quantity of
inventory to be placed at different stages so that a desired customer service level can be achieved at minimum cost. In this paper, we present the case of the distribution system of an Indian FMCG company, which despite having centralized control takes replenishment decisions based on local stock information. The objective of the study is to develop single period representative models based on installation stock and echelon stock, and show by simulation that had the company taken decisions based on system stock information, it would have saved money in terms of investment in inventory.
Keywords: Case study; Inventory; Distribution system; Installation stock; Echelon stock
1. Introduction Managing inventory in distribution systems involves taking decisions on
the quantity of inventory to be placed at different stages so that a desired customer service level can be achieved at minimum cost. If most of the in- ventory is placed at the lowest stage or the stage facing external demand, the customer service level improves; however, this is accompanied by an in- crease in the inventory carrying cost due to value addition at the lower stages. On the other hand, if most of the inventory is placed away from the lowest stage, the inventory carrying cost decreases, but at the same time the del- ivery lead time increases, leading to the deterioration of the customer service level. A trade-off between these two counteracting issues has to be made while taking decisions on the positioning and quantity of inventory in a dis- tribution system.
There are two types of control in a distribution system – centralized and decentralized. In a centralized control system, the decision maker at the hig- hest stage decides on how much to order and how to allocate the available inventory among the downstream locations based on an echelon stock policy, where echelon stock at a location is the stock at that location plus the stock ∗ Indian Institute of Management, Calcutta, Joka, Diamond Harbour Road, Kolkata 700104, India. Phone: +91-33-24678300, fax: +91-33-24678307, e-mail: [email protected]

Subrata Mitra and A. K. Chatterjee
2
(including in-transit) at all of its downstream locations [6]. The entire avail- able inventory can be allocated [7, 9, 10] or some inventory can be held back after shipping out most of it at the start of each order cycle, and shipped later in the cycle to balance the inventories at the downstream locations [15, 16]. A virtual allocation system was studied by Graves [12], where stock at the higher stage was reserved for certain downstream locations as demand oc- curred. One of the primary findings of the study was that a certain amount of inventory should be held at the higher stages, but most of the inventory should be located downstream. In fact, holding inventory at higher stages is meaningful if the inventory carrying cost is very low and/or the delivery lead times are negligible. Heijden et al. [14] discussed several allocation rules in multi-stage distribution systems.
In a decentralized control system, every location takes replenishment de- cisions on its own. The decisions can be taken based on either an echelon stock or an installation stock policy. Installation stock at a location refers to the stock at that location only. It has been mentioned in the literature [2, 3, 4] that in serial and assembly systems one can always find an echelon stock policy which is at least as good as an installation stock policy, but in distrib- ution systems the policies can outperform each other under different operat- ing conditions. One of the problems with an installation stock policy is that the demand distribution at every higher stage is to be derived. This can be avoided with an echelon stock policy, which needs only the end-item dem- and distribution. To overcome the problem of deriving the demand distribut- ions in an installation stock policy, several assumptions and approximations have been made in the literature [22, 26]. The problem can also be overcome by making available the end-item demand information at every location. This is done in the base stock policy where every location takes replenish- ment decisions based on the actual end-item demand, rather than the demand generated by downstream locations [13, 25]. The availability of the end-item demand information also reduces the so-called “bullwhip effect” [17]. Sev- eral authors have quantified the benefits of information sharing in decentral- ized multi-stage supply chains [11, 18, 19]. For a review of the centralized and decentralized planning models, refer to [8] and [1] respectively. More references can be found in [24].
Most of the literatures discussed so far deal with stationary demand. When demand becomes non-stationary, the analytical process becomes quite complicated in terms of the derivation of the policy parameters. Distribution Requirement Planning (DRP) followed in practice to manage inventory is essentially a deterministic process where uncertainty is taken care of by a

Subrata Mitra and A. K. Chatterjee
3
periodic revision of dispatch schedules. Most of the DRP systems are dec- entralized and based on an echelon stock policy. Very few DRP systems are centralized [24]. In this paper, we present the case of the dairy division of an Indian FMCG company whose distribution system is centralized, but replen- ishment decisions are taken based on local stock information only. The ob- jective of the study is to develop single period models based on an install- ation stock policy (representing the present distribution system) and an eche- lon stock policy (representing the ideal distribution system), and show by simulation that the company would have saved money in terms of invest- ment in inventory had it taken decisions based on an echelon stock policy.
The organization of the paper is as follows. Section 2 describes the dis- tribution system of the dairy division. The current ordering/inventory control policy is presented in Section 3, followed by a description of the system under study in Section 4. In Section 5, the simulation procedure is discussed and models used for simulation are developed. A discussion on the simulat- ion results is presented in Section 6. Section 7 concludes the paper.
2. Distribution system of the dairy division
Currently the company does not have a production facility for its dairy whitener and cheese products; instead it outsources its requirements from another dairy, and sells them through conventional distribution channels. The dairy has a contract with the company such that the company’s current requirements can be met within a short span of time. The various Stock Kee- ping Units (SKUs) are shipped from the factory to the Carrying and For- warding Agents (C&FAs), and from the C&FAs to the Authorized Whole- salers (A/Ws), which constitutes the primary sales of the company. The Au- thorized Wholesalers in turn sell the SKUs to retailers, independent whole- salers and institutions such as hotels and restaurants, which constitutes the secondary sales. The company takes care of the primary freight between the factory and the C&FAs as well as the secondary freight between the C&FAs and the A/Ws. The transportation systems for dairy whitener and cheese are different since cheese requires refrigerated transportation and needs cold storage at the C&FAs and A/Ws. Fig. 1 shows the distribution system of the dairy products.
The distribution network is divided into four regions. The headquarters of the eastern region is located in Calcutta. There are 8 C&FAs and around

Subrata Mitra and A. K. Chatterjee
4
Figure 1 Distribution System of the Dairy Products
185 A/Ws in this region. The biggest C&FA is located in Calcutta, which also acts as the “mother depot” in this region feeding other C&FAs having low sales volumes. The SKUs are shipped from the dairy to the Calcutta C& FA from where they are dispatched to other C&FAs in the region where the sales volumes of those SKUs do not justify direct shipment from the dairy.
From now on, the C&FAs and A/Ws will be referred to as “depots” and “distributors” respectively, as they are commonly called by the company pe- rsonnel.
3. Present ordering/inventory control policy
At the beginning of every month, the company makes a primary sales plan for each distributor, based on its secondary sales in the previous month and the current stock availability. The primary sales plans for all the distrib- utors are then translated into overall requirements for the month, and orders are placed with the dairy with dispatch schedules for various depots. The dairy operates with a three months’ rolling plan, and is capable of meeting the current requirements of the company. The average transportation time from the dairy to the Calcutta depot is 20 days. The depot ordering policy is as follows. Based on the primary sales plan and the availability of stock at the depot, the order quantity is calculated as follows: order quantity = prim- ary sales plan (including inter-depot transfers) – availability + desired clos- ing balance. For the Calcutta depot, the desired closing balance is 25 days’ planned sales volume. The distributors are also stocked in such a way that at the beginning of every month they have around 30 days’ inventory. The mo- vement of stock closely follows the consumers’ buying patterns, which peak during the first and last weeks of every month. For both primary and second-
Factory C&FA A/W Retailer Consumer
Wholesaler
Institution
Subrata Mitra and A. K. Chatterjee
5
ary sales, the last 10 days’ sales accounts for 40-45% of total sales in the month.
From the above discussion it is readily visible that the combined stock of the Calcutta depot and its distributors at the beginning of every month is equivalent to 55 days’ secondary sales. This brings out the fact that the dis- tributors are always carrying one month’s stock in excess. The company’s policy is to push stock to expedite secondary sales under inventory pressure. Though this fulfills the company’s target for primary sales for the month, it results in the distributors carrying excess stock.
4. Description of the system under study
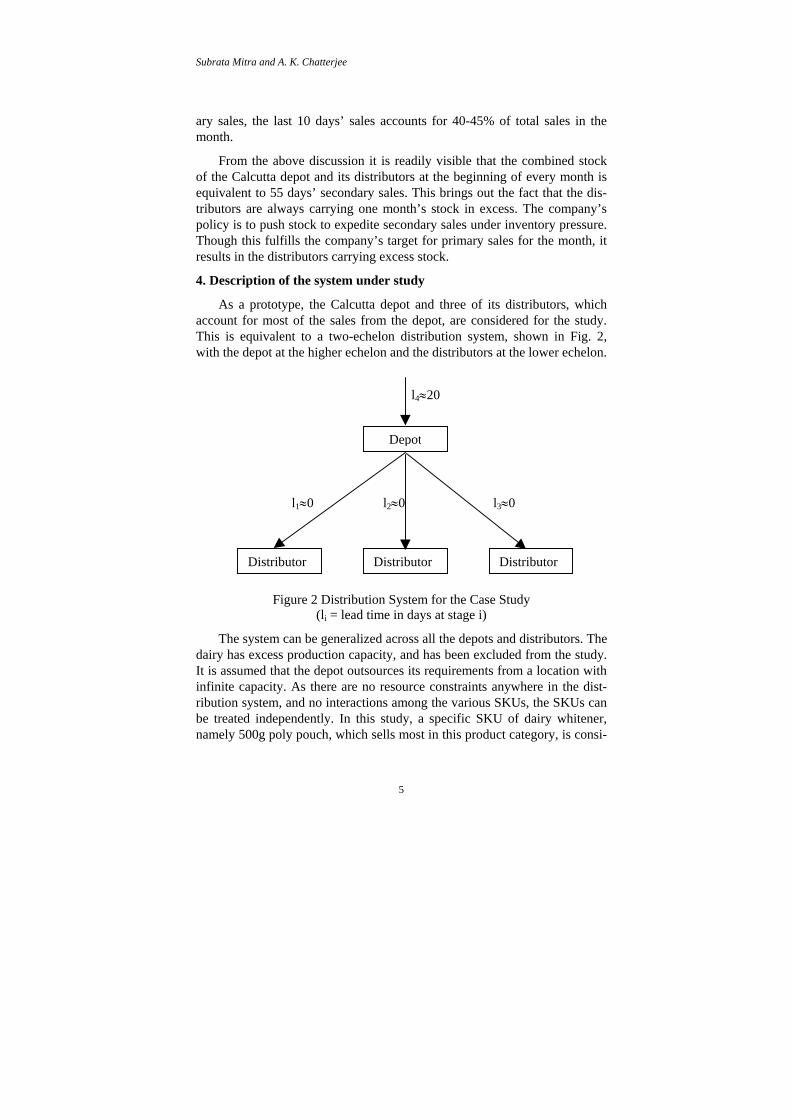
As a prototype, the Calcutta depot and three of its distributors, which account for most of the sales from the depot, are considered for the study. This is equivalent to a two-echelon distribution system, shown in Fig. 2, with the depot at the higher echelon and the distributors at the lower echelon.
l4≈20
l1≈0 l2≈0 l3≈0
Figure 2 Distribution System for the Case Study (li = lead time in days at stage i)
The system can be generalized across all the depots and distributors. The dairy has excess production capacity, and has been excluded from the study. It is assumed that the depot outsources its requirements from a location with infinite capacity. As there are no resource constraints anywhere in the dist- ribution system, and no interactions among the various SKUs, the SKUs can be treated independently. In this study, a specific SKU of dairy whitener, namely 500g poly pouch, which sells most in this product category, is consi-
Depot
Distributor Distributor Distributor

Subrata Mitra and A. K. Chatterjee
6
dered. The average transportation time for dairy whitener from the dairy to the depot, as mentioned earlier, is 20 days. The transportation time from the depot to the distributors is taken to be zero as the distributors are located in and around Calcutta, and the shipping time is a few hours.
The following assumptions have been made for modelling the system.
The unit of the SKU under consideration (500g poly pouch) is taken as one Card Board Box (CBB) containing 24 such SKUs, which is the form in which it is transported from the factory to the depot and then to the distributors before bulk breaking at the latter’s site.
Since the dairy division of the company began operation in the mid- dle of 1999, the monthly secondary sales data of the years 2000, 2001 and 2002 (January and February) are only available with the author, which are shown in Appendix 1. Since the available data are not ade- quate in number, sophisticated forecasting techniques such as Univar- iate Box-Jenkins (UBJ) or Auto Regressive Integrated Moving Aver- age (ARIMA) could not be used, which require at least fifty observat- ions for reliable forecasting [5, 21]. For the purpose of the study, an exponential smoothing forecasting model with trend correction [20, 23] is used. The forecast errors are assumed to be stationary and nor- mally distributed with mean zero and standard deviation equal to the Root Mean Square Error (RMSE). Hence the forecasted demand for any month can be assumed to be normally distributed with mean eq- ual to the forecasted value, and standard deviation as the RMSE.
The safety factor at the depot is assumed to be 2 (corresponding to 98% service level for normally distributed demand) in concurrence with the inventory norms followed by the company. Holding costs at the depot stage have not been considered; instead the performances of the models are compared with respect to the month-end residual in- ventories at the depot. On the other hand, positive holding and short- age costs are considered at the distributor stage, and the value of the safety factor is computed from the well-known single-period news- boy model formulation. The holding cost is the cost of capital tied up plus the cost of one unsold unit. Cost of one unsold unit is the cost per unit minus the salvage value, and is equal to zero since it is ass- umed that the inventory left over at the end of the month can be salvaged at least at its cost price. The shortage cost is the loss of pro- fit. The holding and shortage costs are assessed based on the month-
Subrata Mitra and A. K. Chatterjee
7
end inventories. Calculations for holding and shortage costs are sh- own in Appendix 2.
There is no fixed cost anywhere in the system. The cost of ordering is not significant.
Distributors’ demands for any month occur at the beginning of the month. In practice, there may be multiple deliveries. But since it is assumed that holding and shortage costs are assessed based on the month-end inventories, this will not affect the models’ validity. Dem- and unsatisfied at any stage is backordered.
The transportation time from the depot to the distributors, as mention- ed before, is assumed to be zero.
For each of the two models developed for the distribution system, the performance is examined by simulation for the period January 2001 to Feb- ruary 2002. The forecast for demand is made in each month based on the data available till that time. The monthly forecast for secondary sales from January 2001 to February 2002 is shown in Appendix 3. The performance of the models is measured in terms of the month-end depot inventories.
5. Simulation procedure and models used for simulation
The depot places order with the dairy at the beginning of every month, after knowing the actual secondary sales in the previous month and current availability of stock at the distributors’ ends. The deliveries are received aro- und 20th of the month. So, to cater to the requirements of the distributors before the deliveries are realized, the depot plans in such a way that it has 25-30 days’ stock at the beginning of every month. In the beginning of Jan- uary 2001, when the simulation starts, the initial stock levels at the distrib- utors are assumed to be equal to their corresponding safety values. The init- ial depot stock is set at a level equivalent to 20 days’ combined demand forecasts for the distributors. For each month, the order quantities for the distributors and the depot are computed depending on the model being used. The primary demand for the month is equal to the combined order quantity of the distributors. For secondary demands two cases are considered. In the first case, secondary demands are normal random variables with parameters obtained as per the assumption made in Section 4, and 1000 replications are performed to arrive at the expected month-end depot and distributor invent- ories. The second case is a specific instance where secondary demands are denoted by the actual secondary sales figures for the corresponding month. During the simulation, it is assumed that whenever a distributor faces short-

Subrata Mitra and A. K. Chatterjee
8
age, it is replenished with the shortage quantity by the depot instantly, pro- vided that the depot has sufficient stock for the month (opening balance plus receivables). Finally, the primary/secondary sales figures, and the month-end inventories for the depot and the distributors are computed. The flowchart of the simulation is shown in Figure 3.
Yes
No No
Yes
No
Yes
Figure 3 Flowchart of the Simulation
START
Initialization: Period = Initial period Distributor stock level = Safety stock Depot stock level = 20 days’ combined demand forecasts for the distributors
Compute order quantities for the distributors and the depot according to the respective models
Compute the expected ending inventories at the distributors and the depot as follows: expected ending inventory = beginning inventory + order quantity – demand
Consider the first distributor
Is the expected ending inventory < 0 ?
Secondary sales = Secondary demand Actual ending inv. = Exp. Ending inv.
Have all the distributors been considered ?
Is the exp. shortage qty. <= exp. ending inv. at
the depot ?
Secondary sales = Secondary demand + exp. ending inventory at the depot – shortage quantity Actual ending inventory = 0
Secondary sales = Secondary demand Actual ending inventory = 0
Consider the next distributor
B
A

Subrata Mitra and A. K. Chatterjee
9
No
Yes
Figure 3 Flowchart of the Simulation (Continued)
A
Is the exp. ending inv. at any of the distributor
< 0?
Is the exp. total shortage qty. at the distributors <=
exp. ending inv. at the depot ?
Primary sales = Primary demand + exp. ending inv. at the depot Actual ending inv. at the depot = 0
Primary sales = Primary demand + exp. total shortage qty. at the distributors Actual ending inv. at the depot = Exp. Ending inv. at the depot – exp. total shortage qty. at the distributors
Have all the periods been considered ?
Consider the next period
FINISH B
Yes
Yes
No
No Primary sales = Primary demand Actual ending inv. at the depot = Exp. ending inv. at the depot

Subrata Mitra and A. K. Chatterjee
10
The three distributors and the depot are represented by stage 1, stage 2, stage 3 and stage 4 respectively. Before discussing the models, the following symbols are noted.
µj Average demand in a period at stage j
σj Standard deviation of demand in a period at stage j
hj Holding cost per unit per period at stage j
pj Shortage cost per unit at stage j
lj Lead time at stage j
Sj Order-up-to level at stage j
kj Safety factor at stage j
xj Inventory position at stage j
T Review period (one month in this case)
Φ(⋅) Cumulative distribution function of the standard normal distribution
5.1 Single period myopic model based on installation inventory
In this model, the decision is taken for the current month without giving any weight to the expected sales patterns for the coming months. Also, the depot’s ordering decision is based on its own inventory, without taking into account the distributors’ inventory positions. The sequence of decisions that are taken at the depot and the distributor levels is as follows.
Step 1: For each distributor, find the order-up-to level from the follow- ing.
Sj = µ σjj
j jjl
Tk
lT
1 1+
+ + , where kj is obtained from the
well-known newsboy problem, Φ(kj) = p
p hj
j j+ for j = 1,2,3.
Step 2: For each distributor, find the order quantity, Sj-xj for j = 1,2,3.
Step 3: The depot order quantity is calculated as follows. Depot order quantity = total issues + desired closing balance – available inventory. Total issue quantity is the sum of the order quantities of the distributors. The de- sired closing balance is the average l4 days’ sales plus safety stock for l4 days.

Subrata Mitra and A. K. Chatterjee
11
For calculation of the safety stock, it is assumed that the variance of the combined order quantities of the distributors is equal to the sum of the vari- ances of the secondary sales forecasts. Hence the depot order quantity can be
written as ( ) ( )S xlT
S x klT
xj jj
j jj
jj
− + − + −= = =∑ ∑ ∑4
1
3
1
3
44 2
1
3
4σ , where
k4 is assumed to be 2.
It is to be noted here that the depot replenishments are based on primary demands from the distributors. This is exactly equivalent to the present ord- ering policy followed by the company, where primary demands are substit- uted by primary sales plans. The only difference is that in this model, the distributors are not carrying excess inventory, and the ordering decisions are made theoretically rather than intuitively.
5.2 Single period myopic model based on echelon inventory
This model differs from the previous model in that the replenishment de- cision for the depot is taken based on the secondary sales forecast and the depot echelon inventory level. The order-up-to level for the depot is set to cover (T+l4) days’ secondary sales. Hence the depot order quantity becomes
1 14
1
3
44 2
1
3
4+
+ + −
= =∑ ∑l
Tk
lT
xjj
jj
µ σ , where x4 is the depot echel-
on inventory. The order quantities for the distributors are calculated as be- fore.
6. Discussion of the simulation results
Table 1 shows the expected month-end depot installation inventories obtained by applying the two models described in the previous section when secondary demands are normal random variables. Fig. 4 shows the month-wise differences between the expected depot inventories obtained from the model based on echelon inventory and the same obtained from the model based on installation inventory.
For the specific instance where secondary demands are equal to the actual secondary sales, the simulation results are shown in Appendix 4 and Appendix 5. All the inventory figures in Appendix 5 are based on echelon stock except the figures in the last column, i.e., “Difference in depot inventory”, which are in terms of installation stock.

Subrata Mitra and A. K. Chatterjee
12
Table 1 Expected Month-end Depot Inventories: Simulation Results (Secondary Demands are Normal Random Variables)
Figure 4 Month-wise Differences in Expected Depot Inventories
(Secondary Demands are Normal Random Variables)
Month Expected depot inventory from the model based on
Installation inventory echelon inventory
Jan-01 237 226 Feb-01 276 240 Mar-01 286 253 Apr-01 266 254 May-01 309 278 Jun-01 209 267 Jul-01 272 271
Aug-01 291 279 Sep-01 290 283 Oct-01 263 275 Nov-01 289 278 Dec-01 240 267 Jan-02 313 284 Feb-02 334 313
-60
-40
-20
0
20
40
60
80
Jan-01
Feb-01
M ar-01
Apr-01
M ay-01
Jun-01
Jul-01 Aug-01
Sep-01
Oct-01
Nov-01
Dec-01
Jan-02
Feb-02
Month
Diff
. in
Dep
ot in
v.

Subrata Mitra and A. K. Chatterjee
13
-40
-20
0
20
40
60
80
Jan-01
Feb-01
M ar-01
Apr-01
M ay-01
Jun-01
Jul-01 Aug-01
Sep-01
Oct-01
Nov-01
Dec-01
Jan-02
Feb-02
Month
Diff
. in
Dep
ot in
v.
The column “Difference in depot inventory” in Appendix 5 shows the differences between the month-end depot inventories obtained from the mo- del based on echelon inventory (In this case, the month-end depot install- ation inventories are obtained by subtracting the total month-end distributor inventories from the month-end depot echelon inventories) and the same ob- tained from the model based on installation inventory. Fig. 5 shows graphic- ally the month-wise differences in depot inventories.
Figure 5 Month-wise Differences in Depot Inventories
(Secondary Demands are Equal to the Actual Secondary Sales)
It is seen from either Fig. 4 or Fig. 5 that in most of the months the model based on echelon inventory results in less depot inventory than the model based on installation inventory, the maximum reduction in investment in depot inventory being 12.41%. It is expected in real life when all the distributors and depots are taken into account, the total savings in monetary terms would be substantial. It is also observed that the less the combined distributor inventory at the beginning of a month, the more is the difference between the month-end depot inventories in favour of the model based on echelon inventory. The phenomenon is shown graphically in Fig. 6.
The phenomenon can be explained as follows. The opening stock levels at the distributors at the beginning of any month can be attributed to the gap between the forecast for demand and the actual secondary sales during the previous month. When the opening stock levels at the distributors are higher than their average levels due to overestimated demand in the previous month,

Subrata Mitra and A. K. Chatterjee
14
-40-20
020406080
0 20 40 60 80 100 120 140 160
Dist. total beg. inv.
Diff
. in
depo
t inv
.
Figure 6 Differences in Depot Inventories against Distributors’
Combined Inventory at the Beginning of the Month
the order quantities placed by the distributors with the depot to satisfy dem- and for the current month will be lower than their average values. In this sit- uation the model based on installation inventory, where the depot order qua- ntity depends on the combined order quantities for the distributors, may res- ult in less month-end depot inventory than the model based on echelon inv- entory, where the depot order quantity is computed from the forecasted dem- and distributions. From Appendix 1, we can see that the secondary sales sud- denly shot up in April 2001 due to a promotional campaign carried out by the company. In the next month sales plummeted, and subsequently at the beginning of June 2001, there are high stock levels at the distributors, which favours the model based on installation inventory as we can see from App- endix 5. In practice, the forecasts made by the sales personnel will be more accurate than the forecasts made by the exponential smoothing model used here, and it is expected that the more accurate the forecast, the better will be the performance of the model based on echelon inventory, as far as the mon- th-end depot inventories are concerned. This was confirmed by a paired-sa- mple signed-rank test at 5% level of significance excluding the data for June 2001 (Appendix 6).
7. Concluding remarks
In this paper, we have presented the case of an Indian FMCG company in the context of inventory management in its dairy products distribution sy- stem. Though the company has centralized control, i.e., it has full informa- tion on the actual secondary sales and stock positions of all the distributors, the ordering decisions taken by it are based on local stock information only. It has been shown in this paper through simulation that had the company

Subrata Mitra and A. K. Chatterjee
15
taken ordering decisions based on echelon inventory, it would have saved money in terms of investment in depot inventory.
References
[1]. Axsäter, S. 1993. Continuous review policies for multi-level invent- ory systems with stochastic demand. In: S.C. Graves et al. (Eds.). Logistics of Production and Inventory. Handbooks in OR & MS0, 4, Elsevier Science Publishers, Amsterdam 175-197.
[2]. ______, S. 1997. Simple evaluation of echelon stock (R, Q) policies for two-level inventory systems. IIE Transactions 29 661-669.
[3]. ______, S., K. Rosling. 1993. Installation vs. echelon stock policies for multilevel inventory control. Management Science 39 1274-1280.
[4]. ______, S., L. Juntti. 1997. Comparison of echelon stock and install- ation stock policies with policy adjusted order quantities. Internat- ional Journal of Production Economics 48 1-6.
[5]. Box, G. E. P., G. M. Jenkins. 1976. Time Series Analysis: Forecast- ing and Control. Holden-Day.
[6]. Clark, A. J., H. Scarf. 1960. Optimal policies for a multi-echelon inv- entory problem. Management Science 6 475-490.
[7]. Eppen, G., L. Schrage. 1981. Centralized ordering policies in a multi-warehouse system with lead times and random demand. In: L. Schw- arz (Eds). Multi-Level Production/Inventory Control Systems: Theory and Practice. Studies in Management Science, 16, Elsevier Science Publishers, Amsterdam 51-69.
[8]. Federgruen, A. 1993. Centralized planning models for multi-echelon inventory systems under uncertainty. In: S.C. Graves et al. (Eds.). Logistics of Production and Inventory. Handbooks in OR & MS, 4, Elsevier Science Publishers, Amsterdam 133-173.
[9]. ______, A., P. Zipkin. 1984a. Approximations of dynamic, multi- location production and inventory problems. Management Science 30(1) 69-84.
[10]. ______, A., P. Zipkin. 1984b. Allocation policies and cost approxim- ations for multilocation inventory systems. Naval Research Logistics Quarterly 31 97-129.
[11]. Gavirneni, S., R. Kapuscinski, S. Tayur. 1999. Value of information in capacitated supply chains. Management Science 45(1) 16-24.
[12]. Graves, S. C. 1996. A multiechelon inventory model with fixed re- plenishment intervals. Management Science 42(1) 1-18.
[13]. Hanssmann, F. 1962. Operations Research in Production and Inven- tory Control, John Wiley and Sons, New York.

Subrata Mitra and A. K. Chatterjee
16
[14]. Heijden, M. C., E. B. Diks, A. G. de Kok. 1997. Stock allocation in general multi-echelon distribution systems with (R, S) order-up-to policies. International Journal of Production Economics 49 157-174.
[15]. Jönsson, H., E. A. Silver. 1987a. Analysis of a two-echelon inventory control system with complete redistribution. Management Science 33(2) 215-227.
[16]. ______, H., E. A. Silver. 1987b. Stock allocation among a central warehouse and identical regional warehouses in a particular push in- ventory control system. International Journal of Production Research 25 191-205.
[17]. Lee, H., P. Padmanabhan, S. Whang. 1997. Information distortion in a supply chain: The bullwhip effect. Management Science 43(4) 546-558.
[18]. ______, H., S. Whang. 1999. Decentralized multi-echelon supply chains: Incentives and information. Management Science 45(5) 633-640.
[19]. ______, H., K. C. So, C. S. Tang. 2000. The value of information sharing in a two-level supply chain. Management Science 46(5) 626-643.
[20]. Narasimhan, S. L., D. W. McLeavey, P. J. Billington. 1997. Product- ion Planning and Inventory Control. 2nd ed. Prentice-Hall, New Delhi.
[21]. Pankratz, A. 1983. Forecasting with Univariate Box-Jenkins Models. John Wiley and Sons.
[22]. Rosenbaum, B. A. 1981. Service level relationships in a multi-echel- on inventory system. Management Science 27 926-945.
[23]. Shore, B. 1973. Operations Management. McGraw Hill. [24]. Silver, E. A., D. F. Pyke, R. Peterson. 1998. Inventory Management
and Production Planning and Scheduling. 3rd ed. John Wiley and Sons, New York.
[25]. Simpson, K. F. 1958. In-process inventories. Operations Research 6 863-873.
[26]. Tempelmeier, H. 1993. Safety stock allocation in a two-echelon distribution system. European Journal of Operations Research 63 96-117.

Subrata Mitra and A. K. Chatterjee
17
Appendices
Appendix 1
Monthly Secondary Sales Data for the Distributors (Jan 2000 – Feb 2002)
Month Distributor 1 Distributor 2 Distributor 3 Jan-00 85 111 - Feb-00 118 100 - Mar-00 102 104 - Apr-00 95 94 - May-00 79 121 12 Jun-00 38 53 15 Jul-00 103 76 35
Aug-00 142 106 31 Sep-00 86 100 27 Oct-00 85 107 36 Nov-00 109 111 33 Dec-00 105 129 66 Jan-01 155 129 58 Feb-01 130 144 52 Mar-01 131 123 57 Apr-01 181 135 108 May-01 57 130 55 Jun-01 98 140 76 Jul-01 111 151 76
Aug-01 118 163 59 Sep-01 125 139 56 Oct-01 123 151 68 Nov-01 100 136 53 Dec-01 127 180 67 Jan-02 112 229 74 Feb-02 116 211 69
Appendix 2
Calculations for holding and shortage costs
Cost per unit to the distributors for buying from the company = Rs. 1376 Revenue per unit for the distributors from selling to the retailers = Rs. 1431. Estimated cost of capital = Rs. 0.15 per Re per year Cost of capital per unit per month for the distributors = Rs. 0.15×1376× (1/12) = Rs. 17.2 Hence holding cost = 17.2 and shortage cost = 1431 - 1376 = 55

Subrata Mitra and A. K. Chatterjee
18
Appendix 3
Forecasts of Secondary Sales from January 2001 to February 2002
Forecast Forecast for made in Location the next month
Dec-00 Dist 1 97
Dist 2 122 Dist 3 49
Jan-01 Dist 1 105 Dist 2 130 Dist 3 55
Feb-01 Dist 1 109 Dist 2 143 Dist 3 57
Mar-01 Dist 1 113 Dist 2 136 Dist 3 60
Apr-01 Dist 1 123 Dist 2 139 Dist 3 83
May-01 Dist 1 115 Dist 2 137 Dist 3 77
Jun-01 Dist 1 114 Dist 2 142 Dist 3 80
Jul-01 Dist 1 114 Dist 2 150 Dist 3 83
Aug-01 Dist 1 115 Dist 2 162 Dist 3 77
Sep-01 Dist 1 118 Dist 2 153 Dist 3 71
Oct-01 Dist 1 119 Dist 2 155 Dist 3 72
Nov-01 Dist 1 117 Dist 2 146 Dist 3 66
Dec-01 Dist 1 119 Dist 2 168 Dist 3 68
Jan-02 Dist 1 119 Dist 2 209 Dist 3 71
Feb-02 Dist 1 120 Dist 2 220 Dist 3 72

Subrata Mitra and A. K. Chatterjee
19
Appendix 4
Single Period Myopic Model Based on Installation Inventory: Simulation Results (Secondary Demands are Equal to the Actual Secondary Sales)
Month Location Beginning inventory Order quantity
Actual Primary/Secondary
demand
Expected ending
inventory
Actual Primary/ Secondary sales
Actual ending
inventory
Jan-01 Dist 1 21 97 155 -37 155 0 Dist 2 16 122 129 9 129 9 Dist 3 12 49 58 3 58 3 Depot 179 336 268 246 305 209
Feb-01 Dist 1 0 126 130 -4 130 0
Dist 2 9 137 144 2 144 2 Dist 3 3 64 52 15 52 15 Depot 209 405 328 286 332 282
Mar-01 Dist 1 0 130 131 -1 131 0
Dist 2 2 157 123 36 123 36 Dist 3 15 54 57 12 57 12 Depot 282 355 342 295 343 294
Apr-01 Dist 1 0 134 181 -47 181 0
Dist 2 36 116 135 17 135 17 Dist 3 12 60 108 -36 108 0 Depot 294 292 311 275 394 192
May-01 Dist 1 0 144 57 87 57 87
Dist 2 17 138 130 25 130 25 Dist 3 0 95 55 40 55 40
192 505 378 319 378 319
Jun-01 Dist 1 87 49 98 38 98 38 Dist 2 25 128 140 13 140 13 Dist 3 40 49 76 13 76 13 Depot 319 127 227 219 227 219
Jul-01 Dist 1 38 97 111 24 111 24
Dist 2 13 145 151 7 151 7 Dist 3 13 79 76 16 76 16 Depot 219 385 322 282 322 282
Aug-01 Dist 1 24 111 118 17 118 17
Dist 2 7 159 163 3 163 3 Dist 3 16 79 59 36 59 36 Depot 282 369 350 301 350 301
Sep-01 Dist 1 17 119 125 11 125 11
Dist 2 3 175 139 39 139 39 Dist 3 36 53 56 33 56 33 Depot 301 346 348 299 348 299
Oct-01 Dist 1 11 128 123 16 123 16
Dist 2 39 130 151 18 151 18 Dist 3 33 50 68 15 68 15 Depot 299 283 309 273 309 273
Nov-01 Dist 1 16 124 100 40 100 40
Dist 2 18 153 136 35 136 35 Dist 3 15 69 53 31 53 31 Depot 273 373 347 299 347 299
Dec-01 Dist 1 40 98 127 11 127 11
Dist 2 35 127 180 -18 180 0 Dist 3 31 47 67 11 67 11 Depot 299 223 273 249 291 231
Jan-02 Dist 1 11 129 112 28 112 28
Dist 2 0 184 229 -45 229 0 Dist 3 11 69 74 6 74 6 Depot 231 475 383 323 428 278
Feb-02 Dist 1 28 112 116 24 116 24
Dist 2 0 225 211 14 211 14 Dist 3 6 77 69 14 69 14 Depot 278 481 415 344 415 344

Subrata Mitra and A. K. Chatterjee
20
Appendix 5
Single Period Myopic Model Based on Echelon Inventory: Simulation Results (Secondary Demands are Equal to the Actual Secondary Sales)
Month Location Beginning inventory Order quantity
Actual Primary/Secondary
demand
Expected ending
inventory
Actual Primary/Secondary
sales
Actual ending
inventory
Difference in depot
inventory*
Jan-01 Dist 1 21 97 155 -37 155 0 Dist 2 16 122 129 9 129 9 Dist 3 12 49 58 3 58 3 Depot 228 326 269 212 306 212 -9
Feb-01 Dist 1 0 126 130 -4 130 0 Dist 2 9 137 144 2 144 2 Dist 3 3 64 52 15 52 15 Depot 212 378 328 264 332 264 -35
Mar-01 Dist 1 0 130 131 -1 131 0 Dist 2 2 157 123 36 123 36 Dist 3 15 54 57 12 57 12 Depot 264 358 342 311 343 311 -31
Apr-01 Dist 1 0 134 181 -47 181 0 Dist 2 36 116 135 17 135 17 Dist 3 12 60 108 -36 108 0 Depot 311 311 311 198 394 198 -11
May-01 Dist 1 0 144 57 87 57 87 Dist 2 17 138 130 25 130 25 Dist 3 0 95 55 40 55 40 198 484 378 440 378 440 -31
Jun-01 Dist 1 87 49 98 38 98 38 Dist 2 25 128 140 13 140 13 Dist 3 40 49 76 13 76 13 Depot 440 215 227 341 227 341 58
Jul-01 Dist 1 38 97 111 24 111 24 Dist 2 13 145 151 7 151 7 Dist 3 13 79 76 16 76 16 Depot 341 326 322 329 322 329 0
Aug-01 Dist 1 24 111 118 17 118 17 Dist 2 7 159 163 3 163 3 Dist 3 16 79 59 36 59 36 Depot 329 356 350 345 350 345 -12
Sep-01 Dist 1 17 119 125 11 125 11 Dist 2 3 175 139 39 139 39 Dist 3 36 53 56 33 56 33 Depot 345 352 348 377 348 377 -5
Oct-01 Dist 1 11 128 123 16 123 16 Dist 2 39 130 151 18 151 18 Dist 3 33 50 68 15 68 15 Depot 377 300 309 335 309 335 13
Nov-01 Dist 1 16 124 100 40 100 40 Dist 2 18 153 136 35 136 35 Dist 3 15 69 53 31 53 31 Depot 335 349 347 395 347 395 -10
Dec-01 Dist 1 40 98 127 11 127 11 Dist 2 35 127 180 -18 180 0 Dist 3 31 47 67 11 67 11 Depot 395 260 273 281 291 281 28
Jan-02 Dist 1 11 129 112 28 112 28 Dist 2 0 184 229 -45 229 0 Dist 3 11 69 74 6 74 6 Depot 281 418 383 284 428 284 -28
Feb-02 Dist 1 28 112 116 24 116 24 Dist 2 0 225 211 14 211 14 Dist 3 6 77 69 14 69 14 Depot 284 488 415 376 415 376 -20
*Difference in depot inventory = (depot inventory based on echelon stock – total distributors’ inventory) – depot inventory based on installation stock

Subrata Mitra and A. K. Chatterjee
21
Appendix 6
Paired-sample Wilcoxon signed-rank test to ascertain if there is any signif- icant difference between the simulation results of the models based on insta- llation inventory and echelon inventory
As required by the test, it is assumed that the pair-wise differences come from continuous distributions (not necessarily the same) that are symmetric about zero.
As noted, we are excluding the data for June 2001. The data for July 2001 is also being excluded since the difference in depot inventory is zero. Hence we have 12 data points corresponding to 12 months. The differences in depot inventories and their signed ranks are shown in Table A6. DIinst and DIech denote the month-end depot inventories based on installation stock and echelon stock respectively.
Table A6 Differences in Depot Inventories and Their Signed Ranks
Month DIinst – DIech Signed rank Jan-01 9 +2 Feb-01 35 +12 Mar-01 31 +10.5 Apr-01 11 +4 May-01 31 +10.5 Aug-01 12 +5 Sep-01 5 +1 Oct-01 -13 -6 Nov-01 10 +3 Dec-01 -28 -8.5 Jan-02 28 +8.5 Feb-02 20 +7
From the above table, it is found that T+ = 63.5 and T- = 14.5. Given n as
the sample size, the expectation and variance of T, which is approximated by a normal distribution, are calculated from the following formula.
E Tn n
Var Tn n n
( )( )
( )( )( )
.
=+
=
=+ +
=
14
39
1 2 124
162 5

Subrata Mitra and A. K. Chatterjee
22
The null hypothesis is stated as θ (median of the differences) = 0 against the alternative hypothesis θ > 0. The one-sided level of significance, α, is taken as 0.05. The criterion for rejecting the null hypothesis is that the value of T at 0.05 level of significance, T0.05, must be greater than or equal to T-. The value of T0.05 is calculated as follows.
T E TVar T
orT
or T
0 05
0 05
0 05
1645
39162 5
1645
18 03
.
.
.
( )( )
.
..
.
−= −
−= −
=
Since T0.05 > T-, the null hypothesis must be rejected, i.e., it can be concluded that there is a significant difference between the methods at 5% level of significance.