importance of nutritional monitoring with data · •defaulted: unknown ... •support facility...
TRANSCRIPT
Importance of Nutritional Monitoring with Data
CDC Symposium
Paediatric Best Practices
Pretoria 2017 Shuaib Kauchali
National Department of Health

Epidemiologic context
• Antenatal HIV prevalence among pregnant women 30% • Stunting U5 27% • Wasting U5 3-5% • Low birth weight rate 15% • Exclusive breastfeeding rate among infants U6mo 32%
(from 8%) • U5MR 56 per 1000 • U1MR 40 per 1000 • NMR 12 per 1000 • Institutional maternal mortality ratio 120 per 100,000 • PMTCT <2% at 6-10 weeks (?18 months)

What is the size of problem: wasting and stunting
5

What is the size of problem: wasting and stunting
6
SADHS 2016
Facts
• Malnutrition happens! • Special populations
• infants of HIV infected mothers • Young mothers (teenagers, scholars, and unplanned pregnancies)
• Growth faltering occurs during the most vulnerable period of life • From conception to birth (intrauterine) • Birth to 1 year • 1 year to 2 years • Beyond 2 years

Nutritional specific interventions to end preventable deaths and improve growth and development among U5 children • Breastfeeding
• Complementary feeding
• Supplementary feeding for severe growth faltering and MAM
• Therapeutic feeding for SAM
• WASH
• EPI
• Stimulation and brain growth
• Micronutrient supplementation
Prompt treatment of inter-current illnesses and infections

Source: Omoni et al (ZVITAMBO study) The Pediatric Infectious Disease Journal Volume 36, Number 9, September 2017

Weight faltering, rapid weight loss and acute malnutrition…”the journey”
Image courtesy of Prof Ute Feucht Rev: Sept 2016, S Kauchali 10

Public health challenges • Delayed active case detection
• Acute malnutrition is a process and starts with growth (weight) faltering
• Early case detection • Not growing well
• Slow growth • Static growth • Losing weight
• MAM • SAM
• Delayed entry into supplementary and therapeutic feeding plans alongside the medical treatment of the underlying cause
Knowledge-Skills-< Attitude >-Practice Gap

How big is this problem?
• Active case detection
• SAM incidence rate (reported new SAM cases in the
public health system) 21,000
• Estimated incidence using UNICEF formula 145,000 new cases per annum*
• Only 14.5% of U5 children in the PHC are detected and reported in the DHIS
• 85.5% are not
• So where are the rest?
* UNICEF Global Estimate of SAM (2013), as reported in the NutriDASH South Africa Report 2017
Number receiving inpatient care treatment • Number of new SAM cases reported in the PHC
system: 21,000
• Number admitted to the inpatient units: 15,000
6000 SAM cases are not receiving care in the inpatient units
Are there receiving care in the outpatient units (PHC, Hospital OPD, Dietician OPD, etc)???
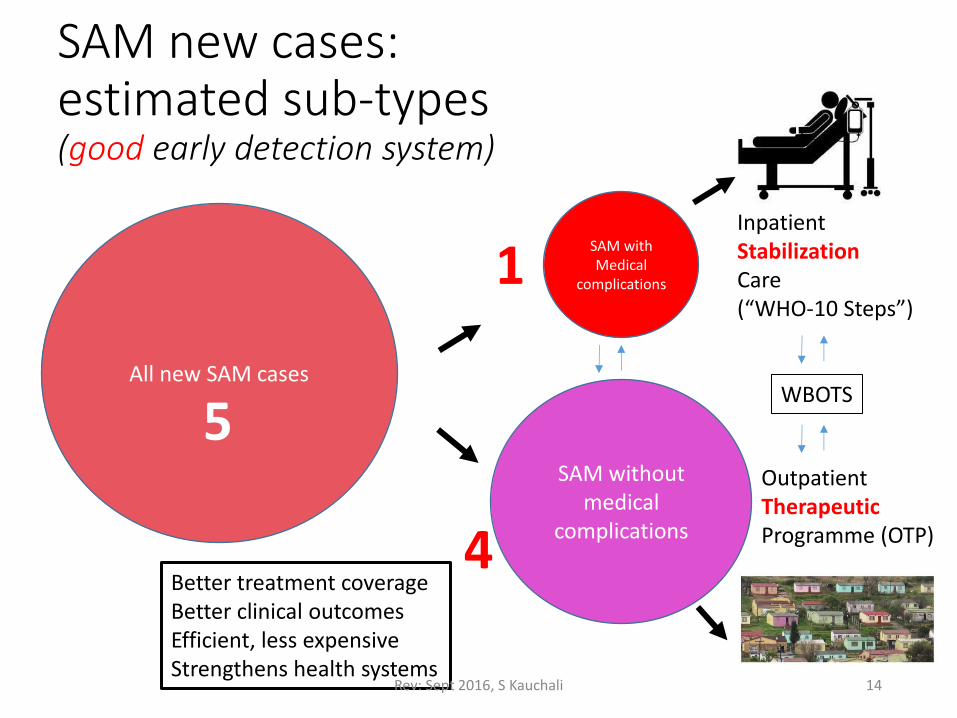
SAM new cases: estimated sub-types (good early detection system)
14
All new SAM cases
SAM with Medical
complications
SAM without medical
complications
1
4
5
Inpatient Stabilization Care (“WHO-10 Steps”)
Outpatient Therapeutic Programme (OTP)
Better treatment coverage Better clinical outcomes Efficient, less expensive Strengthens health systems
WBOTS
Rev: Sept 2016, S Kauchali

SAM new cases: estimated sub-types (poor early detection system-current South African setup)
15
All new SAM cases
SAM with Medical complications
SAM without medical
complications
2
2
5
Inpatient Stabilization Care (“WHO-10 Steps”)
Poor treatment coverage Poor clinical outcomes Expensive, ‘hospi-centric’ Undermines health system strengthening
??? Lost in system
1 Outpatient dept Dietician Hospital-based
?WBOTS
Rev: Sept 2016, S Kauchali

Outcome monitoring Number of cases that… • Died in the public health system:
• 1198 only inpatient units
• ?? Outpatient units (home, etc)
• Cured from SAM: unknown
• Defaulted: unknown
• Non-response: unknown
It takes 4-5 months to rehabilitate a child with SAM

Evolution of programme: early
New cases detected at
Hosp Home PHC

Evolution of programme: Matured
New cases detected at
Hosp Home PHC

So how do we solve this problem?

How many case cohort management systems do you know are currently in place in public health system? • TB
• ART
• PMTCT
• EPI
• How about Growth Monitoring and Promotion (RTHB) and Management of Acute Malnutrition?
Cinderella

Whatever happened to “find, treat and cure” malnutrition
21

Maximum Duration of treatment in programme settings (time to recovery)
• HIV life-long
• TB 6-12 months
• Not growing well (NAM at risk): • Static weight or Losing weight: 2 weeks for rapid catch up growth, plus
additional 2 weeks to sustain weight trajectory • Slow weight gain: 1 week to regain trajectory weight gain, plus
additional 1 week to sustain weight trajectory
• MAM 42 days for rapid catch-up growth, plus additional 4 weeks to sustain weight trajectory
• SAM 60 days for rapid catch-up growth, plus additional 4 weeks to sustain weight trajectory

Case Cohort Management System
People living with:
Not growing well MAM SAM
Cured/Recovered
Died
Defaulted
Non-response
New cases incidence
Prevalence
Outcomes

WHO Updated Guidelines 2013 and tools developed

Reporting tools (example)
Source: Michael Golden et al. 2012 IMAM Protocol

Process mapping-linking NACS with birth cohort:
HEI (H+/H+ dyad) HEU (H+/H- dyad) H-/H- dyad
ANC pregnant women H+ and H-
Infant
Mother

Service stations to link NACS with HIV routines • ANC services (pregnant and lactating women, outpatient)
• Labour and Delivery
• Post-natal services up to 6 weeks (inpatient, outpatient)
• Under 5 Clinics (IMCI and Well-baby) (outpatient)
• PMTCT follow-up screening and care (outpatient)
• ART services (outpatient)
• TB Treatment services (outpatient)
• Inpatient care units for sick malnourished cases • Neonatal units • Children units • Adults • Pregnant/Lactating women (maternity units)

Recording, Reporting, Reviewing and Responding
Recording
Reporting
Reviewing
Responding
Reforming

Recording
• Support facility client flow and care plans
• Use your ART registers to record case types and treatment plans
• Patient case records: C-A-D-F-B • Growth charts in the patient records • Rate of weight gain charts when on supplements
• Update the RTHB
• Setup the longitudinal cohort management and tracking systems for all ART cases, PMTCT cases and TB cases PLUS all cases who are malnourished (RTHB cases).
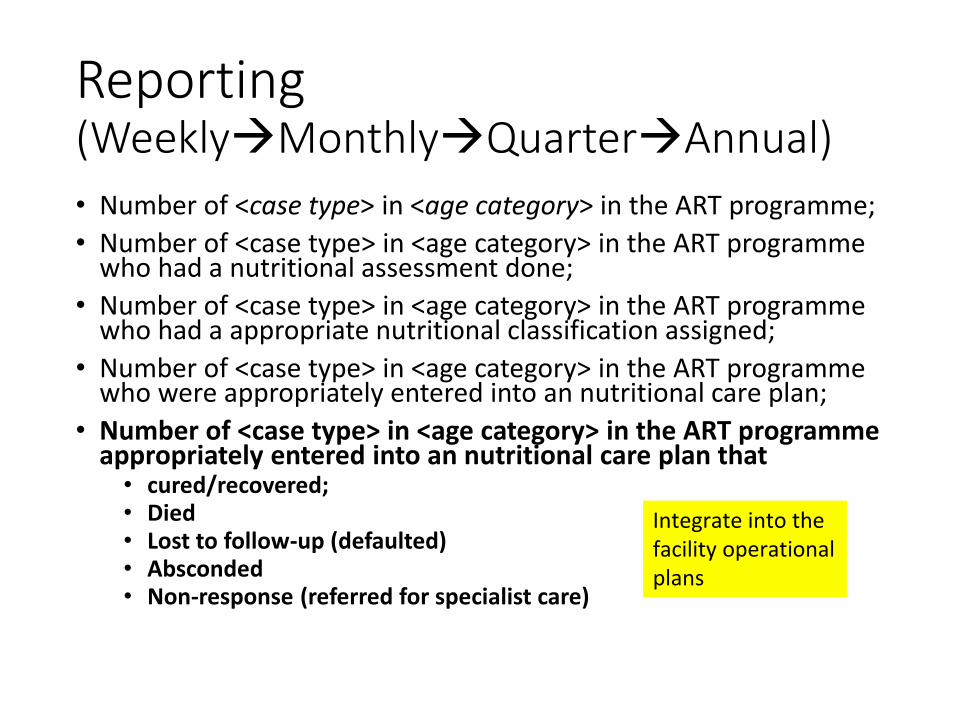
Reporting (WeeklyMonthlyQuarterAnnual)
• Number of <case type> in <age category> in the ART programme;
• Number of <case type> in <age category> in the ART programme who had a nutritional assessment done;
• Number of <case type> in <age category> in the ART programme who had a appropriate nutritional classification assigned;
• Number of <case type> in <age category> in the ART programme who were appropriately entered into an nutritional care plan;
• Number of <case type> in <age category> in the ART programme appropriately entered into an nutritional care plan that • cured/recovered; • Died • Lost to follow-up (defaulted) • Absconded • Non-response (referred for specialist care)
Integrate into the facility operational plans

Indicators and targets
• 100% of ART cases <age category> and PMTCT cases are entered into a NACS programme
• >90% are assessed
• >90% are classified correctly
• >90% are entered into nutritional care and support plan • >90% cured/recovered within maximum treatment duration; • <10% died (inpatient plus during outpatient (home deaths); • <5% defaulted (lost-to-follow-up after 2 consecutive visits) • <1% non-response after maximum treatment duration;
• >90% of <case type> and <age category> virally suppressed (survived and well)
90-90-90-90 Cascade of Nutrition and HIV

Reviewing
• Monthly review of throughput statistics
• Continuous quality improvement plans • Content of care (clinical audits, protocols, SOP,
guidelines, clinical care and governance, clinical mentorship)
• Process of care (referrals, supplements, WBOTS follow-up, tracking and adherence clubs, leadership and governance)
• Integrate into MNCWH&N Quarterly Meeting at district level and provincial level (HAST↔Nutrition)

Responding
• Clinical mentoring to improve quality of care • Inpatient care
• Outpatient care
• Improve the record keeping and reporting • Cohort management and tracking system
• Work together with HAST, Nutrition and MCH units at all levels • Strengthen the Food Security and Nutrition Inter-sector
Plans
Remember: nutritional supplements are meant for the client not the entire household. To support household that are food insecure, refer the household to FNS inter-sectoral agencies in your area

Vehicle to achieve these steps…
• District Health Planning and Monitoring
• District Implementation Plans (DIP)
• District Operational Plans (DOP)
• District Multi-disciplinary Teams (MDT)
• Dieticians • MCH Managers • DCST • HAST

Trends in inpatient case fatality (iCFR) rates in South Africa
35
19.3
16.4
13.3 12.7
11.3 11.6
8.9 8
0
5
10
15
20
25
2009 2010 2011 2012 2013 2014 2015 2016
SAM
INP
ATI
ENT
CA
SE F
ATA
LITY
RA
TE (
ICFR
)
YEAR (SOURCE: DHIS FINANCIAL YEARS)
Source: DHIS National Department of Health
