importance of latin american statistical expertise in our
TRANSCRIPT


A NIELSEN EXPERIENCE
IMPORTANCE OF LATIN AMERICAN STATISTICAL EXPERTISE IN OUR GLOBAL SOCIETY
VIJOY GOPALAKRISHNAN
THE NIELSEN COMPANY
PRESENTATION OVERVIEW
• Retail Measurement Service Overview
• Statistical method vision and goal
• Areas of contribution from our Latam team
• Specific examples in the areas of:– Universe Estimation
– Efficient sampling
– Global Standards
VIJOY GOPALAKRISHNAN
THE NIELSEN COMPANY

RMS Business Overview Product Strategy
• Measure what consumers buy using Retailer Data (Scanning, Audit, Warehouse, etc.)
Value to the Market: Consumer Analytics , Store Optimization, Promotion Strategy
• Consumer Analytics:
– Measure of Dollars and Share within Regional, Account and Retailer Trade Area Markets
• Store Optimization
– Measure of Sales Distribution to analyze Market Penetration
– Supported by All Commodity Value (ACV) data
• Promotion Strategy
– Measure of Baseline Dollars and Incremental Dollars by Causal Conditions
– Supported by Flyer and In-store data
What it doesn’t cover:
• Behavioral data (product usage and ownership)
VIJOY GOPALAKRISHNAN
THE NIELSEN COMPANY

Nielsen marketsLatam methodologies and leadership have large reach!
VIJOY GOPALAKRISHNAN
THE NIELSEN COMPANY

Statistical Methods Vision
To be the world leader in measurement design innovation and thought leadership in order to
accurately reflect the marketplace for our clients
Fit for use Confidence Trust Fact based Impartial
VIJOY GOPALAKRISHNAN
THE NIELSEN COMPANY

Measure of our goalBeating the “efficient frontier”
Costs
Quality
OCR - Surveys
Relative Facts
Dual Sampling
Stock Estimation
Digital Maps
Dual Sample RES
Local Market Hybrid
VIJOY GOPALAKRISHNAN
THE NIELSEN COMPANY

Latam Measurement Science team
Areas of global contribution
• Leadership
• Technical expertise
• Standards
• Product Management
• Methodology Evangelism
• Exporting Talent
VIJOY GOPALAKRISHNAN
THE NIELSEN COMPANY

Some Examples
In the areas of:
• Universe Estimation – RES Sample Optimization
• Efficient sampling – Dual Sampling
• Global Standards
VIJOY GOPALAKRISHNAN
THE NIELSEN COMPANY

Problem Statement
Data collections costs millions annually to
conduct the Retail Establishment Survey
(RES) across 80+ countries.
Many questions on the RES
questionnaires are not required for critical
business purposes such as universe
estimation, sample selection, or revenue
generation. Other questions need not be
administered in all stores to meet service
standards for clients.
The execution of the RES is costly and
questions that are not required of all
stores should be removed or asked of in
a sub-sample of stores.
How to arrive at an objective sub-sampling rate?
Goal Statement
RES Sample Optimization
Attain efficiencies in RES globally withoutaffecting client satisfaction through:
• Questionnaire Revision: Elimination ofquestions that are not used or are notcritical to business objectives.Standardization of questionnaires intolong and short forms.
• RES Sub-Sampling Selection: Establisha holistic approach in calculating sub-sample rate, evaluating impact onstatistical quality and cost functionlevel
VIJOY GOPALAKRISHNAN
THE NIELSEN COMPANY

Terms/Notations
• N = The size of universe
• n = The size of unreduced sample(RES sample designed using internalstandards )
• fn = RES sampling fraction
• k = The size of reduced RES sample(data collection with ‘long’questionnaire)
• R = The ratio of the reduced sampleto the unreduced sample (k/n)
fn = n/N R= k/n
NNnn
kk
NN
Goal = Find RVIJOY GOPALAKRISHNAN
THE NIELSEN COMPANY
-30
-25
-20
-15
-10
-5
0
95% 90% 85% 80% 75% 70% 65% 60% 55% 50% 45% 40% 35% 30% 25% 20% 15% 10% 5%
Ratio of Reduced Sample (R)
Slo
pe
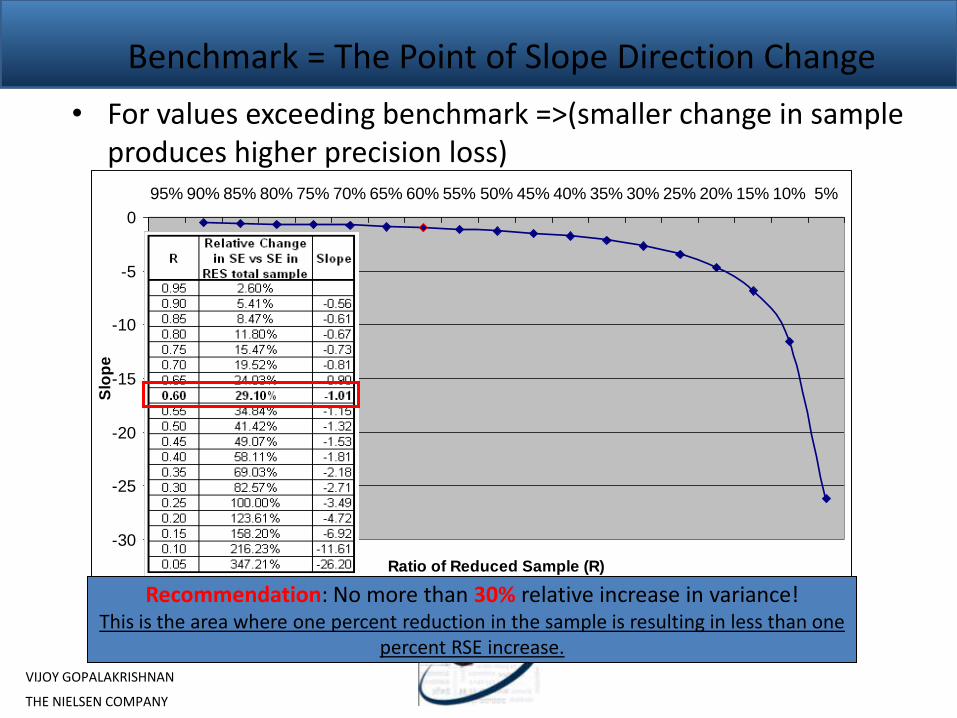
Benchmark = The Point of Slope Direction Change
• For values exceeding benchmark =>(smaller change in sample produces higher precision loss)
Recommendation: No more than 30% relative increase in variance!This is the area where one percent reduction in the sample is resulting in less than one
percent RSE increase.
VIJOY GOPALAKRISHNAN
THE NIELSEN COMPANY

Why not fixed 50% Ratio of Reduced Sample?
50%-50% ratio produces relative
increase in SE exceeding 40% for
sample fraction of 5%
VIJOY GOPALAKRISHNAN
THE NIELSEN COMPANY

Some Examples
In the areas of:
• Universe Estimation – RES Sample Optimization
• Efficient sampling – Dual Sampling
• Global Standards
VIJOY GOPALAKRISHNAN
THE NIELSEN COMPANY

Dual Sampling
• In Nielsen’s Retail Measurement Service, we estimate the sales of a given brand X out of a sample “n” when the total sales of the store is known (ratio estimation).
• Assumption is that high correlation indicates that larger stores sell relatively more of brand X than smaller stores.
• Hence, a gain in sampling efficiency results
• Of course this still requires us to collect item sales and total sales information in n to compute the ratio and apply to the universe – an expensive enterprise
• Is there a better mouse trap?
VIJOY GOPALAKRISHNAN
THE NIELSEN COMPANY

Dual Sampling
• There is!
• In emerging markets such as Latam, distribution of an item i.e. whether the store sells an item is also a powerful predictor of item sales
• And it is less time consuming to collect item distribution in a store than collecting sales information
• There are cons: variance increases and to minimize variance we increase sample
• Overall, a good balance between efficiency and quality. Particularly when auxiliary variable has low correlation to item sales such as the case with low distributed items
VIJOY GOPALAKRISHNAN
THE NIELSEN COMPANY

RMS Dual Sample Methodology
P&D Sample
Reduce Manual Volumetric Audits by 33%...and improve Reporting Granularity with Quarterly Price & Distribution Studies
2/3
1/3
Current
Audit
Sample
Proposed
Dual
Sample
Reduce by 1/3rd
Price & Distribution D-Sample• 4 to 1 Replacement Ratio• Quarterly Frequency • Rolling Sample
Audit V-Sample• Manual Audits reduced by 1/3rd
• Monthly Frequency • Stock & Purchases (derived sales)
Dual Sample Design• 1/3 of stores are V-Sample• 2/3 of stores are D-Sample
VIJOY GOPALAKRISHNAN
THE NIELSEN COMPANY

Trend Analysis - beverages
Share Volume Sales
46
.1
46
.9
46
.2
46
.0
45
.8
46
.0
45
.8
45
.5
10
.0
9.6
9.3 9.49.9
9.6
9.5
9.4
9.0
8.7 8.9
8.79.5
9.4 9.7
9.6
5.3
5.3
5.4
5.5
5.5
5.5 5.6
5.7
Mar'12 Abr'12 May'12 Jun'12
COCA-COLA REG COCA-COLA DUAL RED COLA REG RED COLA DUAL
JARRITOS REG JARRITOS DUAL PEPSI COLA REG PEPSI COLA DUAL
Volume
Sales
Trend
Dual Sampling 1,403,676 1,513,010 1,509,454 1,572,699
Regular DB 1,391,106 1,468,847 1,506,775 1,562,883
Difference 0.9% 3.0% 0.2% 0.6%
MAR12 APR12 MAY12 JUN12
City A
Volume
Sales
Trend
Dual Sampling 63,282 69,933 69,492 71,530
Regular DB 63,172 69,945 71,695 72,695
Difference 0.2% 0.0% -3.1% -1.6%
MAR12 APR12 MAY12 JUN12
City B
Share Volume Sales
62
.2
61
.6
62
.4
62
.3
61
.5
60
.9
62
.2
61
.0
15
.2
15
.2
14
.9
14
.6
14
.5
14
.7
14
.4
14
.6
4.0
4.1
4.2
3.7
5.1
5.2
5.3
5.1
2.2
2.0
1.7
1.7
1.8
1.8
1.5
1.5
Mar'12 Abr'12 May'12 Jun'12
SHARE VOLUME SALES
COCA-COLA REG COCA-COLA DUAL VICTORIA REG VICTORIA DUAL
JARRITOS REG JARRITOS DUAL FANTA REG FANTA DUAL
• Sales trends are very well approximated for both markets
• Sales volume difference is small in both markets
• Volume share differences are less than 1 point for both markets
Audit vs. Dual Audit vs. Dual
VIJOY GOPALAKRISHNAN
THE NIELSEN COMPANY

Some examples
In the areas of:
• Universe Estimation – RES Sample Optimization
• Efficient sampling – Dual Sampling
• Global Standards

RMS data accuracyThree types of factors drive accuracy of RMS Estimates
External factorsSample Design Biases
Characteristics of audit sample that impact accuracy of estimates:• Stratification• Sample size and allocation• Sample selection schemes• Sample representativity•Projection method•Designed precision levels•Granularity of data
Internal factors that systematically deviate estimates from population characteristic (sales)•Under/Over estimated universe•Data pick-up•Frequency of data collection•Biased / non-representative
sample•Projection method•Estimation of non-coop chains
Market and environmental factors impacting estimates (bias and variability)•Undocumented purchases• Lack of cooperation of key
retailers•Rate of retail universe change• Importance of Modern Trade• Importance of non-covered
channels•Economic stability•Social / Political stability
Yhat+σYhat
YY
Yhat+σYhat

What happens with changes?Conceptually, the total error of changes (sales, share) should be function of:
Changes in external factorsChange in variablity from
Sample DesignChanges in Biases
ΔσV(Yhat,t+n / Yhat,t)
Δββt+n / βt
Δδδt+n / δt
Total error = sqrt[(Δβ)2+(Δδ)2(Δσ)2]
VIJOY GOPALAKRISHNAN
THE NIELSEN COMPANY

How to measure total error in sales/share changes?
Intuitively, the effect of changes in biases and changes in external factors are already
reflected in our estimates
Therefore, by modeling the RSE of changes in sales and/or share of market over a large
sample of countries, product categories and brands, we could obtain an interval for the
total error (change tolerance)VIJOY GOPALAKRISHNAN
THE NIELSEN COMPANY
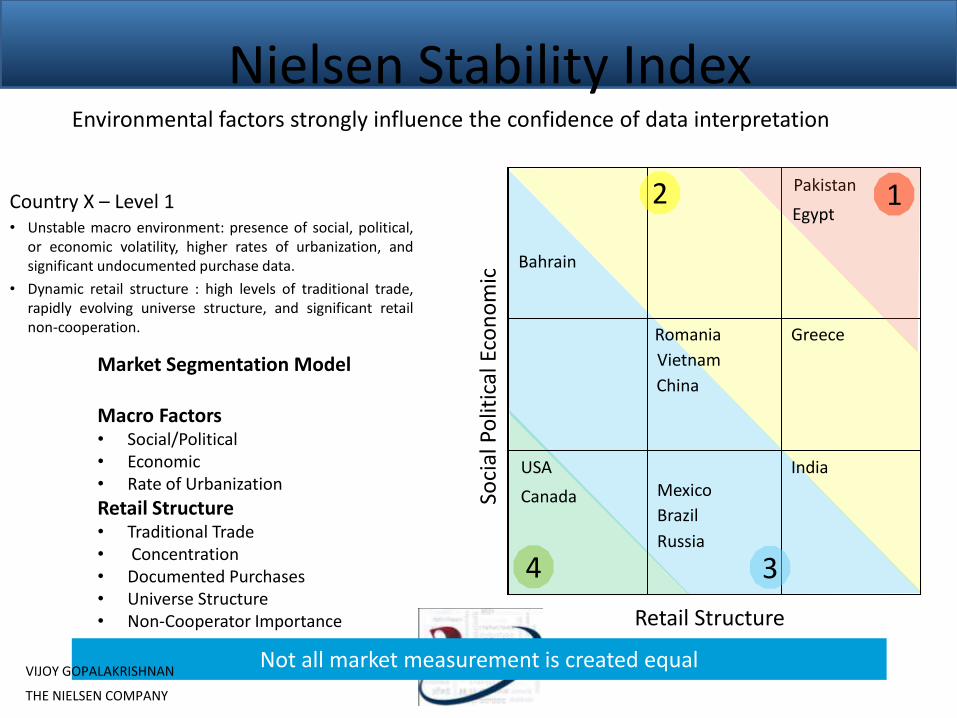
Nielsen Stability Index
Market Segmentation Model
Macro Factors• Social/Political• Economic• Rate of Urbanization
Retail Structure• Traditional Trade• Concentration• Documented Purchases• Universe Structure• Non-Cooperator Importance
Country X – Level 1• Unstable macro environment: presence of social, political,
or economic volatility, higher rates of urbanization, andsignificant undocumented purchase data.
• Dynamic retail structure : high levels of traditional trade,rapidly evolving universe structure, and significant retailnon-cooperation.
Bahrain
Romania
Vietnam
Canada
Pakistan
Mexico
Russia
China
India
Brazil
Retail Structure
Soci
al P
olit
ical
Eco
no
mic
Egypt
Greece
USA
4 3
2 1
Not all market measurement is created equal
Environmental factors strongly influence the confidence of data interpretation
VIJOY GOPALAKRISHNAN
THE NIELSEN COMPANY

Watch Builder Standards
Measure Compliance
Improvement Plans
CTQ WB Standards
Deployment
• By 4 Tiers (by countries)
• Easy to follow
• Practical to implement
• Robust structure
• Strong Change Management
• Robust compliance metrics
• Visible to clients & leadership
• Identify any gaps
• Design solutions
• Implement & measure
VIJOY GOPALAKRISHNAN
THE NIELSEN COMPANY

RMS - Standards Dashboard
Overall compliance Compliance by key process
Not based on real data - for illustration purposes only
Each column lists attributes of a country
Not based on real data - for illustration purposes only
VIJOY GOPALAKRISHNAN
THE NIELSEN COMPANY

THANKS!Q&A