importance of fertigation scheduling - ncpahindia.com c k patel netafim.pdfimportance of fertigation...
TRANSCRIPT

Mr. C K Patel
Sr. Manager Agronomy
SBU-WEST-NETAFIM
9687696657
Importance of fertigation scheduling

2
Scheduling must be based on law of Minimum
Essential elements for plant
Crop growth stage
Nutrients uptake by various crops
Cation exchange capacity
Soil fertility & texture
Soil PH & EC
Salt tolerance of crops
Fertilizers compatibility
soil temperature
Proper fertigation scheduling can maximize the
fertilizers use efficiency & Crop yield
Different factors affecting the
fertigation scheduling

3
The Law of Minimum
The element which is in shortest supply
(in this case, K) limits the yieldJustus von Liebg 1840

4
Ca Mg S
Fe Zn Cu
Mn Mo
B
C H O
N P K
Cl
Micro Nutrient
Essential elements for plant
Natural
Primary Nutrient
Secondary Nutrient

5
Fertigation scheduling
V/S
Crop growth stageNUTRIENTS APPLICATION ACCORDING TO THE UPTAKE RATE OF THE CROP
0
1
2
3
4
5
0 50 100 150
Days after emergence or transplanting
NP
K d
aily u
pta
ke r
ate
(kg
ha
-1d
ay
-1)
N
P
K
Broccoli“spoon feeding”
KP
N

Nutrient Uptake by various crops
6
Nutrient Uptake
Soil analysis
Available nutrients in soil
LAI
Plant density
Crop growth phase
Targeted yield/Variety
Efficiency factors
Fertilizers nutrients
requirement

7
Cation Exchange Capacity
Soil Texture CEC Range ( meq /100gm soil )
Organic soils > 50
Fine (clay) 25-50
Medium (silt) 8-30
Coarse(sand) 5-15

8
Fertigation scheduling on the
basis of soil fertility & texture

Influence of soil pH on the availability of plant nutrients
9
Optimal pH value: 5 – 6
– Maximal nutrient availability
High pH values:
– Reduced nutrient availability
Low pH values:
– Reduced nutrient availability
– Toxic levels of Al, Mn

Fertilizers Grade FormulapH
(1 g/L at 20oC)
Urea 46 – 0 – 0 CO(NH2)2 5.8
Potassium nitrate 13 – 0 – 46 KNO3 7.0
Ammonium sulfate 21 – 0 – 0 (NH4)2SO4 5.5
Urea ammonium
nitrate32 – 0 – 0 CO(NH2)2 . NH4NO3
Ammonium nitrate 34 – 0 – 0 NH4NO3 5.7
Mono ammonium
phosphate12 – 61 – 0 NH4H2PO4 4.9
Calcium nitrate 15 – 0 – 0 Ca(NO3)2 5.8
Magnesium nitrate 11 – 0 – 0 Mg(NO3)2 5.4On
ly F
ert
iga
tio
n g
rad
e
Nitrogen - N
10

Fertilizers Grade FormulapH
(1 g/L at 20oC)
Phosphoric acid 0 – 52 – 0 H3PO4 2.6
Monopotassium
phosphate0 – 52 – 34 KH2PO4 5.5
Mono ammonium
phosphate12 – 61 – 0 NH4H2PO4 4.9
Urea Phosphate 17-44-00 2.5
Phosphorous-P
11
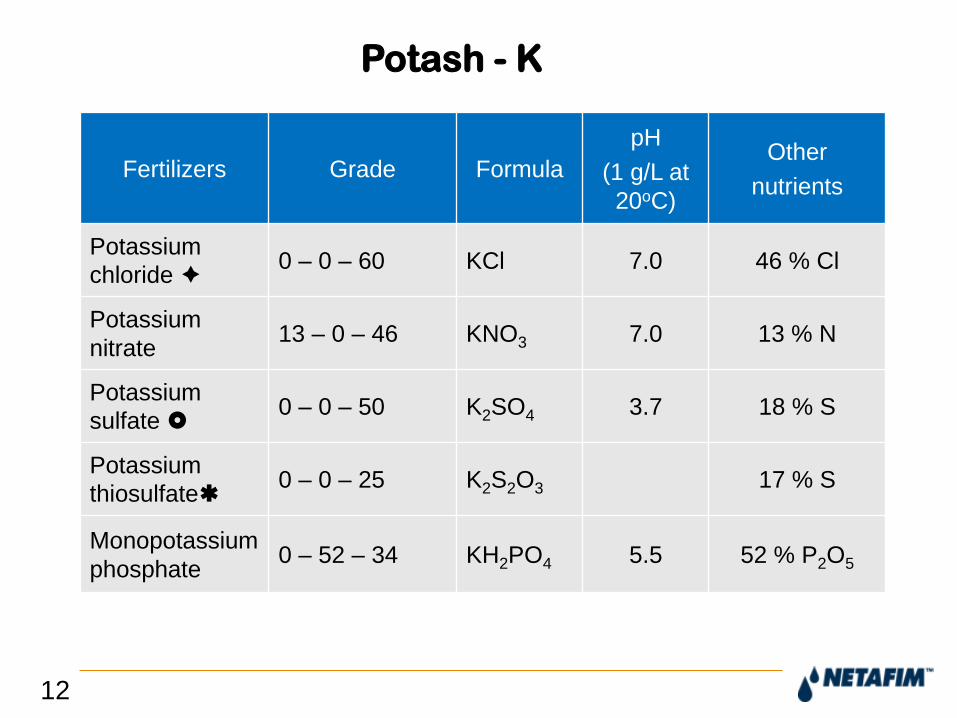
Fertilizers Grade Formula
pH
(1 g/L at
20oC)
Other
nutrients
Potassium
chloride 0 – 0 – 60 KCl 7.0 46 % Cl
Potassium
nitrate13 – 0 – 46 KNO3 7.0 13 % N
Potassium
sulfate 0 – 0 – 50 K2SO4 3.7 18 % S
Potassium
thiosulfate0 – 0 – 25 K2S2O3 17 % S
Monopotassium
phosphate0 – 52 – 34 KH2PO4 5.5 52 % P2O5
Potash - K
12

Divisions for Relative Salt Tolerance(EC)
Ratings of Agricultural Crops
13
(Source: Mass, 1984)
FIELD CROPS
100% 90% 75% 50%
0%
“maximum”3
ECe ECw ECe ECw ECe ECw ECe ECw ECe ECw
Barley 8 5.3 10 6.7 13 8.7 18 12 28 19
Cotton ( 7.7 5.1 9.6 6.4 13 8.4 17 12 27 18
Sugarbet 7 4.7 8.7 5.8 11 7.5 15 10 24 16
Sorghum 6.8 4.5 7.4 5 8.4 5.6 9.9 6.7 13 8.7
Wheat 6 4 7.4 4.9 9.5 6.3 13 8.7 20 13
Soybean 5 3.3 5.5 3.7 6.3 4.2 7.5 5 10 6.7
Cowpea 4.9 3.3 5.7 3.8 7 4.7 9.1 6 13 8.8
Groundnut 3.2 2.1 3.5 2.4 4.1 2.7 4.9 3.3 6.6 4.4
Rice (paddy) 3 2 3.8 2.6 5.1 3.4 7.2 4.8 11 7.6
Sugarcane 1.7 1.1 3.4 2.3 5.9 4 10 6.8 19 12
Corn (maize) 1.7 1.1 2.5 1.7 3.8 2.5 5.9 3.9 10 6.7
Flax 1.7 1.1 2.5 1.7 3.8 2.5 5.9 3.9 10 6.7
Broadbean 1.5 1.1 2.6 1.8 4.2 2 6.8 4.5 12 8
Bean (Phaseolus vulgaris) 1 0.7 1.5 1 2.3 1.5 3.6 2.4 6.3 4.2
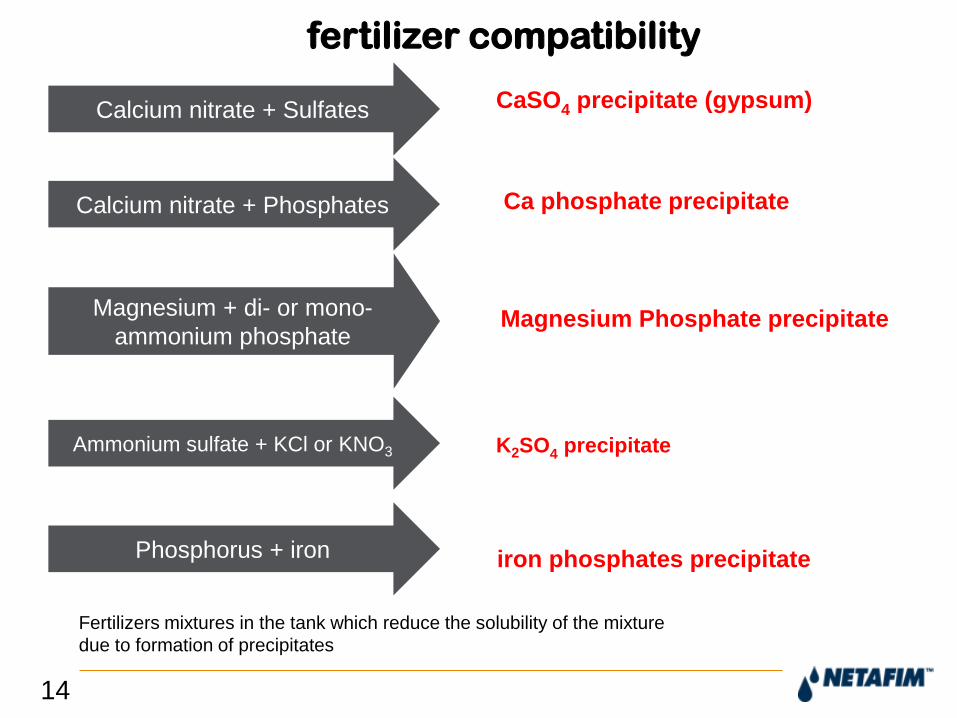
fertilizer compatibility
14
CaSO4 precipitate (gypsum)Calcium nitrate + Sulfates
Calcium nitrate + Phosphates Ca phosphate precipitate
Magnesium + di- or mono-
ammonium phosphateMagnesium Phosphate precipitate
Ammonium sulfate + KCl or KNO3 K2SO4 precipitate
Phosphorus + iron iron phosphates precipitate
Fertilizers mixtures in the tank which reduce the solubility of the mixture
due to formation of precipitates

Compatibility chart for water soluble fertilizers
15
Source: Marwaha-2003

Effect of temperature on the uptake of nutrients by plant
16

17
How long it takes ?
NH4+ nitrification NO3
-
How long it takes ?
Half life of this process at
25 0 C and Field capacity
moisture content is about
1-2 weeks
Nitrification

Cotton Fertigation schedule
18
Source: BCI-GGRC

19

Conclusion
Fertigation scheduling with balance
nutrients programme , including all criteria
like EC,PH, CEC, soil texture, soil fertility
status & crop growth stage, can only
maximize the crop yield
20

Subtitle, date, Presenter’s name should be in lowercase
- AN INTRODUCTION
YOUTHANK

22
Fertigation schedule for cotton (one acre)
Basal application
FYM (t/a)SSP
(kg/a)Micronutrients (Kg/a) Targeted Yield
6 250 5 1.6 t/aFertigation (kg/acre)
DAS DAYS UREA ASMAP-
(12-61-00) MOP MgSo4 CaNo3Micronutrien
ts (g/a)
0-8 8 12 5 89-15 7 20 5 8
16-50 35 40 5 17 10 5 10051-80 30 10 25 5 25 10 5 100
81-110 30 10 25 25 10 5 100111-140 30 25 25 10 5 100141-180 40 17 5
Total 180 92 75 20 125 45 20 400
Fertilizer N P K S Mgo CaoSSP 0 40 0 28
Urea 42AS 15 18
MAP 2 12MOP 75
MgSo4 4CaNo3 3 5
Total nutrients k/a
63 52 75 46 4 5
Fertilizer TypeQty (kg)
Price (Rs/kg)
Total cost Rs
Cost RsCategor
y% of Total
costFYM Basal 6000 1 6000
8250 Basal 56SSP Basal 250 8 2000Micronutrients Basal 5 50 250
Urea Traditional 92 6.34 5832986
Traditional
20AS Traditional 75 12.7 953MOP Traditional 125 11.6 1450MAP WSF 20 85 1700
3570 WSF 24MgSo4 WSF 45 14 630CaNo3 WSF 20 42 840
Micronutrients EDTA 0.4 1000 400Total Cost 14806 14806 100