importance of a statistical analysis plan
TRANSCRIPT
IMPORTANCE OF A STATISTICAL ANALYSIS PLAN
Dr. Helen Purtill

Overview
• Statistical analysis
• Beginning a statistical analysis plan
• Types of data
• Sample size considerations

Statistics is the science of collecting, analysing, presenting and
interpreting data
DataAnalysis Conclusions
Warning: Need to avoid “Rubbish in, Rubbish out!”
Statistical analysis
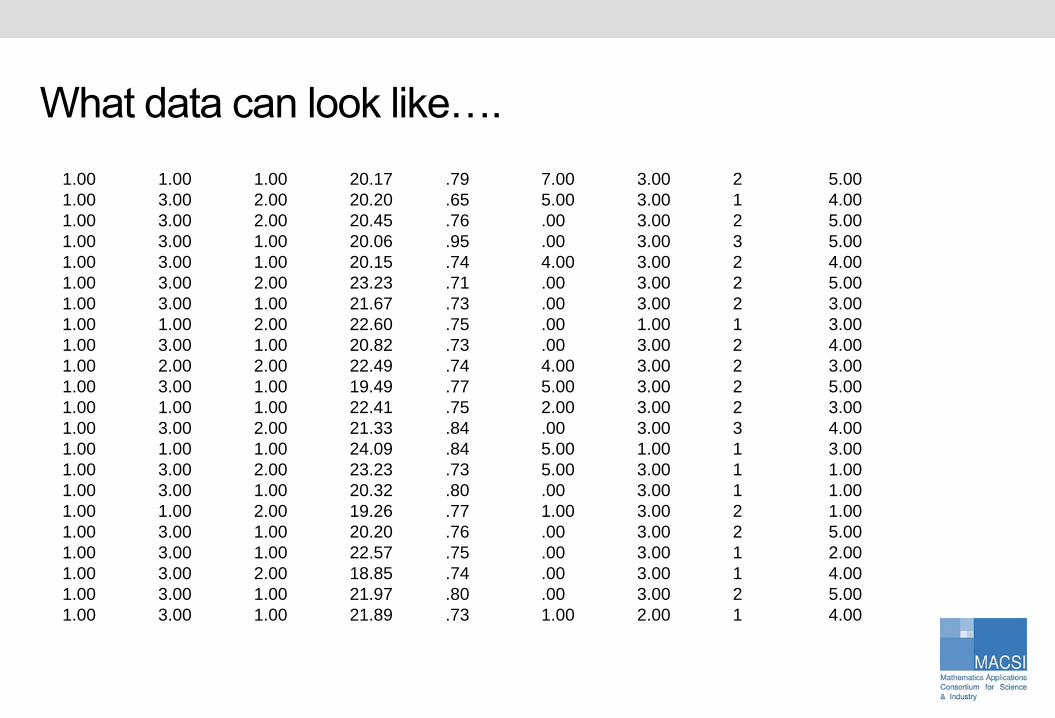
What data can look like….
1.00 1.00 1.00 20.17 .79 7.00 3.00 2 5.00
1.00 3.00 2.00 20.20 .65 5.00 3.00 1 4.00
1.00 3.00 2.00 20.45 .76 .00 3.00 2 5.00
1.00 3.00 1.00 20.06 .95 .00 3.00 3 5.00
1.00 3.00 1.00 20.15 .74 4.00 3.00 2 4.00
1.00 3.00 2.00 23.23 .71 .00 3.00 2 5.00
1.00 3.00 1.00 21.67 .73 .00 3.00 2 3.00
1.00 1.00 2.00 22.60 .75 .00 1.00 1 3.00
1.00 3.00 1.00 20.82 .73 .00 3.00 2 4.00
1.00 2.00 2.00 22.49 .74 4.00 3.00 2 3.00
1.00 3.00 1.00 19.49 .77 5.00 3.00 2 5.00
1.00 1.00 1.00 22.41 .75 2.00 3.00 2 3.00
1.00 3.00 2.00 21.33 .84 .00 3.00 3 4.00
1.00 1.00 1.00 24.09 .84 5.00 1.00 1 3.00
1.00 3.00 2.00 23.23 .73 5.00 3.00 1 1.00
1.00 3.00 1.00 20.32 .80 .00 3.00 1 1.00
1.00 1.00 2.00 19.26 .77 1.00 3.00 2 1.00
1.00 3.00 1.00 20.20 .76 .00 3.00 2 5.00
1.00 3.00 1.00 22.57 .75 .00 3.00 1 2.00
1.00 3.00 2.00 18.85 .74 .00 3.00 1 4.00
1.00 3.00 1.00 21.97 .80 .00 3.00 2 5.00
1.00 3.00 1.00 21.89 .73 1.00 2.00 1 4.00
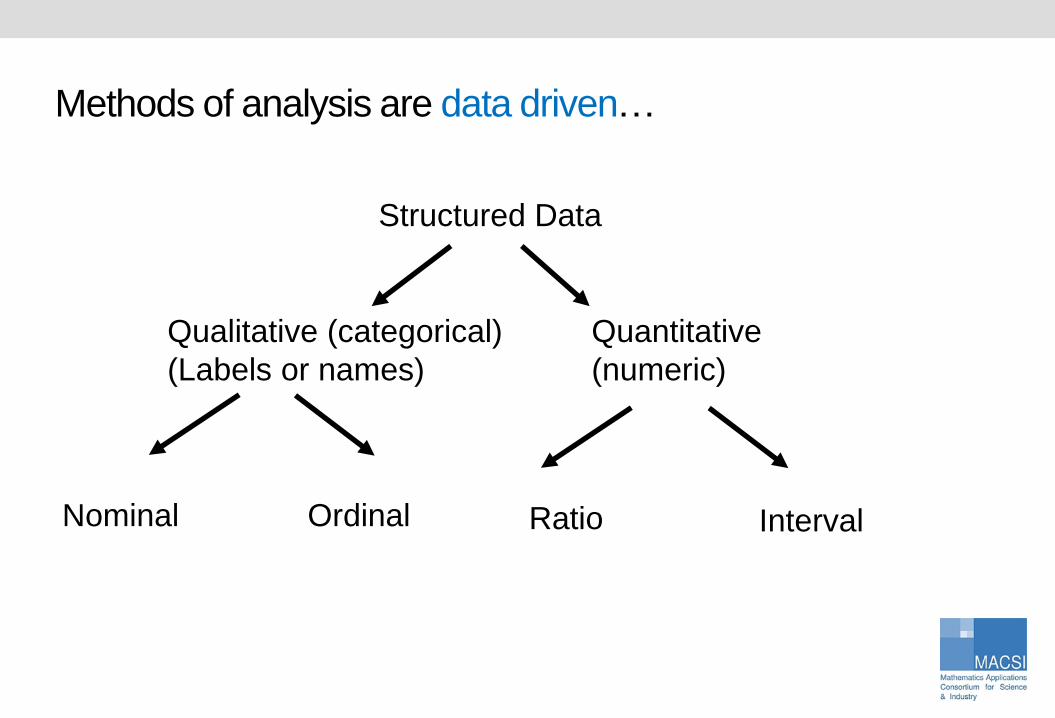
Methods of analysis are data driven…
Structured Data
Quantitative
(numeric)
Qualitative (categorical)
(Labels or names)
Ratio IntervalNominal Ordinal

Exploratory Data Analysis (Visualisation):
Categorical variables are summarised by number and percentage in each group and graphically by bar or pie charts.
Quantitative variables require a visualisation (graph) such as a histogram to determine the shape of the distribution…
- if symmetric summarise using mean and standard deviation
- if skewed summarise using median and interquartile range
Note: Check for input errors by doing a table of max, min values across all variables.

Age profile of a Banks Customers BMI of a sample of Rugby Players
Examples of histograms:

“Pauper Limerick” by Dr. David Fleming & Dr. John Logan
Age of residents of an 18th century Limerick Workhouse
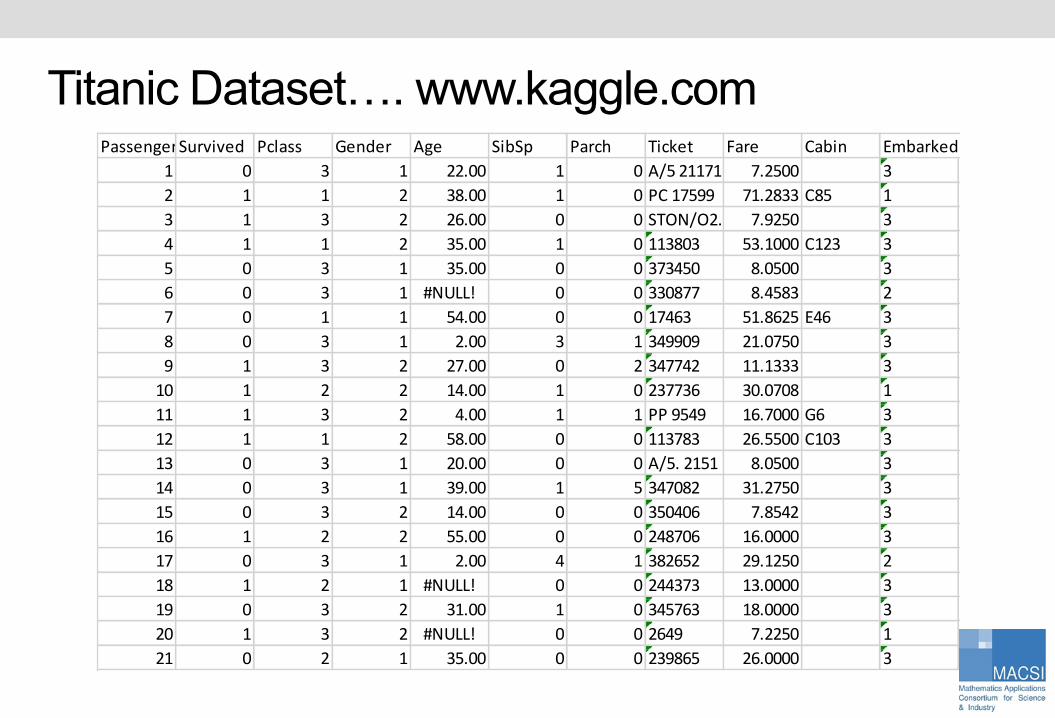
Titanic Dataset…. www.kaggle.comPassengerIdSurvived Pclass Gender Age SibSp Parch Ticket Fare Cabin Embarked
1 0 3 1 22.00 1 0 A/5 21171 7.2500 3
2 1 1 2 38.00 1 0 PC 17599 71.2833 C85 1
3 1 3 2 26.00 0 0 STON/O2. 31012827.9250 3
4 1 1 2 35.00 1 0 113803 53.1000 C123 3
5 0 3 1 35.00 0 0 373450 8.0500 3
6 0 3 1 #NULL! 0 0 330877 8.4583 2
7 0 1 1 54.00 0 0 17463 51.8625 E46 3
8 0 3 1 2.00 3 1 349909 21.0750 3
9 1 3 2 27.00 0 2 347742 11.1333 3
10 1 2 2 14.00 1 0 237736 30.0708 1
11 1 3 2 4.00 1 1 PP 9549 16.7000 G6 3
12 1 1 2 58.00 0 0 113783 26.5500 C103 3
13 0 3 1 20.00 0 0 A/5. 2151 8.0500 3
14 0 3 1 39.00 1 5 347082 31.2750 3
15 0 3 2 14.00 0 0 350406 7.8542 3
16 1 2 2 55.00 0 0 248706 16.0000 3
17 0 3 1 2.00 4 1 382652 29.1250 2
18 1 2 1 #NULL! 0 0 244373 13.0000 3
19 0 3 2 31.00 1 0 345763 18.0000 3
20 1 3 2 #NULL! 0 0 2649 7.2250 1
21 0 2 1 35.00 0 0 239865 26.0000 3

A sample of 891 passenger records from the HMS titanic that sank
in 1912 reveal the following relationship between survival and
passenger class (Data from www.kaggle.com).
Passenger class
TotalFirst Second Third
Survival
no80 97 372 549
37.0% 52.7% 75.8%
yes136 87 119 342
63.0% 47.3% 24.2%
Total 216 184 491 891

Is there an age difference between those who did and did not survive?
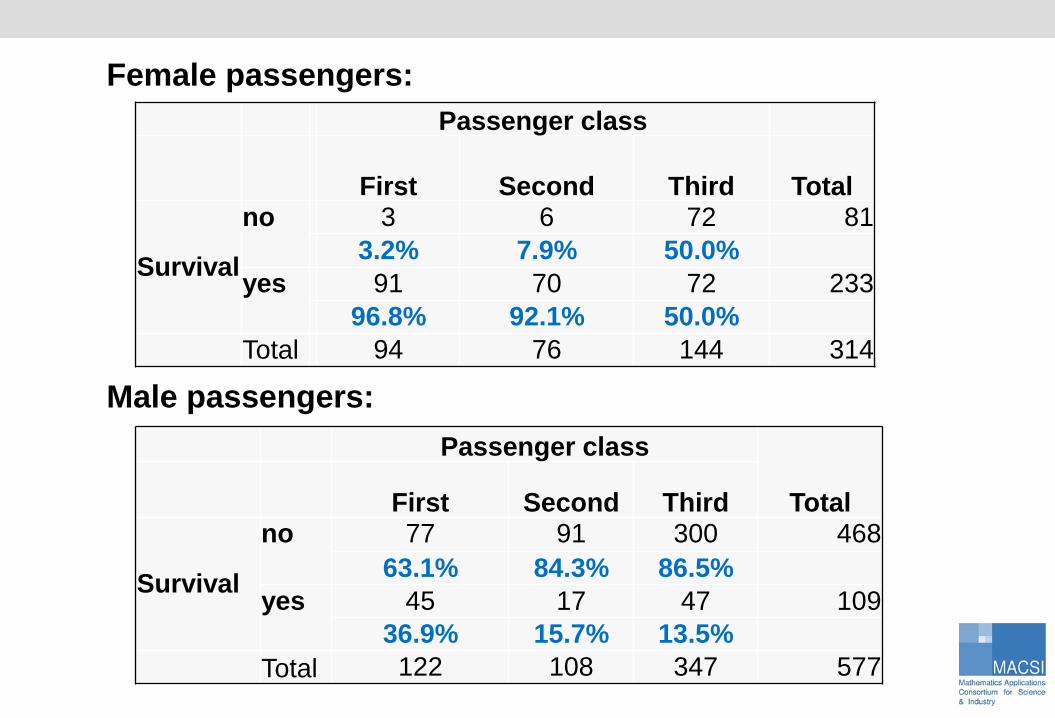
Female passengers:
Male passengers:
Passenger class
First Second Third Total
Survival
no 3 6 72 81
3.2% 7.9% 50.0%
yes 91 70 72 233
96.8% 92.1% 50.0%
Total 94 76 144 314
Passenger class
TotalFirst Second Third
Survival
no 77 91 300 468
63.1% 84.3% 86.5%
yes 45 17 47 109
36.9% 15.7% 13.5%
Total 122 108 347 577

Statistical tests and modelling…
• Between group tests (e.g. t-test, chi-square test)
• Correlation (e.g. Pearson, Spearman)
• Linear regression
• Logistic regression
• Cluster analysis, Factor analysis, Classifcation trees etc….

The beginning of a statistical analysis plan….
What is the research question?
What is the primary outcome measure of interest?
What is the population?
What study design is needed?
What kind of data is needed?
What sample size is needed? ….. then the rest (i.e. the analysis) is easy!

The Statistical Analysis Plan needs to consider the following…
• Would you like to compare groups? Then you’ll need to have large enough number in each group to make this possible.
• How many outcomes would you like to test?
• Would you like to fit a statistical model to the data (e.g. a linear regression model)?
- how many control variables do you need?
- a rule of thumb for a multiple linear regression model for the sample size is 50 + 8k, where k = number of variables in the model2
2Tabachnick, B.G., Fidell, L.S. and Ullman, J.B., 2007. Using multivariate statistics (Vol. 5). Boston, MA: Pearson.
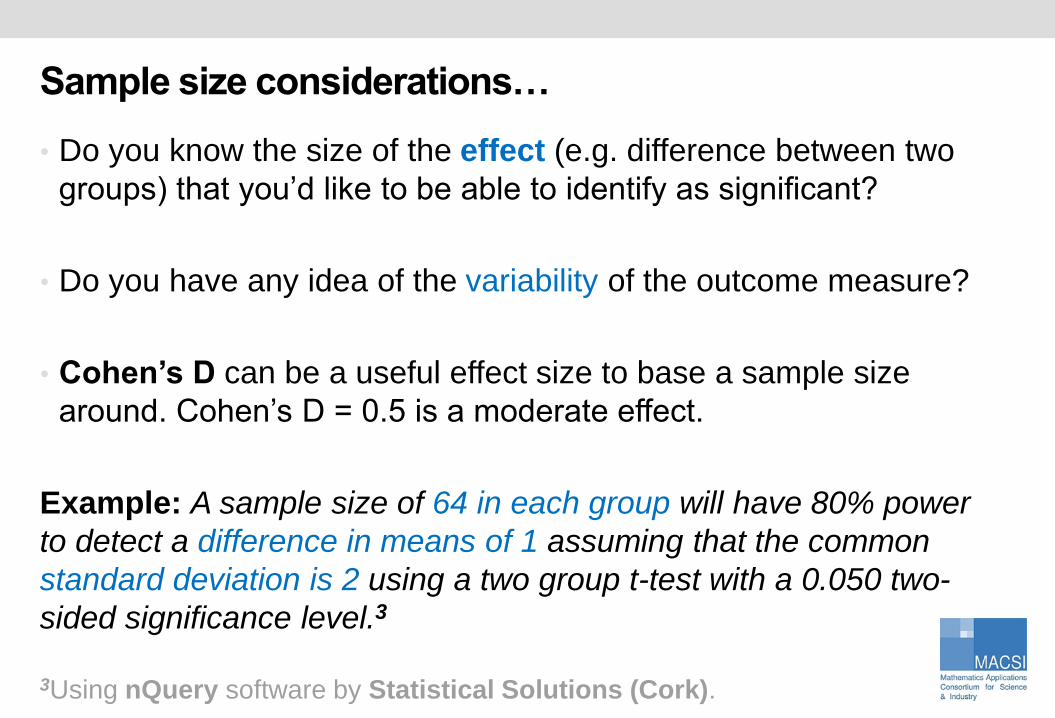
Sample size considerations…
• Do you know the size of the effect (e.g. difference between two
groups) that you’d like to be able to identify as significant?
• Do you have any idea of the variability of the outcome measure?
• Cohen’s D can be a useful effect size to base a sample size
around. Cohen’s D = 0.5 is a moderate effect.
Example: A sample size of 64 in each group will have 80% power
to detect a difference in means of 1 assuming that the common
standard deviation is 2 using a two group t-test with a 0.050 two-
sided significance level.3
3Using nQuery software by Statistical Solutions (Cork).

A good Statistical Analysis Plan will inform….
- the research question
- the study design
- the sample size needed for the study
- the variables to be collected
- the methods of analysis
Recommended resource: SPSS Survival Manual by Julie Pallant

Thank you…