implications of the inadequate electricity and gas supply
TRANSCRIPT

STUDY ON IMPLICATIONS OF THE
INADEQUATE ELECTRICITY AND GAS
SUPPLY IN THE RMG INDUSTRY IN
CHITTAGONG EPZ
By Maumita Chowdhury
A Thesis
Submitted to the
Department of Industrial & Production Engineering
in Partial Fulfilment of the
Requirements for the Degree
of
MASTER IN ADVANCED ENGINEERING MANAGEMENT
DEPARTMENT OF INDUSTRIAL & PRODUCTION ENGINEERING
BANGLADESH UNIVERSITY OF ENGINEERING & TECHNOLOGY
DHAKA, BANGLADESH
July 2014

i
The thesis titled Study on Implications of the Inadequate Electricity and Gas
Supply in the RMG Industry in Chittagong EPZ submitted by Maumita
Chowdhury, Student No. 1009082108F, Session- October 2009, has been accepted as
satisfactory in partial fulfillment of the requirement for the degree of Master in
Advanced Engineering Management on July 15, 2014.
BOARD OF EXAMINERS
1. Dr. Nikhil Ranjan Dhar Chairman
Professor
Department of Industrial & Production Engineering
BUET, Dhaka
2. Dr. A. K. M. Masud Member
Professor
Department of Industrial & Production Engineering
BUET, Dhaka.
3. Dr. Md. Shamim Akhter Member
Professor
Department of ME
Rajshahi University of Engineering and Technology
Rajshahi

ii
DECLARATION
It is hereby declared that this thesis or any part of it has not been submitted elsewhere for
the award of any degree or diploma.
Maumita Chowdhury

iii
This work is dedicated
to my loving
Father
&
Mother

iv
ACKNOWLEDGEMENT
At first the author expresses her heartiest thanks to the Almighty for giving the
patience and potentiality to dispatch this thesis in light. The author has the pleasure to
express sincere gratitude and profound indebtedness to her supervisor Dr. Nikhil Ranjan
Dhar, Professor, Department of Industrial & Production Engineering (IPE), BUET, Dhaka,
for his continuous support, guidance and valuable suggestions throughout the progress of
this work.
The author also expresses her sincere gratitude and thanks to the board of
examiners Dr. A. K. M. Masud, Professor, Department of Industrial & Production
Engineering, BUET and Dr. Md. Shamim Akhter, Professor, Department of Mechanical
Engineering, RUET for their valuable suggestions and guidance. The author recognizes
and expresses her thanks to the people of visited readymade garments industries who
provided surplus facilities and supports to complete the work.
The author is profoundly indebted to her parents for encouraging and providing
moral support to complete the work smoothly. Finally, the author is pleased to express her
heartiest gratitude to the respected teachers of the Department of Industrial and Production
Engineering (IPE), BUET and to all of her colleagues and friends who helped her directly
or indirectly in this work.
v
ABSTRACT
The readymade garments (RMG) industry occupies a unique position in the
Bangladesh economy. It is the largest exporting industry in Bangladesh, which
experienced phenomenal growth during the last 20 years. By taking advantage of an
insulated market under the provision of Multi Fiber Agreement (MFA) of GATT, it
attained a high profile in terms of foreign exchange earnings, exports, industrialization and
contribution to GDP within a short span of time. The industry plays a key role in
employment generation and in the provision of income to the poor. Nearly two million
workers are directly and more than ten million inhabitants are indirectly associated with
the industry. Over the past twenty years, the number of manufacturing units has grown
from 180 to over 4000. The sector has also played a significant role in the socio-economic
development of the country. Garments industry is the largest export industry for our
country and it contributes75% of total export. The industry is associated with its strength,
weakness, threat and opportunity. In 2005-06 the industry faced a great instability due to
the protest of the worker. After that under the state of emergency the sector enjoyed a
stable growth and finally reaches at the matured stage. During recent period, the RMG
sector has been facing with huge trouble particularly loss of production and cost of
production is increasing extensively with insufficient supply of gas and electricity. Many
of the garments factories are considerably relying on alternative power source as
generators. But these steps are only creating losses and increasing cost. In this study an
attempt has been made to estimate of loss and increase in cost due to inadequate electricity
and gas supply in RMG. Questionnaire has been circulated among the selected RMG
industries and relevant data were collected to identify the impact of shortage of power
supply under different circumstances which supplements the survey evidence to attain the
objectives of the study.

vi
LIST OF FIGURES
Fig 1.1 : Export figures in Million USD [18] 7
Fig 1.2 : Major export destination [18] 7
Fig 3.1 : Losses due to extra labor expenses during overtime 38
Fig 3.2 : Production losses due to inadequate electricity & gas supply in RMG 40
Fig.4.1 : Production graph for Back and Front Attach 47
Fig.4.2 : Production graph for Shoulder Joint 47
Fig.4.3 : Production graph for Rib Tack 47
Fig.4.4 : Production graph for Rib Attach 47
Fig.4.5 : Production graph for Back Tack 48
Fig.4.6 : Production graph for Back Top Seam 48
Fig.4.7 : Production graph for Neck Top Seam 48
Fig.4.8 : Production graph for Level Joint 48
Fig.4.9 : Production graph for Shoulder Scissoring 48
Fig.4.10 : Production graph for Sleeve Attach 48
Fig.4.11 : Production graph for Sleeve Tack 49
Fig.4.12 : Production graph for Sleeve Joint 49
Fig.4.13 : Production graph for Armor Top Seam 49
Fig.4.14 : Production graph for Side Joint 49
Fig.4.15 : Production graph for Sleeve Hem 49
Fig.4.16 : Production graph for Body Back 49
Fig.4.17 : Production graph for Body Hem 50
Fig.4.18 : Production graph for Thread Cutting 50

i
LIST OF TABLES
Table 1.1 : Important issues related to the Bangladesh readymade garment
industry
2
Table 1.2 : Growth and trend of garments exports, and contribution to GDP
[20]
7
Table 1.3 : RMG Exports And It's Share in Total Export of Bangladesh [17] 8
Table 1.4 : Size of Bangladesh Textile Industry [18] 13
Table 1.5 : Estimated Demand [MW per Day] Supply 15
Table 1.6 : Present Power Generation Capacity in Bangladesh (FY10) 17
Table 1.7 : Primary Energy Use in Power Generation 18
Table 1.8 : Power production due to different sources 20
Table 1.9 : Growth of the RMG sector 26
Table 1.10 : Bangladesh RMG Exports to EU and US (in million USD) 28
Table 4.1 : Production losses in different sections due to power failure in a
day
50
Table 4.2 : Losses for wages and allowances in different sections due to
power failure
50
Table 4.3 : Production losses in different sections due to power failure for 40
days on average
51
Table 4.4 : Losses for wages and allowances in different sections due to
power failure for 40 days on average
51
Table 4.5 : Production losses in different sections per day on average 51
Table 4.6 : Losses for wages and allowances in different sections due to
power failure in a day on average
51
ii
CONTENTS
Acknowledgement........................................................................................................ iv
Abstract........................................................................................................................ v
List of Figures............................................................................................................... vi
List of Tables................................................................................................................ vii
Chapter 1 Introduction 1
1.1 History and Growth of RMG Industries……………………….. 1
1.2 An Overview of Bangladesh Garments Industry………………. 1
1.3 Growth of RMG in Bangladesh ……………………………….. 3
1.4 Contribution of RMG Sector to the Bangladesh Economy…..... 6
1.5 Factors Promoting Growth in Bangladesh RMG……………..... 9
1.6 Obstructions in the Growth of RMG sector……………………. 11
1.7 Current Status of Power Supply in Bangladesh…………........... 14
1.8 Impact of inadequate electricity and gas supply in RMG ……. 19
1.9 Strategic Policies of Manufactured Exporting…………………. 22
Chapter 2 Objectives and Methodology……………………………………….. 31
2.1 Objectives……………………………………………………… 31
2.2 Methodology…………………………………………………… 31
Chapter 3 Data Analysis and Results ………………………………………..... 33
3.1 Required Queries and Information Collected from Industries… 33
3.2 Working Steps …………………………………………………. 34
3.3 Different Criteria of Production Loses…………………………. 35
Chapter 4 Production Loss of Various Garments…………………………….. 42
4.1 Production Losses in different sections……………………….. 43
4.2 Aspects of Formulating the Overall Production or Efficiency Rate…. 45
Conclusion…………………………………………………………………………... 52
References.................................................................................................................... 55
Appendix...................................................................................................................... 58
Questionnaires……………………………………………………………………… 64

iii
Chapter-1
Introduction
1.1 History and Growth of RMG Industries
In the 1950s, labors in the Western World became highly organized; forming
trade unions. This and other changes provided workers greater rights including higher pay;
which resulted in higher cost of production. Retailers started searching for places where
the cost of production was cheaper. Developing economies like Hong Kong, Taiwan and
South Korea presented themselves as good destinations for relocations because they had
open economic policies and had non-unionized and highly disciplined labor force that
could produce high quality products at much cheaper costs [1].
In order to control the level of imported RMG products from developing
countries into developed countries, Multi Fiber Agreement (MFA) was made in 1974. The
MFA agreement imposed an export rate 6 percent increase every year from a developing
country to a developed country. It also allowed developed countries to impose quotas on
countries that exported at a higher rate than the bilateral agreements. In the face of such
restrictions, producers started searching for countries that were outside the umbrella of
quotas and had cheap labor [2]. This is when Bangladesh started receiving investment in
the RMG sector. In the early 1980s, some Bangladeshis received free training from Korean
Daewoo Company. After these workers came back to Bangladesh, many of them broke ties
with the factory they were working for and started their own factories.
1.2 An Overview of Bangladesh Garments Industry
The RMG industry is the only multi-billion-dollar manufacturing and export
industry in Bangladesh. Whereas the industry contributed only 0.001 per cent to the
country‟s total export earnings in 1976, its share increased to about 75 per cent of those

2
earnings in 2005 [3,4]. Bangladesh exported garments worth the equivalent of $6.9 billion
in 2005,which was about 2.5 per cent of the global total value ($276 billion) of garment
exports. The country‟s RMG industry grew by more than 15 per cent per annum on
average during the last 15 years. The foreign exchange earnings and employment
generation of the RMG sector have been increasing at double-digit rates from year to year.
Some important issues related to the RMG industry of Bangladesh are shown in Table1.1
Table 1.1 Important issues related to the Bangladesh ready-made garment industry
Year Issue
1977-1980 Early Period of Growth
1982-1985 Boom Days
1985 Imposition of quota restriction1
990 Knitwear sector developed significantly
1993 Child labor issue and its solution
2003 Withdrawal of Canadian quota restriction
2005 Phase out of quota restriction
2006 Riots and strike by garments labor
2007-2008 Stable growth
Currently, there are more than 4,000 RMG firms in Bangladesh. More than 95
per cent of those firms are locally owned with the exception of a few foreign firms located
in export processing zones. The RMG firms are located mainly in three main cities: the
capital city Dhaka, the port city Chittagong and the industrial city Narayangonj.
Bangladesh RMG firms vary in size. Based on Bangladesh Garment Manufacturers and
Exporters Association (BGMEA) data, found that in 1997 more than 75 per cent of the
firms employed a maximum of 400 employees each. Garment companies in Bangladesh
form formal or informal groups. The grouping helps to share manufacturing activities, to
diversify risks; horizontal as well as vertical coordination can be easily found in such
group activities. Ready-made garments manufactured in Bangladesh are divided mainly
into two broad categories: woven and knit products. Shirts, T-shirts and trousers are the
main woven products and undergarments, socks, stockings, T-shirts, sweaters and other
casual and soft garments are the main knit products. Woven garment products still
dominate the garment export earnings of the country. The share of knit garment products
has been increasing since the early 1990s; such products currently account for more than
40 per cent of the country‟s total RMG export earnings [5,6]. Although various types of

3
garments are manufactured in the country, only a few categories, such as shirts, T-shirts,
trousers, jackets and sweaters, constitute the major production-share [7]. Economies of
scale for large-scale production and export-quota holdings in the corresponding categories
are the principal reasons for such a narrow product concentration. Foreign buyers are
concerned about the different compliance of law. So, they were bothered about the child
labor issue of Bangladesh. But later on this problem is salut and now garments are
restricted to employ child labor. In 2005 the quota facilities for Bangladesh was
withdrawn. Everybody thought it would be a great shock for garments industry. But in
reality Bangladesh has faced this challenge with great courage. The fact is that the export
of garments product has increased after the withdrawn of this quota. And the last two years
were really good time for garment industry. The political situation was stable under the
country‟s state of emergency and this boost the growth of the industry [8].
1.3 Growth of RMG in Bangladesh
The 100 percent export-oriented readymade garments (RMG) industry of
Bangladesh has witnessed remarkable growth since its inception in the late 1970s.
Paradoxically, this flagship industry of Bangladeshi private entrepreneurial talent took
roots through the first export consignment of shirts from Bangladesh made by the state-
trading agency, the Trading Corporation of Bangladesh (TCB), in the mid-1970s under
countertrade arrangements and the destination was some East European countries.
Subsequently, however, private entrepreneurs entered the industry and phenomenal growth
took place in RMG exports from Bangladesh. Export of RMG increased from US $40000
in 1978-79 to US $6.4 billion in 2004-05. The industry has also provided employment to
nearly 2 million workers, most of them women drawn from the rural areas [9].
Explosive growth of RMG exports is of course not unique to Bangladesh. The
annual compound growth rate of RMG export industries in Indonesia (31.2%), Mauritius
(23.8%), and Dominican Republic (21.1%) compares favorably with that of Bangladesh
(81.3%) over the 1980-87 periods. However, while initial conditions were favorable for
export growth in the countries noted above, this was far from true in the case of
Bangladesh. This makes research into the factors responsible for the observed striking

4
growth of RMG exports from Bangladesh a compelling case study in economic
development [11].
Academics and researches have generally attributed the remarkable growth of
RMG exports from Bangladesh to favorable external conditions, notably the Multi-Fiber
Arrangement (MFA) bilateral quota system imposed by developed apparel countries, and
low wages in Bangladesh 3. The role played by supportive government policy has also
been noted in these studies. However, the role played by the RMG entrepreneurs in the
dynamic growth of this industry has been largely overlooked [11]. Thus, Khan and
Hossain (1989) refuse to accept that the Bangladesh entrepreneurs had made any
contribution to the rapid growth of RMG exports from Bangladesh. This apparent disbelief
in the dynamics and creativity of Bangladeshi RMG entrepreneurs seems to have sprung
from the more general notion, widely held by many scholars during the 1970s and 1980s,
that Bangladesh lacks entrepreneurial resources .
While inappropriate government policy can spell disaster for an industry, by the
same logic, sound economic policy of the government can stimulate industrial growth.
Hence, a second objective of this paper is to analyze the role of supportive government
policies in promoting the growth of the RMG industry in Bangladesh. In addition to
policies which are supportive, deliberately weak or minimum government regulation of an
industry in the form of non-implementation or weak implementation of existing
government laws and regulations may spur growth of that particular industry, even through
it would clearly reduce social welfare and hence can be construed as misgovernance [12].
There is an unanimity of opinion among scholars that the changing structure of the global
apparel industry has been uniquely fashioned by the MFA Quota system used by
developed importing countries which restricted export supplies of garments to these
markets from established supplying countries and thereby paved the way for the
emergence of new garments exporting countries. This migration of the export-oriented
garment industry from established suppliers to new suppliers was, as one would expect,
directed by the existence of low wages in the new exporting countries. An important
feature of the quota-restrained apparel market, which economic theory teaches us to
expect, has been the emergence of quota premium or quota rent where the quota is binding.
This quota rent clearly is an addition to normal profit that would occur in an unrestrained

5
market. This paper investigates the importance of the MFA Quota system as a contribuory
factor to the rise of the RMG industry in Bangladesh. More importantly, an attempt is
made to assess the extent to which quota rents enabled the RMG enterprises to absorb the
higher cost of doing business resulting from misgovernance, a luxury which was not
available to other industries.
Since May 2006, the RMG industry of Bangladesh has been beset with very
serious labor unrest problems which has resulted in large-scale damaging of garment
factories by the workers and has at times appeared to threaten the very existence of this
industry [13, 14].
The major bone of contention between the RMG factory owners and the workers
has been the allegedly low level of wages paid in this industry, particularly wages paid to
unskilled workers, together with other issues like late payment of wages, lack of security
of workers resulting from absence of a formal contract between the worker and the
employer, nonpayment of maternity and other benefits to female workers, etc. These
issues, which form part of what is commonly known as „compliance with social standards‟,
have also posed problems for Bangladesh‟s RMG industry on the external front for the
past few years during which time foreign buyers of Bangladesh‟s garments have insisted
on strict social compliance on the part of RMG enterprises in Bangladesh as a pre-
condition for their importation from this country [16].
The fourth and final objective of this paper is to determine whether weak or lack
of social compliance of Bangladesh‟s RMG industry at present, to the extent that it is true,
can be traced back to the government‟s lenient and perhaps „indulgent‟ attitude towards the
country‟s overwhelmingly important foreign exchange earning industry during its
formative years, in the form of lack of monitoring and regulation and strict enforcement of
the country‟s laws pertaining to social standards. If found to be true, this can be construed
as misgovernance because the government, perhaps unwittingly, would in this case have
encouraged the RMG industry to move along a path of long-run unsustainable growth, the
lack of sustainability originating from a disgruntled workforce and dissatisfied importers,
not to speak of exploitation of labor, particularly women workers who dominate this

6
industry. The garment sector is one of the most important components of Bangladesh‟s
economy [18].
Garment exports were an estimated $5.8 billion USD out of total
merchandise exports $7.8 billion USD in 2004, making them the nation‟s
largest source of exports.
Garment sector exports accounted for 9.5% of GDP in FY 2003/4.
The garment sector is an important source of employment generation and
currently provides employment for over 2 million people or approximately
3% of the labor force.
As 90% of the workforce in the garment manufacturing sector is female, the
garment sector is particularly important for women‟s employment.
The garment sector is a key provider of employment and income to the
urban poor.
The sector is concentrated in Dhaka and Chittagong, where approximately
90% of the factories are located.
1.4 Contribution of the RMG Sector to the Bangladesh Economy
Ready Made Garments (RMG) is the largest export sector of Bangladesh and thus
one of the major drivers of country‟s economy. It has seen tremendous growth over the last
three decades and dominated the industrial sector of the country since the early 1980s as
shown in Fig.1.1. In the FY 2009-10 RMG export was 13% of the GDP and total export
was 17% of the GDP while in 1991-92 RMG export was 4% of GDP and total export was
6% of GDP. It has by now become a colossal industry, earning the lion's share of the
country's foreign exchange and providing the largest formal employment to the women of
the country [19]. At present Bangladesh exports RMG to around 90 countries in the world
with EU, USA and Canada being the major importer which is shown in Fig.1.2.
Garments Industry occupies a unique position in the Bangladesh economy. It is
the largest exporting industry in Bangladesh, which experienced phenomenal growth

7
during last two decades. The industry plays a key role in employment generation and in the
provision of income to the poor. Nearly two million workers one directly and more than
ten million inhabitants are indirectly associated with the industry. The sector has also
played a significant role in the socio-economic development of the country. In such a
context, the trend and growth of garments export and its contribution to total exports and
GDP has been examined and Table 1.2 shows the position.
Fig.1.1 Export figures in Million USD [18]
Fig.1.2 Major export destination [18]
Table 1.2: Growth and trend of garments exports, and contribution to GDP [20]

8
Table 1.3: RMG Exports And It's Share in Total Export of Bangladesh [16]
Year Export of RMG
(In Million Us$)
Total Export of
Bangladesh
(In Million Us$)
% of RMG's to
Total Export
1983-84 31.57 811.00 3.89
1984-85 116.2 934.43 12.44
1985-86 131.48 819.21 16.05
1986-87 298.67 1076.61 27.74
1987-88 433.92 1231.2 35.24
1988-89 471.09 1291.56 36.47
1989-90 624.16 1923.70 32.45
1990-91 866.82 1717.55 50.47
1991-92 1182.57 1993.90 59.31
1992-93 1445.02 2382.89 60.64
1993-94 1555.79 2533.90 61.40
1994-95 2228.35 3472.56 64.17
1995-96 2547.13 3882.42 65.61
1996-97 3001.25 4418.28 67.93
1997-98 3781.94 5161.20 73.28
1998-99 4019.98 5312.86 75.67
1999-00 4349.41 5752.20 75.61
2000-01 4859.83 6467.30 75.14
2001-02 4583.75 5986.09 76.57
2002-03 4912.09 6548.44 75.01
2003-04 5686.09 7602.99 74.79
2004-05 6417.67 8654.52 74.15
2005-06 7900.80 10526.16 75.06
2006-07 9211.23 12177.86 75.64
2007-08 10699.80 14110.80 75.83
2008-09 12347.77 15565.19 79.33
2009-10 12496.72 16204.65 77.12
2010-11 (July-Sep) 3971.52 5029.05 78.97
It is revealed from the Table 1.3 that the value of garment exports, share of
garments export to total exports and contribution to GDP have been increased significantly
during the period from 1984-85 to 2005-06. The total garments export in 2005-06 is more
than 68 times compared to garments exports in 1984-85 whereas total country‟s export for
the same period has increased by 11 times. In terms of GDP, contribution of garments
export is significant; it reaches 12.64 percent of GDP in 2005-06 which was only 5.87
percent in 1989-90. It is a clear indication of the contribution to the overall economy. It
also plays a pivotal role to promote the development of linkage small scale industries. For

9
instance, manufacturing of intermediate product such as dyeing, printing, zippers, labels
has began to take a foothold on limited scale and is expected to grow significantly.
Moreover it has helped the business of basling, insurance, shipping, hotel, tourism and
transportation. The sector also has created jobs for about two million people of which 70
percent are women who mostly come from rural areas. The sector opened up employment
opportunities for many more individuals through direct and indirect economic activities,
which eventually helps the country‟s social development, woman empowerment and
poverty alleviation. In such a way the economy of Bangladesh is getting favorably
contribution from this industry.
1.5 Factors Promoting Growth in Bangladesh RMG
Factors which promoted growth of RMG sector in Bangladesh can be categorized
into two groups (i) domestic and (ii) external.
Domestic Factors
Cheap labor: RMG is a labor-intensive sector. Bangladesh is an over-populated
country burdened with unemployment problem. The private entrepreneurs in the
late 1970s and early 1980s got an opportunity to use cheap labor to flourish this
sector over-night. At present, about 3.5 million people are working in this sector.
About 80% of them are women. They got a chance to change their fate by
working in the garment factories which helped boom the sector.
Low production cost: As labor cost is very low, RMG factories in Bangladesh
can produce quality garment at lower cost which has attracted the foreign buyers.
International companies like Wal-Mart, JC Penney, H&M, Zara, Tesco,
Carrefour, Gap, Metro, Marks & Spencer, Kohl's, Levi Strauss and Tommy
Hilfiger all import in bulk from Bangladesh. The total export from the sector has
doubled from $6.4 billion in FY 04-05 to $12.5 billion in FY09- 10. The
comparative advantage of low production cost also attracted foreign direct
investment. As a result, both backward and forward linkage industry flourished in
Bangladesh. Currently, the backward industry is able to meet up to 85% of the
demand for the raw materials, which significantly contributed to the country's
growth of apparel and knitwear exports.

10
Local Demand: Clothing is a basic need. Bangladesh is one of the most
densely populated countries in the world. Every year Bangladesh needs a huge
quantity of garment for its local need. Culturally people of Bangladesh like to
wear new clothson the eve of various festivals like Eid, Puja, Pohela Baishak etc.
Beforeemergence of RMG industry, people of Bangladesh had to depend on the
tailors for their domestic need of clothing. Though tailoring still exists, ready-
made garment business is very prolific in Bangladesh.
Government Support: The apparel industry received support from the
government, which included measures like duty drawback facilities, tax holidays,
cash assistance, income tax rebate, creation of export processing zones, zero
tariff on machinery inputs, rebate on freight and power rate, bonded warehouse
facilities, provision of import under back-to-back letters of credit, loans at
confessional rate, export development fund, etc.
Back to Back Letter of Credit: Back to Back Letter of Credit is one of the
important factors in the initial and continuing success of this sector. It
considerably eases the financing requirement of garment business for the local
entrepreneurs. The entrepreneurs are able complete the complicated process of
manufacturing and export with very little of their own funds for working capital.
Even if the turnover isTk. 50 million and the profit is only 5% the returns are still
decent since the funds are borrowed largely from the banks. Therefore the rate of
return does not need to be high. In the absence of back to back L/C, it would have
been very difficult for the new entrepreneurs to raise funds from local financial
institutions to import fabrics and accessories.
Private entrepreneurship: The export- oriented RMG sector started its journey
entirely with private initiatives. The journey was not smooth. The entrepreneurs
faced tremendous constraints in terms of power and gas supply. Political
instability, frequent hartals (strikes), poor port facility, and labor unrest created
longer lead time, which became another barrier in competing with neighboring
nations. Amidst all the constraints, the RMG entrepreneurs lived up to the buyers'
expectations of reduced price margin, improved compliance standards, and
quality assurance. There were also significant investments in backward
integration.
11
External Factors
Quota facility: The key factor behind the growth was the quota system under the
Multi-Fiber Arrangement (MFA). The General System of Preferences (GSP)
facilities and Rules of Origin offered by the developed nations also helped
Bangladesh to accelerate its export. In 25 short, MFA provided market protection
for Bangladesh, whereas GSP facilities offered preferential treatment and market
access opportunities in developed economies.
Supply Side Factors: On the supply side, several factors can be mentioned that
have contributed to the growth of Bangladesh as an apparel exporter. First as the
wages of the East Asian Countries rose and quota restrictions limited shipments
from these countries to particularly the US markets, apparel firms from those
countries established production operations in other countries with cheaper
labor and with few or no quota restrictions. In the second half of 1970s, business
houses from the Republic of Korea, Daewoo in particular, ventured into
Bangladesh to transfer the technology of production and to provide marketing
channels. The number of garment exports business from this arrangement
remained small but awareness as regard the prospects developed within the
garment industry. In 1978,fewer than a dozen companies were in operation. The
number grew to 80 just in three years. Since then, the growth of the industry has
been fabulous. The Korean investment provided the garment industry the decisive
advantage without which a much longer time would have been taken by the
Bangladesh garment industry to attain its present status.
1.6 Obstructions in the Growth of RMG Sector
Market Diversification: There are several weaknesses the RMG industry of
Bangladesh suffers from. This industry is highly vulnerable because it is almost
completely dependent on the mercy of two large markets, namely, EU (48%) and US
(46%) markets. More than 94% of its apparels are shipped to these two markets. As a
separate market Canada is also a cherished destination for Bangladesh apparels. However,
volume is very small, around 3% of the total apparel export. The rest 3% are exported to
more than 40 small markets. If for some reason, the consumers in these two markets

12
cannot or do not buy Bangladesh garments large enough quantity, the industry which is the
largest employer is likely to collapse, and in turn Bangladesh economy will be in jeopardy.
The industry leaders individually and also through BGMEA collectively with the support
of EPB and Government are trying to diversify markets. There are many potential markets,
the larger are India, China and Japan. Beside ASEAN countries, European countries other
than the members of EU, SAARC countries, Russia, Australia and Latin America have
good potential [21].
Recently, under a bi-lateral agreement India has allowed Bangladesh to export to
India 46 specific items duty-free. Many people believe that this is a modest beginning of
getting free access to the very large market. Several years ago Bangladesh was granted
limited duty-free access for a few selected items to Japanese market. The business leaders
believe that Japanese market offers higher prospect than India or China although initial
hope was dashed by the negative impact of Tsunami. But after recovery from Tsunami
disaster, apparel export to Japan has increased and this increase is likely to continue.
Bangladesh has already exported to China. China imports from Bangladesh because its
labor cost has gone up. It is cheaper for China to source cheaper apparel from Bangladesh
where cost is lower. But because of language and other barriers export is growing very
slowly. Anyhow, Bangladesh cannot afford not to diversify its market, but it must look for
new markets without looking for replacement of US and EU markets.
Product Diversification: Another weakness of this industry is the lack of product
diversification. Bangladesh has specialized in exporting mostly inexpensive apparels. Its
export basket should contain diversified products. It needs to try to export products for
high end markets in addition to products for low end markets. It is reported that industry
leaders have taken some steps to penetrate into high end markets of US, EU and several
other markets It is to be noted that the innovative, enthusiastic and farsighted
entrepreneurs of Bangladesh have started increasing their investment in pharmaceuticals,
leather products, light engineering, power generating equipment, small ocean going
shipbuilding, and similar non-traditional exports. So export basket is getting bigger with
overall product diversification.

13
RMG and Backward Linkages: The phenomenal growth in the readymade
garment (RMG) sector in the last decade created many new factories and employment
opportunities. Having enjoyed more than 70% of total investments in the manufacturing
sector during the first half of the 1990s, RMG and knitwear now account for about 4,825
factories and a workforce of 3.1 m -80% of which are women. This sector now employs
over 50% of the industrial workforce and accounts for 79% of the total export earnings of
the country (Table 1.4). The growing trend in the textile and the garments sector means
that Bangladesh is perfectly positioned to appeal to foreign investors [23].
Table 1.4 Size of Bangladesh Textile Industry [18]
Sub-sector No. of
unites Installed machine
capacity Production
capacity (m) Manpower
Textile spinning 341 7.20 ml. spld
0.18 ml. rotor 1600 kg 400000
Textile weaving 400 25,000 SL/SLL 1600 mtr 80000 Specialized textile and power loom 1065 23,000 SL/SLL 400 mtr 43000 Handloom (GF/F) 148342 498,000 handloom 837 mtr 1020000 Knitting, knit dyeing (GF):
(a) Export-oriented 800 12,000 knit/Dy/M 3600 mtr 300000 (b) Local market 2000 5,000 knit/M 500 mtr 24000 Dyeing and finishing (FF):
(a) Semi-mechanized 180 - 120 mtr 10000 (b) Mechanized 130 - 1600 mtr 23000 Export oriented RMG 4500 - 475 doz 2000,000
Inadequate Electricity and Gas Supply: Bangladesh is undergoing a severe
energy crisis and more alarmingly it is looking for alternative suitable sources for power
generation but still to select or decide the right one when the country is just about to finish
its gas reserve in near future. According to Petrobangla almost 85 percent of the power
generation plant here is gas based which is quite unusual for any country. In Bangladesh
most of the industries especially the textile industries do not take power from the grid
rather they produce their own power by most cases gas generator. This power is called
captive power. If we calculate hypothetically we come with a data that Bangladesh has a
supply of captive power for at least 2700 MW.
As power cuts have turned frequent too many times, and as gas pressure dipped,
machines remain silent for hours in factories. Boilers sitting idle with its workers. In the
last one and a half months, about 100 chartered planes left Dhaka airport with shipments.
And each airfreight means loss for the exporters as they have to foot the bills from their

14
pocket. Every kilogram of goods put on a plane costs $4.30, and the worst part is that the
buyer would not pay for it. They would not even refund the shipment cost factored in the
free on board (FOB). To minimise their costs, exporters are now first shipping their goods
to Singapore or Dubai and airlifting them from those business hubs. This minimises the
loss in airfreight.
To make things worse, Bangladesh's productivity in the apparel sector has not
improved, and remains at a much lower level compared to other competitors like China.
Against Bangladesh's productivity of 35 percent, China's is about 80 percent, and major
Southeast Asian countries' are in the 70 percent range.
Right now, the country is reeling under power and gas crises, and no end is in
view within the next few years. Different gas-fired power plants having around 800
megawatt power generation capacity has remained idle due to the gas crisis. This is
intensifying the over-all power load shedding which tends to hover between 1,200 MW
and 1,500 MW daily, which is one third of the country's power demand.
1.7 Current Status of Power Supply in Bangladesh
To confront and overcome prevailing and emerging energy crisis, the worst ever
in the history of Bangladesh Government has announced mega plan to add new generation
of 9426 MW by 2015. Government has planned increasing natural gas production by
another 2400MMCFD by that time. The present effective power generation is about
5000MW against a demand of 7000MW.The gas production capacity is 2000MMCFD
against a demand of 2500MMCFD. This means that in 5 years power generation will
increase by 200% of what has been achieved in over 40 years and gas production will
increase 100%. By any extent of imagination is a highly ambitious plan. According to
many an unrealistic dream, Energy advisors press meet produced some important figures
as can be seen Table 1.5.
This table indicates that in 2011 summer there should be minimum power supply
short fall and in 2013 there would be reasonable surplus. Our policy maker relies on this
type of information produced off and on by the power system management. According to

15
BPDB (Bangladesh Power Distribution Board) Total Generation Report, power distributed
at 30 January, 2012 in Evening Peak 4916 MW against the total demand 7000MW.
Table 1.5 Estimated Demand [MW per Day] Supply
Year 2010 2011 2012 2013 2014 2015 2016
Maximum demand 6454 6765 7518 8349 9268 10283 11405 New generation public sector 255 851 838 1040 1270 450 1500 New generation private sector 520 1343 1319 1134 1053 1900 1300
Power import - - - 500 - - -
Capacity retried - 58 83 161 1292 128 1033
Generation capacity 5936 8042 10116 12629 13660 15882 17649
NET 5499 7720 9711 12124 13114 15247 16543
Dependable capacity 4331 5954 7575 9578 10491 12197 13554
Max. supply shortage in
summer
2123 520 57 1229 1223 1914 2149
The annual trend of power consumption in Bangladesh indicate that at the last
part of winter starting from late January power loads start growing with the
commencement of irrigation season. Irrigation load usually adds about 1500MW to power
demand.
BGMEA, the apparel exporters' forum, has submitted a plan to the prime minister
to set up a number of small-scale area-based power plants in a bid to add 1000-megawatt
(MW) more electricity to national grid for ensuring uninterrupted power supply to
garments factories, insiders in the industry have said. Some 406MW of electricity is
supplied by the government to the sector but the RMG manufacturers have demanded
720MW. Still there will be 35 per cent shortage of electricity in the sector. However, as the
electricity shortage is a national problem, the RMG units have been depended on 'captive-
power', incurring BDT 20 billion additional cost. Worried about the increased price of oil,
"This situation has led to 35 per cent hike in production cost". A total of 20,010 million
liters of diesel are needed in the industry per year.
The frequency of power and gas outages is threatening citizen welfare and
development prospects. The annual loss to production and income from power outages
could well exceed 0.5% of GDP per year. The availability of domestic primary fuel supply
is getting so scarce that it is forcing severe measures like shutting down fertilizer factories,
rationing gas supplies for household and transport uses, and keeping idle installed power
16
units. Every 1% of GDP growth is estimated to lead to a growth of 1.4% in electricity
demand in a typical developing country. For a 5-6% typical annual economic growth rate,
this would imply a need for close to 7-8% growth in electricity supply. Rural
electrification ratio expanded rapidly since the early 1990s, growing from 10 percent in
1994 to 37% in 2008.
Yet, this is still amongst the lowest in developing world. In the rural economy,
low power connectivity is a serious constraint to non-farm sector growth. Against this
demand pattern, unfortunately no substantial low-cost and reliable power generation
capacity has been added since 2002. Due to the severity of the power crisis, the
Government has been forced to enter into contractual agreements for high-cost, temporary
solutions, such as rental power and small IPPs, on an emergency basis, much of it diesel or
liquid-fuel based. This has imposed tremendous fiscal pressure, as budgetary transfers are
routinely made to the power sector in order to enable it to stay current on payments to
power suppliers. The Government is aware that precious resources are being diverted to
cover operating losses of the utility that arise from purchasing short-term high cost power
which is not sustainable for the financial health of the sector in the long run. Therefore, the
longer term strategy embedded in the Sixth Five Year Plan power sector plan is to use
budgetary allocations to promote low-cost, sustainable expansion of power generation,
transmission, and distribution capacity.
Also, there has been no new capacity addition to fuel sources for power
generation. With a power sector that is almost totally dependent on natural-gas fired
generation (89.22% of power comes from gas-fired generators), the country is confronting
a simultaneous shortage of natural gas and electricity. Other fuels for generating low-cost,
base-load energy, such as coal, liquid fuel, or a renewable resource like hydropower, are
not readily available, and any policies put in place to access them are likely to have a 3-5
year lead time. Gas supply is dwindling, and the absence of obvious choices for alternative
fuels implies that there are no readily identifiable and immediately available options for
alternative, new generation sources to meet its base-load power requirements.
Demand-Supply Gap for Electricity: One of the aspects to the demand for
electricity in Bangladesh is the rise in the intensity of electricity use with the pace of

17
economic development. In 1980, electricity demand was 30 Gigawatt (GW) per 1000 crore
taka of GDP, which increased into 80 GW in 2002. Based on current income elasticity,
with an average economic growth of 6 percent the capacity for electricity generation would
need to double every six years.
In view of the low base, it is hardly surprising that the demand for electricity is
increasing rapidly with the improvement of living standard, increase of agricultural
production, development of industries as well as overall development of the country. Due
to the failure in the last few years to increase electricity generation capacity
proportionately to the demand, a serious supply shortage has emerged. Presently, the
shortage is estimated between 1500-1800 Megawatts (Table 1.6)
Table 1.6 Present Power Generation Capacity in Bangladesh (FY10)
Installed Capacity 5823 MW
Generation Capacity 5271 MW
Available Generation 4000-4600 MW
Highest Generation 4606 MW
Electricity Demand (Peak Demand) 6000 MW
Access to Electricity 47%
Per capita electricity Generation 220 KWh 220 KWh
Per capita electricity Consumption 170 KWh
Especially, a huge shortage exists during the evening peak demand. Additionally,
due to the crisis of gas supply and lack of necessary maintenance and rehabilitation of old
power plants, it is not possible to utilize the total installed capacity. Consequently, the
shortage of electricity reaches 1800 Megawatts during the peak demand (5800 MW) of
summer causing huge load-shedding.
Use of Different Types of Energy: Natural Gas is used as primary energy in
most of the existing power plants (Table 1.7). Some 89 percent of total electricity is
produced from gas-based power plants. Besides gas, a small amount of electricity is
produced using diesel, furnace oil and coal. In addition, almost 2.5 percent of total
electricity is produced from Karnaphuli Hydro Power Plant. Due to the increase in the use

18
of gas in fertilizer, industries, factories and other sectors it is not possible to supply
adequate quantity of gas for electricity generation. The shortage of gas is therefore a
serious constraint on the supply of electricity. The diversification of primary energy
sources away from gas to other alternatives including hydro, coal, oil, solar and nuclear
energies is essential for Bangladesh‟s power and energy security.
Table 1.7 Primary Energy Use in Power Generation
Primary Energy Type Percentage of Use
Furnace Oil 3.00
Diesel 1.77
Hydro 2.49
Coal 3.52
Gas 89.22
Although the installed capacity for generation of electricity in the country is 2908
megawatt, the actual production does not exceed 2160 megawatt as against the peak
demand of 2200 megawatt. The average level of system loss is still as high as 33.3%. The
demand for power will increase by 300 MW annually and an investment of about Tk 110
billion up to the turn of the century will be needed to meet it.
Current status of gas sector: Bangladesh is not only suffering from power
generation crisis. It has serious crisis of primary fuel too. Government in desperate
situation tries load management. Urea fertilizer factories are kept shut down to divert gas
supply to power plants. Industries suffer from lack of quality gas supply all over the gas
franchise area. PDB blames Petrobangla for failure of required gas supply which restricts
power generation. Natural Gas Value Chain of Bangladesh is in total mess with a very
little hope of improvement over the next two remaining years of the present government
term. Though Petrobangla in a much hyped Media briefing talked of high sounding
success story of adding over 500MMCFD + new gas over the last three years yet the
ground picture is very different. No new gas field has been discovered over the period.
There are very little success stories in exploration by IOCs and BAPEX. Daily gas
19
production capacity increased during present government from Jan. 09 to Dec.10: 284
MMCFD only.
1.8 Impact of Inadequate Electricity and Gas Supply in RMG
If we study the major difficulties of Ready Made Garments (RMG) industries, we
can surely find how difficult it has become for them to run their industry in all shifts to
meet the export commitments. Many potential buyers are aware of the diabolic energy
supply situation in Bangladesh and are actively considering alternate source of supply
from China, Shrilanka and other countries. Similar situation if not worse is prevailing in
Knitwear, ceramics and other small and medium industries. All these happened due to
unbalanced and unimaginative growth of industries in fuel constraint regions and lack of
far sight and poor management of energy sector.
Prevailing diesel and power crises in the country are forcing readymade garment
(RMG) manufacturers to keep their factories idle sometimes for five hours of a ten-hour
working day. The garment industry today faces a catastrophic fall and if the government
does not address the problems immediately Bangladesh might lose its market to
competitors like India and China. BGMEA suggests that the government improves the
power situation urgently or provides them with diesel under special arrangement so they
can maintain usual production rate. If diesel price is raised they want to be provided with
diesel at a subsidized price. Normally production goes on for 10 hours a day in garment
factories, but now about five hours are being lost daily due to load shedding.
Many of the garment factory owners resorted to generators, but the recent crisis
of diesel has worsened their woes. They usually collect diesel in containers or drums. But
with the backdrop of fuel crisis, the government put a bar on carrying diesel in containers,
which is like 'adding insult to injury'.
Besides, 90 percent of the generators used in garment factories are diesel run and
only about five percent is run by gas. So, in the face of diesel and power crises, garment
factory owners are being forced to ship their product by air to make up for lost time in a
bid to maintain deadlines. Airfreight charges cost me about Tk. 4 crore in just a month

20
The transportation facilities of rail and water are still not sufficient enough to
ensure supply of liquid fuel to all power plant developers in time. Government must stop
giving any new permission for liquid fuel based power plants. Government had to pay
billions of dollars already for liquid fuel import. PDB had to pay through its nose the
higher price of power. Both PDB and BPC will be bankrupt if this trend continues over
long term.
Bangladesh must realize that if it fails to explore and start exploit its own
substantial coal resource urgently the black gold may remain underground forever.
Government must start mining of coal by open pit method from Phulabri and remaining
portion of Barapukuria within this year and start construction of at least 1500-2000MW
mine mouth power plants. By end of 2014, much of the power crisis situation will be taken
care of.
Natural gas use must be gradually restricted to industrial use only. Natural gas for
domestic and commercial use must be phased out. For this category of consumers LPG use
must be encouraged. No more Fertilizer plant should be set up until major gas reserve is
discovered. Gas use for different categories may be restricted according the following after
2020 (Table 1.8). Use of Natural gas must be capped at 4000MMCFD.
Table 1.8 Power production due to different sources
Source Power (MW) Percentage
Natural Gas 7500 50
Coal 6000 40
Import 1000 6.7
Renewable 500 3.3
Total 15,000 100
LNG price from long term contract now is not less than US$ 14/Mbtu. It is higher
in spot market. The price may shoot higher as Japan has decided to shut down all its
nuclear plant in phases. Bangladesh initiative for LNG import will soon have to be
abandoned. Bangladesh must endeavor to generate about 500MW-1000 MW power from
hydro, solar, wind, bio fuel and municipal waste by 2015. This will require national
movement and creation of required incentives by the government. Feed in tariff may be an
incentive. Bangladesh may target to import about 1000MW power from regional grid by
year 2020.

21
Many ready-made garment factories may face closure due to high fuel costs. The
production cost of the exportable apparel items will go up by at least 15 per cent due to the
fuel price adjustment. Around 2,800 garment factories in the country have to pay
additional tens of millions of US dollars as transportation cost of consignments and use of
diesel-run generators due to insufficient supply of electricity.
Petrobangla wants to raise gas prices by 5.24% to Taka 84 ($1.01)/Mcf for power
plants; by 9.71% to Taka 80/Mcf for fertilizer factories; and by 32.60% to Taka 220/Mcf
for industrial users. For captive power plants, the proposed hike is 102.94% to Taka
240/Mcf. Petrobangla also wants to raise gas tariff by 30.55% to Taka 350/Mcf for
commercial consumers; by 20.55% to Taka 200/Mcf for tea estates and by 39.10% to Taka
905.92/Mcf for CNG filling stations. Petrobangla, however, did not propose any price hike
for residential users. This is the second time the government is increasing the prices of gas
after coming to power three years ago. In 2009, gas prices went up on an average by 11.11
percent. Recently after a mass hearing on the proposed price, Petrobangla asked the
distribution companies to reoffer the prices. But it is almost obvious that gas price is
increasing; only it is to be seen at what extent it is increasing.
Currently it has become a great matter of concern for the garments industries of
Bangladesh that the production costs of their exportable apparel items will go up by at
least 15 percent due to the latest fuel price adjustment. To compensate for this, it is
expected that the government should keep the petroleum prices at their previous rates at
least for industrial uses to minimize the production cost.
The garment manufacturing units are largely dependent on petroleum products
due to erratic gas and power supplies to their units. The government has increased the
domestic fuel prices by 33 to 37% with effect from July 1 to adjust the prices with those in
the international market. The new price of diesel and kerosene is Tk 55 a liter, which is
about 37.5 % or Tk 15 more than their earlier price of Tk 40.
Petrol is now Tk 87/liter, up by 34% or Tk 22 from its previous price of Tk 65.
The price of octane now is Tk 90/liter, which is 34% or Tk 23 more than its previous price
of Tk 67. A cylinder of liquid petroleum gas (LPG) is now Tk 1,000, up from Tk 600,

22
while a liter of furnace oil is now Tk 30, up from Tk 20. The apparel factory owners will
have to count an additional cost of Tk 50 crore a month due to this price hike.
The fuel price hike came into effect at a time when the prices of other essential
commodities have increased significantly. So, the workers in the sector will also have to
bear additional household costs for buying the essentials that may see further price spiral
which is an important aspect. Against this backdrop, there may be labor unrest again
leading to production hamper at the garment factories which is a matter of fear.
There is another limitation of some RMG industries that they are not getting gas
and power in Savar, Ashulia, Gazipur and Narayanganj areas to run their plants properly.
According to a government estimate, 35.7 lakh metric tons of petroleum products were
used in Bangladesh in fiscal year. During the fiscal year 2006-07, 65% or 22 lakh metric
tons of which was diesel. Sixty percent of the diesel was used for transports, 32% for
agriculture, and the rest was used for other purposes.
Investment in the garment sector, the motor of the country's export trade, can be
held back by shortage of gas supply in Bangladesh. Bangladesh is till date regarded as a
lucrative place for investment, due to the availability of gas and cheap workforce.
Bangladesh has a huge potential for grabbing larger share in global apparel market, if
provided gas supply in industrial units remains unhindered.
Gas supply constraint also restricts power generation significantly. It is often
reported that the peak national daily power demand is about 5000-5200MW. The total
effective capacity of national production is about 3800 MW. Many of the generation plants
have outlived their normal economic life and are being run through cannibalizing. These
fuel inefficient plants very often go out of production compounding miseries. So, even
consistent generation of 3800MW is not achieved. Consequently massive nationwide load
shedding is having devastating adverse impact on everything and especially in RMG
sector.
1.9 Strategic Policies for Manufacturing Exports
In order to get the maximum leverage out of manufacturing sector and its
competitiveness in the global marketplace, the Sixth Plan would focus on four strategic

23
approaches. Bangladesh experienced double digit export growth over the past two decades.
Yet this superior performance masks the fact that the surge was limited to one product
group-readymade garments – aided not least by the MFA regime. With over two million
jobs and 77% of export earnings from the RMG sector, too much of the nation‟s fortune is
riding on this one sector. Export concentration in readymade garments makes the
economy, jobs and income, extremely vulnerable to external shocks arising from changes
in global demand for RMG. The government‟s focus on export diversification as a
cornerstone of its export policy will continue and intensify during the Sixth Plan period.
Export concentration is not a new phenomenon for Bangladesh. For many
decades prior to the emergence of RMG exports, jute and jute goods dominated the export
sector making up 70 percent of exports until 1981. The shift into manufactured exports
materialized for the Bangladesh economy thanks largely due to an external event – the
multi-fiber arrangement (MFA) of 1974 – that offered a lifeline for the emergence and
rapid expansion of the RMG industry. By 1990, RMG exports had overtaken Bangladesh‟s
traditional exports and, by the close of the 1990s, export concentration emerged afresh,
with RMG exports reaching a share of 77 percent. While Bangladesh‟s export growth for
the last decade and a half could be characterized as robust, a sudden decline in demand for
Bangladeshi RMG would send shock waves throughout the economy. Such a prospect can
be avoided through the creation of a diversified export basket. Herein lies the rationale for
an effective strategy for export diversification.
But in the context of the Sixth Plan, the strategy of export diversification will not
be limited to product diversification in the export basket. Rather, the strategy will embrace
many different facets, each of which addresses the vulnerability aspect of export
concentration, as summarized below:
Product diversification - introducing range of new products in the export
basket.
Geographical diversification - widening the range of destination markets
for exports.

24
Quality diversification - upgrading the value of existing products, i.e.
moving up market from low end to high end products (described as moving
up the value chain).
Goods-to-services diversification - seeking opportunities to expand non-
merchandise exports.
Intermediate goods diversification - product diversification need not
imply adding only final consumer goods in the export basket as is popularly
understood in Bangladesh.
There are global opportunities for plugging into the supply chain of export
powerhouses Like China, something that East Asian economies have done successfully.
That requires Bangladesh to diversify its manufacturing base into backward linkage
industries producing
A wide range of intermediate goods for exports within the globalized production
chain. Finally, it is critical that the trade policy regime is geared to ensure export
competitiveness in general while facilitating emergence and expansion of new export
products. Bangladesh‟s labor cost advantage remains strong though productivity is a
question mark. Yet this advantage, properly harnessed, could yield surprising rewards
within the current scheme of globalized production and supply chains, provided the trade
regime is right. The success of RMG is clear evidence of this phenomenon.
If export diversification is to be the cornerstone of an export strategy, at least
three aspects of the trade policy regime will deserve close attention during the Sixth Plan:
Ensuring export competitiveness in general – by addressing border barriers
(e.g. tariffs) and beyond-the border constraints (e.g. trade infrastructure,
energy and telecommunications, regulations, finance).
Reducing anti-export bias of the trade regime – several researches provided
ample evidence of anti-export bias of the current import, tariff and subsidy
regime that favors import-substituting production over exports. The duty-
drawback scheme to provide world priced inputs for export production has
proved inadequate. Eliminating or reducing the built-in anti-export bias that

25
still remain will be key to switching the incentive regime in favor of
exports.
Reducing anti-diversification bias – because of the stellar success of RMG
exports, trade policy and incentive regime have a clear focus on this sector
which is provided a free trade channel plus logistic support (duty free
import of inputs, bonded warehousing facilities, back-to-back LC, rapid
custom clearance). While such a policy is appropriate for making RMG
exports competitive on a global scale, attention needs to be focused on
similar policy environment for emerging and potential exports without
which they face formidable barriers in the context of a high-tariff and
restrictive import regime in Bangladesh. This particular feature of anti-
diversification bias could be unique to Bangladesh and will be addressed
during the Sixth Plan.
The philosophy of the current government is for Bangladesh to attain middle
income status by 2021. It is felt that the industrial sector has to fuel the much needed
dynamism that is required to attain the challenge of earning middle income status. In line
with this belief the government has identified three pivotal aspects of the industrial sector
of Bangladesh that has to be further developed and improved. These three pivotal areas are
promotion of domestic content in output,
wherever practicable substitution of imports and
sustainable development and husbandry of export oriented industries.
Moreover the government aims to create a more investor friendly atmosphere for
both local and foreign investors to fuel industrial growth. Moreover the government aims
to improve access of khas land for industrial usage and more efforts will be directed at
setting up EPZ and SPEZ .In order to unleash the large scale industrial sector the
government is taking an integrated approach i.e. there will be increased concentration in
improving the infrastructural needs of industrialization and improvement in the financial
sector. The government realizes that in order to extract the true potential of the labor and
improve total factor productivity the labor force has to be trained further both vocationally
and academically and hence various government agencies will work very closely to the

26
industrial sector in order to improve the skill gap. In order to improve Bangladeshi goods
the government would support the sector by aiding and encouraging them to carry out
.Research so that the goods produce could be of high value and unique and thus greater
value exports. Finally it is the firm belief of the government that the private sector would
be the leader of industrial development and there the government aims to aid this sector by
various policy measures including industrial policy.
The Ready-Made Garments (RMG) industry contributes to the Bangladesh
economy in a distinctive manner. The last 20 years witnessed unparalleled growth in this
sector, which is also the largest exporting industry in Bangladesh. It has attained a high
profile in terms of foreign exchange earnings, exports, industrialization and contribution to
GDP within a short span of time. The industry plays a significant role in terms of
employment generation. Nearly three million workers are directly and more than ten
million inhabitants are indirectly associated with the industry. In addition to its economic
contribution, the expansion of RMG industry has caused noticeable changes by bringing
more than 2.5 million women into the workforce. RMG‟s growing contribution to GDP is
remarkable; it has reached 13 percent of GDP in 2010 compared to about 3 percent in
1991. It also plays a pivotal role to promote the development of other key sectors of the
economy like banking, insurance, shipping, courier services, hotel, tourism, road
transportation, railway container services, etc.
Table 1.9 Growth of the RMG sector
Year
Export Volume
(‘000 dozen)
Export Value
(US$ million)
Share in Total
Exports (%)
1990-91 30,566.60 866.8 30,566.60
1995-96 72,005.00 2,547.10 65.6
1999-2000 111,905.80 4,349.40 75.6
2001-02 140,444.60 4,583.80 76.6
2002-03 152,013.00 4,912.09 75.1
2003-04 182,080.00 5685.76 74.8
2003-04 212,390.00 6424.27 74.8
2005-06 273,840.00 7899.59 75.1
2006-07 332,620.00 9211.31 75.6
2007-08 389,030.00 10699.8 75.8
2008-09 460,510.00 12348.2 79.5
27
Since the inception of the trade liberalization program in the early 1990‟s, the
RMG sector has grown by leaps and bounds (Table 1.9). From a miniscule share of about
4 percent in total exports in the early 1980s, garments now constitute more than 80 percent
of total exports from Bangladesh, raking in nearly $12.5 billion of foreign exchange, out of
total export earnings of $15.5 billion in 2008-09. Net domestic value addition–hitherto a
weak point, on account of the heavy dependence of the sector on imported fabrics, yarn
and accessories–has risen substantially, so much so that nearly 60 percent of the required
inputs are now domestically sourced, as compared to a mere 36 percent in 1991-92.
One of the key advantages of the RMG industry is its cheap labor force, which
provides a competitive edge over its competitors. The sector has created employment
opportunities for about three million people of which 80 percent are women who mostly
come from rural areas. Notwithstanding the fact that this sector‟s emergence and
expansion is the direct outcome of the global MFA regime, there is no denying that it has
had a stellar impact on overall economic growth, income generation and poverty reduction
in Bangladesh
Since the late 70s government initiative such as special bonded warehouse
schemes, duty drawback systems and export policy reforms (mid eighties) all helped the
RMG sector to operate in almost a free trade environment .Currently, there are nearly
5,000 RMG firms in Bangladesh. More than 95 per cent of those firms are locally owned
with the exception of a few foreign firms located in export processing zones. The RMG
firms are located mainly in three main cities: the capital city Dhaka, the port city
Chittagong and the industrial city Narayanganj. Garment companies in Bangladesh form
formal or informal groups. The grouping helps to share manufacturing activities, and to
diversify risks; horizontal as well as vertical coordination can be easily found in such
group activities.
Readymade garments manufactured in Bangladesh are divided mainly into two
broad categories: woven and knit products. Shirts, and trousers are the main woven
products and undergarments, socks, stockings, T-shirts, sweaters and other casual and soft
garments are the main knit products. Woven garment products still dominate the garment
export earnings of the country. The share of knit garment products has been increasing

28
since the early 1990s; and now accounts for just over 50% of the country‟s total RMG
export earnings. Although various 85 types of garments are manufactured in the country,
only a few categories, such as shirts, T shirts, trousers, jackets and sweaters, constitute the
major production-share. The United States was the main export destination for
Bangladeshi RMG products in the early 1990s followed by the European Union, but the
European Union has surpassed the United States over time. These two destinations
generate more than 90 per cent of the total RMG export earnings of Bangladesh (Table
1.10).
Table 1.10 Bangladesh RMG Exports to EU and US (in million USD)
Year EU US
2007 6036.2 3191.2
2008 6480.2 3537.5
2009 6998.7 3519.7
2010 7783.7* 4076.3*
It is important to note that the RMG sector helped create jobs in complementary
industries or services, such as accessories, packaging, toiletries (demanded by newly
employed female RMG workers), courier, finance, transport and telecommunications
services, etc. BGMEA claims that the RMG sector creates as many jobs in these
complementary enterprises as there are in RMG units themselves. Although RMG operates
in a free trade enclave environment, its growth is clearly based on Bangladesh‟s
comparative advantage in a labor- and non-skill intensive activity – one that has been
sustained by trade and exchange liberalization in addition to the quota regime offered
under the MFA.
While the export-quota system cushioned the Bangladesh RMG industry,
enabling it to remain competitive as a prominent garment supplier in international markets
until 2004, the phase-out of the system was expected by many analysts to threaten the very
survival of this industry. That apprehension was proved wrong as RMG exports continued
to grow after 2005 putting Bangladesh securely on the world map as a leading exporter of
garments. Yet there are challenges. Backward and forward linkage expansion, meeting

29
compliance standards, product/market diversification and upgrades are some important
strategies for the industry to improve competitiveness and seize global opportunities.
Thanks to domestic investments in textiles, the consumption-production gap of
yarn decreased over time, although actual consumption increased every year. The fabric-
manufacturing capacity of the country also increased over time. Such a trend indicates that
the linkage expansion process of the Bangladesh RMG industry, started in the early 1990s,
has not lost momentum. Still, many garment manufacturers in Bangladesh are prefer using
imported raw materials instead of using local raw materials owing to price and quality
differences. The price of RMG inputs supplied by local sources is relatively high.
Bangladesh is just a price taker in sourcing RMG inputs from external sources, whereas
competitor countries such as India and China have a certain level of influence on RMG
input pricing, as they themselves are prominent textile suppliers in the world market.
In addition to speedy supply, the social dimensions of the RMG industry are
getting more attention from consumers, social workers, welfare organizations and brand
name international buyers. Currently, many international buyers demand compliance with
their “code of conduct” before placing any garment import order. Although Bangladesh
was able to solve the problem of child labor very successfully in the mid-1990s, the
country‟s performance in improving the factory working environment is not yet
satisfactory. Informal recruitment, low literacy levels, wage discrimination, irregular
payment and short contracts of service are very common practices in the RMG factories in
Bangladesh. It is true that the country still enjoys some comparative advantage in
manufacturing garment products based on low labor costs.
However, such advantages cannot be sustained forever nor can they be expected
from a humanitarian perspective. Rented factory premises, narrow staircases, low roofs,
closed environments, absence of lunch rooms, unavailability of clean drinking water and
no separate toilets or common rooms for female workers, low wages etc are other concerns
in the garment factories of Bangladesh.
The product and market composition of garments from Bangladesh requires
special attention to ensure the long-term sustainability of the Bangladesh RMG industry as
a prominent supplier in the global market. The export-quota system diverted the attention

30
of some international garment suppliers from quantitative expansion to qualitative
improvement of exportable garment products. China and other competitor countries took
that opportunity, but Bangladesh failed to do likewise. The country stands far behind in the
race to upgrade products compared with its rivals. Bangladesh is still focused on
manufacturing lower-end products, although recently the country has emerged slowly from
being a lower-end producer towards becoming a middle/high-end producer, from being a
simple male-wear producer to become a producer of fashionable female wear.
Strengthening the process of upgrading products is very important for the Bangladesh
RMG industry if it is to enhance its competitiveness and continue to augment foreign
exchange earnings. Medium-term Goals for the RMG Sector
Diversify export destination.
Improve supply of both skilled and unskilled workers.
Improve the availability of more skilled people in the managerial levels
Further product diversification
Vertical integration, developing brand name
Improve competitive edge through higher productivity, investment in R&D
Produce more high value goods
Strategies under the SFYP
Have both Bilateral and Multilateral agreements with various countries
BGMEA and BKMEA will have to invest more in their training facilities
to increase and improve on both coverage and training curriculum.
Improve capacity of owners of RMG by providing training on how to
move up the value chain.
Public infrastructure (such as electricity and roads etc) would have to
improve to ensure that RMG factories are operating at full capacity.
Political stability along with other features pertinent to the enabling
environment has to be improved in order to attract more FDI and make the
business environment more conducive for business.
Greater use of IT in order to quicken the pace at which business is
conducted both with local and international counterparts.

31
Chapter-2
Objectives and Methodology
2.1 Objectives of the Present Work
The following specific objectives and areas of scope have been identified for the
study:
a. To identify the current status of electricity and gas supply in the RMG sector
of Bangladesh.
b. To identify the links of power supply (electricity and gas) and production in
the RMG sector in the context of Bangladesh
c. Implications of inadequate power supply on RMG Business
i) Meeting deadline of RMG exports and power supply
ii) Lead time, quality and power supply
iii) Alternative sources of power supply and their implications
iv) Overall effect to the growth of this sector
2.2 Outline of the Methodology
i) The selection of RMGs will follow the proportional representation of
knitwear, woven and sweater production units; proportional representation
of RMG units of different sizes i.e. large, small and medium will be
categorized based on the level of production/power consumption;
proportional representation of geographical locations of RMG units;
representation of complaint and non-compliant RMG units.
ii) A set of questionnaire is developed for the selected RMG enterprises. Once
the questionnaire is prepared, a sample pretest will be conducted in a RMG
firm. The questionnaire will be revised based on the pretest if required.

32
iii) Relevant cases will be collected to identify the impact of shortage of power
supply under different circumstances which will supplement the survey
evidence to attain the objectives of the study.
iv) The collected, cleaned, and entered data will be analyzed.

33
Chapter-3
Data Analysis and Results
Chittagong Export Processing Zone (CEPZ), also known as Chittagong EPZ, is
the first and one of the eight export processing zones in Bangladesh located at South
Halishahar in Chittagong. There are 500 industries in Chittahong EPZ. But due to
restrictions of time, capacity, sufficient manpower and financial support, it was impossible
for us to cover a good percentage of garment industries for necessary data and calculation.
Then we tried to estimate an approximate value of the above tasks for all the industries
(about 500) using the relevant data and calculations of the four industries. The industries
which were visited for collecting required data to achieve solutions for the above tasks are:
Regency Garments Ltd
Youngone Garments
Univogue Garments Co. Ltd.
Pacific Jeans Ltd.
3.1 Required Queries and Information Collected from Industries
The necessary list of questionnaire or queries, the data of which we collected
from the above RMG industries consist the following:
Total production and use of power
Total number of lines, floors and workers in different sections.
Targeted output for each section.
Requirements of electricity and gas supply by studying electricity bills.
Supply status of electricity and gas supply (both in peak and off-peak hours)
Alternative source of power to meet the inadequate supply
Type and cost of alternative source of power
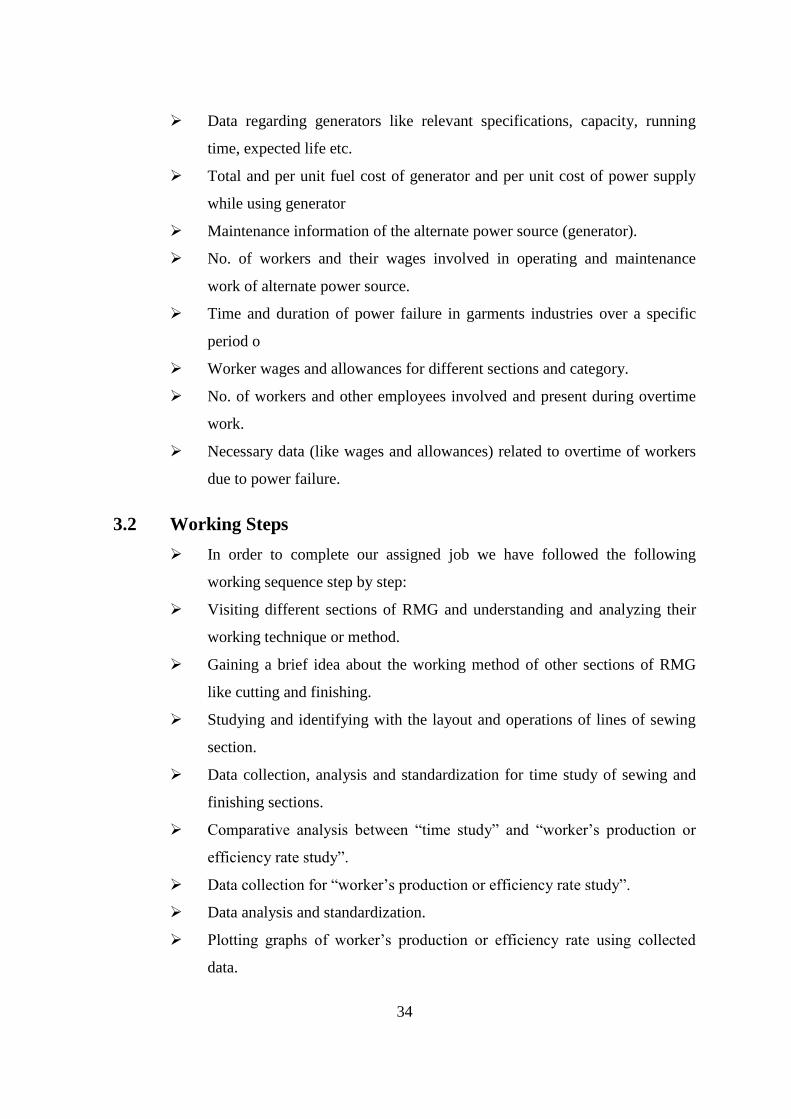
34
Data regarding generators like relevant specifications, capacity, running
time, expected life etc.
Total and per unit fuel cost of generator and per unit cost of power supply
while using generator
Maintenance information of the alternate power source (generator).
No. of workers and their wages involved in operating and maintenance
work of alternate power source.
Time and duration of power failure in garments industries over a specific
period o
Worker wages and allowances for different sections and category.
No. of workers and other employees involved and present during overtime
work.
Necessary data (like wages and allowances) related to overtime of workers
due to power failure.
3.2 Working Steps
In order to complete our assigned job we have followed the following
working sequence step by step:
Visiting different sections of RMG and understanding and analyzing their
working technique or method.
Gaining a brief idea about the working method of other sections of RMG
like cutting and finishing.
Studying and identifying with the layout and operations of lines of sewing
section.
Data collection, analysis and standardization for time study of sewing and
finishing sections.
Comparative analysis between “time study” and “worker‟s production or
efficiency rate study”.
Data collection for “worker‟s production or efficiency rate study”.
Data analysis and standardization.
Plotting graphs of worker‟s production or efficiency rate using collected
data.
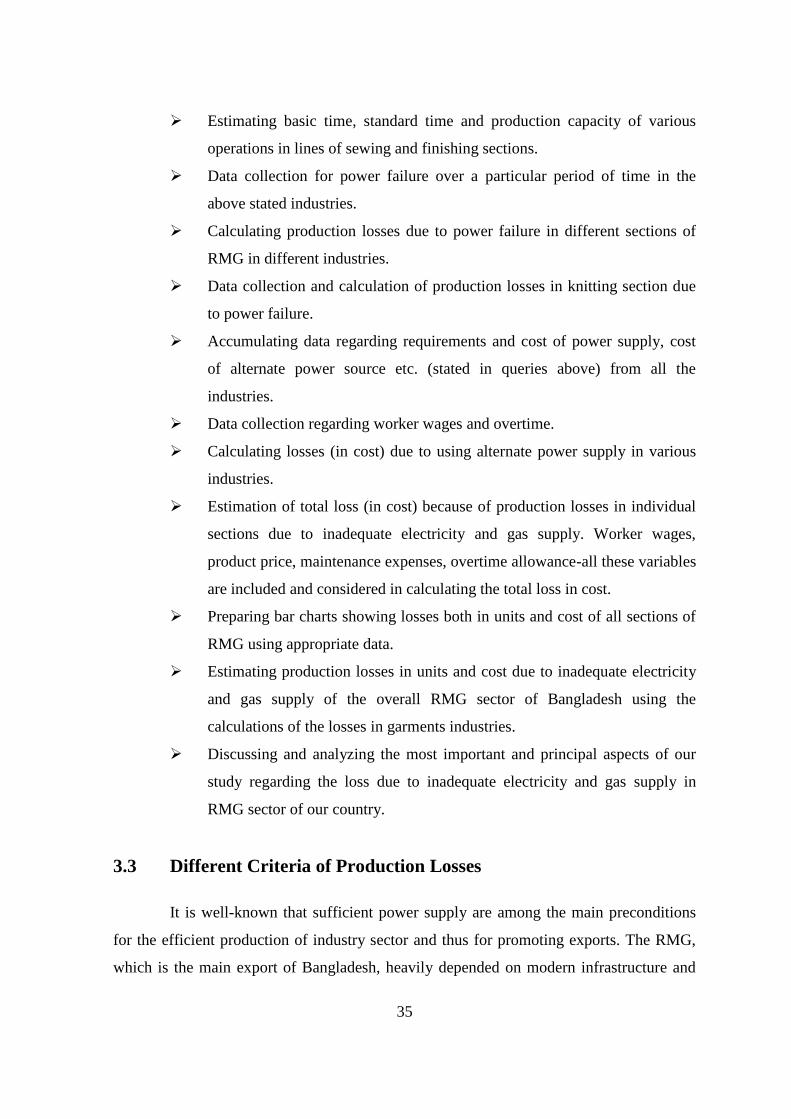
35
Estimating basic time, standard time and production capacity of various
operations in lines of sewing and finishing sections.
Data collection for power failure over a particular period of time in the
above stated industries.
Calculating production losses due to power failure in different sections of
RMG in different industries.
Data collection and calculation of production losses in knitting section due
to power failure.
Accumulating data regarding requirements and cost of power supply, cost
of alternate power source etc. (stated in queries above) from all the
industries.
Data collection regarding worker wages and overtime.
Calculating losses (in cost) due to using alternate power supply in various
industries.
Estimation of total loss (in cost) because of production losses in individual
sections due to inadequate electricity and gas supply. Worker wages,
product price, maintenance expenses, overtime allowance-all these variables
are included and considered in calculating the total loss in cost.
Preparing bar charts showing losses both in units and cost of all sections of
RMG using appropriate data.
Estimating production losses in units and cost due to inadequate electricity
and gas supply of the overall RMG sector of Bangladesh using the
calculations of the losses in garments industries.
Discussing and analyzing the most important and principal aspects of our
study regarding the loss due to inadequate electricity and gas supply in
RMG sector of our country.
3.3 Different Criteria of Production Losses
It is well-known that sufficient power supply are among the main preconditions
for the efficient production of industry sector and thus for promoting exports. The RMG,
which is the main export of Bangladesh, heavily depended on modern infrastructure and

36
adequate power supply in their process of production. However the RMG have been facing
with huge trouble particularly loss of production and cost of production is increasing
extensively with insufficient supply of gas and electricity during recent period. Many
garments factories are now considerably relying on alternative power supply as generators.
However, the diesel-run generators are expensive to the RMG producers though the
government has been supporting the sector by providing subsidies on diesel. Power supply
through generators are not also working as perfect substitute of electricity and gas supply,
and have been causing depletion of the garments machineries. Moreover, the removal of
subsidies by the government in near future would worsen the situation further.
As stated above, garments industries are facing loss of production in a huge extent
due to unwanted power failure or inadequate electricity and gas supply and there are
various criteria of these production losses. All the production losses can initially be placed
in two categories (i) Direct losses and (ii) Indirect losses.
Direct losses are the visible losses due to insufficient power supply which can
easily be detected and which are directly responsible for increasing the cost of production
in a large extent. Such losses can be calculated in product unit and can also be converted in
cost or price. Some of the direct losses are:
Due to inadequate power supply, sometimes the industries lag behind in
achieving their desired output or target. Although there can be alternate power supply in
almost all the RMG industries in our country, but it is not necessary that the alternate
source which can be gas or diesel generator can continue the operation of all the machines
in all the sections of the industry. So, if one section or few machines are facilitated with
the supply of alternate power, other remains idle waiting for the regular power supply.
Again it is also a matter of significance that the alternate supply takes some time to start
the supply of power and by this time the machines and workers stay idle. Generator defect,
maintenance activities, fuel problems, technical faults etc. are also important reasons
behind the delay or improper service of the generator. Because of all these reasons, the
industries often fail to achieve their goal of desired output and bear a wholesome amount
of loss.

37
Because of frequent power failure, most of the industries use temporary power
supply source such as gas generator or diesel generator. The frequencies of using these
sources vary from one industry to another. In some industries, gas generator is the main
source of power supply which serves almost the whole industry with or without a parallel
power supply line from the government controlled PDB. Whether in some industries the
PDB provided supply line is the main power supply with mainly diesel generator used
during power failure. Mainly, large composite industries use one or more gas generators
for the whole or some sections of the industry which are their own power supply source as
their first priority. But medium and small industries specially the RMG industries
generally use PDB power supply and then diesel generator during scarcity of PDB supply.
But in whatever ways the industries use the alternate power supply, they have to
bear a cost and this excessive cost can easily be converted into the loss of the industries
because if there were adequate power supply, there would not be any need of these costs.
Cost for buying, set-up, maintenance, fuel, repair, depreciation of generators can be
regarded as a kind of loss due to power failure or inadequate power supply in RMG
industries.
As mentioned before, because of many unavoidable reasons, many times workers
and machines remain idle may be in the peak hour of their work. As the wages of the
workers are predefined in a daily or monthly basis, they have to be paid their specific
wages whether they work for the full working time or not. They have to be paid for the
non-productive time also which they could not work because of inadequate electricity and
gas supply because they are not responsible for this break. But the industry has to suffer in
the long run and bear some losses as they are paying the worker for the time which did not
bring them any output or product.
If the industry cannot fulfill their desired target in the usual working hour, they
have to arrange overtime for their workers to finish the target before the deadline of the
buyer. Losses due to overtime can be classified into two major criteria like (i) losses due to
excess power supply and (ii) losses due to extra labor expenses.
Overtimes are mainly done at night as the day is the regular working time
(usually from 8 A.M to 5 P.M) in almost all the industries. Obviously power supply is also

38
needed in overtime like the whole day whether it is the PDB supply line or the generators
or both. According to the rules of PDB, hours after 5 P.M. are decided as “Peak Hours”
which means that during these hours per unit cost of power supply is more than the “Off-
peak Hours” (before 5 P.M.). Again, generators‟ running costs during load-shedding are
also included with the above cost. All these excess costs are a source or reason for losses.
Again, for overtime, the workers have to be provided with almost double of their
hourly wages along with some allowances for food which vary from one industry to
another. This can also be accounted for as a source of loss for the industry.
Fig.3.1 Losses due to extra labor expenses during overtime
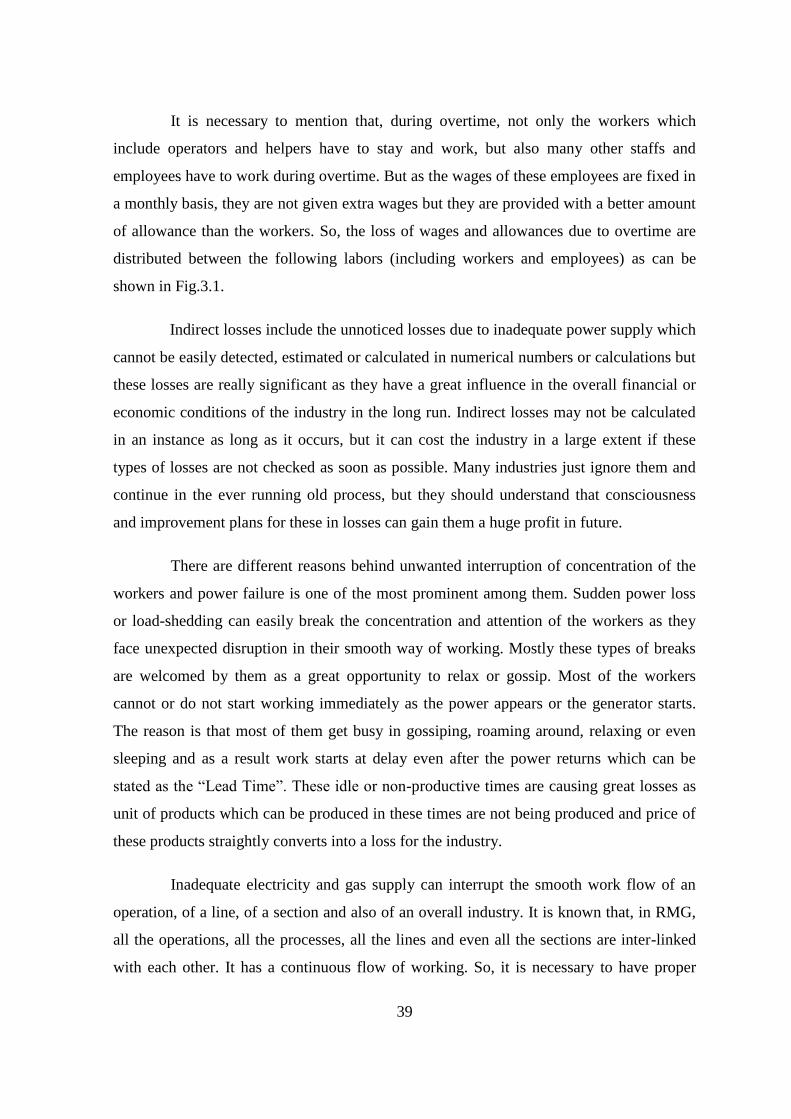
39
It is necessary to mention that, during overtime, not only the workers which
include operators and helpers have to stay and work, but also many other staffs and
employees have to work during overtime. But as the wages of these employees are fixed in
a monthly basis, they are not given extra wages but they are provided with a better amount
of allowance than the workers. So, the loss of wages and allowances due to overtime are
distributed between the following labors (including workers and employees) as can be
shown in Fig.3.1.
Indirect losses include the unnoticed losses due to inadequate power supply which
cannot be easily detected, estimated or calculated in numerical numbers or calculations but
these losses are really significant as they have a great influence in the overall financial or
economic conditions of the industry in the long run. Indirect losses may not be calculated
in an instance as long as it occurs, but it can cost the industry in a large extent if these
types of losses are not checked as soon as possible. Many industries just ignore them and
continue in the ever running old process, but they should understand that consciousness
and improvement plans for these in losses can gain them a huge profit in future.
There are different reasons behind unwanted interruption of concentration of the
workers and power failure is one of the most prominent among them. Sudden power loss
or load-shedding can easily break the concentration and attention of the workers as they
face unexpected disruption in their smooth way of working. Mostly these types of breaks
are welcomed by them as a great opportunity to relax or gossip. Most of the workers
cannot or do not start working immediately as the power appears or the generator starts.
The reason is that most of them get busy in gossiping, roaming around, relaxing or even
sleeping and as a result work starts at delay even after the power returns which can be
stated as the “Lead Time”. These idle or non-productive times are causing great losses as
unit of products which can be produced in these times are not being produced and price of
these products straightly converts into a loss for the industry.
Inadequate electricity and gas supply can interrupt the smooth work flow of an
operation, of a line, of a section and also of an overall industry. It is known that, in RMG,
all the operations, all the processes, all the lines and even all the sections are inter-linked
with each other. It has a continuous flow of working. So, it is necessary to have proper
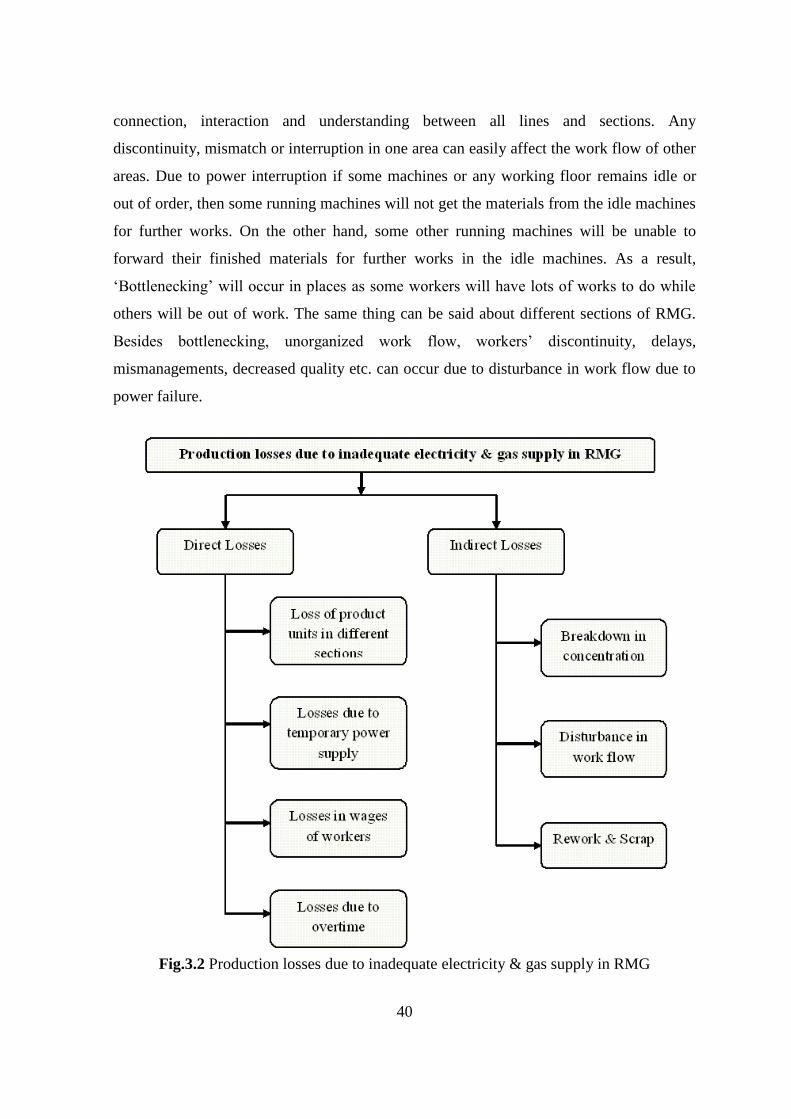
40
connection, interaction and understanding between all lines and sections. Any
discontinuity, mismatch or interruption in one area can easily affect the work flow of other
areas. Due to power interruption if some machines or any working floor remains idle or
out of order, then some running machines will not get the materials from the idle machines
for further works. On the other hand, some other running machines will be unable to
forward their finished materials for further works in the idle machines. As a result,
„Bottlenecking‟ will occur in places as some workers will have lots of works to do while
others will be out of work. The same thing can be said about different sections of RMG.
Besides bottlenecking, unorganized work flow, workers‟ discontinuity, delays,
mismanagements, decreased quality etc. can occur due to disturbance in work flow due to
power failure.
Fig.3.2 Production losses due to inadequate electricity & gas supply in RMG

41
Inadequate power supply is an important reason behind rework and scrap which
are internal failures of the industries. As the costs of them are borne by the industry itself,
it is obviously regarded as a loss. Breakdown of concentration of the workers, old-model
machines, non-capability of certain machines to operate smoothly in less power, unwanted
interruption in the middle of a certain time consuming process etc. are the main reasons of
rework and scrap due to power failure. Fig.3.2 shows the various production losses.

Chapter-4
Production Loss of Various Garments
Regency Garments is renowned all over the world for its Sourcing,
Manufacturing and exporting of garments and made-ups. Ever since its inception, the
company has sought to meet the needs & requirements of the global market. We have all
core facilities integrated to assure in-time deliveries. Regency Yarns, Regency Sourcing
Intl & Regency Garments serves as professionally managed group together with a
commitment to quality & customer satisfaction that has enabled it to carve a niche for
itself in the competitive market scenario of today. Regency with its meticulous care and
high-quality easy-care fabrications, manage to be on the edge of the newest technology
without compromising comfort and value
Regency, a cogent name in manufacturing and export market of the Knitwear
Capital of India, Tirupur, caters to the cross section of the quality conscious medium and
small-sized global clientele has appeared on the horizon of apparel industry over a decade
back. The entrepreneurial visionary promoters of Regency were instrumental in laying
sound foundations for the organization in terms of:
Excellence in production and services,
Dynamism in its attitude towards state-of-the-art technology and modern
management,
A committed work force worthy of delivering quality product on schedule
under the guidance of professionally competent executives in ergonomically
healthy environment and interactive milieu.
The mission of this garment are:

43
To recognize our customer needs & to develop products those are suitable
for the ever-changing consumer requirements.
To pursue continuous & Consistent growth for mutual betterment with trust
and ethical practices focusing on a long term prosperous business
relationship.
To ensure a good organizational culture & climate.
To deliver the product with quality & commitment as required by
customers.
4.1 Production Losses in Different Sections
Time study is very much essential tool for work measurement and it can be done
by the calculation of standard minute value (SMV). In this work, SMV was calculated
based on individual task by time studies on several production lines and in case of variety
products. For the calculation of SMV, allowance (for machine, personal & bundle) factor
was added with the basic time whereas basic time was determined by multiplying worker‟s
performance rating with the cycle time. Cycle time means total time taken to do all tasks to
complete one operation, i.e. time from peak up part of first piece to next peak up of the
next piece. Average cycle time was counted after measuring time for five repetitive
operations with a stop watch by standing side of every worker during different periods of a
day. The measurement was avoided if found any abnormal time in the process. The
procedure was repeated for all operations in a production line and cycle time was
measured accordingly.
The processing time exists simply because the process requires tasks and motion.
The working method and the numbers of work components are closely related to the net
processing time. The time study begins by measuring the number of time required to “lift,
sew and place” something. It then proceeds to make improvements based on time values,
and ends by defining the differences in the time values caused by the individual
differences of the workers. The purposes of processing time are as follows:
To understand the production capacity of the factory and to draw up plans
for an appropriate target of output, suitable range of divided labor and
optimum production (scheduling, personnel planning or equipment
planning).

44
To investigate the level of the individual skill
To provide benchmarks for improvements
For use as a standard of evaluating the operations
To draw up plans and make estimates for a change of products or for the
construction of a new or additional factor
To obtain an evaluation standard for receiving, planning, using the time
study as basis of the cost estimation and control
For use as the basis for determining the unit cost of manufacturing and the
wage rate
For use as the basis for introducing a production control system
The standard time is the time required to complete one unit of work according to
the predetermined operation method by a worker with an average skill under the
predetermined working condition.
The three factors given here are the working condition, operation method and the
worker‟s skill. Of these factors, the worker‟s skill in particular has a great influence on the
processing time. The individual differences in skill, results in differences in the processing
time. If it is possible to mathematically understand the individual differences as a unified
level value. The standard time setting may be used for the following purposes:
To improve the accuracy of the planning (target)
To assign worker in an appropriate manner
To understand the teaching skill of the individual workers
To set the direction of efforts aimed at improving skills
Standard Time = Time Measure × Worker Rating × (1 + Allowance Rate)
The standard allowance rate is very difficult to determine. It is indicated
unconditionally as a certain number, since it may change due to the effect various factors.
Consequently each factory should determine the allowance rate after thoroughly study and
investigation. The standard allowance rate is normally used in sewing is 12% to 18%
(outside multiplication method). Fluctuating factor in the allowance rate are as follows:

45
Work details
Number of process allotted to the workers
Specifications (design, material)
Initial process, intermediate process, final process
Degree of skill of the worker
Size of the lot
Type of model
4.2 Aspects of Formulating the Overall Production or Efficiency
At first, the applied procedure for calculating the standard time of each process
was Time Study. For applying the time study, firstly we selected a particular line of sewing
section in which a single type of garment was being produced. Then ten consecutive data
representing the needed time for each and every process were recorded. For example,
back-tack is a process needed in making a round neck T- shirt. So, we recorded the time
needed for finishing a single back-tack operation and in this way we collected total ten
individual data. Thus data were collected for every operation of a line in making a round
neck T- shirt. Then the average time for every operation was calculated considering an
allowance of 30% (confirmed by the industry) and unbundling time of two seconds in
average. From these calculations process and line capacity along with the efficiency of the
workers can be established comparing standard and actual outputs.
But if we take a closer view about the overall “Time Study” procedure described
above, some deficiencies can be identified. Average of only ten consecutive data cannot
perfectly represent the needed time of a particular process. This is because all the ten data
are taken one after the other in a particular time without any time interval. But it is not at
all necessary that a particular worker doing a specific operation will take almost similar
time for each job/product.
After observing and also taking necessary data, we obtained the proof of the
above statement that the efficiency of the worker changes with time showing a variation in
different times of a day. The reasons behind that can be unwanted power failure, lack of
concentration, machine defect, maintenance problem, rework and scrap, bottle-necking,
health and safety issues, lack of infrastructures etc and many more.

46
So, the more efficient and intelligent technique to calculate the standard output of
the worker for an operation is to observe him/her for a whole day. So, we collected data of
the needed time for a single operation in every ten or fifteen minutes time intervals. After
every ten or fifteen minutes, five observations were recorded for a specific worker which
continued the whole day. Finally the average of the whole collected observations was
calculated and standard time for a process was obtained considering allowance as
mentioned above. It is done in the same manner for all the operations in a line for
producing a specific type of garment. The following comprehensive process can be used
easily to identify the advantages comparing with the Time Study process like:
As in this process the working capacity of a worker for his/her defined job
is recorded for the whole day, the calculated standard time will be much
more accurate and precise.
If the data of observing time and process time are plotted in a graph, a curve
can be gained showing the variation of the working capacity of the worker
in the whole day.
From the graph mentioned in the previous point, some different times can
be marked in which the efficiency of various type of workers slows down,
rises, achieve peaks or falls down.
As the particular times of low efficiency can be detected in this procedure, it
will be much easier to analyze the reasons behind this low efficiency.
By analyzing the reasons, the administration of the industry can take
necessary initiatives to improve the efficiency in the particular times when
the efficiency is alarmingly low.
The types of workers can be categorized according to their working
capacity following the graph mentioned before.
As power failure is a common phenomenon in the RMG sector of our
country, if power failure occurs in times when the worker efficiency is high,
the production loss will be more than other times. These losses can be
counted by this procedure.
Fig.4.1 to Fig.4.18 shows the variation of production in different section of
different products. Table 4.1 to Table 4.6 shows the production in different section of
different product due to inadequate supply of electricity.
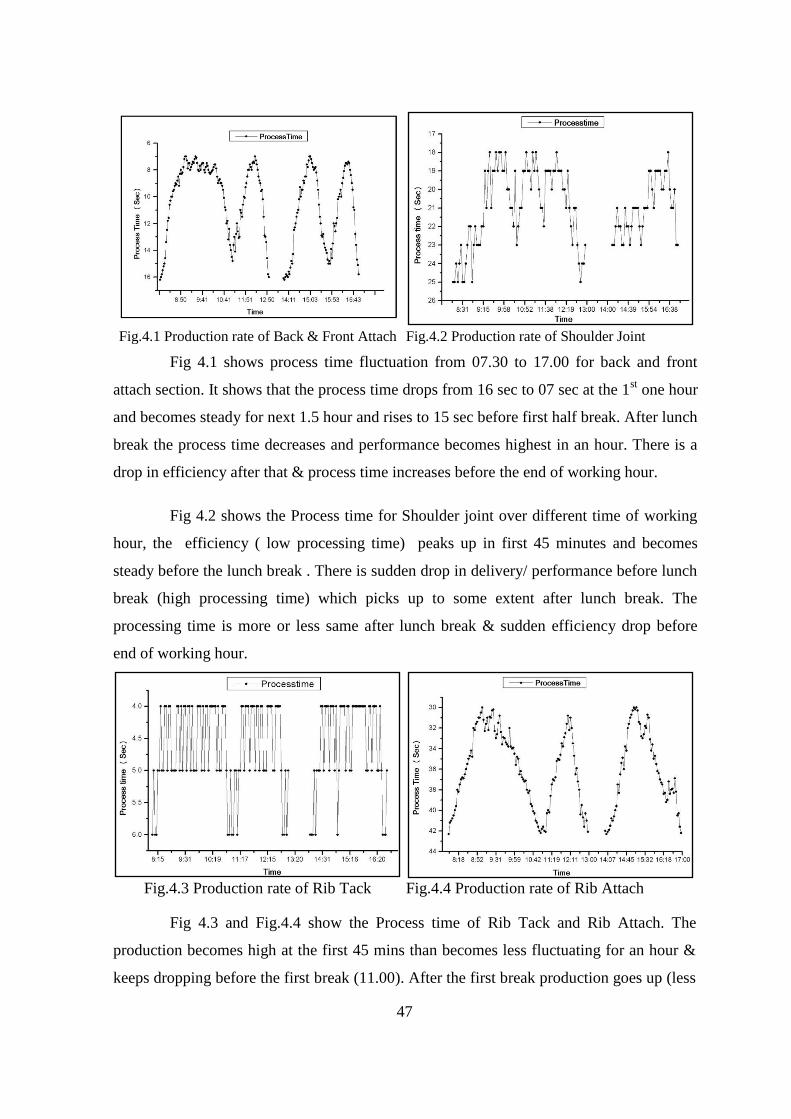
47
Fig.4.1 Production rate of Back & Front Attach Fig.4.2 Production rate of Shoulder Joint
Fig 4.1 shows process time fluctuation from 07.30 to 17.00 for back and front
attach section. It shows that the process time drops from 16 sec to 07 sec at the 1st one hour
and becomes steady for next 1.5 hour and rises to 15 sec before first half break. After lunch
break the process time decreases and performance becomes highest in an hour. There is a
drop in efficiency after that & process time increases before the end of working hour.
Fig 4.2 shows the Process time for Shoulder joint over different time of working
hour, the efficiency ( low processing time) peaks up in first 45 minutes and becomes
steady before the lunch break . There is sudden drop in delivery/ performance before lunch
break (high processing time) which picks up to some extent after lunch break. The
processing time is more or less same after lunch break & sudden efficiency drop before
end of working hour.
Fig.4.3 Production rate of Rib Tack Fig.4.4 Production rate of Rib Attach
Fig 4.3 and Fig.4.4 show the Process time of Rib Tack and Rib Attach. The
production becomes high at the first 45 mins than becomes less fluctuating for an hour &
keeps dropping before the first break (11.00). After the first break production goes up (less
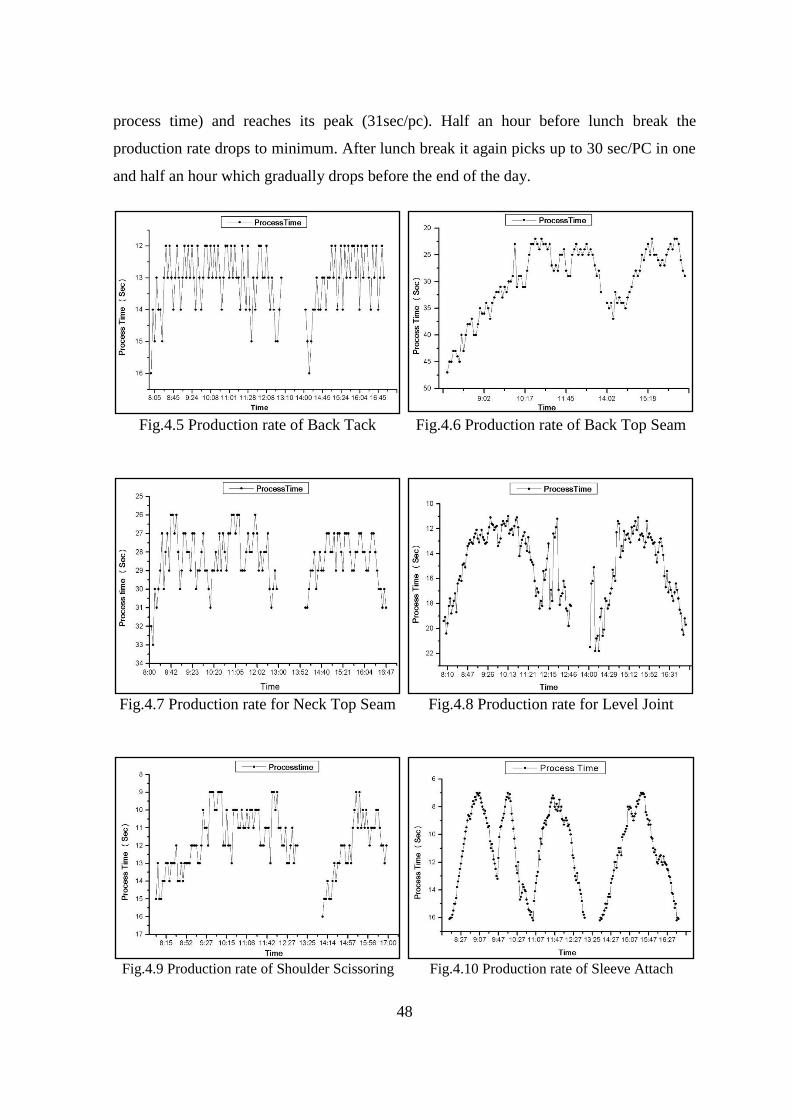
48
process time) and reaches its peak (31sec/pc). Half an hour before lunch break the
production rate drops to minimum. After lunch break it again picks up to 30 sec/PC in one
and half an hour which gradually drops before the end of the day.
Fig.4.5 Production rate of Back Tack Fig.4.6 Production rate of Back Top Seam
Fig.4.7 Production rate for Neck Top Seam Fig.4.8 Production rate for Level Joint
Fig.4.9 Production rate of Shoulder Scissoring Fig.4.10 Production rate of Sleeve Attach

49
Fig.4.11 Production rate of Sleeve Tack Fig.4.12 Production rate of Sleeve Joint
Fig.4.13 Production rate of Armor Top Seam Fig.4.14 Production rate of Side Joint
Fig.4.15 Production rate of Sleeve Hem Fig.4.16 Production rate of Body Back

50
Fig.4.17 Production rate of Body Hem Fig.4.18 Production rate of Thread Cutting
Similar result can be seen in Fig.4.5 to Fig.4.18. From Fig. 4.1 to Fig 4.18, it is
seen that the production rate fluctuation is almost same throughout the day. The production
rate rises consistently for the first one hour and becomes steady for half an hour and seems
dropping before around 10.00. Production again picks up after first break and drops before
lunch break. After lunch break it again rises to maximum and drops again before end of the
day.
Table 4.1 Production losses in different sections due to power failure in a day
Sections Targeted Output Production Losses
Cutting Section 3,125 Pcs/hr 3,386 Pcs
Sewing Section 3270 Pcs/hr 3,811 Pcs
Finishing Section 3,300 Pcs / hr 3,622 Pcs
Table 4.2 Losses for wages and allowances in different sections due to power failure per
day on average
Sections Total time taken to start the
production after the power failure
occurred at the PDB lines
Losses for
wages (Tk)
Losses for
allowance
(Tk)
Total
losses
(Tk)
Cutting section 3,900 sec 4,387.5 1,495 5882.5
Sewing section 4,201 sec 39,760.8 12,675 52,435.9
Finishing section 3,569 sec 6,205.1 1,870 8,075.1
Electricity cost for
overtime period 4,020 sec 5,410.92
Total: 71,804.4
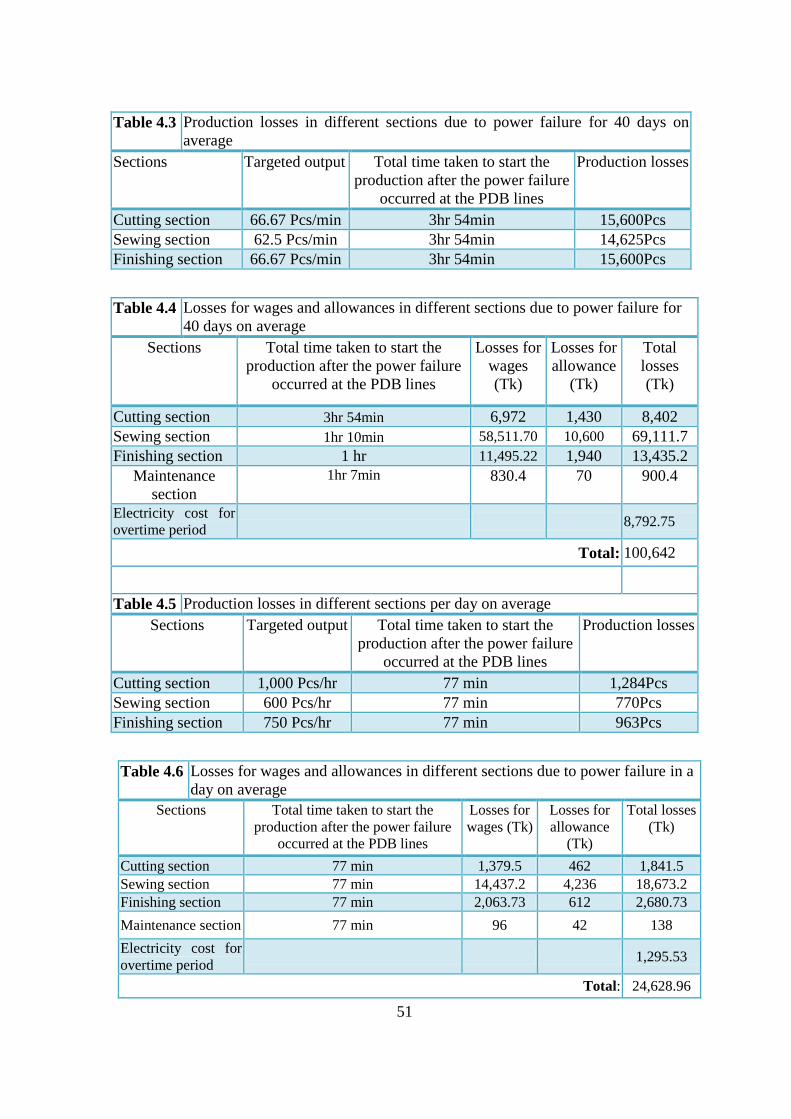
51
Table 4.3 Production losses in different sections due to power failure for 40 days on
average
Sections Targeted output Total time taken to start the
production after the power failure
occurred at the PDB lines
Production losses
Cutting section 66.67 Pcs/min 3hr 54min 15,600Pcs
Sewing section 62.5 Pcs/min 3hr 54min 14,625Pcs
Finishing section 66.67 Pcs/min 3hr 54min 15,600Pcs
Table 4.4 Losses for wages and allowances in different sections due to power failure for
40 days on average
Sections Total time taken to start the
production after the power failure
occurred at the PDB lines
Losses for
wages
(Tk)
Losses for
allowance
(Tk)
Total
losses
(Tk)
Cutting section 3hr 54min 6,972 1,430 8,402
Sewing section 1hr 10min 58,511.70 10,600 69,111.7
Finishing section 1 hr 11,495.22 1,940 13,435.2
Maintenance
section
1hr 7min 830.4 70 900.4
Electricity cost for
overtime period 8,792.75
Total: 100,642
Table 4.5 Production losses in different sections per day on average
Sections Targeted output Total time taken to start the
production after the power failure
occurred at the PDB lines
Production losses
Cutting section 1,000 Pcs/hr 77 min 1,284Pcs
Sewing section 600 Pcs/hr 77 min 770Pcs
Finishing section 750 Pcs/hr 77 min 963Pcs
Table 4.6 Losses for wages and allowances in different sections due to power failure in a
day on average
Sections Total time taken to start the
production after the power failure
occurred at the PDB lines
Losses for
wages (Tk)
Losses for
allowance
(Tk)
Total losses
(Tk)
Cutting section 77 min 1,379.5 462 1,841.5
Sewing section 77 min 14,437.2 4,236 18,673.2
Finishing section 77 min 2,063.73 612 2,680.73
Maintenance section 77 min 96 42 138
Electricity cost for
overtime period 1,295.53
Total: 24,628.96

Conclusions
The aim of BGMEA is to encourage manufacturing of quality products to
compete the competitive World Market through enhancing production of RMG sector. It is
committed to protect the interest of its members; helps and influences the Government to
formulate pro-growth policies for the sector; and encourages its members constantly to
attain development of skill and efficiency of workers and management personnel. BGMEA
keeps regular contacts with labor organizations for harmonious worker-management
relations and committed to implement all legitimate rights and privileges of garment
workers. Very importantly, BGMEA maintains liaison with local and global trade bodies
and UN agencies, and bridges interactions between the local exporters and international
buyers by arranging fairs in Bangladesh and participates with its members in international
fairs in USA, Europe, Russia, Japan and other countries.
It is well-known that sufficient power supply are among the main preconditions
for the efficient production of industry sector and thus for promoting exports. The RMG,
which is the main export of Bangladesh, heavily depended on modern infrastructure and
adequate power supply in their process of production. However, the RMG have been
facing with huge trouble particularly loss of production and cost of production is
increasing extensively with insufficient supply of gas and electricity during recent period.
Many garments factories are now considerably relying on alternative power supply as
generators. However, the diesel-run generators are expansive to the RMG producers
though the government has been supporting the sector by providing subsidies on diesel.
Power supply through generators are not also working as perfect substitute of electricity
and gas supply, and have been causing depletion of the garments machineries. Moreover,
the removal of subsidies by the government in near future would worsen the situation
further.

53
The overall production loss in the whole RMG sector (estimated for 3500 RMG
industries) is accounted individually for different sections. The amount of loss for the
overall cutting, sewing and finishing section of RMG sector is consecutively 21.102
million, 19.045 million and 20.015 million pieces during a time period of approximately
40 days. Besides the losses in units, the losses are also accounted in cost for different
criteria like losses due to transfer work (combination of wages and allowance rate),
electricity cost for overtime period, un-utilizations of generator and losses due to
alternative power supply. Total losses estimated regarding the above criteria for all the
sections of RMG sector is 1,849.4 million tk. in the observation period of approximately
forty days. This gigantic amount is certainly not ignorable and with the removal of these
extra expenses or losses, the RMG sector can expand their earnings in a great extent.
If the production loss in the three industries is compared, we can discover that,
relatively smaller industries like Sunshine knitwear and DSL garments that use diesel
generators are facing severe problems due to power failure because of overtime,
maintenance and recent hike in price of diesel. Although previous calculations showed
higher loss for Padma Polycotton using gas generator, but it must be mentioned that Padma
Polycotton is a large industry having much more floors and lines than Sunshine and DSL
with a higher production capacity. It is necessary to mention that, not all the RMG
industries are using the PDB power supply as the main power source and gas/diesel
generators as an alternate but some established industries (confining 15% of the whole
RMG sector) use full time generators (especially gas generators) without any PDB supply
lines. So, it can be said that they have no production loss due to power failure as they are
facilitated with nonstop power supply, but they still have to bear losses due to gas
generator as continuous power supply and un-utilization of generator‟s capacity. Such an
industry named Chaity Composite Ltd. bears losses of 150,048 tk. and 291,008.64 tk. for
the above two criteria consecutively.
On the way to protect the interests of its members and to continue with the
expansion of RMG production and exports growth, BGMEA has raised its concern in
regard to the inadequate supply of gas and electricity to the RMG industry of the country.
It is now urgently felt by the BGMEA members that a study should be conducted to

54
identify the implications of the inadequate power supply to the RMG sector and take
necessary actions in response to the observations and findings of the study.
Finally, it can be stated that it is high time the problem of inadequate electricity
and gas supply should be solved. All the RMG industries along with the help of BGMEA
should come forward and contribute collectively to find a suitable and effective solution of
this crisis to prolong the tremendous growth of the RMG sector in Bangladesh.

References
[1] Amardeep, R.T.M. and Gautham, J., “Line Balancing of Single Model Assembly
Line”, International Journal of Innovative Research in Science, Engineering and
Technology, Vol.2(5), pp.1678-1680, 2013
[2] Archana, B., “A Case Study on Retailing in India”, Excel International Journal of
Multidisciplinary Management Studies, Vol.2(7), pp.178-188, 2012
[3] Babu, V. R., “Industrial Engineering in Apparel Production”, Wood head Publishing
India Pvt. Ltd., pp.62-63, 2011
[4] Bhuiyan, M. Z. A., “Present Status of Garment Workers in Bangladesh: An
Analysis”, IOSR Journal of Business and Management, Vol.3(5), pp.38-44, 2012
[5] Chahal, V., “An Advance Lean Production System in Industry to Improve Flexibility
and Quality in Manufacturing by Implementation of FMS & Green Manufacturing”,
Int. Journal of Emerging Tech. and Advanced Engineering, Vol.2(12), 2012
[6] Chakrabortty, R. K. and Paul, S. K., “Study and Implementation of Lean
Manufacturing in a Garment Manufacturing Company: Bangladesh Perspective”,
Journal of Optimization in Industrial Engineering, Vol.7, pp.11-22, 2011
[7] Ferdousi, F. and Ahmed, A., “An Investigation of Manufacturing Performance
Improvement through Lean Production: A Study on Bangladeshi Garment Firms”,
International Journal of Business and Management, Vol.4(9), pp.106-116, 2009
[8] Ghodrati, A. and Zulkifli, N., “The Impact of 5S Implementation on Industrial
Organizations‟ Performance”, International Journal of Business and Management
Invention, Vol.2(3), pp.43-49, 2013
[9] Hasan, J., “The Competitiveness of Ready Made Garments Industry of Bangladesh
in Post MFA Era: How Does the Industry Behave to Face the Competitive
Challenge?”, British Journal of Economics, Management & Trade, Vol.3(3), pp.296-
306, 2013

56
[10] Hines, P. and Rich, N. “The Seven Value Stream Mapping Tools”, International
Journal of Operations & Production Management, Vol.17(1), pp.46-64, 2005
[11] Ilie, G. and Ciocoiu, C. N., “Application of Fishbone Diagram to Determine the Risk
of an Event with Multiple Causes”, Management Research and Practice, Vol.2(1),
pp.1-20, 2010
[12] Islam, M. M., Khan, A. M. and Khan, M. M. R., “Minimization of Reworks in
Quality and Productivity Improvement in the Apparel Industry”, International
Journal of Engineering and Applied Sciences, Vol.1(4), pp.148-164, 2013
[13] Kumar, N. and Mahto, D., “Assembly Line Balancing: A Review of Developments
and Trends in Approach to Industrial Application”, Global Journal of Researches in
Engineering Industrial Engineering, Vol.13(2), pp.29-50, 2013
[14] Kumar, V., “JIT Based Quality Management: Concepts and Implications in Indian
Context”, International Journal of Engineering Science and Technology, Vol.2(1),
pp.40-50, 2010
[15] Kuo, T., Shen, J. P. and Chen, Y. M., “A Study on Relationship between Lean
Production Practices and Manufacturing Performance”, International Symposium of
Quality Management, Taiwan, pp.1-8, 2008
[16] Mahto, D. and Kumar, A., “Application of Root Cause Analysis in Improvement of
Product Quality and Productivity”, Journal of Industrial Engineering and
Management, Vol.1(2), pp.16-53, 2008
[17] Mukul, A. Z. A., Rahman, M. A. and Ansari, N. L., “Labor Law Practices in EPZ
Area: An Impact of RMG Sector in Bangladesh”, Universal Journal of Management
and Social Sciences, Vol.3 (5), pp.23-33, 2013.
[18] Rameez, H. M. and Inamdar, K.H, “Areas of Lean Manufacturing for Productivity
Improvement in a Manufacturing Unit”, World Academy of Science, Engineering
and Technology, Vol.45, pp.584-587, 2010
[19] Satao, S. M., Thampi, G.T., Dalvi, S. D., Srinivas, B. and Patil, T. B., “Enhancing
Waste Reduction through Lean Manufacturing Tools and Techniques, a Methodical
Step in the Territory of Green Manufacturing”, International Journal of Research in
Management & Technology, Vol.2(2), pp.253-257, 2012
[20] Shumon, M. R. H., Arif-Uz-Zaman, K. and Rahman, A., “Productivity Improvement
through Line Balancing in Apparel Industries”, Proceedings of the International

57
Conference on Industrial Engineering and Operations Management, January 9-10,
Bangladesh, pp.100-110, 2010
[21] Vaidya, R. D.; Shende, P. N.; Ansari N. A.; Sorte, S. M., “Analysis Plant Layout for
Effective Production”, International Journal of Engineering and Advanced
Technology, Vol.2 (3), 2013

APPENDIX
Power failure data for Cutting Section (01-07-2008 – 10-07-2008):
Date Time Total time for power failure
at PDB lines
Time taken to start production
after the power failure at PDB
lines
01-07-08 10:53 – 10:53 8 sec 13 sec
05-07-08 11:51 – 11:58 6 min 19 sec 7 min 08 sec
12:35 – 12:42 6 min 21 sec 7 min 10 sec
06-07-08 11:42 – 12:24 41 min 15 sec 43 min 2 sec
07-07-08 14:02 – 14:05 2 min 16 sec 3 min 12 sec
08-07-08 12:11 – 12:14 3 min 10 sec 4 min 15 sec
Power failure data for Sewing Section (01-07-2008 – 10-07-2008)
Date Time Total time for power failure
at PDB lines
Time taken to start production
after the power failure at PDB
lines
01-07-08 10:53 – 10:53 8 sec 22 sec
05-07-08 11:51 – 11:58 6 min 19 sec 8 min 30 sec
12:35 – 12:42 6 min 21 sec 7 min 32 sec
06-07-08 11:42 – 12:24 41 min 15 sec 44 min 4 sec
07-07-08 14:02 – 14:05 2 min 16 sec 4 min 8 sec
08-07-08 12:11 – 12:14 3 min 10 sec 5 min 25 sec
Power failure data for Finishing Section (01-07-2008 – 10-07-2008)
Date Time Total time for power
failure at PDB lines
Time taken to start production
after the power failure at PDB
lines
01-07-08 10:53 – 10:53 8 sec 12 sec
05-07-08 11:51 – 11:58 6 min 19 sec 7 min 22 sec
12:35 – 12:42 6 min 21 sec 7 min 8 sec
06-07-08 11:42 – 12:24 41 min 15 sec 43 min 32 sec
07-07-08 14:02 – 14:05 2 min 16 sec 3 min 17 sec
08-07-08 12:11 – 12:14 3 min 10 sec 4 min 22 sec
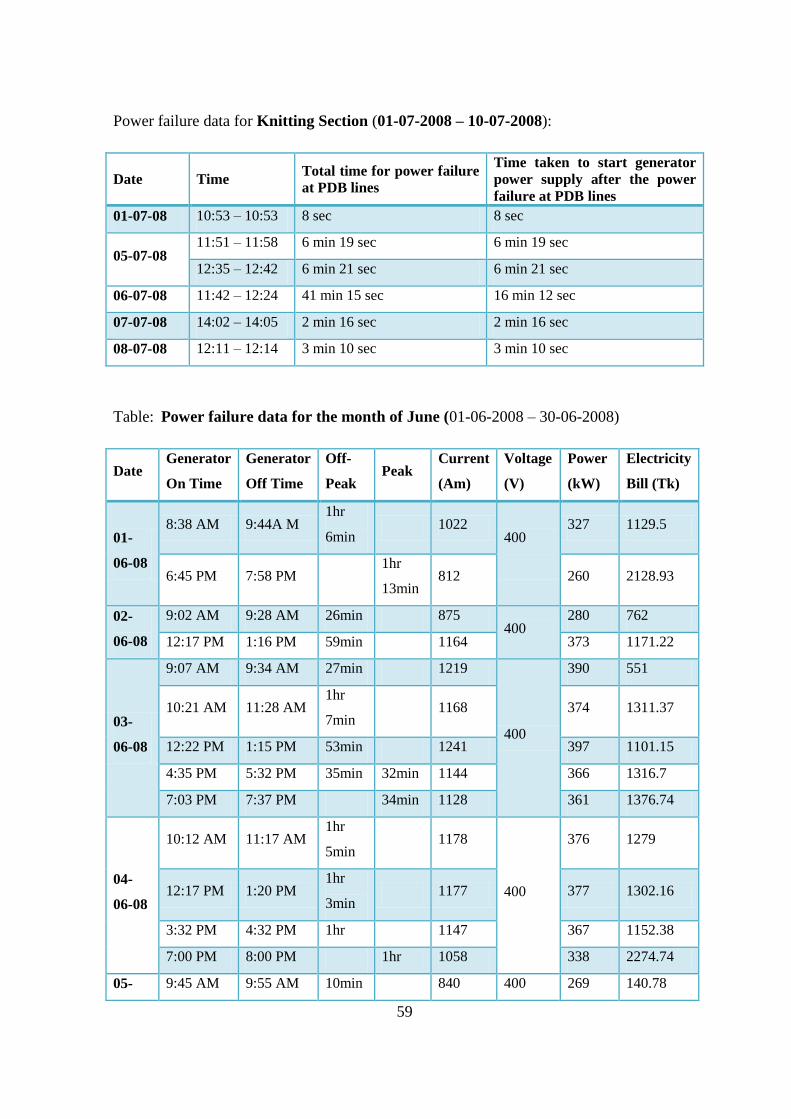
59
Power failure data for Knitting Section (01-07-2008 – 10-07-2008):
Date Time Total time for power failure
at PDB lines
Time taken to start generator
power supply after the power
failure at PDB lines
01-07-08 10:53 – 10:53 8 sec 8 sec
05-07-08 11:51 – 11:58 6 min 19 sec 6 min 19 sec
12:35 – 12:42 6 min 21 sec 6 min 21 sec
06-07-08 11:42 – 12:24 41 min 15 sec 16 min 12 sec
07-07-08 14:02 – 14:05 2 min 16 sec 2 min 16 sec
08-07-08 12:11 – 12:14 3 min 10 sec 3 min 10 sec
Table: Power failure data for the month of June (01-06-2008 – 30-06-2008)
Date Generator
On Time
Generator
Off Time
Off-
Peak Peak
Current
(Am)
Voltage
(V)
Power
(kW)
Electricity
Bill (Tk)
01-
06-08
8:38 AM 9:44A M 1hr
6min 1022
400
327 1129.5
6:45 PM 7:58 PM 1hr
13min 812 260 2128.93
02-
06-08
9:02 AM 9:28 AM 26min 875 400
280 762
12:17 PM 1:16 PM 59min 1164 373 1171.22
03-
06-08
9:07 AM 9:34 AM 27min 1219
400
390 551
10:21 AM 11:28 AM 1hr
7min 1168 374 1311.37
12:22 PM 1:15 PM 53min 1241 397 1101.15
4:35 PM 5:32 PM 35min 32min 1144 366 1316.7
7:03 PM 7:37 PM 34min 1128 361 1376.74
04-
06-08
10:12 AM 11:17 AM 1hr
5min 1178
400
376 1279
12:17 PM 1:20 PM 1hr
3min 1177 377 1302.16
3:32 PM 4:32 PM 1hr 1147 367 1152.38
7:00 PM 8:00 PM 1hr 1058 338 2274.74
05- 9:45 AM 9:55 AM 10min 840 400 269 140.78

60
06-08 3:05 PM 4:10 PM
1hr
5min 1121 359 1221.2
7:13 PM 8:08 PM 55min 1158 370 2282.6
8:24 PM 8:31 PM 7min 981 314 246.54
06-
06-08
4:43 PM 4:51 PM 8min 1039
400
332 139
7:30 PM 8:33 PM 1hr
3min 981 314 2218.88
07-
06-08 8:03 PM 9:04 PM
1hr
1min 1205 400 386 1232.24
08-
06-08 10:02 AM 12:20 PM
2hr
18min 922 400 295 1204.2
09-
06-08
11:04 AM 12:06 PM 1hr
2min 1172
400
375 1216.75
4:05 PM 5:07 PM 55min 7min 1059 339 266.17
7:10 PM 8:21 PM 1hr
11min 1039 332 2644
11:15 PM 12:15 AM 1hr 883 282 885.48
10-
06-08
11:12 AM 11:30 AM 18min 1222
400
391 368.32
2:12 PM 2:50 PM 38min 964 308 612.5
9:00 PM 9:53 PM 53min 1017 325 901.44
Date Generator
On Time
Generator
Off Time
Off-
Peak Peak
Current
(Am)
Voltage
(V)
Power
(kW)
Electricity
Bill (Tk)
11-
06-
08
9:20 Am 10:28 Am 1hr
08min 1025
400
328 1167.25
12:50 Pm 1:58 Pm 1hr
08min 1129 361 1284.7
5:02Pm 6:03 Pm 1hr
01min 1115 357 2442.65
12-
06-
08
9:16Am 9:24Am 8min 1111
400
355 148.63
10:12Am 11:07 Am 55min 1215 389 1119.67
5:58Pm 7:17Pm 1hr
19min 1066 341 3021.66

61
13-
06-
08
3:38 Pm 4:34 Pm 56min 1105 400 353 1035.53
14-
06-
08
10:55Am 12:04Pm 1hr
09min 1156
400
370 1336
2:20 Pm 3:10 Pm 50min 1110 355 928.92
5:10 Pm 6:14 Pm 1hr
04min 1091 349 2505.36
11:13Pm 12:17Am 1hr
04min 797 255 854
16-
06-
08
8:49 Am 9:47 Am 58min 1071
400
343 1041.12
10:44 Am 11:52 Am 1hr
08min 1081 346 1231.3
4:30 Pm 5:40 Pm 30min 40min 1108 354 1588.28
6:58 Pm 7:59 Pm 1hr 1027 328 2244.23
17-
06-
08
7:32 Pm 8:38 Pm 1hr
06min 973 400 311 2302.33
18-
06-
08
7:15Pm 8:20 Pm 1hr
05min 930 400 297 2165.38
20-
06-
08
9:40Pm 10:30Pm 50min 1142 400 365 2047
21-
06-
08
2:40Pm 3:44Pm 1hr
04min 1095 400 350 1172.27
22-
06-
08
9:32Am 12:22 Pm 2hr
50min 930
400
297 2642.31
2:10 Pm 3:52 Pm 1hr
42min 949 304 1622.75
23-
06-
08
11:04 Am 12:05 Pm 1hr 1225
400
392 1251.4
1:02 Pm 2:10 Pm 1hr
08min 311 100 355.87
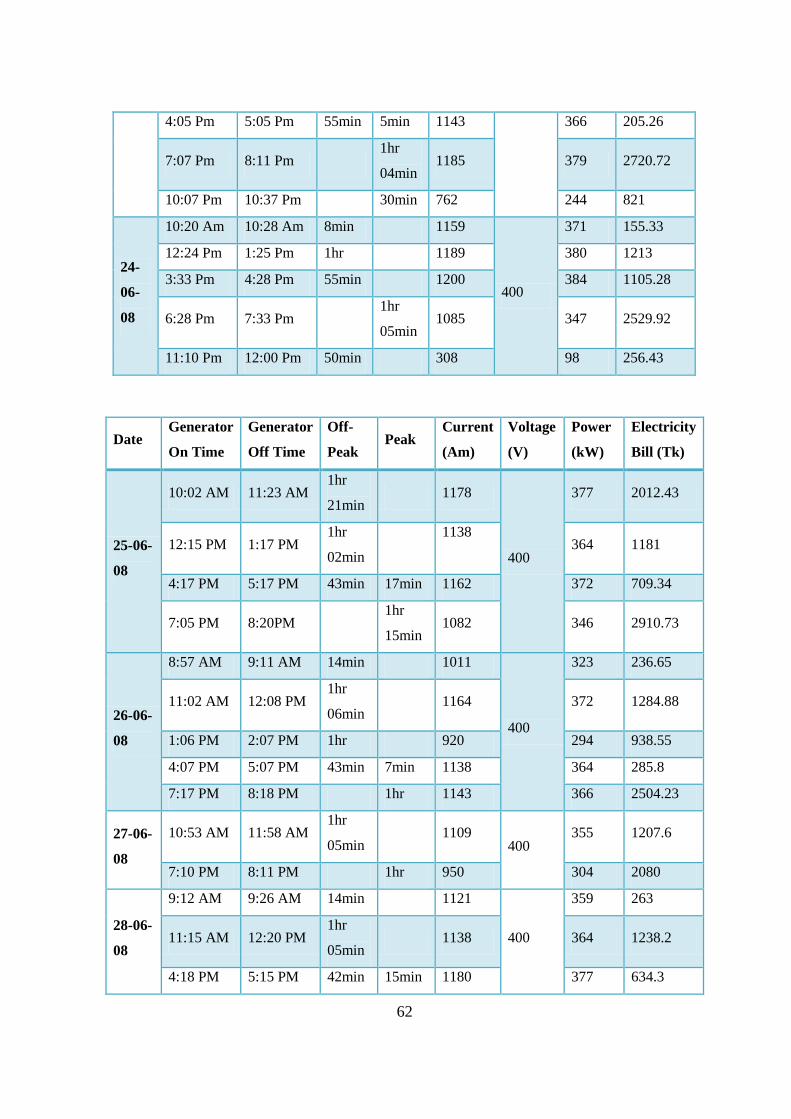
62
4:05 Pm 5:05 Pm 55min 5min 1143 366 205.26
7:07 Pm 8:11 Pm 1hr
04min 1185 379 2720.72
10:07 Pm 10:37 Pm 30min 762 244 821
24-
06-
08
10:20 Am 10:28 Am 8min 1159
400
371 155.33
12:24 Pm 1:25 Pm 1hr 1189 380 1213
3:33 Pm 4:28 Pm 55min 1200 384 1105.28
6:28 Pm 7:33 Pm 1hr
05min 1085 347 2529.92
11:10 Pm 12:00 Pm 50min 308 98 256.43
Date Generator
On Time
Generator
Off Time
Off-
Peak Peak
Current
(Am)
Voltage
(V)
Power
(kW)
Electricity
Bill (Tk)
25-06-
08
10:02 AM 11:23 AM 1hr
21min 1178
400
377 2012.43
12:15 PM 1:17 PM 1hr
02min
1138
364 1181
4:17 PM 5:17 PM 43min 17min 1162 372 709.34
7:05 PM 8:20PM 1hr
15min 1082 346 2910.73
26-06-
08
8:57 AM 9:11 AM 14min 1011
400
323 236.65
11:02 AM 12:08 PM 1hr
06min 1164 372 1284.88
1:06 PM 2:07 PM 1hr 920 294 938.55
4:07 PM 5:07 PM 43min 7min 1138 364 285.8
7:17 PM 8:18 PM 1hr 1143 366 2504.23
27-06-
08
10:53 AM 11:58 AM 1hr
05min 1109
400 355 1207.6
7:10 PM 8:11 PM 1hr 950 304 2080
28-06-
08
9:12 AM 9:26 AM 14min 1121
400
359 263
11:15 AM 12:20 PM 1hr
05min 1138 364 1238.2
4:18 PM 5:15 PM 42min 15min 1180 377 634.3

63
6:16 PM 7:16 PM 1hr 1186 379 2550.67
29-06-
08
9:42 AM 12:30 PM 2hr
48min 862
400 276 2426.6
7:30 PM 8:20 PM 50min 143 46 258
30-06-
08
10:11 AM 11:18AM 1hr
07min 1180
400 377 1321.88
5:08P 5:37 PM 29min 1095 350 1138.5
Table: Power failure data for the month of June (01-06-2008 – 30-06-2008)
Date Generator
On Time
Generator
Off Time Off- Peak Peak
Power
(kW)
Electricity
Bill (Tk)
01-06-08 11:04AM 12:04 PM 1hr 150 471
02-06-08 11:00 AM 12:00 AM 1hr 150 471
09-06-08 04:00 PM 04:30 PM 30min 150 235.5
10-06-08 08:00 PM 08:30 PM 30min 150 504.75
14-06-08 03:00 PM 04:00 PM 1hr
150 471
08:00 PM 09:00 PM 1hr 1009.5
15-06-08 07:00 PM 08:00 PM 1hr 150 1009.5
16-06-08 04:00 PM 04:40 PM 1hr 150 471
23-06-08 07:00 PM 08:00 PM 1hr 150 1009.5
24-06-08 11:50 AM 12:50 PM 1hr 150 471
26-06-08 11:00 AM 12:00 AM 1hr 150 471

QUESTIONNAIRES FOR ELECTRICITY & GAS SUPPLY IN RMG
Name of the Garment Location
Address Year
Established
Tel: Fax:
Type of product:
Organization / Management
Capital Involvement
Fixed capital
Machinery
Land
Building
Workers wages
Others
Source of Finance (both
for fixed and working
capital)
Own capital Bank loan Both Others
Number of Employees Full time # Part time #
Electricity Requirements
Year 2005 2006 2007 2008 2009 2010 2011 2012 2013
Hourly
Daily
Monthly
Yearly
Gas Requirements
Year 2005 2006 2007 2008 2009 2010 2011 2012 2013
Hourly

65
Daily
Monthly
Yearly
Power Source
National Power Grid
Generator Diesel Petrol Gas Others
Year 2009 2010 2011 2012
Requirement Supply Req Supply Req Supply Req Supply
Hourly
Daily
Monthly
Product Details
Type of product
Material Supplier Sweater T Shirt Knitwear Pant woolen
wear
Do you face quality
problems due to power
cut?
What kind of
quality problems do
you face?
Yes No
Power Source Details

66
Type of
Generator
Power
Generation
Capacity
Capital
Cost
Types
of
Fuel
Revenue
for Fuel
Cost of
Maintenance
Manpower
involved
Cost
regarding
Manpower
Remarks
Type Load shedding Frequency
Hourly
Monthly
Yearly
Product Output
Production Rate Hourly Daily Weekly Monthly Order-based
# # # # #
Defect Rate % Rework
Rate
% In-house Outsource
Source of
Defect
Man Machine Process Raw
Material
Other

67
Manpower activity during power cut
Effect on Manpower
Do you require
outsourcing?
Rate of out-sourcing with respect to production
%
Yes No
Product Output
Production Volume Hourly Daily Weekly Monthly Order-based
# # # # #
Total revenue for
electricity(Tk.)
Total revenue for
electricity(Tk.)
Cost of electricity per
unit product
Cost of Gas per unit
product
Effect on Business
Does the load shedding have any effect on dead line? Yes No
Do you miss dead line of shipment due to insufficient
power supply?
Yes No