implications of mediated instruction to remote learning in mathematics joy l. matthews-lópez...
TRANSCRIPT

Unpublished work © 2002 by Educational Testing Service
Implications of Mediated Instruction to Remote Learning in
Mathematics
Joy L. Matthews-López
Educational Testing Service
Sergio R. López-Permouth
David Keck
Ohio University

Unpublished work © 2002 by Educational Testing Service
2
Background
• Basic math skills should be in place prior to entrance into college/university because students need to be able to satisfactorily complete prerequisite course work
• Higher Ed. $ resources are limited– Faculty– Classroom space
• Redundancy is hard to justify to financiers

Unpublished work © 2002 by Educational Testing Service
3
Questions
• If given a choice, do students naturally gravitate to a remote learning environment?
• Is class attendance positively correlated with class performance?

Unpublished work © 2002 by Educational Testing Service
4
The traditional approach…
• Students attend class• Faculty lecture• Specific time is designated for office hours• All students are taught at the same pace, on
the same schedule• Little formative feedback is provided to the
students• Class sizes tend to be large

Unpublished work © 2002 by Educational Testing Service
5
The mediated approach…
• Designates the instructor as a facilitator of learning rather than a deliverer of information
• Permits students to advance at their own pace
• Personalizes the presentation of material
• Lends itself well to a remote learning model
Unpublished work © 2002 by Educational Testing Service
6
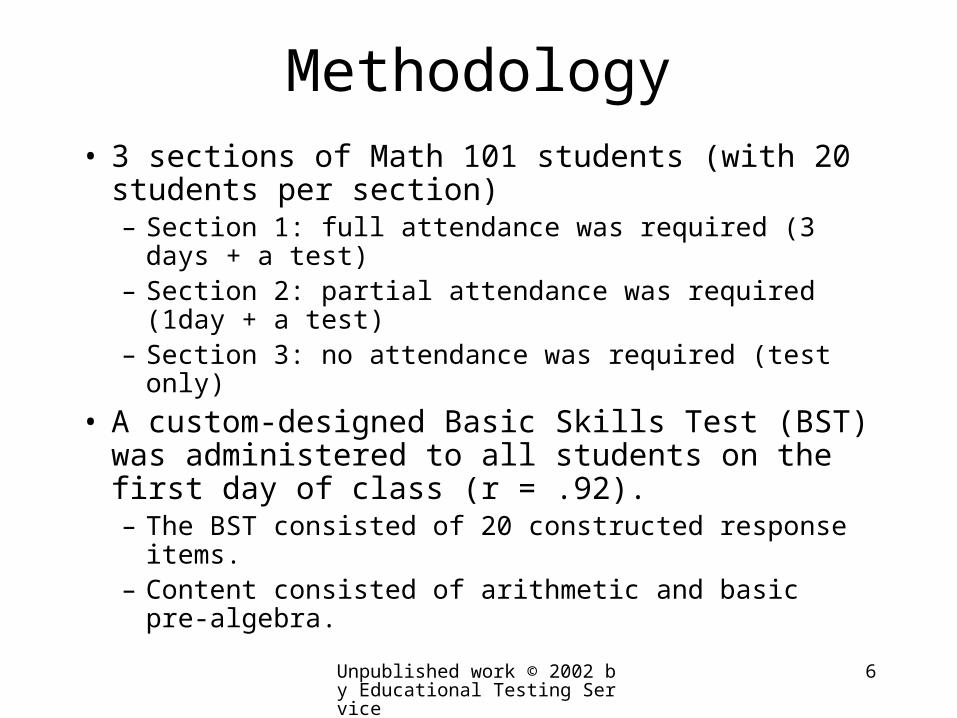
Methodology• 3 sections of Math 101 students (with 20 students
per section)– Section 1: full attendance was required (3 days + a test)– Section 2: partial attendance was required (1day + a
test)– Section 3: no attendance was required (test only)
• A custom-designed Basic Skills Test (BST) was administered to all students on the first day of class (r = .92).– The BST consisted of 20 constructed response items.– Content consisted of arithmetic and basic pre-algebra.

Unpublished work © 2002 by Educational Testing Service
7
Data
• 5 measures per student*:– Daily attendance (recorded by instructors)
– Daily time spent on-line (recorded by the software)
– Pre-test score (BST) (given on the 1st day of class)
– Post-test score (BST) (given on the last day of class)
– Final course grade (7 common tests + final exam)
– Summative course evaluation (specifically made for this project)
(*IRB approval was sought and obtained.)
Unpublished work © 2002 by Educational Testing Service
8
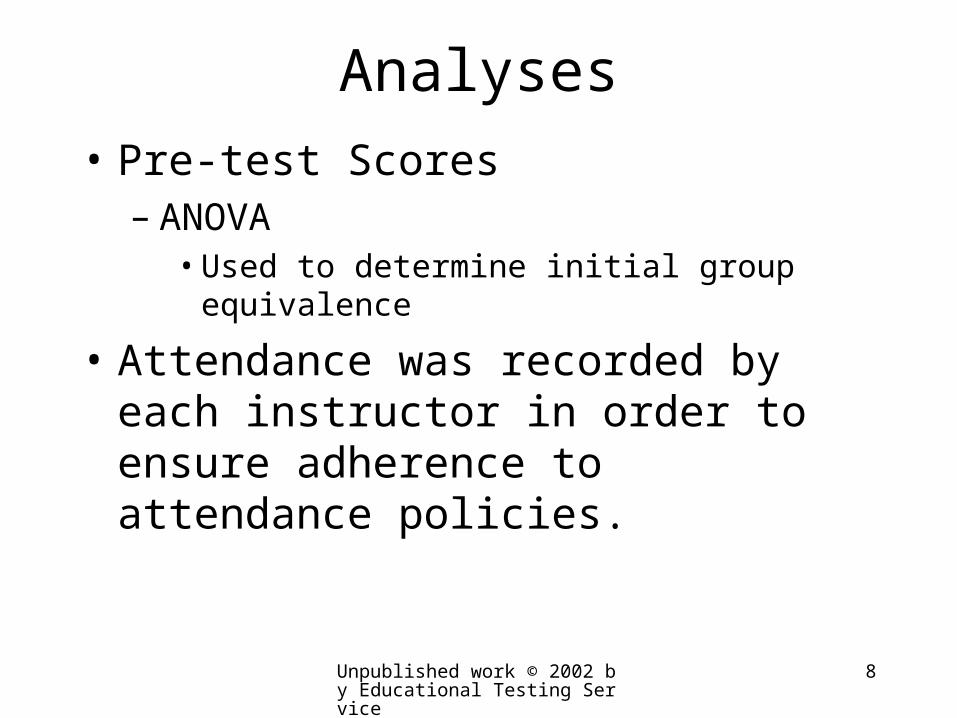
Analyses
• Pre-test Scores– ANOVA
• Used to determine initial group equivalence
• Attendance was recorded by each instructor in order to ensure adherence to attendance policies.

Unpublished work © 2002 by Educational Testing Service
9
Time Spent On-line
• Time spent on-line was automatically recorded by the software.– This information was collected to see how
students in the different groups spent their study time.
– ANOVA

Unpublished work © 2002 by Educational Testing Service
10
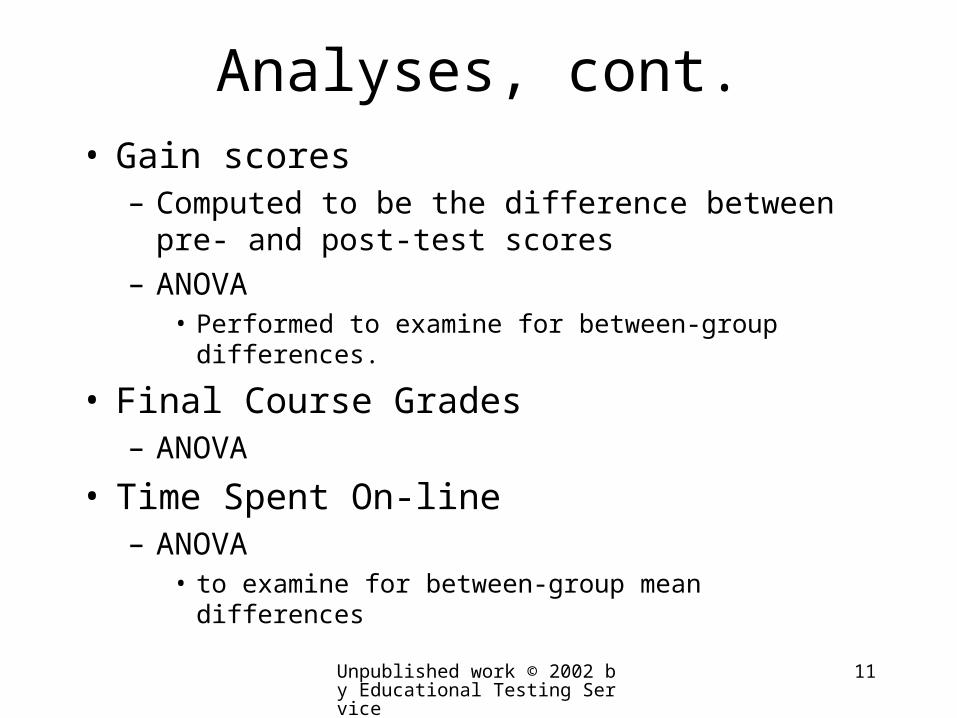
Analyses, cont.
• Post-test Scores– ANOVA (to examine for post-course group
mean differences)
– Filtered correlations (to examine with-in group relationships between pre- and post-test scores)
Unpublished work © 2002 by Educational Testing Service
11
Analyses, cont.• Gain scores
– Computed to be the difference between pre- and post-test scores
– ANOVA• Performed to examine for between-group differences.
• Final Course Grades– ANOVA
• Time Spent On-line– ANOVA
• to examine for between-group mean differences

Unpublished work © 2002 by Educational Testing Service
12
Results• Pre-test Scores: no group differences
(F = .056, p = .946 at α = .05).
Table 1
Descriptive Statistics for Pre-test Scores*
Group N Mean Std. Deviation
1 18 11.78 3.32
2
3
19
18
12.16
12.00
3.20
3.86
*This finding was used to establish initial group equivalences.

Unpublished work © 2002 by Educational Testing Service
13
Results
• Attendance– All students were found to be in compliance
with the attendance policies for their particular section.

Unpublished work © 2002 by Educational Testing Service
14
Results
• Gain scores: (F = 2.88, p = .065, α = .05)
Group Mean Gain
Scores
Standard Error
1
2
3
4.22
2.61
2.11
.76
.70
.46

Unpublished work © 2002 by Educational Testing Service
15
Gain Scores, cont.Counts:
Group 1
0 6 6 7 Pre (13)
0 0 12 7 Post (19)
Group 2
0 3 11 4 Pre (15)
0 1 6 11 Post (17)
Group 3
1 5 9 4 Pre (13)
0 0 6 13 Post (19)
0 2015105Raw Score

Unpublished work © 2002 by Educational Testing Service
16
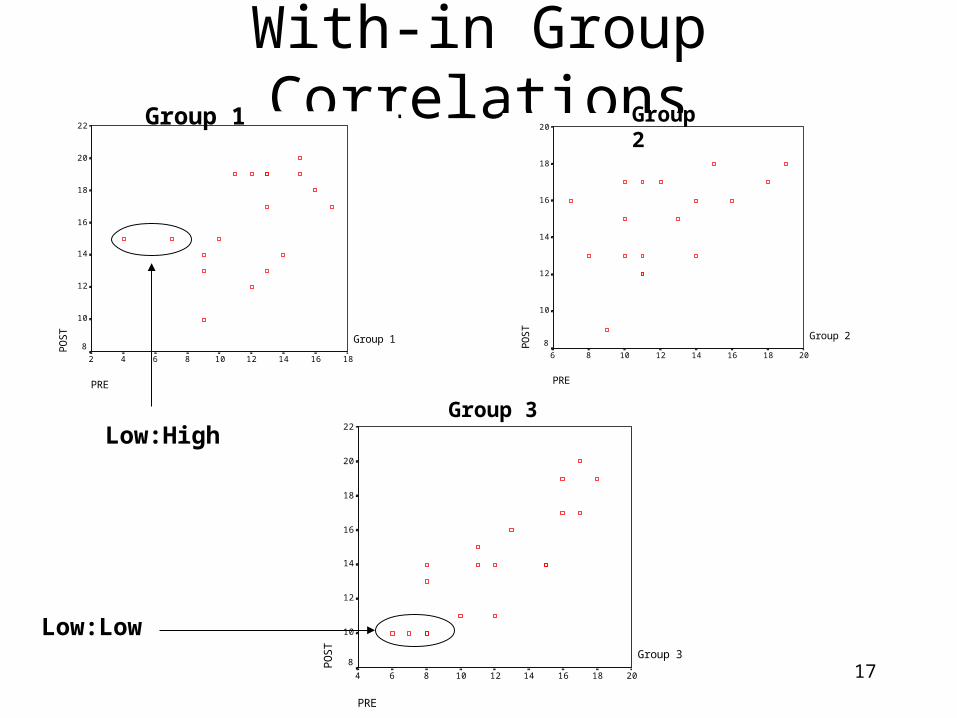
Results
• Pre-test to post-test correlations
Within-group Correlations
Group N Correlation
1
2
3
18
19
19
.475*
.510*
.856*
*Statistically significant at α = .05, 2-tailed
Unpublished work © 2002 by Educational Testing Service
17
With-in Group Correlations
PRE
18161412108642
PO
ST
22
20
18
16
14
12
10
8Group 1
PRE
20181614121086
PO
ST
20
18
16
14
12
10
8Group 2
PRE
201816141210864
PO
ST
22
20
18
16
14
12
10
8Group 3
Low:High
Low:Low
Group 1 Group 2
Group 3

Unpublished work © 2002 by Educational Testing Service
18
Time Spent On-line: Results
• Regardless of group membership, students spent approximately the same amount of time on-line, overall.
• There were different patterns to time spent on-line.
– Group 1…steady usage
– Group 2…heavier usage prior to test day
– Group 3…heaviest usage immediately prior to test day

Unpublished work © 2002 by Educational Testing Service
19
Post-test Scores: Results• Group mean scores were not significantly different
from one another (F = 1.937, p = .154, α = .05).
Group N Mean Post-test Score
1
2
3
18
19
19
15.95
14.83
14.11

Unpublished work © 2002 by Educational Testing Service
20
Final Grades: Results• Final grade mean scores were not significantly
different across groups (F = .059, p = .943, α = .05)
Group Final Grades
1
2
3
82.11
82.89
82.11
Unpublished work © 2002 by Educational Testing Service
21
Conclusions
• Students enrolled in a mediated learning environment naturally gravitate to a remote learning model– i.e. When given the option, students chose not
to attend class.
• Academic performance did not appear to be adversely impacted by the remote learning environment– …however, what about learning?

Unpublished work © 2002 by Educational Testing Service
22
Recommendations
• Students scoring lower than a 70% on the BST should be required to attend class, whether mediated or not.
• Students scoring 70% or higher should be allowed to utilize a remote mediated learning model.

Unpublished work © 2002 by Educational Testing Service
23
Limitations
• Sample size is small.
• Results may be course specific.
• Remedial vs. non-remedial courses should be examined.