implications of loyalty program membership and service experiences for customer retention and
TRANSCRIPT
JOURNAL OF THE ACADEMY OF MARKETING SCIENCE WINTER 2000Bolton et al. / LOYALTY PROGRAM MEMBERSHIP
Implications of Loyalty ProgramMembership and Service Experiencesfor Customer Retention and Value
Ruth N. BoltonUniversity of Oklahoma
P. K. KannanMatthew D. BramlettUniversity of Maryland
Companies that offer loyalty reward programs believe thattheir programs have a long-run positive effect on customerevaluations and behavior. However, if loyalty rewards pro-grams increase relationship durations and usage levels,customers will be increasingly exposed to the completespectrum of service experiences, including experiencesthat may cause customers to switch to another service pro-vider. Using cross-sectional, time-series data from aworldwide financial services company that offers a loyaltyreward program, this article investigates the conditionsunder which a loyalty rewards program will have a posi-tive effect on customer evaluations, behavior, and repeatpurchase intentions. The results show that members in theloyalty reward program overlook or discount negativeevaluations of the company vis-à-vis competition. Onepossible reason could be that members of the loyalty re-wards program perceive that they are getting better qualityand service for their price or, in other words, “goodvalue.”
Organizations have long sought to reward the loyalty ofpreferred customers with enhanced services or price dis-counts. Recently, loyalty rewards programs have becomeprevalent across a variety of service industries. Forexample,
• Reward programs based on service usage levels(i.e., frequent buyer programs) have become com-mon in the transportation and hospitality industries.
• General Motors has launched a cobranded creditcard that allocates 5 percent of spending toward thepurchase or lease of a new car.
• American Express has offered two airline tickets forheavy card use during a 6-month period.
• MCI’s “Friends and Family” program has offeredincentives to enroll friends and relatives with thecompany.
Generally, the goal of these programs is to establish ahigher level of customer retention in profitable segmentsby providing increased satisfaction and value to certaincustomers. For example, many supermarket preferred-shopper programs are targeted toward heavy users. Themanagerial justification for these programs is that in-creased customer satisfaction and loyalty have a positiveinfluence on long-term financial performance (Anderson,Fornell, and Lehmann 1994; Reichheld and Sasser 1990).
Managers typically believe that it is desirable andexpected for a properly executed loyalty rewards programto increase usage of the company’s product or serviceofferings (O’Brien and Jones 1995). To determine thelong-term efficacy of a loyalty rewards program, a com-pany must quantify the program’s influence on future pur-chase behavior (e.g., usage levels). Furthermore, it mustverify that the positive financial outcomes of the rewardsprogram exceed the investments made in the program.Unfortunately, there is virtually no prior research about the
Journal of the Academy of Marketing Science.Volume 28, No. 1, pages 95-108.Copyright © 2000 by Academy of Marketing Science.
effect of loyalty programs on customer purchases of serv-ices or on company financial outcomes. Much of theresearch concerning loyalty has focused on packaged-goods markets (Bowman and Lele-Pingle 1997; Unclesand Laurent 1997)—despite the prevalence of loyalty pro-grams in goods and services industries worldwide.
Do loyalty programs increase customers’ satisfactionwith the product/service offering and their satisfactionwith the company? Do they increase the duration ofcustomer-provider relationships and usage levels of prod-ucts/services? These questions are critical to serviceorganizations that must decide whether loyalty programsgenerate revenues that exceed their implementation costs,as well as decide whether loyalty programs are more prof-itable than other retention strategies such as service guar-antees. Naturally, companies that offer loyalty reward pro-grams believe that their programs have a long-run positiveeffect on customer evaluations and behavior. However, ifloyalty rewards programs increase relationship durationsand usage levels, then customers will be increasinglyexposed to the complete spectrum of service experi-ences—including experiences that may cause customersto switch to another service provider (Keaveney 1995).Prior research has established the positive effect of cus-tomer satisfaction on loyalty and usage behavior (Bolton1998; Bolton and Lemon 1999; Jones and Sasser 1995).Consequently, it seems likely that loyalty rewards pro-grams will have a positive long-run effect on customerpurchase behavior only when service experiences are gen-erally satisfactory. In other words, the impact of loyaltyrewards programs is likely to be moderated by customers’usage levels and their assessments of their service experi-ences. Unfortunately, there is no rigorous empiricalresearch concerning the mechanism by which loyalty pro-grams operate.
These observations suggest the following researchquestion: Under what conditions will a loyalty rewardsprogram have a positive effect on customer evaluations,behavior, and repatronage intentions? This article willaddress this question by developing and estimating amodel of the influence of a loyalty rewards program oncustomers’ decisions to repurchase a service and theirdecisions about how much to use the service. The modelwill focus on the multiple direct and indirect effects of loy-alty programs on these two dependent variables. In par-ticular, the model will describe how the effect of participa-tion in a loyalty rewards program is moderated bydifferences—across customers and over time—in custom-ers’ service experiences and assessments of these experi-ences. Using the model, it will be possible to estimate theeffectiveness of a loyalty program model in aiding cus-tomer retention and in providing value.
PERSPECTIVE ON LOYALTY
There are many reasons why customers maintain rela-tionships with service providers (Bendapudi and Berry1997; Dick and Basu 1994). Previous research has not spe-cifically attempted to model the influence of a loyaltyrewards program on customer evaluations, repatronageintentions, and purchase behavior in service industries(Rust and Metters 1996). Hence, this section reviews priorresearch concerning the antecedents of customer repatron-age behavior for services to provide a foundation for ourmodeling effort.
Repurchase Behavior
There are few longitudinal studies of customer repa-tronage behavior over time. Crosby and Stephens (1987)found that whether or not customers had replaced theirinsurance policies or allowed them to lapse depended ontheir prior overall satisfaction with their whole life cover-age. Bolton (1998) showed that prior overall satisfactionwith a cellular service company is positively related to theduration of the customer-company relationship, and thatthis effect is larger when the customer has more extensiveexperience with the service company. Keaveney’s (1995)critical-incident study of customer switching behavior inservice industries found that customers switch service pro-viders for many reasons, including pricing, inconvenience,core service failures, failed service encounters, response tofailed service encounters, competition, and ethical prob-lems. Recently, Bolton and Lemon (1999) showed thatcustomers’ usage of two continuously provided servicesdepended on their prior satisfaction levels, their assess-ments of payment levels, and prices. Finally, there aresome models of aggregate customer retention (e.g., Zaho-rik and Rust 1992), and some cross-sectional studies thatshow repatronage behavior depends on prior satisfaction(e.g., Gilly and Gelb 1982; Solnick and Hemenway 1992).
Repurchase Intentions
Since purchase intentions are easier to measure thanbehavior, there are numerous studies of repatronage inten-tions. However, these studies must be interpreted with cau-tion because the predictive validity of intentions measuresvaries depending on the product, the measurement scale,the time frame, and the nature of the respondents (e.g.,Morwitz 1997; Morwitz and Schmittlein 1992). For exam-ple, Riley, Ehrenberg, Castleberry, Barwise, and Barnard(1997) find that repeat purchase intentions are not firmlyheld. Several longitudinal studies show that customers’prior repatronage intentions directly affect their
96 JOURNAL OF THE ACADEMY OF MARKETING SCIENCE WINTER 2000
subsequent repatronage intentions (e.g., LaBarbera andMazursky 1983). Repatronage intentions have also beenshown to depend on customers’ prior attitudes and satis-faction levels (e.g., Bearden and Teel 1983; Oliver 1980).Two recent articles have proposed process models of how acustomer’s repatronage intentions depend on his or herattitude about perceived service quality over time. In alaboratory study concerning hotel visits by executives,Boulding, Staelin, Kalra, and Zeithaml (1993) find thatcustomers’ attitudes are subject to a Bayesian-like updat-ing during successive service experiences. Rust, Inman,and Zahorik (1995) develop and estimate a Bayesianmodel in which favorable disconfirmation increases pref-erence for the chosen brand and unfavorable disconfirma-tion decreases preference.
Summary
The above-mentioned studies are very diverse. Never-theless, these findings are generally consistent with thenotion that customers make repatronage decisions on thebasis of their predictions (i.e., expectations) concerningthe value of a future product/service, where their predic-tions are extrapolated from prior experiences (e.g., satis-faction levels) about the product/service.
A MODEL OF CUSTOMERREPATRONAGE BEHAVIOR
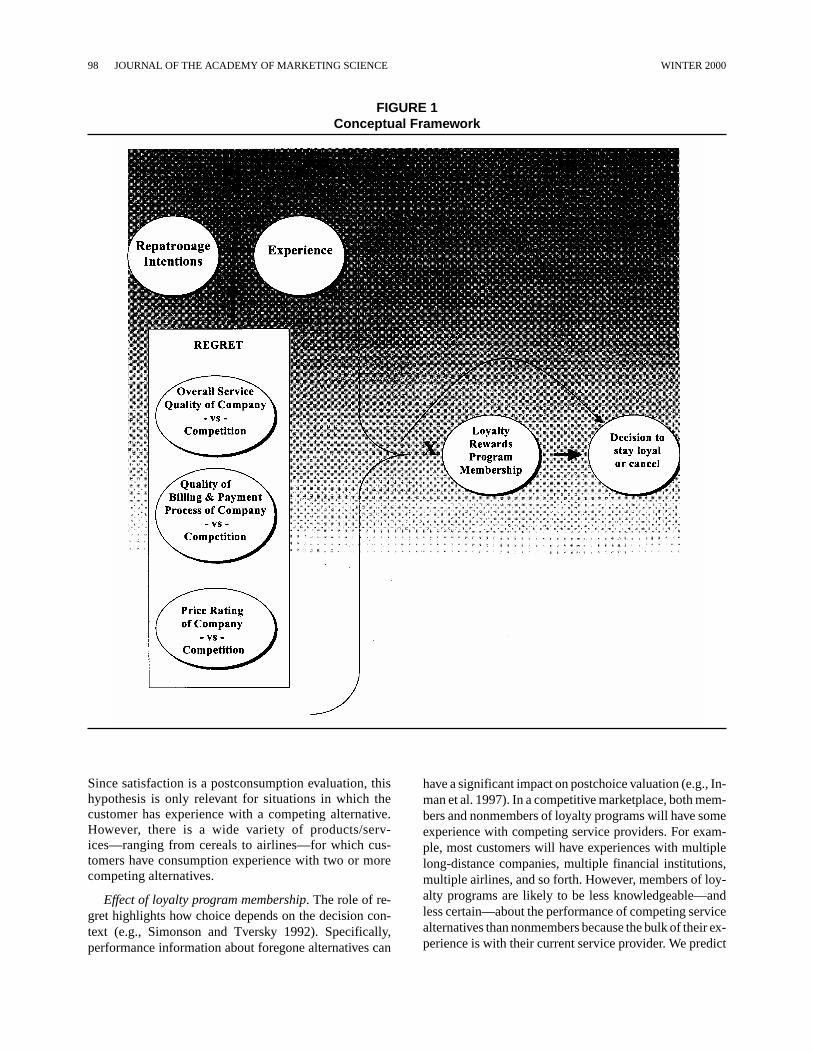
This section develops a process model of how custom-ers’service experiences—including their experiences withthe competition and loyalty programs—influence theirrepatronage behavior. We develop a model that describeshow customers integrate their experiences about theirservice experiences, including their perceptions of com-petitors to make repatronage decisions. We also discusshow the decision processes of members of loyalty pro-grams may differ from nonmembers. An overview of ourconceptual framework is depicted in Figure 1. The remain-der of this section identifies the antecedents of repatronagethrough a series of hypotheses and then summarizes thehypotheses in a mathematical model.
Prior Repatronage Intentions
We believe that customers make repatronage decisions(Decisionit) by updating their assessments of repatronageintentions through a sequential anchoring and adjustmentprocess in which the individual’s prior repatronage inten-tions (Intentit) acts as an anchor that is adjusted by his orher assessments of new service experiences. The influenceof prior repatronage intentions is likely to be very strong
because research has shown that customers maintain thestatus quo to satisfy coping goals, thereby minimizing ex-plicit confrontation of negative potential decision conse-quences (Luce 1998).
Hypothesis 1a: Customers’ repatronage intentions havea positive effect on their subsequent repatronagedecisions.
Effect of loyalty program membership. We believe thatcustomers who are members of loyalty programs are morelikely to make favorable repatronage decisions. Beyondthis main effect, we also believe that members of loyaltyprograms will tend to have stronger ties to the service or-ganization than nonmembers. (For example, the loyaltyprogram may award frequent shopper rewards to encour-age customer loyalty.) Hence, loyalty program membersmay be particularly likely to use coping mechanisms, sothat they weigh prior repatronage intentions more heavilythan nonmembers.
Hypothesis 1b: Members of loyalty programs weigh re-patronage intentions more heavily than nonmem-bers in making repatronage decisions.
The Role of Regret
Inman, Dyer, and Jia (1997) have shown that custom-ers’ postchoice evaluations reflect both satisfaction (cf.Oliver 1980) and regret (cf. Bell 1982; Loomes and Sug-den 1982), where regret entails comparisons of attributesacross competing alternatives.1 We extend this notion bypredicting that service repatronage decisions depend onboth satisfaction and postchoice regret. Specifically, wepredict that customers’ repatronage behavior will dependon a postconsumption assessment of their service relativeto their expectations (“satisfaction”) and relative to thebest competing service alternative (“regret”).2 We hy-pothesize that customers encode their satisfaction withtheir current service experience (OwnSatit) by making acomparison with their satisfaction with the service pro-vided by a competing company (CompSatit) in making re-patronage decisions.
Hypothesis 2a: When customers’ assessments of currentexperiences are less satisfactory than competitors’service levels (i.e., OwnSatit < CompSatit), the per-ceived discrepancy will have a negative effect ontheir repatronage decisions, whereas when custom-ers’ assessments of experiences are more satisfac-tory than competitors’service levels (i.e., OwnSatit >CompSatit), the perceived discrepancy will have apositive effect on their repatronage decisions.
Bolton et al. / LOYALTY PROGRAM MEMBERSHIP 97
Since satisfaction is a postconsumption evaluation, thishypothesis is only relevant for situations in which thecustomer has experience with a competing alternative.However, there is a wide variety of products/serv-ices—ranging from cereals to airlines—for which cus-tomers have consumption experience with two or morecompeting alternatives.
Effect of loyalty program membership. The role of re-gret highlights how choice depends on the decision con-text (e.g., Simonson and Tversky 1992). Specifically,performance information about foregone alternatives can
have a significant impact on postchoice valuation (e.g., In-man et al. 1997). In a competitive marketplace, both mem-bers and nonmembers of loyalty programs will have someexperience with competing service providers. For exam-ple, most customers will have experiences with multiplelong-distance companies, multiple financial institutions,multiple airlines, and so forth. However, members of loy-alty programs are likely to be less knowledgeable—andless certain—about the performance of competing servicealternatives than nonmembers because the bulk of their ex-perience is with their current service provider. We predict
98 JOURNAL OF THE ACADEMY OF MARKETING SCIENCE WINTER 2000
FIGURE 1Conceptual Framework
that they will weigh their comparisons of satisfaction withthe current service provider versus their competing serviceprovider less heavily for the same reason.
Hypothesis 2b: Members of loyalty programs will weighcomparisons with competitors less heavily thannonmembers in making repatronage decisions (aftercontrolling for the effects of experience).
Asymmetric effects of regret. Prior research has shownthat there are potential asymmetries in both the effects ofexpectancy disconfirmation and regret (e.g., Inman et al.1997). Negative effects are usually more important in ex-plaining customer evaluations. For example, Schul andSchiff (1993) find that negative experiences are likely to beprocessed more elaborately. (These findings are similar tothe predictions of prospect theory, in which customerstypically weigh losses more heavily than gains [e.g.,Thaler 1985].) Hence, we predict that the negative effectsof regret will be more important than positive effects in ex-plaining repatronage decisions.
Hypothesis 3: The magnitude of the effect of customers’comparison of their satisfaction with their currentprovider versus their competing provider on their re-patronage decisions will be larger when the discrep-ancy is negative, rather than positive.
We expect to find asymmetric effects for both membersand nonmembers of loyalty programs.
The Effect of DecreasingComparability of Alternatives
As the comparability of alternatives decreases, custom-ers shift to an across-attribute strategy and make decreas-ing use of within-attribute processing (Johnson 1984).This shift seems very likely for repatronage decisionsbecause comparable attributes receive more weight incomparison-based tasks (such as choice), whereas non-comparable attributes receive more weight when optionsare evaluated separately (Johnson and Auh 1999; Nowlisand Simonson 1997). Furthermore, “framing” the deci-sion—that is, making certain decision criteria more salientor available—can influence outcomes for both expert andnovice customers when alternatives are noncomparable(Bettman and Sujan 1987). These findings suggest thatnoncomparable attributes will receive more weight as thecomparability of alternatives decreases in repatronagedecisions. This argument can explain why service failureshave been shown to act as “triggers” that accelerate thecustomer’s decision to discontinue a service relationship(Bolton 1998; Keaveney 1995). The presence of servicefailures decreases the comparability of the alternatives,and customers assign more weight to the presence/absence
of service failures in their repatronage decisions. In otherwords, customers with larger numbers of noncomparableservice experiences will incorporate these experiencesinto their repatronage decisions.
Hypothesis 4: Customers with noncomparable serviceexperiences (e.g., exposure to unique company-specific service experiences) will incorporate theseexperiences into their repatronage decisions.
Summarizing theRepatronage Behavior Model
The model describes two aspects of the repatronagedecision (Decisionit): the decision of whether or not torepurchase (i.e., stay/cancel credit card membership) andthe decision of how much to use the service (i.e., usagelevel or number of transactions during the subsequentyear). The model has two equations, each with the samebasic specification. This specification captures thehypotheses algebraically as follows. Following Hogarthand Einhorn’s (1992) belief updating model for “estima-tion tasks,” we believe that customers’ repatronage inten-tions are adjusted by an averaging process, in which a serv-ice experience is encoded as a deviation relative to areference value or comparison standard. An attractive fea-ture of this specification is that the reference value is thesatisfaction provided by competitors—thereby blendingthe customer dis/satisfaction and choice modeling tradi-tions. That is,
Decisionit = aA Intentit – 1 + eA Loyali + aL Loyali
× Intentit – 1 + bA PosCompit – 1 + cA NegCompit – 1
+ bL Loyali × PosCompit – 1 + cL Loyali
× NegCompit – 1 + dA NonCompit – 1,
(1)
whereIntentit – 1 = a variable representing repatronage
intentions;Loyali = an indicator variable that takes on the
value 1 if the customer is a loyaltyprogram member, 0 otherwise; and
If (OwnSatit – 1 – CompSatit – 1) > 0, then:
PosCompit – 1 = (OwnSatit – 1 – CompSatit – 1);and NegCompit – 1 = 0;
If (OwnSatit – 1 – CompSatit – 1) < 0, then:
NegCompit – 1 = (CompSatit – 1 – OwnSatit – 1);and PosCompit – 1 = 0;
NonCompit – 1 = a vector of variables describingnoncomparable experiences, such asunique company-specific serviceexperiences.
Bolton et al. / LOYALTY PROGRAM MEMBERSHIP 99
Equation (1) distinguishes between the effects of per-ceived service experiences on all customers (denoted bythe subscript A) and the effects on members of the loyaltyprogram (denoted by the subscript L). It includes separateterms for positive and negative effects of comparisons withcompetitors to allow for asymmetrical effects on repatron-age behavior, as well as including a separate vector to cap-ture the effects of noncomparable experiences. Hypothesis1a predicts that aA > 0. Hypothesis 1b predicts that aL > 0.Hypothesis 2a predicts that bA > 0 and cA < 0, and Hypothe-sis 3 predicts |cA| > |bA| and |cA + cL| > |bA + bL|. Hypothesis2b predicts that bL < 0, cL > 0, and Hypothesis 4 predictsthat d > 0.
THE DATABASE
The model is estimated with cross-sectional, time-series data from a worldwide financial services companythat offers a loyalty reward program. This study focuses oncredit card customers from three European countries,although these customers may also purchase other serv-ices from the company. The loyalty program is open to anycard member, irrespective of usage. There is a fee tobecome a loyalty member, which varies depending on thecountry. (For example, in the United States it is about $40).The loyalty program is a rewards-for-usage program. Loy-alty rewards program members accumulate points witheach dollar transacted that are redeemable for a wide vari-ety of goods and services such as air certificates, car rental,vacation options, and retail gifts. At the time of the study,there were a few comparable rewards programs offered bycompetitors in these countries. The data describe a prob-ability sample of 405 customers from the three Europeancountries.3
Panel Design
The database includes customer survey and usagebehavior data for the period November 1995 throughNovember 1997. The data were assembled using a paneldesign, in which survey measures and multiple waves ofservice usage records were obtained from the same cus-tomers—making causal inferences possible. We considertwo distinct time periods. The initial time interval (t = 0)corresponds to a 12-month “base time period” (December1995 to November 1996) in which service usage behavioris monitored. This initial time interval includes theadministration of a survey in March 1996—at which timeall respondents were customers of the company. The sub-sequent time interval (t = 1) corresponds to a second 12-month period (December 1996 to November 1997) inwhich service usage behavior is monitored.
Actual, rather than self-reported, measures of serviceusage levels were obtained—including number of
transactions per year, dollars spent per year, and the dura-tion of customer-company relationship. This feature isvery important because light users typically overreportusage, whereas heavy users underreport usage, andbecause actual usage, rather than self-reported usage, isstatistically related to satisfaction measures (Collopy1996). The survey data include measures of customer per-ceptions of the company’s and competitive service levels,corporate reputation, and self-reports of recent serviceexperiences—as well as customers’ intentions to recom-mend the company, renew credit card membership, andincrease their share of business.
The database includes information about whether thecustomer canceled service during the time period ofMarch 1996 to November 1997, as well as the cancellationdate. Seventeen percent of the sample canceled their creditcard during the study period. Equally important, the data-base also includes information about whether or not thecustomer is a loyalty rewards program member. Sixty-fivepercent of survey respondents were members of a rewardsprogram offered by the financial-services provider. Onaverage, respondents had held their credit card for about 9years. However, the loyalty programs are quite a recentintroduction in the three countries, all of them being intro-duced 2 to 3 years before the time of the study.
Operationalizationof Model Constructs
Table 1 provides a list of the constructs used in the studyalong with a description of how they are measured. Recallthat we estimate models for two aspects of the repatronagedecision: the decision of whether or not to repurchase (i.e.,stay/cancel credit card membership) and the decision ofhow much to use the service (i.e., usage level or number oftransactions during the subsequent year). The decision ofwhether or not to repurchase (StayDecisionit = 1) is meas-ured by an indicator variable that indicates whether or notthe subscriber canceled after March 1996 as tracked by thecompany (where 1 denotes canceled, 0 otherwise), and thedecision of how much to use the service (UsageDecisionit =1) is measured by the number of transactions at t = 1 astracked by the company.
In the StayDecisionit = 1 equation, repatronage inten-tions are calculated for each customer by averaging thevalues on three measures of repatronage intentions: likeli-hood to recommend company, likelihood to renew thecompany’s product, and likelihood to increase the sharewith the company. Each of these measures ranges from 1 to5, resulting in a range of 1 to 5 for the overall index. In theUsageDecisionit = 1 equation, we operationalize repatron-age usage intentions by a measure of the duration of thecustomer’s membership in the loyalty program. (Therationale is that longtime users are likely to anticipate
100 JOURNAL OF THE ACADEMY OF MARKETING SCIENCE WINTER 2000
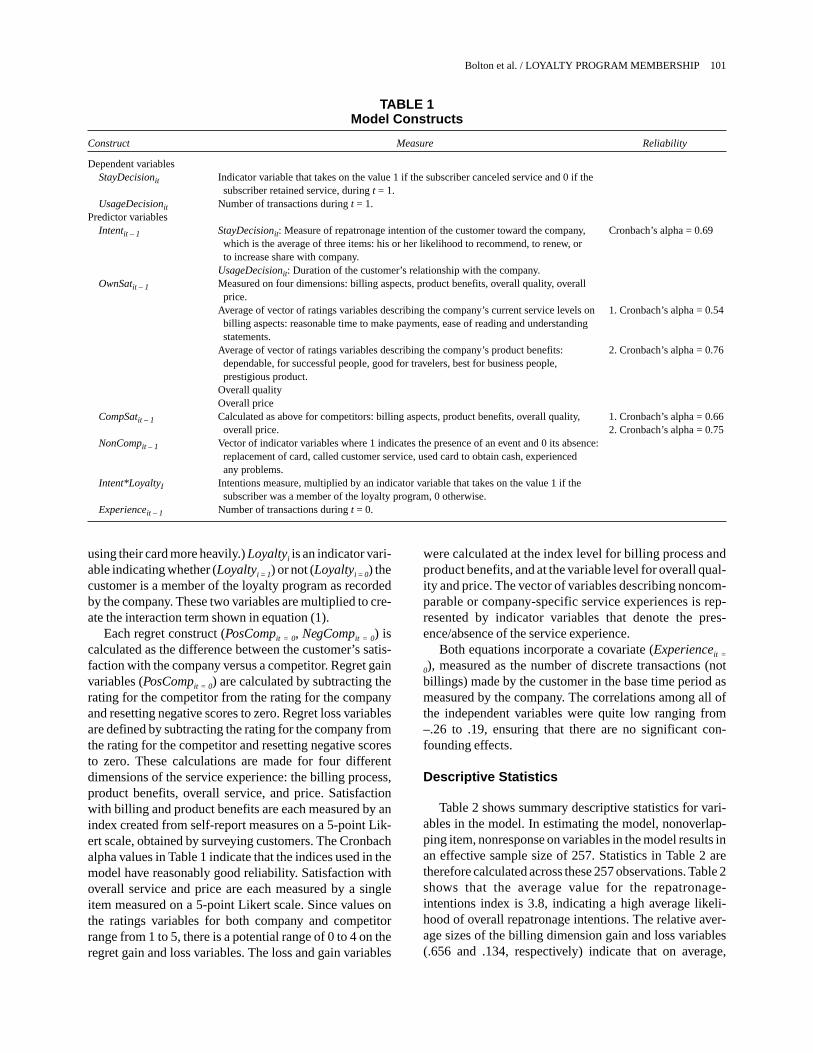
using their card more heavily.) Loyaltyi is an indicator vari-able indicating whether (Loyaltyi = 1) or not (Loyaltyi = 0) thecustomer is a member of the loyalty program as recordedby the company. These two variables are multiplied to cre-ate the interaction term shown in equation (1).
Each regret construct (PosCompit = 0, NegCompit = 0) iscalculated as the difference between the customer’s satis-faction with the company versus a competitor. Regret gainvariables (PosCompit = 0) are calculated by subtracting therating for the competitor from the rating for the companyand resetting negative scores to zero. Regret loss variablesare defined by subtracting the rating for the company fromthe rating for the competitor and resetting negative scoresto zero. These calculations are made for four differentdimensions of the service experience: the billing process,product benefits, overall service, and price. Satisfactionwith billing and product benefits are each measured by anindex created from self-report measures on a 5-point Lik-ert scale, obtained by surveying customers. The Cronbachalpha values in Table 1 indicate that the indices used in themodel have reasonably good reliability. Satisfaction withoverall service and price are each measured by a singleitem measured on a 5-point Likert scale. Since values onthe ratings variables for both company and competitorrange from 1 to 5, there is a potential range of 0 to 4 on theregret gain and loss variables. The loss and gain variables
were calculated at the index level for billing process andproduct benefits, and at the variable level for overall qual-ity and price. The vector of variables describing noncom-parable or company-specific service experiences is rep-resented by indicator variables that denote the pres-ence/absence of the service experience.
Both equations incorporate a covariate (Experienceit =
0), measured as the number of discrete transactions (notbillings) made by the customer in the base time period asmeasured by the company. The correlations among all ofthe independent variables were quite low ranging from–.26 to .19, ensuring that there are no significant con-founding effects.
Descriptive Statistics
Table 2 shows summary descriptive statistics for vari-ables in the model. In estimating the model, nonoverlap-ping item, nonresponse on variables in the model results inan effective sample size of 257. Statistics in Table 2 aretherefore calculated across these 257 observations. Table 2shows that the average value for the repatronage-intentions index is 3.8, indicating a high average likeli-hood of overall repatronage intentions. The relative aver-age sizes of the billing dimension gain and loss variables(.656 and .134, respectively) indicate that on average,
Bolton et al. / LOYALTY PROGRAM MEMBERSHIP 101
TABLE 1Model Constructs
Construct Measure Reliability
Dependent variablesStayDecisionit Indicator variable that takes on the value 1 if the subscriber canceled service and 0 if the
subscriber retained service, during t = 1.UsageDecisionit Number of transactions during t = 1.
Predictor variablesIntentit – 1 StayDecisionit: Measure of repatronage intention of the customer toward the company, Cronbach’s alpha = 0.69
which is the average of three items: his or her likelihood to recommend, to renew, orto increase share with company.
UsageDecisionit: Duration of the customer’s relationship with the company.OwnSatit – 1 Measured on four dimensions: billing aspects, product benefits, overall quality, overall
price.Average of vector of ratings variables describing the company’s current service levels on 1. Cronbach’s alpha = 0.54billing aspects: reasonable time to make payments, ease of reading and understandingstatements.
Average of vector of ratings variables describing the company’s product benefits: 2. Cronbach’s alpha = 0.76dependable, for successful people, good for travelers, best for business people,prestigious product.
Overall qualityOverall price
CompSatit – 1 Calculated as above for competitors: billing aspects, product benefits, overall quality, 1. Cronbach’s alpha = 0.66overall price. 2. Cronbach’s alpha = 0.75
NonCompit – 1 Vector of indicator variables where 1 indicates the presence of an event and 0 its absence:replacement of card, called customer service, used card to obtain cash, experiencedany problems.
Intent*LoyaltyI Intentions measure, multiplied by an indicator variable that takes on the value 1 if thesubscriber was a member of the loyalty program, 0 otherwise.
Experienceit – 1 Number of transactions during t = 0.
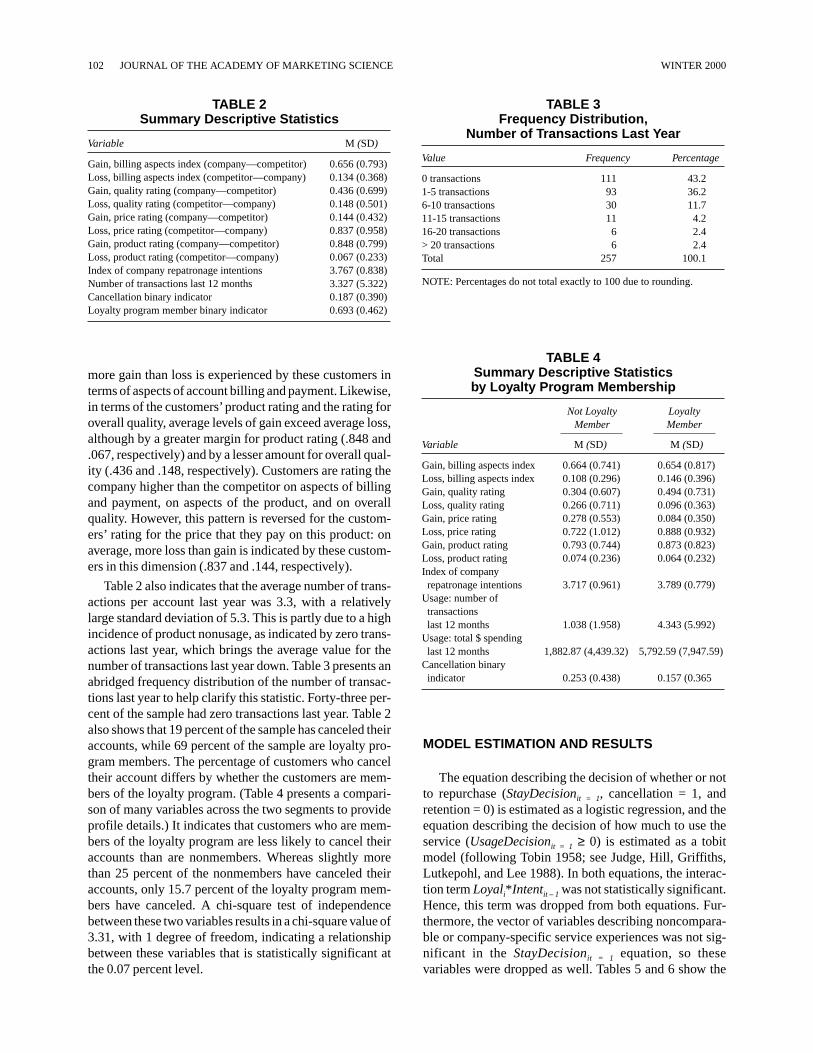
more gain than loss is experienced by these customers interms of aspects of account billing and payment. Likewise,in terms of the customers’product rating and the rating foroverall quality, average levels of gain exceed average loss,although by a greater margin for product rating (.848 and.067, respectively) and by a lesser amount for overall qual-ity (.436 and .148, respectively). Customers are rating thecompany higher than the competitor on aspects of billingand payment, on aspects of the product, and on overallquality. However, this pattern is reversed for the custom-ers’ rating for the price that they pay on this product: onaverage, more loss than gain is indicated by these custom-ers in this dimension (.837 and .144, respectively).
Table 2 also indicates that the average number of trans-actions per account last year was 3.3, with a relativelylarge standard deviation of 5.3. This is partly due to a highincidence of product nonusage, as indicated by zero trans-actions last year, which brings the average value for thenumber of transactions last year down. Table 3 presents anabridged frequency distribution of the number of transac-tions last year to help clarify this statistic. Forty-three per-cent of the sample had zero transactions last year. Table 2also shows that 19 percent of the sample has canceled theiraccounts, while 69 percent of the sample are loyalty pro-gram members. The percentage of customers who canceltheir account differs by whether the customers are mem-bers of the loyalty program. (Table 4 presents a compari-son of many variables across the two segments to provideprofile details.) It indicates that customers who are mem-bers of the loyalty program are less likely to cancel theiraccounts than are nonmembers. Whereas slightly morethan 25 percent of the nonmembers have canceled theiraccounts, only 15.7 percent of the loyalty program mem-bers have canceled. A chi-square test of independencebetween these two variables results in a chi-square value of3.31, with 1 degree of freedom, indicating a relationshipbetween these variables that is statistically significant atthe 0.07 percent level.
MODEL ESTIMATION AND RESULTS
The equation describing the decision of whether or notto repurchase (StayDecisionit = 1, cancellation = 1, andretention = 0) is estimated as a logistic regression, and theequation describing the decision of how much to use theservice (UsageDecisionit = 1 ≥ 0) is estimated as a tobitmodel (following Tobin 1958; see Judge, Hill, Griffiths,Lutkepohl, and Lee 1988). In both equations, the interac-tion term Loyali*Intentit – 1 was not statistically significant.Hence, this term was dropped from both equations. Fur-thermore, the vector of variables describing noncompara-ble or company-specific service experiences was not sig-nificant in the StayDecisionit = 1 equation, so thesevariables were dropped as well. Tables 5 and 6 show the
102 JOURNAL OF THE ACADEMY OF MARKETING SCIENCE WINTER 2000
TABLE 3Frequency Distribution,
Number of Transactions Last Year
Value Frequency Percentage
0 transactions 111 43.21-5 transactions 93 36.26-10 transactions 30 11.711-15 transactions 11 4.216-20 transactions 6 2.4> 20 transactions 6 2.4Total 257 100.1
NOTE: Percentages do not total exactly to 100 due to rounding.
TABLE 4Summary Descriptive Statisticsby Loyalty Program Membership
Not Loyalty LoyaltyMember Member
Variable M (SD) M (SD)
Gain, billing aspects index 0.664 (0.741) 0.654 (0.817)Loss, billing aspects index 0.108 (0.296) 0.146 (0.396)Gain, quality rating 0.304 (0.607) 0.494 (0.731)Loss, quality rating 0.266 (0.711) 0.096 (0.363)Gain, price rating 0.278 (0.553) 0.084 (0.350)Loss, price rating 0.722 (1.012) 0.888 (0.932)Gain, product rating 0.793 (0.744) 0.873 (0.823)Loss, product rating 0.074 (0.236) 0.064 (0.232)Index of companyrepatronage intentions 3.717 (0.961) 3.789 (0.779)
Usage: number oftransactionslast 12 months 1.038 (1.958) 4.343 (5.992)
Usage: total $ spendinglast 12 months 1,882.87 (4,439.32) 5,792.59 (7,947.59)
Cancellation binaryindicator 0.253 (0.438) 0.157 (0.365
TABLE 2Summary Descriptive Statistics
Variable M (SD)
Gain, billing aspects index (company—competitor) 0.656 (0.793)Loss, billing aspects index (competitor—company) 0.134 (0.368)Gain, quality rating (company—competitor) 0.436 (0.699)Loss, quality rating (competitor—company) 0.148 (0.501)Gain, price rating (company—competitor) 0.144 (0.432)Loss, price rating (competitor—company) 0.837 (0.958)Gain, product rating (company—competitor) 0.848 (0.799)Loss, product rating (competitor—company) 0.067 (0.233)Index of company repatronage intentions 3.767 (0.838)Number of transactions last 12 months 3.327 (5.322)Cancellation binary indicator 0.187 (0.390)Loyalty program member binary indicator 0.693 (0.462)
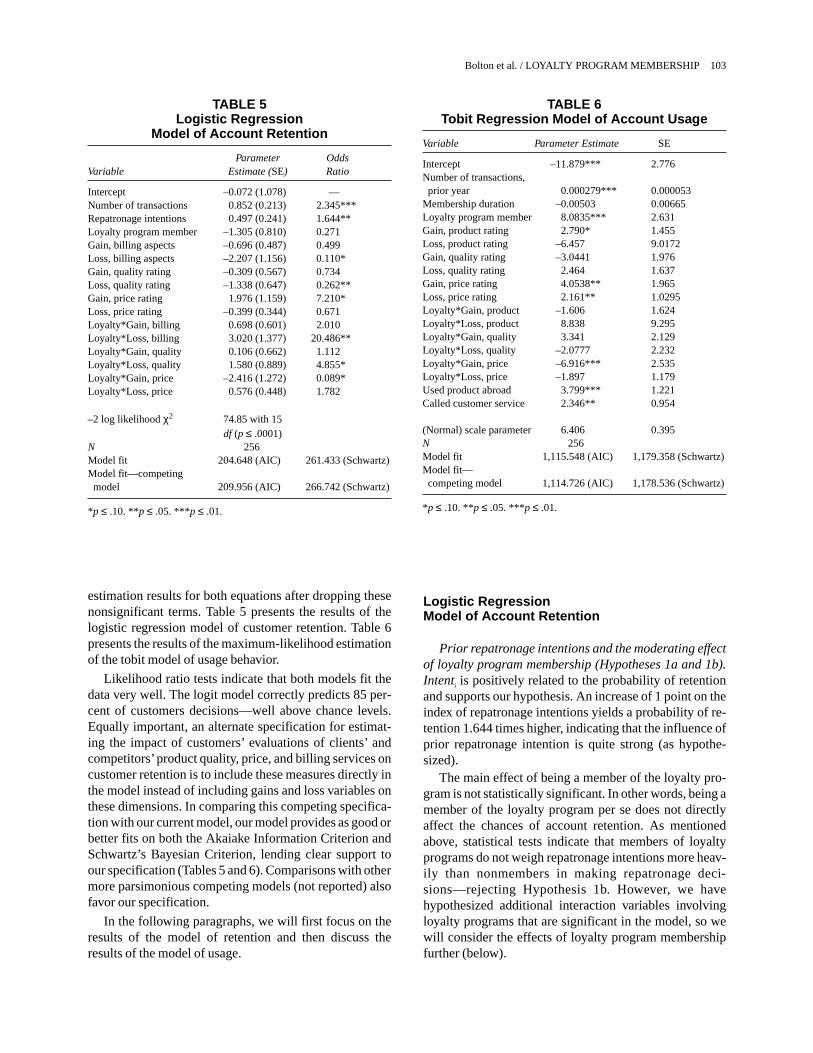
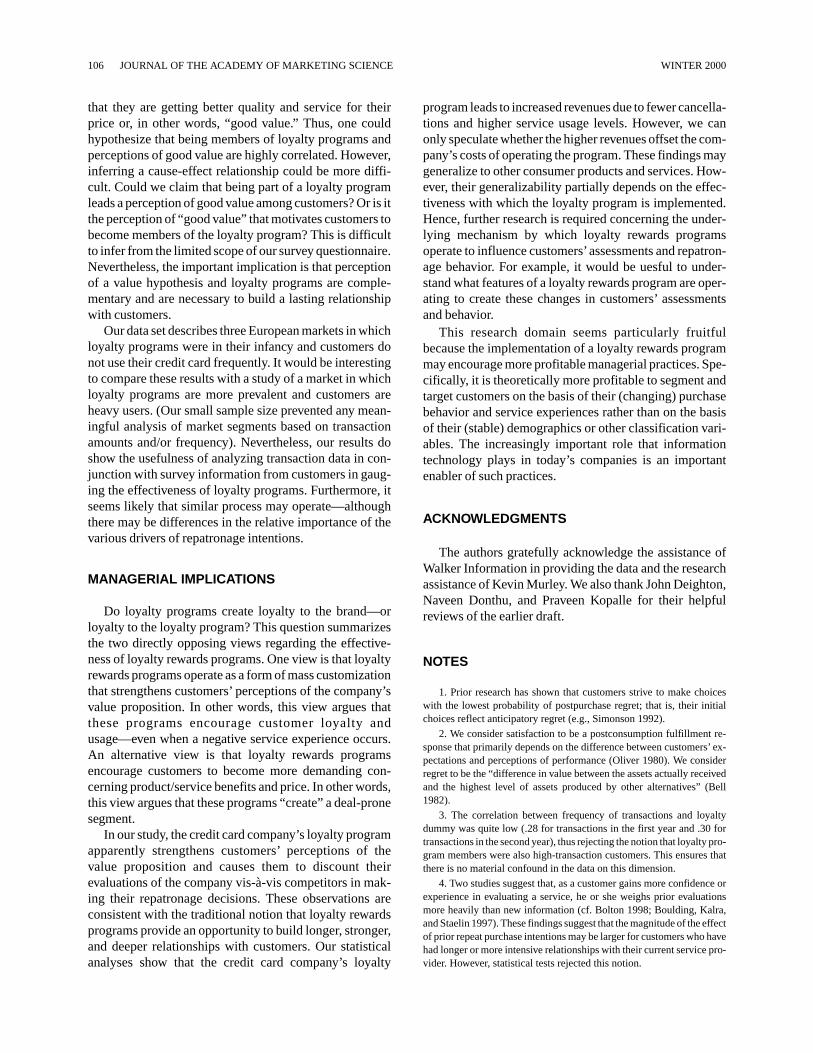
estimation results for both equations after dropping thesenonsignificant terms. Table 5 presents the results of thelogistic regression model of customer retention. Table 6presents the results of the maximum-likelihood estimationof the tobit model of usage behavior.
Likelihood ratio tests indicate that both models fit thedata very well. The logit model correctly predicts 85 per-cent of customers decisions—well above chance levels.Equally important, an alternate specification for estimat-ing the impact of customers’ evaluations of clients’ andcompetitors’product quality, price, and billing services oncustomer retention is to include these measures directly inthe model instead of including gains and loss variables onthese dimensions. In comparing this competing specifica-tion with our current model, our model provides as good orbetter fits on both the Akaiake Information Criterion andSchwartz’s Bayesian Criterion, lending clear support toour specification (Tables 5 and 6). Comparisons with othermore parsimonious competing models (not reported) alsofavor our specification.
In the following paragraphs, we will first focus on theresults of the model of retention and then discuss theresults of the model of usage.
Logistic RegressionModel of Account Retention
Prior repatronage intentions and the moderating effectof loyalty program membership (Hypotheses 1a and 1b).Intenti is positively related to the probability of retentionand supports our hypothesis. An increase of 1 point on theindex of repatronage intentions yields a probability of re-tention 1.644 times higher, indicating that the influence ofprior repatronage intention is quite strong (as hypothe-sized).
The main effect of being a member of the loyalty pro-gram is not statistically significant. In other words, being amember of the loyalty program per se does not directlyaffect the chances of account retention. As mentionedabove, statistical tests indicate that members of loyaltyprograms do not weigh repatronage intentions more heav-ily than nonmembers in making repatronage deci-sions—rejecting Hypothesis 1b. However, we havehypothesized additional interaction variables involvingloyalty programs that are significant in the model, so wewill consider the effects of loyalty program membershipfurther (below).
Bolton et al. / LOYALTY PROGRAM MEMBERSHIP 103
TABLE 5Logistic Regression
Model of Account Retention
Parameter OddsVariable Estimate (SE) Ratio
Intercept –0.072 (1.078) —Number of transactions 0.852 (0.213) 2.345***Repatronage intentions 0.497 (0.241) 1.644**Loyalty program member –1.305 (0.810) 0.271Gain, billing aspects –0.696 (0.487) 0.499Loss, billing aspects –2.207 (1.156) 0.110*Gain, quality rating –0.309 (0.567) 0.734Loss, quality rating –1.338 (0.647) 0.262**Gain, price rating 1.976 (1.159) 7.210*Loss, price rating –0.399 (0.344) 0.671Loyalty*Gain, billing 0.698 (0.601) 2.010Loyalty*Loss, billing 3.020 (1.377) 20.486**Loyalty*Gain, quality 0.106 (0.662) 1.112Loyalty*Loss, quality 1.580 (0.889) 4.855*Loyalty*Gain, price –2.416 (1.272) 0.089*Loyalty*Loss, price 0.576 (0.448) 1.782
–2 log likelihood χ2 74.85 with 15df (p ≤ .0001)
N 256Model fit 204.648 (AIC) 261.433 (Schwartz)Model fit—competingmodel 209.956 (AIC) 266.742 (Schwartz)
*p ≤ .10. **p ≤ .05. ***p ≤ .01.
TABLE 6Tobit Regression Model of Account Usage
Variable Parameter Estimate SE
Intercept –11.879*** 2.776Number of transactions,prior year 0.000279*** 0.000053
Membership duration –0.00503 0.00665Loyalty program member 8.0835*** 2.631Gain, product rating 2.790* 1.455Loss, product rating –6.457 9.0172Gain, quality rating –3.0441 1.976Loss, quality rating 2.464 1.637Gain, price rating 4.0538** 1.965Loss, price rating 2.161** 1.0295Loyalty*Gain, product –1.606 1.624Loyalty*Loss, product 8.838 9.295Loyalty*Gain, quality 3.341 2.129Loyalty*Loss, quality –2.0777 2.232Loyalty*Gain, price –6.916*** 2.535Loyalty*Loss, price –1.897 1.179Used product abroad 3.799*** 1.221Called customer service 2.346** 0.954
(Normal) scale parameter 6.406 0.395N 256Model fit 1,115.548 (AIC) 1,179.358 (Schwartz)Model fit—competing model 1,114.726 (AIC) 1,178.536 (Schwartz)
*p ≤ .10. **p ≤ .05. ***p ≤ .01.
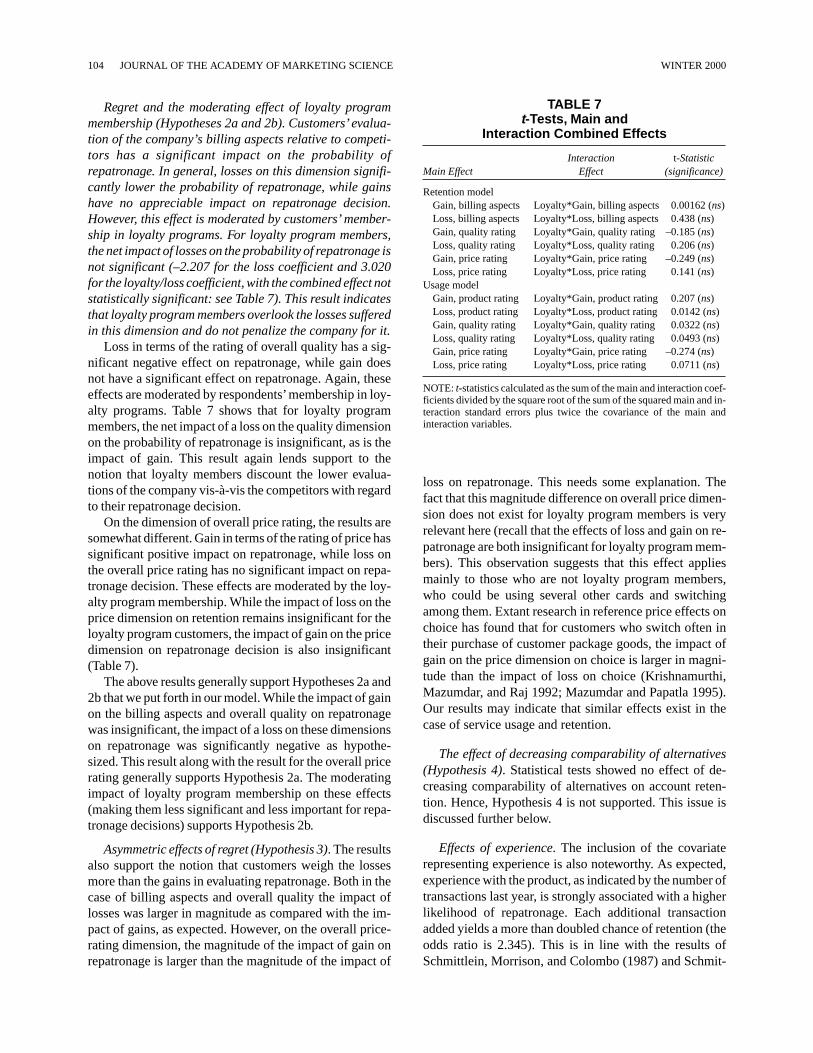
Regret and the moderating effect of loyalty programmembership (Hypotheses 2a and 2b). Customers’ evalua-tion of the company’s billing aspects relative to competi-tors has a significant impact on the probability ofrepatronage. In general, losses on this dimension signifi-cantly lower the probability of repatronage, while gainshave no appreciable impact on repatronage decision.However, this effect is moderated by customers’ member-ship in loyalty programs. For loyalty program members,the net impact of losses on the probability of repatronage isnot significant (–2.207 for the loss coefficient and 3.020for the loyalty/loss coefficient, with the combined effect notstatistically significant: see Table 7). This result indicatesthat loyalty program members overlook the losses sufferedin this dimension and do not penalize the company for it.
Loss in terms of the rating of overall quality has a sig-nificant negative effect on repatronage, while gain doesnot have a significant effect on repatronage. Again, theseeffects are moderated by respondents’membership in loy-alty programs. Table 7 shows that for loyalty programmembers, the net impact of a loss on the quality dimensionon the probability of repatronage is insignificant, as is theimpact of gain. This result again lends support to thenotion that loyalty members discount the lower evalua-tions of the company vis-à-vis the competitors with regardto their repatronage decision.
On the dimension of overall price rating, the results aresomewhat different. Gain in terms of the rating of price hassignificant positive impact on repatronage, while loss onthe overall price rating has no significant impact on repa-tronage decision. These effects are moderated by the loy-alty program membership. While the impact of loss on theprice dimension on retention remains insignificant for theloyalty program customers, the impact of gain on the pricedimension on repatronage decision is also insignificant(Table 7).
The above results generally support Hypotheses 2a and2b that we put forth in our model. While the impact of gainon the billing aspects and overall quality on repatronagewas insignificant, the impact of a loss on these dimensionson repatronage was significantly negative as hypothe-sized. This result along with the result for the overall pricerating generally supports Hypothesis 2a. The moderatingimpact of loyalty program membership on these effects(making them less significant and less important for repa-tronage decisions) supports Hypothesis 2b.
Asymmetric effects of regret (Hypothesis 3). The resultsalso support the notion that customers weigh the lossesmore than the gains in evaluating repatronage. Both in thecase of billing aspects and overall quality the impact oflosses was larger in magnitude as compared with the im-pact of gains, as expected. However, on the overall price-rating dimension, the magnitude of the impact of gain onrepatronage is larger than the magnitude of the impact of
loss on repatronage. This needs some explanation. Thefact that this magnitude difference on overall price dimen-sion does not exist for loyalty program members is veryrelevant here (recall that the effects of loss and gain on re-patronage are both insignificant for loyalty program mem-bers). This observation suggests that this effect appliesmainly to those who are not loyalty program members,who could be using several other cards and switchingamong them. Extant research in reference price effects onchoice has found that for customers who switch often intheir purchase of customer package goods, the impact ofgain on the price dimension on choice is larger in magni-tude than the impact of loss on choice (Krishnamurthi,Mazumdar, and Raj 1992; Mazumdar and Papatla 1995).Our results may indicate that similar effects exist in thecase of service usage and retention.
The effect of decreasing comparability of alternatives(Hypothesis 4). Statistical tests showed no effect of de-creasing comparability of alternatives on account reten-tion. Hence, Hypothesis 4 is not supported. This issue isdiscussed further below.
Effects of experience. The inclusion of the covariaterepresenting experience is also noteworthy. As expected,experience with the product, as indicated by the number oftransactions last year, is strongly associated with a higherlikelihood of repatronage. Each additional transactionadded yields a more than doubled chance of retention (theodds ratio is 2.345). This is in line with the results ofSchmittlein, Morrison, and Colombo (1987) and Schmit-
104 JOURNAL OF THE ACADEMY OF MARKETING SCIENCE WINTER 2000
TABLE 7t-Tests, Main and
Interaction Combined Effects
Interaction t-StatisticMain Effect Effect (significance)
Retention modelGain, billing aspects Loyalty*Gain, billing aspects 0.00162 (ns)Loss, billing aspects Loyalty*Loss, billing aspects 0.438 (ns)Gain, quality rating Loyalty*Gain, quality rating –0.185 (ns)Loss, quality rating Loyalty*Loss, quality rating 0.206 (ns)Gain, price rating Loyalty*Gain, price rating –0.249 (ns)Loss, price rating Loyalty*Loss, price rating 0.141 (ns)
Usage modelGain, product rating Loyalty*Gain, product rating 0.207 (ns)Loss, product rating Loyalty*Loss, product rating 0.0142 (ns)Gain, quality rating Loyalty*Gain, quality rating 0.0322 (ns)Loss, quality rating Loyalty*Loss, quality rating 0.0493 (ns)Gain, price rating Loyalty*Gain, price rating –0.274 (ns)Loss, price rating Loyalty*Loss, price rating 0.0711 (ns)
NOTE: t-statistics calculated as the sum of the main and interaction coef-ficients divided by the square root of the sum of the squared main and in-teraction standard errors plus twice the covariance of the main andinteraction variables.
tlein and Peterson (1994), who find that customers withvery few transactions are most likely to cancel.4
Tobit Model of Account Usage
Table 6 provides the results of the tobit regressionmodel of usage where usage behavior is measured by thenumber of transactions. (Note that customers’ number oftransactions is positively affected by the number of trans-actions they had in the previous year.) Since many of theresults are similar to the logit model of account retention,we focus on new findings.
The moderating effect of loyalty program membership(Hypotheses 1a, 1b, 2a, 2b, 3). Hypotheses 1a and 1b arenot supported. The effect of membership duration (Intenti)is not statistically significant—probably because the effectof the prior year’s number of transactions (Experienceit = 0)is highly statistically significant. (Under these circum-stances, it is not surprising that the interaction of member-ship duration and loyalty program membership was notstatistically significant.) However, the main effect of loy-alty program membership is highly statistically signifi-cant. In other words, loyalty program members use theircredit card more than nonmembers.
Customers’ evaluation of the company relative to com-petitors (i.e., regret) also has a significant impact on creditcard usage. In particular, the results concerning the impactof loyalty program membership on usage are very similarto the results of the model of retention. Being a loyalty pro-gram member has a strong positive impact on the numberof transactions. For nonloyalty program members, gainson the product dimension have a positive impact on thenumber of transactions, while gains and losses on the qual-ity dimension have no impact on the number of transac-tions. Both gains and losses on the price dimension have apositive impact on usage, with the magnitude of the impactof gains much larger than the impact of losses. While thepositive impact of losses is counterintuitive, this anomalycould be attributed to measuring usage behavior by usingjust one dimension, number of transactions, and not sup-plementing it with total spending or average spending pertransaction.5 The interaction effect of loyalty programmembership on the gains and losses is identical to thosefound in the model of repatronage decision. As before, theloyalty program membership moderates the impact of gainsand losses on the number of transactions (see Table 7).These results lend further support to Hypotheses 2 and 3.
The effect of decreasing comparability of alternatives(Hypothesis 4). Recall that, in testing alternative specifica-tions of the logit model of account retention, we found noeffect due to variables representing decreasing compara-bility of alternatives. In contrast, in the tobit model of ac-count usage, the number of transactions is positively
related to customers using the credit card abroad and tocustomers calling customer service. This credit card com-pany has a reputation for universal acceptability and re-nowned customer service. Customers who use the cardabroad or interact with the company’s customer serviceexperience its unique features and thus are likely to view al-ternative credit cards as less comparable. Hence, the posi-tive impact of these two variables supports Hypothesis 4.
DISCUSSION
The study findings suggest that customers make repa-tronage decisions for the credit card service on the basis oftheir prior repatronage intentions or behavior, updated bycomparisons of their prior satisfaction levels with the com-pany versus their satisfaction with a competitor. However,their comparisons are relatively complex—customersmake comparisons on multiple underlying service dimen-sions and (usually) weigh losses more heavily than gains.
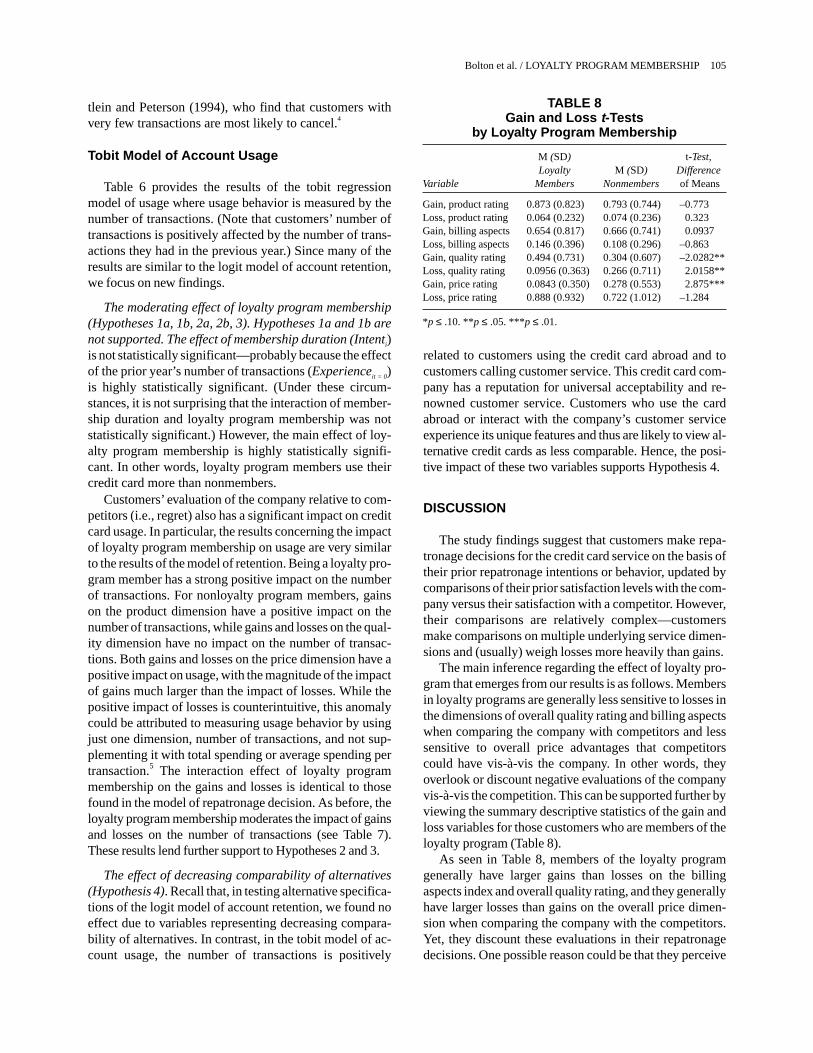
The main inference regarding the effect of loyalty pro-gram that emerges from our results is as follows. Membersin loyalty programs are generally less sensitive to losses inthe dimensions of overall quality rating and billing aspectswhen comparing the company with competitors and lesssensitive to overall price advantages that competitorscould have vis-à-vis the company. In other words, theyoverlook or discount negative evaluations of the companyvis-à-vis the competition. This can be supported further byviewing the summary descriptive statistics of the gain andloss variables for those customers who are members of theloyalty program (Table 8).
As seen in Table 8, members of the loyalty programgenerally have larger gains than losses on the billingaspects index and overall quality rating, and they generallyhave larger losses than gains on the overall price dimen-sion when comparing the company with the competitors.Yet, they discount these evaluations in their repatronagedecisions. One possible reason could be that they perceive
Bolton et al. / LOYALTY PROGRAM MEMBERSHIP 105
TABLE 8Gain and Loss t-Tests
by Loyalty Program Membership
M (SD) t-Test,Loyalty M (SD) Difference
Variable Members Nonmembers of Means
Gain, product rating 0.873 (0.823) 0.793 (0.744) –0.773Loss, product rating 0.064 (0.232) 0.074 (0.236) 0.323Gain, billing aspects 0.654 (0.817) 0.666 (0.741) 0.0937Loss, billing aspects 0.146 (0.396) 0.108 (0.296) –0.863Gain, quality rating 0.494 (0.731) 0.304 (0.607) –2.0282**Loss, quality rating 0.0956 (0.363) 0.266 (0.711) 2.0158**Gain, price rating 0.0843 (0.350) 0.278 (0.553) 2.875***Loss, price rating 0.888 (0.932) 0.722 (1.012) –1.284
*p ≤ .10. **p ≤ .05. ***p ≤ .01.
that they are getting better quality and service for theirprice or, in other words, “good value.” Thus, one couldhypothesize that being members of loyalty programs andperceptions of good value are highly correlated. However,inferring a cause-effect relationship could be more diffi-cult. Could we claim that being part of a loyalty programleads a perception of good value among customers? Or is itthe perception of “good value” that motivates customers tobecome members of the loyalty program? This is difficultto infer from the limited scope of our survey questionnaire.Nevertheless, the important implication is that perceptionof a value hypothesis and loyalty programs are comple-mentary and are necessary to build a lasting relationshipwith customers.
Our data set describes three European markets in whichloyalty programs were in their infancy and customers donot use their credit card frequently. It would be interestingto compare these results with a study of a market in whichloyalty programs are more prevalent and customers areheavy users. (Our small sample size prevented any mean-ingful analysis of market segments based on transactionamounts and/or frequency). Nevertheless, our results doshow the usefulness of analyzing transaction data in con-junction with survey information from customers in gaug-ing the effectiveness of loyalty programs. Furthermore, itseems likely that similar process may operate—althoughthere may be differences in the relative importance of thevarious drivers of repatronage intentions.
MANAGERIAL IMPLICATIONS
Do loyalty programs create loyalty to the brand—orloyalty to the loyalty program? This question summarizesthe two directly opposing views regarding the effective-ness of loyalty rewards programs. One view is that loyaltyrewards programs operate as a form of mass customizationthat strengthens customers’ perceptions of the company’svalue proposition. In other words, this view argues thatthese programs encourage customer loyalty andusage—even when a negative service experience occurs.An alternative view is that loyalty rewards programsencourage customers to become more demanding con-cerning product/service benefits and price. In other words,this view argues that these programs “create” a deal-pronesegment.
In our study, the credit card company’s loyalty programapparently strengthens customers’ perceptions of thevalue proposition and causes them to discount theirevaluations of the company vis-à-vis competitors in mak-ing their repatronage decisions. These observations areconsistent with the traditional notion that loyalty rewardsprograms provide an opportunity to build longer, stronger,and deeper relationships with customers. Our statisticalanalyses show that the credit card company’s loyalty
program leads to increased revenues due to fewer cancella-tions and higher service usage levels. However, we canonly speculate whether the higher revenues offset the com-pany’s costs of operating the program. These findings maygeneralize to other consumer products and services. How-ever, their generalizability partially depends on the effec-tiveness with which the loyalty program is implemented.Hence, further research is required concerning the under-lying mechanism by which loyalty rewards programsoperate to influence customers’assessments and repatron-age behavior. For example, it would be uesful to under-stand what features of a loyalty rewards program are oper-ating to create these changes in customers’ assessmentsand behavior.
This research domain seems particularly fruitfulbecause the implementation of a loyalty rewards programmay encourage more profitable managerial practices. Spe-cifically, it is theoretically more profitable to segment andtarget customers on the basis of their (changing) purchasebehavior and service experiences rather than on the basisof their (stable) demographics or other classification vari-ables. The increasingly important role that informationtechnology plays in today’s companies is an importantenabler of such practices.
ACKNOWLEDGMENTS
The authors gratefully acknowledge the assistance ofWalker Information in providing the data and the researchassistance of Kevin Murley. We also thank John Deighton,Naveen Donthu, and Praveen Kopalle for their helpfulreviews of the earlier draft.
NOTES
1. Prior research has shown that customers strive to make choiceswith the lowest probability of postpurchase regret; that is, their initialchoices reflect anticipatory regret (e.g., Simonson 1992).
2. We consider satisfaction to be a postconsumption fulfillment re-sponse that primarily depends on the difference between customers’ ex-pectations and perceptions of performance (Oliver 1980). We considerregret to be the “difference in value between the assets actually receivedand the highest level of assets produced by other alternatives” (Bell1982).
3. The correlation between frequency of transactions and loyaltydummy was quite low (.28 for transactions in the first year and .30 fortransactions in the second year), thus rejecting the notion that loyalty pro-gram members were also high-transaction customers. This ensures thatthere is no material confound in the data on this dimension.
4. Two studies suggest that, as a customer gains more confidence orexperience in evaluating a service, he or she weighs prior evaluationsmore heavily than new information (cf. Bolton 1998; Boulding, Kalra,and Staelin 1997). These findings suggest that the magnitude of the effectof prior repeat purchase intentions may be larger for customers who havehad longer or more intensive relationships with their current service pro-vider. However, statistical tests rejected this notion.
106 JOURNAL OF THE ACADEMY OF MARKETING SCIENCE WINTER 2000
5. However, this concern is mitigated on further analysis of the usageof those nonloyal consumers who have experienced losses on the price di-mension. We found that two outlier observations with large losses and anunusually large number of transactions were skewing the general patternof a negative impact.
REFERENCES
Adams, J. Stacy. 1965. “Inequity in Social Exchange.” In Advances in Ex-perimental Social Psychology, Vol. 2. Ed. Leonard Berkowitz. NewYork: Academic Press, 267-299.
Anderson, Eugene W., Claes Fornell, and Donald R. Lehmann. 1994.“Customer Satisfaction, Market Share and Profitability: FindingsFrom Sweden.” Journal of Marketing 58 (July): 53-66.
Bearden, William O. and Jesse E. Teel. 1983. “Selected Determinants ofCustomer Satisfaction and Complaint Reports.” Journal of Market-ing Research 20 (February): 21-28.
Bell, David E. 1982. “Regret in Decision Making Under Uncertainty.”Operations Research 30:961-981.
Bendapudi, Neeli and Leonard L. Berry. 1997. “Customers’ Motivationsfor Maintaining Relationships With Service Providers.” Journal ofRetailing 73 (1): 15-37.
Bettman, James R. and Mita Sujan. 1987. “Effects of Framing on Evalua-tion of Comparable and Noncomparable Alternatives by Expert andNovice Customers.” Journal of Customer Research 14 (September):141-154.
Bolton, Ruth N. 1998. “A Dynamic Model of the Duration of the Cus-tomer’s Relationship With a Continuous Service Provider: The Roleof Satisfaction.” Marketing Science 17 (1): 45-65.
and Katherine N. Lemon. 1999. “A Dynamic Model of Custom-ers’ Usage of Services: Usage as an Antecedent and Consequence ofSatisfaction.” Journal of Marketing Research 36 (2): 171-186.
Boulding, William, Richard Staelin, Ajay Kalra, and Valarie Zeithaml.1993. “A Dynamic Process Model of Service Quality: From Expecta-tions to Behavioral Intentions.” Journal of Marketing Research 30(February): 7-27.
, Ajay Kalra, and Richard Staelin. 1997. “The Quality DoubleWhammy: The Rich Stay Rich and the Poor Stay Poor.” Working pa-per. Duke University, Durham, NC.
Bowman, Douglas and Shilpa Lele-Pingle. 1997. “Buyer Behavior inBusiness-to-Business Services: The Case of Foreign Exchange.” In-ternational Journal of Research in Marketing 14 (5): 499-508.
Collopy, Fred. 1996. “Biases in Retrospective Self-Reports of Time Use:An Empirical Study of Computer Users.” Management Science 52(5): 758-767.
Crosby, Lawrence A. and Nancy Stephens. 1987. “Effects of Relation-ship Marketing on Satisfaction, Retention, and Prices in the Life In-surance Industry.” Journal of Marketing Research 24 (November):404-411.
Dick, Alan S. and Kunal Basu. 1994. “Customer Loyalty: Toward an Inte-grated Conceptual Framework.” Journal of the Academy of Market-ing Science 22 (2): 99-113.
Gilly, Mary C. and Betsy D. Gelb. 1982. “Post-Purchase Customer Proc-esses and the Complaining Customer.” Journal of Customer Re-search 9 (December): 323-328.
Hogarth, R. and H. Einhorn. 1992. “Order Effects in Belief Updating:The Belief-Adjustment Model.” Cognitive Psychology 24:1-55.
Inman, J. Jeffrey, James S. Dyer, and Jianmin Jia. 1997. ”A GeneralizedUtility Model of Disappointment and Regret Effects on Post-ChoiceValuation.” Marketing Science 16 (2): 97-111.
Johnson, Michael D. 1984. “Customer Choice Strategies for ComparingNoncomparable Alternatives.” Journal of Customer Research 11(December): 741-753.
and Seigyoung Auh. 1999. “Compatability Effects in Evalua-tions of Customer Satisfaction and Loyalty.” International Journal ofResearch in Marketing 17 (4).
Jones, Thomas O. and W. Earl Sasser Jr. 1995. “Why Satisfied CustomersDefect.” Harvard Business Review 73 (6): 89-99.
Judge, G. G., R. C. Hill, W. E. Griffiths, H. Lutkepohl, and T. C. Lee.1988. Introduction to the theory and practice of econometrics. 2nded. New York: John Wiley.
Keaveney, Susan M. 1995. “Customer Switching Behavior in Service In-dustries: An Exploratory Study.” Journal of Marketing 59 (April):71-82.
Krishnamurthi, Lakshman, Tridib Mazumdar, and S. P. Raj. 1992.“Asymmetric Response to Price in Consumer Brand Choice and Pur-chase Quantity Decisions.” Journal of Consumer Research 19 (De-cember): 387-400.
LaBarbera, Priscilla A. and David Mazursky. 1983. “A Longitudinal As-sessment of Customer Satisfaction/Dissatisfaction: The DynamicAspect of the Cognitive Process.” Journal of Marketing Research 20(November): 393-404.
Loomes, Graham and Robert Sugden. 1982. “Regret Theory: An Alter-native Theory of Rational Choice Under Uncertainty.” The EconomicJournal 92 (December): 805-824.
Luce, Mary Frances. 1998. “Choosing to Avoid: Coping With NegativelyEmotion-Laden Customer Decisions.” Journal of Customer Re-search 24 (March): 409-424.
Mazumdar, Tridib and Purushottam Papatla. 1995. “Loyalty Differencesin the Use of Internal and External Reference Prices.” Marketing Let-ters 6 (March): 111-122.
Morwitz, Vicki. 1997. “Why Customers Don’t Always Accurately Pre-dict Their Own Future Behavior.” Marketing Letters 8 (1): 57-70.
and David Schmittlein. 1992. “Using Segmentation to ImproveSales Forecasts Based on Purchase Intent: Which “Intenders’ Actu-ally Buy.” Journal of Marketing Research 29 (November): 391-405.
Nowlis, S. M. and Itamar Simonson. 1997. “Attribute-Task Compatibil-ity as a Determinant of Customer Preference Reversals.” Journal ofMarketing Research 34:205-218.
O’Brien, Louise and Charles Jones. 1995. “Do Rewards Really CreateLoyalty?” Harvard Business Review 73 (May-June): 75-82.
Oliver, Richard. 1980. “A Cognitive Model of the Antecedents and Con-sequences of Satisfaction Decisions.” Journal of Marketing Research17:460-469.
Reichheld, Fredrick F. and W. Earl Sasser. 1990. “Zero Defections:Quality Comes to Services.” Harvard Business Review 14 (March):495-507.
Riley, F. Dall’Olmo, A.S.C. Ehrenberg, S. B. Castleberry, T. P. Barwise,and N. R. Barnard. 1997. “The Variability of Attitudinal Repeat-Rates.” International Journal of Research in Marketing 14 (5):437-450.
Rust, Roland T., Jeffrey Inman, and Anthony Zahorik. 1995. “A BayesianModel of Quality and Customer Retention.” Working Paper. Vander-bilt University, Nashville, TN.
and Richard Metters. 1996. “Mathematical Models of Service.”European Journal of Operational Research 91 (June): 427-439.
Schmittlein, David C., Donald G. Morrison, and Richard Colombo.1987. “Counting Your Customers: Who Are They and What WillThey Do Next.” Management Science 33 (January): 1-24.
and Robert A. Peterson. 1994. “Customer Base Analysis: An In-dustrial Purchase Process Application.” Marketing Science 13 (Win-ter): 41-67.
Schul, Yaacov and Miriam Schiff. 1993. “Measuring Satisfaction WithOrganizations.” Public Opinion Quarterly 57 (4): 536-551.
Simonson, Itamar. 1992. “The Influence of Anticipating Regret and Re-sponsibility on Purchase Decisions.” Journal of Customer Research19:105-118.
and Amos Tversky. 1992. “Choice in Context: Tradeoff Contrastand Extremeness Aversion.” Journal of Marketing Research 29(August): 281-295.
Solnick, Sara J. and David Hemenway. 1992. “Complaints and Disen-rollment at a Health Maintenance Organization.” Journal of Cus-tomer Affairs 26 (1): 90-103.
Thaler, Richard. 1985. “Mental Accounting and Customer Choice.”Marketing Science 4 (Summer): 199-214.
Tobin, James. 1958. “Estimation of Relationships for Limited DependentVariables.” Econometrica 31:24-36.
Uncles, Mark and Gilles Laurent. 1997. “Editorial, Special Issue on Loy-alty.” International Journal of Research in Marketing 14: 399-404.
Bolton et al. / LOYALTY PROGRAM MEMBERSHIP 107
Zahorik, Anthony J. and Roland T. Rust. 1992. “Modeling the Impact ofService Quality on Profitability: A Review.” In Advances in ServicesMarketing, Vol 1. Eds. T. Swartz and R. Oliver. Greenwich, CT: JAI,247-276.
ABOUT THE AUTHORS
Ruth N. Bolton is Ruby K. Powell Professor of Marketing in theMichael F. Price College of Business at the University of Okla-homa. Her current research is concerned with high-technologyservices sold to business-to-business customers. Her most recentwork in this area studies how organizations can grow the value oftheir customer base through customer service and support. Shepreviously held positions at the University of Maryland, GTELaboratories Incorporated, the University of Alberta, Carnegie-Mellon University, and the University of British Columbia. Herbusiness experience involves a variety of consulting projects ad-dressing services marketing, customer satisfaction, and qualitymanagement issues in the telecommunications and informationservices industries. Her earlier published research investigateshow organizations’customer service and pricing strategies influ-ence customer satisfaction and loyalty. She received herB.Comm. with honors from Queen’s University at Kingston andher M.Sc. and Ph.D. from Carnegie-Mellon University. She cur-rently serves on the editorial boards of the Journal of Retailing,the Journal of Marketing, Marketing Science, Marketing Letters,the Journal of Marketing Research, and the Journal of ServiceResearch. She has published articles in these and other journals.
P. K. Kannan is Safeway Fellow and Associate Professor ofMarketing in the Smith School of Business at the University ofMaryland. He received his Ph.D. from Purdue University. His re-search and teaching interests are in electronic commerce, andmarketing research and modeling. His research on competitivemarket structures, consumers’ loyalty, variety seeking, and rein-
forcement behaviors, and the effects of promotions on competi-tion have appeared in Marketing Science, Management Science,Journal of Business Research, and International Journal of Re-search in Marketing. His current interests center on marketing ofinformation products such as market research; software; dataproducts using electronic channels such as the Internet coveringissues of strategy, pricing, and product reliability. Articles focus-ing on these issues have appeared or are forthcoming in Commu-nications of the ACM, International Journal of ElectronicCommerce, and the Handbook of Electronic Commerce. He is amember of the American Marketing Association, the Institute ofManagement Science, and the American Statistical Association.He has corporate experience with Tata Engineering andIngersoll-Rand and has consulted for companies such as Frito-Lay, Pepsi Co, SAIC, and Fannie Mae. Prior to joining the Uni-versity of Maryland, he was on the faculty of the University ofArizona, Tucson.
Matthew D. Bramlett is a doctoral candidate in the Departmentof Sociology and a faculty research assistant in the Department ofMarketing at the University of Maryland, College Park. His dis-sertation is an event history analysis of the effects of children onthe stability of marriages and cohabitations. His current researchfocuses on high-technology services sold to business-to-businesscustomers. His other research interests include the commodifica-tion of sports and the exploitation of the consumer in professionalsports, and the fertility effects of family planning programs in de-veloping countries over time. He is a member of the PopulationAssociation of America and a member of the Family; Sociologyof Population; and Race, Gender, and Class sections of theAmerican Sociological Association. His work on the exploita-tion of the consumer in the National Football League will be pub-lished as a chapter in the forthcoming book Consumers,Commodification and Media Culture: Perspectives on the NewForms of Consumption, edited by Mark Gottdiener, University ofNew York at Buffalo.
108 JOURNAL OF THE ACADEMY OF MARKETING SCIENCE WINTER 2000