implications of diversification and focus strategiesaria.org/rts/proceedings/2002/mccullough and...
TRANSCRIPT

Implications of Corporate Diversification and Focus Strategies
Kathleen A. McCullough Assistant Professor
Florida State University Department of Risk Management/Insurance,
Real Estate, and Business Law Tallahassee, Florida 32306
Telephone: 850.644.8358 Fax: 850.644.4077
Email: [email protected]
Robert E. Hoyt **
Professor and Department Head Insurance, Legal Studies, and Real Estate
Terry College of Business University of Georgia
206 Brooks Hall Athens, GA 30602-6255 Telephone: 706.542.4290
Fax: 706.542.4295 Email: [email protected]
** designated contact author
To be presented at the Risk Theory Seminar on April 5, 2002 held at the University of Illinois.
Implications of Corporate Diversification and Focus Strategies
Abstract
This study investigates the motivations for diversification and focus strategies and the impact of these strategies on the performance and capitalization of acquirers. Using a sample of acquisitions of property-liability insurers, the study investigates the potential role of the factors underlying the decision to diversify or focus on the ultimate impact of the selected strategy. Insurers represent an attractive sample due to the extensive financial data that are available. Prior studies in this area do not control for the factors underlying the decision to diversify or focus. When we use this traditional approach, our results are consistent with prior studies. Namely, we find that diversification strategies are related to increases in the acquirers’ operating margin and overall capitalization. However, when we properly control for the factors that motivate firms to select a specific strategy, we find no relation between the focus or diversification strategy and the acquirers’ post-acquisition performance and capitalization. Our results support the view that acquirers self-select a particular diversification or focus strategy based on their needs and strengths. This suggests that it is the selection of the appropriate strategy for the right firm that enhances value rather than a specific strategy (diversification or focus) being a superior strategy for all firms. Our findings provide at least a part of the explanation for the conflicting results of prior studies concerning the relative value of diversification or focus strategies. Key words: Property-liability insurance, Treatment effects model, Self-selection bias, Acquisitions, Diversification, Focus. JEL Classification: C30, G22, G34, L11.
Implications of Corporate Diversification and Focus Strategies
I. Introduction
The value enhancing potential of diversification and focus strategies has been the topic of
a continuing debate in both the academic literature and the trade press. Based on various
samples and time periods that they considered, prior studies have found conflicting results on the
value enhancing nature of these strategies.1 This paper investigates both the motivations for
diversification or focus strategies and the impact of these strategies on the performance and
capitalization of the acquirers.
The insurance industry is chosen for this study due to the nature of acquisitions during
the sample period and the extensive financial data available. An examination of insurance
acquisitions in the 1990’s reveals a mix of diversification and focus acquisitions over the sample
period rather than a trend toward diversification or focus in the industry. This allows us to study
the impact of diversification and focus strategies in the same time period and industry, thereby
reducing possible confounding effects related to different economic conditions, inter-industry
differences, and potential herd behavior.
Extensive reporting requirements in the insurance industry allow us to create a refined
definition of diversification and focus based on the lines of business sold by the acquirers and
targets. This definition allows for the detection of diversification both into and within the
property-liability insurance industry. Prior studies using definitions based on Standard Industrial
Classification (SIC) codes only detect diversification into a new industry. The definition used in
1 Several authors found value enhancing motivations for diversification in studies based on sample periods in the late 60’s and early 70’s (e.g. Hubbard and Palia, 1999 and Matsusaka, 1993). Studies based on more current samples have shown that corporate focus increases firm value (e.g. Comment and Jarrell, 1995; Berger and Ofek, 1995; Lang and Stulz, 1994; John and Ofek, 1995; and Denis, Denis, and Sarin, 1997).
1

this paper reclassifies over half of the acquisitions that the SIC code definition would have
classified as focus acquisitions.
Prior studies in this area have generally focused either on the motivations for
diversification and focus strategies or on the impact of the strategies. Our study recognizes that
the implications of diversification and focus should be modeled as a two-stage process. First, the
motivations underlying the decision to use a diversification or focus strategy are modeled.
Second, the impact of that strategy is analyzed in light of the factors that motivated the selection
of the strategy. Failure to control for the fact that acquirers might self-select into the use of
diversification or focus strategies leads to potential bias in the interpretation of the impact of the
strategies. This potential bias may offer a partial explanation for the often-conflicting results
related to the impact of diversification or focus strategies on firm performance and capitalization
found in prior studies.
The results related to the acquirer’s decision to diversify or focus are consistent with the
traditional motivations for diversification and focus. Based on the pre-acquisition needs and
strengths of the acquirers, firms appear to self-select into the use of diversification or focus
strategies. For example, firms that would benefit from a reduction in expected future tax
liabilities tend to engage in diversification acquisitions. Additionally, firms with low pre-
acquisition levels of liquidity tend to utilize diversification transactions. Motivated by a
potential reduction in earnings volatility achieved with diversification, these firms can reduce
their expected tax liabilities and support lower levels of liquidity. The more efficient acquirers,
which are better able to deal with the increased agency costs associated with diversification, are
the firms that appear to enter diversification transactions.
2

For the data in our sample, diversification strategies are associated with increases in the
overall performance and capitalization of the acquirers when the factors motivating the decision
to diversify or focus are not controlled for. However, when the factors that influenced the
acquirer’s decision to diversify or focus are controlled for, then the diversification or focus
aspect of the acquisition does not appear to have a significant impact on the capitalization or
performance of the acquirer. This supports the view that it is the selection of the proper strategy
for the right firm that enhances value rather than the idea that use of a general strategy is
appropriate for all firms.
The remainder of the paper is divided into four sections. Section Two provides
background on the prior literature and selection of the sample. Section Three develops the
empirical framework. Section Four outlines the empirical specification of the model and
discusses the results of the paper. Finally, Section Five outlines the conclusions and implications
of the paper as well as areas for future research.
II. Background and Sample Selection
A. Background
We use acquisitions as a means to analyze the diversification and focus strategies of
firms. For this reason, literature related to diversification and focus and to mergers and
acquisitions are used as a basis for this paper. The diversification and focus literature outlines
the motivations for the use of the strategies, costs and benefits of the strategies, and the impact of
diversification and focus on firms. The merger and acquisition literature provides a general
setting or framework for examining specific diversification and focus transactions.
3

The diversification and focus literature has found value-enhancing motivations for both
strategies. During the 1960’s and 1970’s, research suggested that companies realized value
enhancing benefits from diversification strategies (e.g. Hubbard and Palia, 1999; and Matsusaka,
1993). However, in more recent years, research indicates that firms utilizing focus strategies
achieved enhanced value (e.g. Comment and Jarrell, 1995; Berger and Ofek, 1995; Lang and
Stulz, 1994; John and Ofek, 1995; and Denis, Denis, and Sarin, 1997).
The decision to diversify or focus is balanced by a series of offsetting costs and benefits.
Traditional motivations for diversification center around the benefits of smoother earnings,
increased capital markets, and capturing new expertise in changing environments. The benefits
of diversification are balanced with incentives for focus including decreased agency costs,
removal of negative synergies, and a reduction in fixed costs. Firms electing diversification or
focus strategies must examine these costs and benefits and select the appropriate strategy.
Authors have continued to produce both theoretical and empirical evidence related to the
potential motivations for and impact of diversification and focus strategies (e.g. Fluck and
Lynch, 1999; and Matsusaka, 2001). Our study aims to resolve the question of whether one
strategy is superior for all firms, given that firms enter these transactions with varying needs and
strengths.
The literature related to the study of mergers and acquisitions provides a means to
analyze the impact of diversification and focus strategies. By measuring the change in line of
business concentration surrounding an acquisition, our study is able to isolate events that exhibit
the diversification or focus strategy of the acquirer. The merger and acquisitions literature serves
as an initial guide to assess the impact of an acquisition on the acquirer. Many studies have
utilized accounting based measures as a means of assessing the impact of mergers and
4

acquisitions (e.g. Cornett and Tehranian, 1992; Healy, Palepu, and Ruback, 1992; Linder and
Crane, 1992; Chamberlain, 1998; and Chamberlain and Tennyson, 1998). By analyzing changes
in the acquirer’s performance and capitalization surrounding a diversification or focus
acquisition, the impact of the strategies can be measured.
B. Sample Selection
Diversification and focus strategies are studied based on a sample of acquisitions of
property-liability insurers between 1993 and 1997. During this period there was a dramatic
increase in the frequency of acquisitions of property-liability insurers.2 The initial identification
of these acquisitions is based on a yearly list from Best’s Review Property-Casualty Edition.3
The nature of the acquirer’s and target’s business must be identified to classify the
acquisition as either diversification or focus. Acquirers are identified using the National
Association of Insurance Commissioners (NAIC) Database, Compact Disclosure, the Dunn and
Bradstreet Million Dollar Database, and Lexis-Nexis. Targets are identified using the NAIC
Database. The financial data for the target firms are taken from the NAIC Property-Casualty
Database. Data for the acquirers come from the NAIC Property-Casualty Database, the NAIC
Life-Health Database, and the Compustat Database.4
2 The trend towards increased acquisition activity in the property-liability insurance industry has continued. However, the need for financial data in the year following the acquisition limited the end of the sample period to acquisitions occurring in 1997. Prior to 1993, there were significantly fewer acquisitions of property-liability insurers. 3 Multiple acquisitions by a single acquirer listed in Best’s Review under a single date are considered to be one acquisition regardless of the number of individual firms acquired. Line-of-business data for the group of target firms in these acquisitions are aggregated by premiums written for each line to determine the business mix for the target group. 4 Financial data are reported in the NAIC Databases based on Statutory Accounting Procedures (SAP). The financial data in Compustat is based on Generally Accepted Accounting Procedures (GAAP). Based on the differences in the accounting procedures, several adjustments were made to make the SAP and GAAP data comparable. For example, adjustments were made to subtract deferred taxes from the total tax liabilities, total liabilities, and net income for the GAAP firms since deferred taxes are not included in SAP accounting records.
5
For all non-property-liability insurer acquirers, a search of Compact Disclosure and
Lexis-Nexis is conducted to determine the percentage of the acquirer’s revenues from property-
liability insurance activity. Acquisitions in which the acquirer is identified as being a non-
property-liability insurer are categorized as diversification acquisitions.5
For all acquisitions by property-liability insurers, a Herfindahl index based on the lines of
business written by the acquirer is computed based on data for the year prior to the acquisition
(based on the insurer’s premiums written). A second Herfindahl index is computed based on the
addition of the target’s premiums written (revenue) to the acquirer’s premiums written. If the
concentration level decreased, the acquisition is categorized as a diversification acquisition;
otherwise, it is categorized as a focus acquisition.6,7
Based on the criteria described above, the initial sample of 147 acquisition events were
identified. These acquisitions represent the acquisition of 237 individual property-liability
Additionally, adjustments are made to SAP accounting to reflect differences in reserving. The adjustments are made to total liabilities and capital. These adjustments make the SAP and GAAP accounting more comparable. There is no way to accurately and completely convert SAP to GAAP accounting based on information available in the NAIC and Compustat Databases. In an effort to minimize the effects of the two sources of accounting information, NAIC data were used whenever possible. This allows for greater comparability between the acquirer and target data, as well as more consistency in the acquirer data. 5 In cases in which holding companies are the acquirers, a search is conducted to determine if the acquirer is an insurance holding company or if the firm holds a variety of subsidiaries. If the firm is an insurance holding company, the group information in the NAIC Database is used for the financial data of the acquirer. If the holding company is not an insurance holding company, it is classified as a diversification acquisition and financial data from the Compustat Database is used if available. Insurers who write more than 50 percent of premiums in life/health insurance lines are categorized as diversification acquisitions due to the differences in earning patterns, operations, and capitalization of life/health and property/casualty firms. Additionally, based on firm descriptions in Lexis-Nexis, Compact Disclosure, and Dunn and Bradstreet Million Dollar Database, acquirers with firm descriptions other that of property-liability insurance are categorized as diversification acquirers. 6 Changes in Herfindahl indices have been used in prior literature to define diversification and focus. Desai and Jain (1999) utilize the change in a firms Herfindahl index based on segment data to classify spin-offs as focus increasing or non-focus increasing. John and Ofek (1995) also used a change in Herfindahl index measure based on segment level data in their analysis of asset sales. Through the uses of line-of-business data, the measure utilized in the study provides further refinement to Desai and Jain’s and John and Ofek’s measures. 7 In an effort to test the sensitivity of the definition of the diversification to small changes in the Herfindahl index, robustness tests are conducted removing the acquisitions in which the percentage change in the Herfindahl index is less than one percent. The results of these tests were generally consistent with the major findings of the paper.
6

insurers in the time period extending from 1993 to 1997. Of the acquisitions, 104 are classified
as diversification acquisitions. The remaining 43 are classified as focus acquisitions. Table 1
(Panel 1) presents a breakdown of diversification and focus acquisitions by year. Using a
definition of diversification and focus based solely on SIC codes, only the 27 acquisitions by
non-property liability insurance acquirers would be categorized as diversification acquisitions.8
Authors such as Andre and Stafford (2001) note that SIC codes may lead to the misclassification
of firms due to inconsistencies in the reporting of the SIC codes between data sources. Fan and
Lang (2000) comment that definitions based on SIC codes have limitations in measuring the
relatedness of firms.9 The definition of diversification and focus presented in our study allows
for the detection of diversification into new lines of business by insurers, significant shifts in the
books of business through the acquisitions, as well as entrance into a new industry.10
To create the final dataset, firms were removed from the analysis if they did not have all
of the financial data necessary to compute the change in performance and capitalization
measures. Additionally, acquisitions in which the total assets of the target were less than five
percent of the total asset of the acquirer were removed to mitigate the impact of acquisitions that
are not economically significant to the acquirer.11 The ultimate analysis of the acquirers includes
8 Industries with non-property-liability insurer acquirers include life insurance, health insurance, agents and brokerage services, personal credit institutions, business services, and doctors’ offices and clinics. 9 Fan and Lang (2000) use a measure of relatedness based on input-output (IO) tables to capture inter-industry and inter-segment vertical relatedness and complementarity. 10 John and Ofek (1995) looked at the change in the number of segments of business as an alternative measure of diversification and focus. Adapting that definition to look at acquisitions in which acquirers enter new lines of business, about half of the acquisitions by property-liability insurer acquirers do not involve the addition of new lines of business. However, an analysis of the change in Herfindahl index from these acquisitions reveals that almost half of these acquisitions increased the level of diversification of the acquirer’s book of business without changing the number of lines of business written. For this reasons, it is important to analyze not only the type of acquirer and target, but also the business mix of the firms. 11 Two outliers were removed based on influence diagnostics performed in SAS. Additionally, two firms with extreme percentage change in operating margins were also removed from the sample based on tests of residuals.
7

75 acquisitions (twenty-three focus acquisitions and fifty-two diversification acquisitions).
Table 1 (Panel 2) presents a breakdown by year of the firms included in the final sample.
The performance measures used in this study are based on accounting data rather than on
market-based data. A market-based study is not feasible for several reasons. First, over half of
the acquirers in the sample are not publicly traded firms; therefore, there would be a drastic
reduction in sample size. In addition to removing a significant portion of the dataset, there is the
potential for a bias in the sub-sample of firms remaining as all of the mutual firms and closely-
held stock companies would be removed with this screen. Prior studies have shown that there
are significant differences in the operations and capitalization of stock and mutual firms in the
insurance industry (Mayers and Smith 1988, 1994; Lamm-Tennant and Starks, 1993; and Pottier
and Sommer, 1997). Results based on the reduced sample would not therefore be generalizable
to the entire population. The presence of even fewer publicly traded targets in the sample
exacerbates the limited sample of publicly traded acquirers. Cox and Protes (1998) explain that
the inability to track both the market value of the target and of the acquiring firm creates serious
limitations in the study of acquisitions based on stock prices. Thus, due to the inability to track
changes in the market value of both the targets and acquirers, the significant reduction in sample
size for an acquirer only study, and the potential bias created by the removal of non-publicly
traded acquirers, accounting-based measures are chosen over market-based measures for the
empirical analysis.12
12 Studies such as Healy, Palepu and Ruback (1992) and Cornett and Tehranian (1992) find positive relationships between abnormal stock returns surrounding merger announcements and increases in operating cash flows following the transaction.
8

III. Empirical Framework
The variables development is divided into two sections based on the empirical framework
of the paper. The first section describes the motivations underlying the acquirer’s decision to
diversify or focus through the acquisition. The decision to diversify or focus is modeled as a
function of the acquirer’s pre-acquisition tax status, capitalization, liquidity, and efficiency.
Changes in the economic environment are also incorporated into the model through a series of
time variables. These pre-acquisition traits are designed to model the needs and strengths of the
acquirer that influence the decision to use a diversification or focus strategy.
The second section develops variables related to changes in the acquirer’s performance
and capitalization following the acquisition. In this section, changes in acquirer’s operating
margin, capitalization, and liquidity are assessed as a function of the diversification or focus
characteristic of the acquisition as well as the growth of the acquirer, the relative size of the
acquisition, and the level of monitoring involved. A detailed discussion of the empirical
specification of the model is provided in Section Four.
A. The Acquirer’s decision to diversify or focus
Acquirers selecting diversification or focus strategies are likely to have different
underlying goals or motivations in the acquisitions. The motivation to engage in either strategy
arises from the acquirer’s current needs and strengths. Five dimensions of the acquirers’ pre-
acquisition performance and capitalization are investigated to gain a better understanding of the
decision to diversify or focus. These findings form the basis of the analysis of the impact of
diversification and focus in the next section.
Tax Liabilities. Firms often cite a reduction in expected tax liabilities as a benefit of
diversification. Due to the progressive nature of the tax schedule, firms have the incentive to
9

reduce income volatility in an effort to reduce expected tax liabilities (Smith and Stulz, 1985).
In an effort to capture the acquirer’s incentives to reduce tax liabilities through diversification, a
dummy variable equal to one is included if the acquirer paid taxes in the year prior to the
acquisitions.13 It is hypothesized that firms choosing diversification strategies have higher
levels of pre-acquisition tax liabilities than acquirers selecting focus strategies.
Capitalization. Prior literature has linked pre-acquisition characteristics of acquirers to
changes in firm performance after the acquisition. For example, Houston and Ryngaert (1994)
find that high pre-merger levels of profitability of the acquiring firms are correlated with positive
abnormal returns following the acquisition of banks. While specific diversification and focus
hypotheses are not attached to this proxy, it does provide important information on the
characteristics and motivations of acquirers, as well as insight into the areas in which the
acquirer might most actively seek to change through the acquisition. The overall pre-acquisition
capitalization of the acquirer is measured by the capital-to-asset ratio. The capital-to-asset ratio
also provides a measure of the leverage of the firm.14
Liquidity. Prior literature has linked both high and low levels of pre-acquisition liquidity
to motivations for mergers and acquisitions. Firms with liquidity constraints often view
acquisitions as a source of increased liquidity to help remove the financial constraints of the
acquiring firms and/or increase the size of internal capital markets. Conversely, for firms with
high levels of liquidity, acquisitions serve as a source of positive net present value projects that
13 Similar measures of tax liabilities have been utilized by Colquitt and Hoyt (1997), Petroni and Wahlen (1995), Petroni (1992), and Scholes, Wilson, and Wolfson (1990). 14 A low capital-to-asset ratio equates to a high level of leverage. High levels of leverage also indicate an increase in the acquirer’s risk of violating its debt covenants. Violation of debt covenants is costly to firms (Beniesh and Press, 1993). Diversification acquisitions may benefit financially constrained firms as the reduction of earnings volatility through diversification allows acquirers to hold increased levels of leverage (Lewellen, 1971).
10

allow the acquirer to more effectively utilize its assets. Liquidity is measured through the
acquirer’s pre-acquisition ratio of cash and invested assets to liabilities.
Relative Efficiency. Prior research has suggested that acquirers target inefficient firms
with the goal of achieving higher future returns through improved post-acquisition efficiency of
the targets (Chamberlain and Tennyson, 1998; Norgaard and Crary, 1970; and Meador, Madden,
and Johnston, 1986). If the acquiring firm is to achieve gains through increases in the efficiency
of the target firm, then the target firm is likely to be relatively inefficient in comparison to the
acquirer prior to the acquisition. Insurer acquirers are likely to have decreased levels of
asymmetric information given their expertise in insurance operations. This would suggest that
insurer acquirers, especially those operating in similar lines of business, are more likely to have
the expertise to improve the operations of the target firms after the acquisitions. Thus, the focus
acquirers should be better able to identify the relatively inefficient firms that have the potential to
be improved.
The relative efficiency measure is a dummy variable that is equal to one if the return on
assets for the acquirer is higher than the return on assets for the target firm. The variable
provides preliminary indication of the ability of the acquirer to improve the performance of the
target by implementing managerial and technological changes.
Overall Efficiency. Milbourn, Boot, and Thakor (1999) suggest that profitable firms
facing uncertainty about their future core competencies may choose to acquire efficient firms in
new areas in an effort to gain an advantage in types of business that has the potential to become a
new core competency. For this reason, the overall efficiency of the acquirer is included in the
model. It is expected that the diversification acquirers will have higher levels of overall
efficiency. Additionally, higher pre-acquisition levels of overall efficiency may signal that the
11
acquirer is better able to handle the more complex organizational structures and increases in
agency costs created in a diversification acquisition. The return on assets for the acquiring firm
in the year prior to the acquisition is included to capture the overall efficiency of the acquirer.
The pre-acquisition levels of efficiency also are likely to impact the changes in performance and
capitalization of the acquirers surrounding the acquisitions.
Changes in Economic Conditions. Changes in the economy or in the insurance industry
are likely to impact the acquirer’s decision to diversify or focus. These can include changes in
investment returns, in the regulatory environment, and in technology. Prior literature has
documented the need to control for industry shocks and changes in the economic environment in
merger and acquisition studies. For example, Andrade and Stafford (2001) comment that
mergers can be the result of industry-wide forces such as a fundamental shock. Other studies
linking acquisitions to industry-wide shocks in technology, capital, or supplies include Jensen
(1993), Mitchell and Mulherin (1996), Morck, Shleifer and Vishny (1988), and Chamberlain and
Tennyson (1998). For this reason, time dummies are included for the year of the acquisition to
control for changes in the economy and industry during the sample period.
The analysis of the acquirer’s pre-acquisition characteristics provides information on the
factors motivating selection of a diversification or focus strategy. In our framework, these
factors also are incorporated into the analysis of the impact of the diversification or focus
strategy on the acquirer’s performance and capitalization after the acquisition. They are
incorporated to control for the possibility that firms self-select into the use of diversification or
focus strategies. The major hypotheses related to the variables discussed in this section are
summarized in Table 2.
12

B. The Impact of Diversification and Focus on Acquirers
The acquirer’s decision to diversify or focus through an acquisition is likely to impact the
firm’s performance and capitalization. While the percentage change in operating margin is used
as the primary indicator of change in performance, it does not provide a complete picture of the
impact of diversification and focus on the firm. As noted in Pilloff (1996), Cornett and
Tehranian (1992), Healy, Palepu, and Ruback (1992), and Chamberlain (1998), various portions
of the acquirer’s operations may be impacted by the acquisition. Changes in the capitalization of
the acquirers may create for firms potentially offsetting effects on their overall performance. For
this reason, changes in the acquirers’ capital-to-asset ratio and liquidity are analyzed in addition
to changes in operating margin.
The central issue is the impact of the diversification or focus decision on change in
performance or capitalization. However, several other factors can impact the changes in the
performance and capitalization of the acquirer. In an effort to control for additional factors,
variables related to the acquirer’s growth, the economic significance of the acquisition for the
acquirer, and the market’s ability to monitor the transaction are included.
For each of the three performance and capitalization measures, the change in the measure
is assessed during a four-year period surrounding the acquisition in an effort to control for
potentially abnormal performance in the year of the acquisition and to smooth the effects of
possible earnings manipulation in the year prior to the acquisition. The performance and
capitalization measures are computed as the percentage change in the acquirer’s average value of
the measure for the two years prior to the acquisition and for the two years following the
acquisition.
13
Overall Performance. Given that both diversification and focus strategies are used in the
sample, financial theory would suggest that both strategies have performance enhancing
characteristics. This increases the importance of analyzing the changes in the acquirer’s
performance in light of the decision to diversify or focus. In general, increases in operating
margin can be viewed as a value enhancing effect of the acquisition.
Capital Structure. Capital structure literature suggests that there is an optimal level of
leverage for firms. As noted in Carson and Hoyt (1995), firm value increases as leverage
increases to an optimal point; after that point the value of the firm declines. Leverage levels that
are too high increase the chance of insolvency for the firm (Carson and Hoyt, 1995).
Additionally, firms in danger of violating their debt covenants face real costs (Beniesh and Press,
1993).
Leverage also is considered to be a proxy to measure a firm’s access to internal capital
markets. Myers and Majluf (1984) find that internal capital is typically less expensive than
external capital. In a field such as insurance, where asymmetric information can be especially
high, firms have incentives to increase the size of these markets. Meador, Madden, and Johnston
(1986) suggested that acquirers potentially select under-leveraged target firms in an effort to
remove the financial constraints of the acquirer by exploiting the underused leverage capacity of
the target after the acquisition.
In the insurance industry, the overall capitalization of the acquiring firm has important
implications for the target firms. Prior research in the insurance area has suggested that parent
companies may choose to prevent a member company from becoming insolvent (Sommer,
1996). While the parent company is not required to bail out the failing subsidiary, the financial
strength of the parent has been shown to increase the financial ratings of the subsidiary firms.
14
The pre- and post-acquisition percentage change in the acquirer’s capital-to-assets ratio is used
as a proxy for the change in the acquirer’s capitalization resulting from the acquisition.
Liquidity. Changes in the liquidity of the firm provide an indication of the level of free
cash flow present. As indicated in Jensen (1986), free cash flow is funds in excess of the funds
needed for all of the firm's positive net present value projects. The existence of additional free
cash flow may be an indication of an underinvestment problem. Acquirers with high levels of
free cash flow prior to the acquisition may utilize the acquisition as a means to reduce the level
of free cash flows.
Conversely, firms in a cash constrained position are thought to target firms as a potential
source of new liquidity. In the case of a cash constrained acquirer, an increase in liquidity
following the acquisition could signal an increase in financial stability. The extent to which the
acquisition impacts the overall liquidity of the acquirer is measured by the change in the ratio of
cash and invested assets to liabilities of the acquirers surrounding the acquisition.
Changes in the performance measures described above may be the result of firm-specific
changes not directly related to the acquisition of a property-liability insurer. For this reason,
several factors are included to control for changes in the acquirers that are unrelated to the
diversification or focus aspect of the acquisition.
Growth. The growth opportunities of the acquirer can impact several components of the
acquirer’s capital structure such as liquidity and leverage. For example, Gaver and Gaver (1993)
and Smith and Watts (1992) found that firms with high growth opportunities have decreased
levels of leverage. Additionally, Wells, Cox, and Gaver (1995) provide evidence that growth
opportunities are related to free cash flow. For these reasons, controlling for growth
opportunities is important in assessing the changes in capitalization and performance of the
15

acquirers. The percentage change in net premiums from two years prior to the acquisition
through the year following the acquisition is included to control for changes in the growth
opportunities of the insurer acquirers. The percentage change in revenues is used for non-
insurance acquirers to control for growth opportunities.15
Relative Size. The larger the relative size of the target to the acquirer, the more likely it is
that the acquisition of the target will have a significant impact on the performance of the
acquirer. The relative size of the targets and acquirers is recognized in prior studies (Pilloff,
1996; and Benston, Hunter, and Wall, 1995). Benston, Hunter, and Wall (1995) hypothesize that
the greater the relative size of the target to the acquirer, the greater the potential for merger-
related gains in efficiency. They suggest that economies of scale are positively related to the
ratio of target to acquirer size. However, the authors note that the potential gains from
economies of scale may be offset by the fact that relatively large targets have fewer opportunities
to introduce new and potentially more profitable products. In addition, acquisitions of relatively
large firms may result in higher overall costs to the acquirer. The acquisition of a relatively large
target also increases the complexity of the organization and the levels of managerial discretion,
thereby further raising costs to the acquirer. This variable is based on the ratio of the total assets
of the target to the total assets of the acquirer in the year of the acquisition.
15 Gaver and Gaver (1993), Smith and Watts (1992) and Baber, Janakiraman, and Kang (1996) have suggested measures of growth opportunities such as the market-to-book ratio. Due to data constraints, market-based measures of growth opportunities are not possible for this sample. Baber, Janakiraman, and Kang (1996) suggest past growth rates as a proxy for future growth opportunities. Colquitt, Sommer, and Godwin (1999) use a proxy for growth opportunities similar to the one suggested in this paper.
16

Publicly Traded. The final control variable is included to capture the level of monitoring
faced by the acquirer. As discussed in Pottier and Sommer (1999), publicly-traded firms have an
added level of scrutiny provided by outside investors. Additional monitoring by these investors
may alter the quality of the decisions of the acquiring firms; thus, the impact on change in
performance may be higher for these acquirers. A dummy variable indicating if the acquirer is
publicly traded is included to control for the differing levels of monitoring costs firms face.
IV. Empirical Estimation
A. Empirical Specification
As mentioned previously, the implications of diversification and focus are modeled in a
two-stage framework. The two-stage approach has two primary advantages. First, the acquirer’s
decision to diversify or focus in the first stage provides insight into the motivations underlying
the selection of the strategy. This information is of interest to target firms, regulators, and
investors. Secondly, this framework accounts for the possibility that factors impacting the
diversification or focus decision also impact the change in firm performance and capitalization in
the period surrounding the acquisition. Prior research on the impact of diversification and focus
has not controlled for this possibility (e.g. John and Ofek, 1995; and Desai and Jain, 1999).
The following system of two equations is estimated:
Diversification/Focus = β0 + β1(Relative_Eff.) + β2(Acquirer_Eff.) + β3(Tax) +
β4(Liquid) + β5(LNAsset) + β6-10(Year) + ε (1)
∆Performance or Capitalization = β0 + β1(Diversification/Focus) + β2(Relative_Size) +
β3(Growth) + β4(Public) +β5(Lambda) +ε (2)
17
Equation (1) models the acquirer’s decision to diversify or focus. This decision is based on the
pre-acquisition characteristics of the acquirer. Equation (2) models the change in the acquiring
firm’s performance or capitalization based on the diversification or focus decision and changes
in the firm. The system of two equations is estimated separately for the percentage change in the
operating margin, capital-to-asset ratio, and liquidity. In each set of equations, the primary
variable of interest is the Diversification/Focus dummy variable in equation (2). The variable
captures the impact of the diversification/focus aspect of the acquisition on firm performance and
capitalization. The Diversification/Focus variable is defined as one if it is a diversification
acquisition; otherwise, it is defined as zero. The Lambda variable included in the second
equation is included as part of the treatment effects methodology discussed later in this section.
The other variables in the equations represent those discussed in the previous section.
As explained in Greene (1993), the coefficient on the endogenous dummy variable may
be biased if firms self-select into one of the groups (or treatments). A treatment effects approach
is utilized to correct this potential self-selection problem.16 The use of this methodology is
particularly important in models that utilize dummy variables to measure the effect of treatment
effects or program participation (Greene, 1993).
Table 3 presents basic summary statistics for the acquirers included in the estimation of
the model. Analysis revealed a strong correlation (.847) between the capital-to-asset ratio and
16 The procedure involves the estimation of a decision equation, Equation (1). From the results of the decision equation, an estimated inverse Mill’s ratio (Lambda) is calculated for each observation. The second step involves the estimation of a least squares regression with the inverse Mill’s ratio included as an additional regressor, Equation (2). The presence of the inverse Mill’s ratio in the second stage corrects for the potential bias in the performance equation that would have resulted from the use of an OLS estimation of the equation. Greene (1998), and Barnow, Cain, and Goldgberger (1981) suggest that the treatment effects model and the instrumental variables approach are alternate methods of estimating the model. Vella and Verbeek (1999) note that in most cases these methodologies produce similar results. However, there are situations in which slightly different empirical results may emerge. In an effort to confirm the results of the treatment effects model, a second approach is utilized involving the use of instrumental variables. The instrumental variables approach produced results that were statistically similar to the results presented in the paper.
18

liquidity. For this reason, only liquidity is included in the equation modeling the acquirer’s
diversification or focus decision.
B. Results Related to the Decision to Diversify or Focus
The probit model in the first stage of the analysis investigates the motivations underlying
the acquirer’s decision to diversify or focus based on the acquirer’s pre-acquisition efficiency,
tax status, and liquidity. The results presented in Table 4 provide support for many of the
traditional motivations underlying the acquirer’s diversification or focus decision.
As expected, diversification acquirers tend to have higher pre-acquisition tax liabilities
relative to the focus acquirers. This finding provides support for the hypothesis that
diversification acquisitions may be motivated, at least in part, by the acquirer’s desire to reduce
future tax liabilities through earnings diversification. Further, the acquirers in the diversification
transactions have lower levels of liquidity, implying that a diversification acquirer could be
motivated to reduce earnings volatility to support its decreased level of liquidity. The low pre-
acquisition levels of liquidity for diversification acquirers provide increased motivation for
examining the changes in liquidity surrounding the acquisition as the acquirer may be targeting
firms as a new source of liquidity.17
The diversification acquirers tend to have higher than average levels of efficiency. This
provides support for the premise observed in Milbourn, Boot, and Thakor (1999) that profitable
firms facing uncertainty about future core competencies may choose to diversify into different
areas to gain new core competencies. Additionally, the more efficient, diversification acquirers
may be better able to handle the potential increase in the complexity of the organization arising
from diversification. Control variables for the size of the acquirer and the year of the acquisition
17 In a parallel study based on the impact of diversification and focus strategies on target firms, the results show that highly liquid firms are targeted in diversification acquisitions.
19

were included. By considering the motivations driving the diversification or focus decision, a
better assessment of the impact of the strategy can be developed.
C. Results Related to the Impact of Diversification and Focus
The impact of diversification and focus strategies are modeled both with and without
controls for self-selection bias. Estimating the models both with and without controls for self-
selection bias allows us to contrast our results with the findings of prior studies. Prior research
has not controlled for self-selection bias. Table 5 presents the results based on a series of OLS
regression models that do not control for the motivations to diversify or focus. Based on this
approach, diversification acquisitions appear to have a positive impact on the performance and
capitalization of the firms engaging in those transactions. These results support the findings of
earlier studies that find value enhancing effects from diversification strategies (e.g. Hubbard and
Palia, 1999; and Matsusaka, 1993). Potential reasons for the value enhancing nature of
diversification acquisitions include smoother earnings, reduced tax liabilities, larger internal
capital markets, and new core competencies. These results do not take into account the
characteristics of the acquirer that influenced the diversification or focus decision.
In contrast to the models which do not incorporate the motivations for the selection of a
diversification or focus strategy, Table 6 presents the results of the models controlling for
potential self-selection bias.18 When we control for potential self-selection bias, it appears that
the impact of the diversification or focus characteristic of the acquisition is no longer an
important factor in the change in performance and capitalization of the acquiring firm. This is
not to say that the acquirer’s performance or capitalization did not change surrounding the
18 An instrumental variables approach is also used as a robustness check of the treatment effects methodology. Results for the two methodologies provide statistically similar results. For a description of the instrumental variables approach, see Maddala (1983).
20
acquisition, but that the change is not associated with the diversification or focus aspect of the
acquisition.
This result is especially significant in light of the fact that the models without controls for
self-selection bias presented in Table 5 would imply that diversification transactions have a
positive impact on the performance and capitalization of the acquirers. The results of the models
presented in Tables 5 and 6 emphasize the importance of controlling for the characteristics that
shape the decision to diversify or focus rather than measuring the impact of the decision in
isolation. The findings suggest that the value-enhancing nature of diversification and focus
strategies is in the selection of the proper strategy for the right firm, rather than in the use of one
strategy for all firms. These findings also provide a partial explanation for the often-conflicting
results in previous studies related to the impact of diversification and focus on firm performance
and capitalization. These studies did not control for differences that motivated the acquirers’
decision to diversify or focus.
The coefficients on the control variables are largely unaffected by controlling for self-
selection bias. The relative size variable is negative and significant in the performance equation,
indicating that the larger the relative size of the target to the acquirer, the greater the costs of
combining the firms. This could stem from increased agency costs related to an increase in
managerial discretion due to the now larger and potentially more complex organizational
structure. The rapid increase in size and related costs would have a negative impact on the
operations of the acquirer.
The negative relationship between growth and the capital-to-asset ratio could signal that
firms with high levels of growth deplete capital resources to finance the increase in size.
Similarly, increased growth also relates to a decrease in the firm’s liquidity as indicated by the
21

negative relationship between the percentage change in liquidity and growth variables. The
PUBLIC variable, which equals one if the firm is publicly traded, is significant only in the
liquidity equation. The variable is designed to capture the influence of increased monitoring on
the acquisition.
V. Conclusions, Implications and Future Research
A. Conclusions
The primary goal of the study is to assess the impact of diversification and focus on the
acquiring firm. Through the use of a refined definition of diversification and focus along with a
two-stage methodology, the study is able to provide new information on the implications of
diversification and focus strategies.
The refined definition of diversification and focus creates a more accurate categorization
of the transactions that helps to remove the potentially confounding effects of misclassification.
The definition of diversification and focus allows for the detection of diversification within the
insurance industry as well as diversification into the industry. This system overcomes some of
the limitations associated with SIC code-based definitions of diversification and focus, and
reclassifies almost half of the transactions those studies would have defined as focus
acquisitions.
The two-stage framework links the diversification or focus decision to the impact of that
choice on the performance and capitalization of the acquirer following the acquisition. From an
empirical standpoint, this is necessary to control for potential self-selection bias that would result
if the pre-acquisition needs and strengths that prompted the acquirer to diversify or focus also
impacted the changes in the acquirer’s performance and capitalization following the acquisition.
22

Conceptually, this framework allows for a more complete assessment of the implications of
diversification and focus.
The study provides an explanation of the motivations underlying the acquirer’s decision
to diversify or focus. It appears that firms entering into diversification acquisitions are those
who have the strongest need to smooth earnings. The results of the study indicate that these
diversifying acquirers are also better able to handle the increased agency costs associated with
the creation of more complex, diversified firms.
Through the use of both pre- and post-acquisition data for the acquiring firms, the study
helps answer the question of whether diversification and focus impacts changes in performance
and operations of the acquirers. Based on the results of the study, it appears that when the
motivations and characteristics of the acquirer are considered, the diversification and focus
aspect of the acquisition is not related to the changes in the acquirers’ performance and/or
capitalization. However, in our models that do not control for potential self-selection bias,
diversification strategies are associated with increases in performance and capitalization. This is
significant because of the conflicting results of prior studies in which both diversification and
focus have been found to increase firm value. These studies have failed to control for the factors
that motivated the acquirers to self-select into the diversification or focus categories.
B. Implications and Future Research
The diversification or focus decision is especially relevant in the current financial
services marketplace in light of financial services deregulation. The move towards deregulation
is likely to propel the current wave of mergers and acquisitions as firms continue to diversify into
the industry and insurers consolidate to remain competitive. Thus, the information contained in
23

the study provides valuable information to the regulators charged with governing future
acquisitions.
The study also provides empirical support for the idea that one strategy is not superior for
all firms. In the case of diversification and focus strategies, our results suggest that the selection
of an appropriate strategy for the right firm is what enhances value, rather than the use of one
strategy for all firms.
The use of a two-stage empirical framework illustrates the importance of controlling for
aspects that influence the decision to use a diversification or focus strategy when assessing the
impact of the strategy on the acquirer. This framework has implications for future research in
the area of diversification and focus as well as in other areas of financial economic research. For
example, when measuring the implications of a business strategy, financing decision, or other
financial transaction, it is important to assess the not only the impact of that decision but the
factors that lead to that decision. This two-stage framework allows for a more accurate
assessment of the impact of the decision or strategy.
24

References
Andrade, G., Mitchell, M., Stafford, E. 2001. New evidence and perspectives on mergers. The Journal on Economic Perspectives 15:103-120.
Baber, W. R., Janakiraman, S. N., Kang, S. 1996. Investment opportunities and the structure of
executive compensation. Journal of Accounting and Economics 21:297-318.
Barnow, B., Cain, G., Goldberger, A. 1981. Issues in the analysis of selection bias. Department of Economics, University of Wisconsin, Madison.
Beniesh and Press. 1993. Costs of technical violation of accounting-based debt covenants. The Accounting Review 68:233-257.
Benston, G.J., Hunter, W.C., Wall, L.D. 1995. Motivations for bank mergers and acquisitions: enhancing the deposit insurance put option versus earnings diversification. Journal of Money, Credit, and Banking 27:777-788.
Berger, P. G., Ofek, E. 1995. Diversification’s effect on firm value. Journal of Financial
Economics 37:39-65. Best Review, 1998. For the record: 1997 was another busy year of change for insurance
companies. Best Review (Property/Casualty Edition) 99, 49-64. Carson, J. M., Hoyt, R. E. 1995. Life insurer financial distress: classification models and
empirical evidence. Journal of Risk and Insurance 62:764-775. Chamberlain, S. L. 1998. The effect of bank ownership changes on subsidiary-level earnings, in:
Amihud, Y., Miller, G. (Eds.), Bank Mergers & Acquisitions, Kluwer Academic, Boston, MA 137-172.
Chamberlain, S. L., Tennyson, S. 1998. Capital shocks and merger activity in the property-
liability insurance industry. Journal of Risk and Insurance 65:563-595.
Colquitt, L., Hoyt, R. E. 1997. Determinants of corporate hedging behavior: evidence from the life insurance industry. Journal of Risk and Insurance 64:649-671.
Colquitt, L., Sommer, D. W., Godwin, N. H. 1999. Determinants of cash holdings by property-liability insurers. Journal of Risk and Insurance 66:401-415.
Comment, R., Jarrell, G. A. 1995. Corporate focus and stock returns. Journal of Financial Economics 37:67-87.
Cornett, M. M., Tehranian, H. 1992. Changes in corporate performance associated with bank acquisitions. Journal of Financial Economics 31:211-234.
Cox, A. J. and Portes, J. 1998. Mergers in regulated industries: the uses and abuses of event studies. Journal of Regulatory Economics 14:281-304.
25
Denis, D. J., Denis, D. K., Sarin, A. 1997. Agency problems, equity ownership, and corporate diversification. Journal of Finance 52:135-160.
Desai, H., Jain, P. C. 1999. Firm performance and focus: long-run stock market performance following spin-offs. Journal of Financial Economics 54:75-101.
Fan, J. P. H., Lang, L. H. P. 2000. The measurement of relatedness: an application to corporate diversification. Journal of Business 73:629-660.
Fluck, Z., Lynch, A. W. 1999. Why do firms merge and then divest? A theory of financial
synergy. Journal of Business 72:319-346. Gaver, J. J., Gaver, K. M. 1993. Additional evidence on the association between the investment
opportunity set and corporate financing, dividend and compensation policies. Journal of Accounting and Economics 16:125-160.
Greene, W. H. 1993. Econometric Analysis: Second Edition. New York: Macmillan Publishing Company.
Greene, W. H. 1998. LIMDEP Version 7.0 usurer’s manual: revised edition. New York: Econometric Software, Inc.
Healy, P. M., Palepu, K. G., Ruback, R. S. 1992. Does corporate performance improve after mergers? Journal of Financial Economics 31:135-175.
Houston, J. F., Ryngaert, M. D. 1994. The overall gains from large bank mergers. Journal of Banking and Finance 18:1155-1176.
Hubbard, R. G., Palia, D. 1999. A reexamination of the conglomerate merger wave in the 1960s: an internal capital market view. The Journal of Finance l:1131 – 1152.
Jensen, M. 1993. The modern industrial revolution, exit, and control systems. Journal of Finance 48:831-880.
John, K., Ofek, E. 1995. Asset sales and increase in focus. Journal of Financial Economics 37:
105-126. Lamm-Tennant, J. and Starks, L. T. 1993. Stock versus mutual ownership structures: the risk
implications . Journal of Business 66:29-46. Lang, H.P. L., Stulz, R. M. 1994. Tobin’s q, corporate diversification, and firm performance.
Journal of Political Economy 102:1248-1280. Lewellen, W.G. 1971. A pure financial rationale for the conglomerate merger. Journal of
Finance 26:521-537. Linder, J. C. and Crane, D. B. 1992. Bank mergers: integration and profitability. Journal of
Financial Services Research 7:35-55.
26

Maddala, G. S. 1983. Limited-Dependent and Qualitative Variables in Econometrics. New
York, Cambridge University Press. Matsusaka, J. G. 2001. Corporate diversification, value maximization, and organizational
capabilities. Journal of Business 74:409-431. Matsusaka, J. G. 1993. Takeover motives during the conglomerate merger wave. Rand Journal
of Economics 24:357-379. Mayers, D. and Smith C. W. 1988. Ownership structure across lines of property-casualty
insurance. Journal of Law and Economics 31:351-378.
Mayers, D. and Smith C. W. 1994. Managerial discretion, regulation, and stock insurer company ownership structure. Journal of Risk and Insurance 61:638-655.
Meador, J. W., Madden, G. P., Johnston, D. J. 1986. On the probability of acquisition of non-life insurers. Journal of Risk and Insurance 53:621-643.
Milbourn, T. T., Boot, A. W.A., Thakor, A. V. 1999. Megamergers and expanded scope: theories of bank size and activity diversity. Journal of Banking and Finance 23:195-214.
Mitchell, M., Mulherin, J. 1996. The impact of industry shocks on takeover and restructuring
activity. Journal of Financial Economics 193 – 229. Morck, R., Shleifer, A., Vishny, R. W. 1990. Do managerial objectives drive bad acquisitions?
Journal of Finance 45:31–48. Myers, S. C., Majluf, N. S. 1984. Corporate financing and investment decisions when firms
have information that investors do not have. Journal of Financial Economics 13:187-221.
Norgaard, R., Crary, D. T. 1970. Identifying merger targets in the property and liability
insurance industry. Financial Analysts Journal 1:91-94. Petroni, K. R. 1992. Optimistic reporting in the property-casualty insurance industry. Journal of
Accounting and Economics 15:485-508. Petroni, K. R., Wahlen, J. M. 1995. Fair values of equity and debt securities and share prices of
property-liability insurers. Journal of Risk and Insurance 62:719-737. Pilloff, S. J. 1996. Performance changes and shareholder wealth creation associated with
mergers of publicly traded banking institutions. Journal of Money, Credit, and Banking 28:294-310.
27
Pottier, S.W., Sommer, D. W. 1997. Agency Theory and Life Insurer Ownership Structure. Journal of Risk and Insurance 64:529-543.
Pottier, S.W., Sommer, D. W. 1999. Property-liability insurer financial strength ratings:
differences across rating agencies. Journal of Risk and Insurance 66:621-642. Scholes, M. S., Wilson, G. P., Wolfson, M. A. 1990. Tax planning, regulatory capital planning,
and financial reporting strategy for commercial banks. Review of Financial Studies 3:625-650.
Smith, C. W., Stulz, R. 1985. The determinates of firms' hedging policies. Journal of Financial
and Quantitative Analysis 20:391-405. Smith, C. W., Watts, R. L. 1992. The investment opportunity set and corporate financing,
dividend, and compensation policies. Journal of Financial Economics 32:263-292. Sommer, D. W. 1996. The impact of firm risk on property-liability insurance prices. Journal of
Risk and Insurance 63:501-514. Vella, F., Verbeek, M. 1999. Estimating and interpreting models with endogenous treatment
effects. Journal of Business and Economic Statistics 17:472-478. Wells, B., Cox L. A., Gaver, K. M. 1995. Free cash flow in the life insurance industry. Journal
of Risk and Insurance 62:50-66.
28

TABLE 1 Diversification and Focus
Panel 1
Acquisitions by Year (Initial Sample)
Year Focus Acquisitions
Diversification Acquisitions
1993 8 11
1994 6 15
1995 7 24
1996 12 27
1997 10 27
Total 43 104
Panel 2 Acquisitions by Year (Final Sample)
Year Focus
Acquisitions Diversification Acquisitions
1993 3 9
1994 4 6
1995 4 13
1996 8 13
1997 4 11
Total 23 52
29

TABLE 2 Expected Pre-Acquisition Characteristics of Acquirers
Characteristic Diversification +
Tax Liabilities Higher
Capitalization N/A
Liquidity N/A
Relative Efficiency No difference or Targets are more efficient than the Acquirers
Overall Efficiency Higher +The expectations associated with focus acquirers are opposite of the exceptions present here.
30
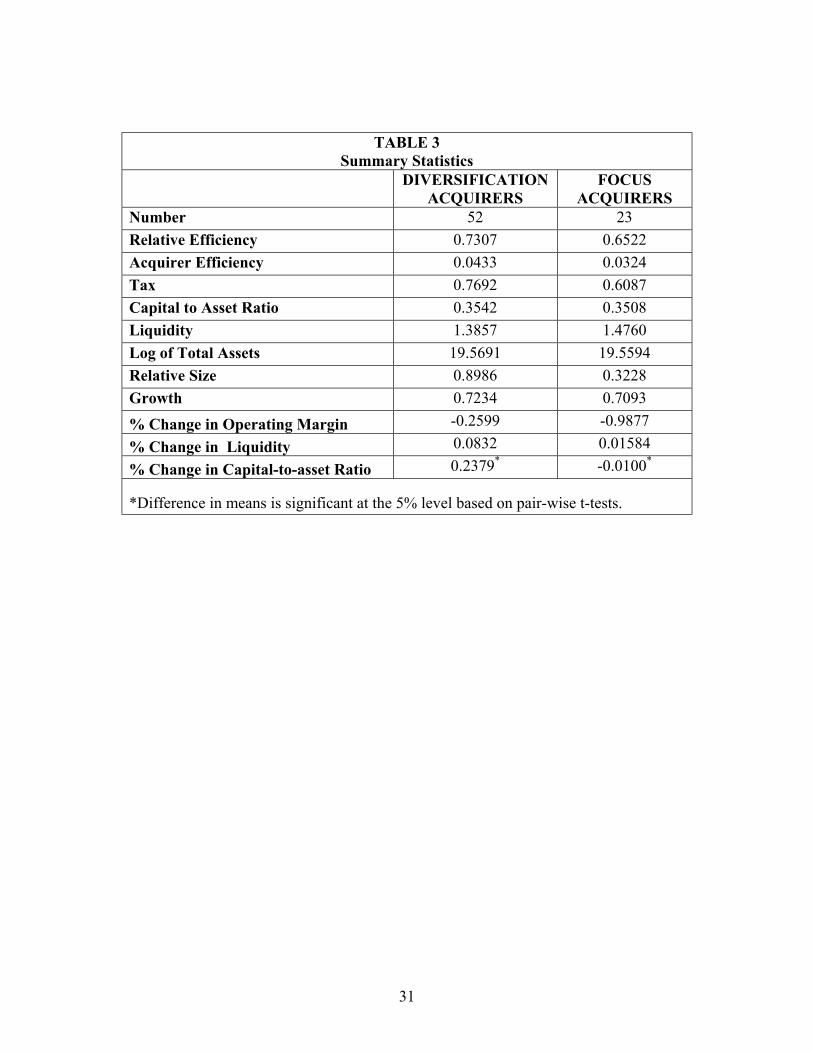
TABLE 3 Summary Statistics
DIVERSIFICATION ACQUIRERS
FOCUS ACQUIRERS
Number 52 23 Relative Efficiency 0.7307 0.6522 Acquirer Efficiency 0.0433 0.0324 Tax 0.7692 0.6087 Capital to Asset Ratio 0.3542 0.3508 Liquidity 1.3857 1.4760 Log of Total Assets 19.5691 19.5594 Relative Size 0.8986 0.3228 Growth 0.7234 0.7093
% Change in Operating Margin -0.2599 -0.9877
% Change in Liquidity 0.0832 0.01584
% Change in Capital-to-asset Ratio 0.2379* -0.0100*
*Difference in means is significant at the 5% level based on pair-wise t-tests.
31
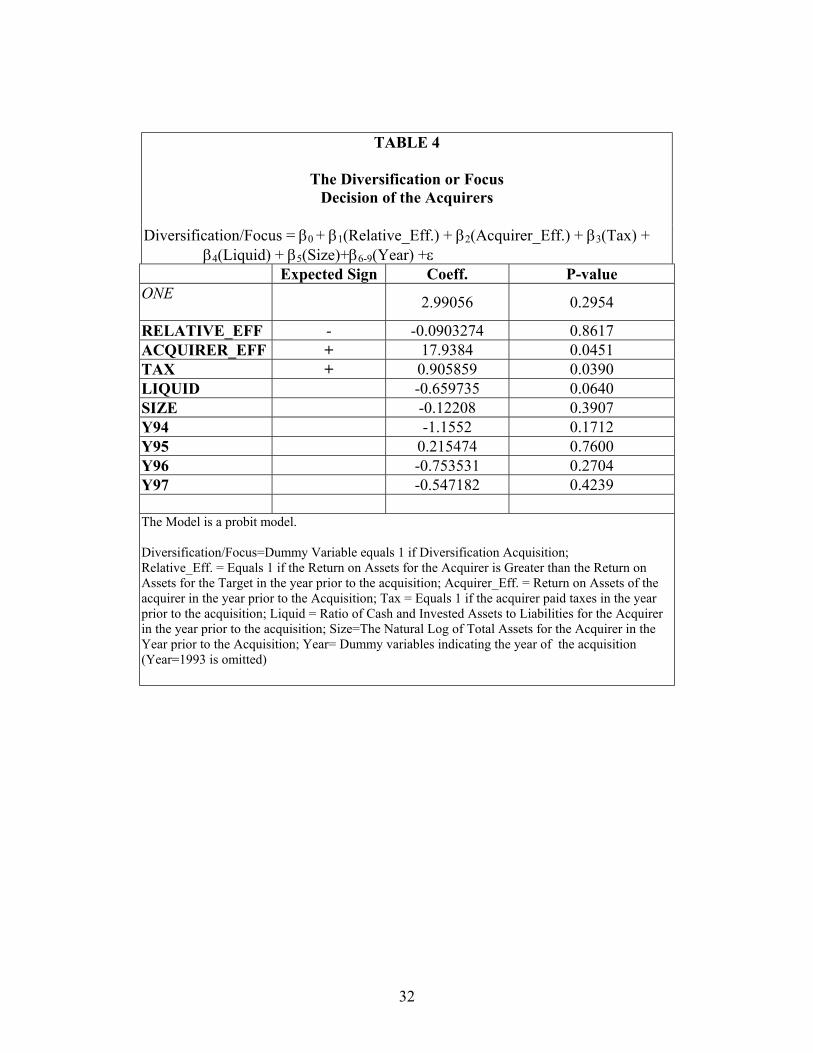
TABLE 4
The Diversification or Focus Decision of the Acquirers
Diversification/Focus = β0 + β1(Relative_Eff.) + β2(Acquirer_Eff.) + β3(Tax) + β4(Liquid) + β5(Size)+β6-9(Year) +ε Expected Sign Coeff. P-value ONE 2.99056 0.2954
RELATIVE_EFF - -0.0903274 0.8617 ACQUIRER_EFF + 17.9384 0.0451 TAX + 0.905859 0.0390 LIQUID -0.659735 0.0640 SIZE -0.12208 0.3907 Y94 -1.1552 0.1712 Y95 0.215474 0.7600 Y96 -0.753531 0.2704 Y97 -0.547182 0.4239 The Model is a probit model. Diversification/Focus=Dummy Variable equals 1 if Diversification Acquisition; Relative_Eff. = Equals 1 if the Return on Assets for the Acquirer is Greater than the Return on Assets for the Target in the year prior to the acquisition; Acquirer_Eff. = Return on Assets of the acquirer in the year prior to the Acquisition; Tax = Equals 1 if the acquirer paid taxes in the year prior to the acquisition; Liquid = Ratio of Cash and Invested Assets to Liabilities for the Acquirer in the year prior to the acquisition; Size=The Natural Log of Total Assets for the Acquirer in the Year prior to the Acquisition; Year= Dummy variables indicating the year of the acquisition (Year=1993 is omitted)
32

TABLE 5 Changes In The Acquirer
Performance And Capitalization* ∆Performance or Capitalization = β0 + β1(Diversification/Focus) + β2(Relative_Size) + β3(Growth) + β4(Public) +ε Percentage
Change in Operating
Margin
Percentage Change in
Capital-to-asset Ratio
Percentage Change in Liquidity
Constant -1.34767 (0.0016)
0.0523943 (0.5849)
0.0231442 (0.7837)
Diversification/Focus 0.97935 (0.0768)
0.263715 (0.0137)
0.057735 (0.5768)
Relative_Size -0.183269 (0.0000)
0.00875535 (0.0756)
0.0145524 (0.0000)
Growth 0.0913332 (0.6340)
-0.150753 (0.0215)
-0.109454 (0.0072)
Public 0.173448 (0.7901)
0.149337 (0.3054)
0.191156 (0.1448)
R-Square 0.1702 0.2083 0.1878 *Models Based on OLS regression without controls for selection Bias. Breusch-Pagan tests indicated the presence of heteroskedasticity in the models. Results are adjusted for heteroskedasticity. ( P-Values are reported in parentheses.) Percentage Change Variables are based on the percentage change in the average of the two years prior to the acquisition and the average of the year of the acquisition and the year following the acquisition. Operating Margin = Operating Cash Flows to Total Assets; Liquidity = Cash and Invested Assets to Total Liabilities; Diversification/Focus=Dummy Variable equals 1 if Diversification Acquisition; Relative_Size= Total Assets of the Target / Total Assets of the Acquirer in the year of the acquisition; Growth = Percentage Change in Net Premiums Written from Two Years Prior to the Acquisition through Two Years Following the Acquisition; Public = Dummy variable equals 1 if the acquirer is Publicly Traded
33

TABLE 6 Changes In The Acquirer
Performance And Capitalization With Controls for Self-Selection Bias*
∆Performance or Capitalization = β0 + β1(Diversification/Focus) + β2(Relative_Size) + β3(Growth) + β4(Public) + β5(Lambda) +ε Percentage
Change in Operating
Margin
Percentage Change in
Capital-to-asset Ratio
Percentage Change in Liquidity
Constant -1.70241 (0.0582)
-0.0085031 (0.9704)
0.202724 (0.2609)
Diversification/Focus 1.52322 (0.2158)
0.357081 (0.2557)
-0.21759 (0.3787)
Relative_Size -0.184451 (0.0041)
0.00855244 (0.6039)
0.0151508 (0.2196)
Growth 0.0747065 (0.7460)
-0.153607 (0.0095)
-0.101037 (0.0207)
Public 0.157038 (0.7747)
0.14652 (0.2976)
0.199464 (0.0578)
Lambda -0.416201 (0.6141)
-0.0714487 (0.7351)
0.210694 (0.1954)
*Based on a treatment effects model. The first stage of the model is the probit model presented in Table 3. Models are adjusted for heteroskedasticity. ( P-Values are reported in parentheses.) Percentage Change Variables are based on the percentage change in the average of the two years prior to the acquisition and the average of the year of the acquisition and the year following the acquisition. Operating Margin = Operating Cash Flows to Total Assets; Liquidity = Cash and Invested Assets to Total Liabilities; Diversification/Focus=Dummy Variable equals 1 if Diversification Acquisition; Relative_Size =Total Assets of the Target / Total Assets of the Acquirer in the year of the Acquisition; Growth = Percentage Change in Net Premiums Written from Two Years Prior to the Acquisition through Two Years Following the Acquisition; Public= Dummy variable equals 1 if the acquirer is Publicly Traded; Lambda = The Inverse Mill’s ratio created from the Probit Model
34