implications of competition reforms in rice and bus transport · iii list of tables table 1:...
TRANSCRIPT


Implications of Competition Reforms in Rice and Bus Transport Sectors for Consumers and Producers in The Philippines
Prepared by
Philippines Institute of Development Studies NEDA sa Makati Building 106 Amorsolo Street, Legaspi Village 1229 Makati City, Philippines Ph: +63.2.892.4059; 893.5705; 894.2584 Fx: +63.2.893.9589 Web: http://www.pids.gov.ph
Published by Consumer Unity & Trust Society
D-217, Bhaskar Marg, Bani Park Jaipur 302016, India Ph: 91.141.228 2821 Fx: 91.141.228 2485 Email: [email protected] Web: www.cuts-international.org
Supported by:
© CUTS International, 2015
First published: January 2015
The material in this publication produced under the project entitled, ‘Competition Reforms in Key Markets for Enhancing Economic and Social Welfare in Developing Countries’ (CREW project) implemented by CUTS in partnership with PIDS in Philippines, may be reproduced in whole or in part and in any form for education or non-profit uses, without special permission from the copyright holders, provided acknowledgment of the source is made. CUTS would appreciate receiving a copy of any publication, which uses this publication as a source. No use of this publication may be made for resale or other commercial purposes without prior written permission of CUTS.
#1502

i
Contents
Acknowledgements ................................................................................................................ 1
Abbreviations ......................................................................................................................... 3
Executive Summary ............................................................................................................... 5
1. Introduction..................................................................................................................... 9
2. Background ................................................................................................................... 11
History of Economic and Competition Reforms ............................................................ 11
Discussion of reforms Undertaken in the Selected Sectors ............................................ 13
3. Competition Reforms in Staple Foods Sector (Rice) and
Implication on Beneficiaries ........................................................................................ 15
The Rice Sector of the Philippines ................................................................................. 15
Competition Concerns in the Rice Sector ....................................................................... 22
Potential Impact of Competition Reforms in the Domestic Rice Market ....................... 27
Computing Impact of International Market Competition Reform .................................. 38
Key Findings ................................................................................................................... 41
4. Competition Reforms in Bus Transport Sector and
Implication on Beneficiaries ........................................................................................ 43
Reforms Undertaken in the Bus Transport Sector Over Time ....................................... 43
Market Structure and Competition in Bus Transport ..................................................... 47
Competition Concerns in the Bus Transport Sector ....................................................... 31
Potential Impact of Rationalising Competition in the Bus Transport Sector ................. 53
Key Findings ................................................................................................................... 62
5. Conclusion and Way Forward ..................................................................................... 64
6. Annexure ....................................................................................................................... 67
References ............................................................................................................................. 71

ii
List of Figures
Figure 1: NFA and private sector import arrivals, 1990 – 2013 ('000 tonnes) ................... 17
Figure 2: Schematic of the rice marketing chain ............................................................... 21
Figure 3: Paddy wholesale, and retail prices, national averages ........................................ 22
Figure 4: NFA procurement, 2000 - 2013 .......................................................................... 23
Figure 5: Milled rice output, utilisation, and imports, 1994 - 2011 ................................... 25
Figure 6: Monthly border and wholesale prices of rice, 1990 - 2011 ................................ 26
Figure 7: NFA total rice distribution, by month, Philippines (2010-2013) ....................... 27
Figure 8: Policy and institutional timeline in the bus sector .............................................. 47
Figure 9: Key statistics in the study area ........................................................................... 49
Figure 10: Bus congestion marginal cost and benefit framework ....................................... 54
Figure 11: EDSA Super Corridor (Transportas Consulting 2006) ....................................... 55
Figure 12: Authorised seat capacity and estimated passenger demand within EDSA ........ 57
Figure 13: Bus travel time and time of day, EDSA, Magallanes to East Ave ...................... 58

iii
List of Tables
Table 1: Marketing efficiency indicators, sample cooperatives vs.
traders in selected regions of the Philippines, 1993 ........................................... 19
Table 2: NFA palay basic support price and wholesale and retail price
of rice to consumers, 1990-2014, in pesos/kg .................................................... 23
Table 3: Profile of key informants .................................................................................... 28
Table 4: Estimated costs and prices of rice, Metro Manila, in pesos per sack ................. 33
Table 5: Total number of applicants per line of activity: Philippines (1990-2013) ......... 34
Table 6: Summary of warehouse capacity (as of December 31, 2013) ........................... 35
Table 7: Results of TWIST ............................................................................................... 40
Table 8: Regulations concerning entry and exit in the bus transport industry ................. 44
Table 9: Agencies/institutions involved in the land transport system and its functions ... 46
Table 10: Area, population, and poverty indicators, Metro Manila and
selected provinces with connecting bus routes ................................................... 48
Table 11: Description of selected bus transport routes ....................................................... 50
Table 12: Number of operators and buses, Manila bus routes ........................................... 50
Table 13: Number of motor vehicles involved in accidents, by type (2008-2012) ............ 52
Table 14: Mean daily supply and demand situation within the EDSA super corridor ....... 56
Table 15: Revenue runs and operational costs for different bus fleet sizes,
compounded to present value from 1997 data ................................................... 56
Table 16: Key parameters for the computation of marginal social costs ......................... 59
Table 17: Estimated time delays due to congestion along the EDSA super corridor ......... 59
Table 18: Marginal external costs from forgone wages of bus passengers, in pesos ......... 60
Table 19: Estimated marginal bus operators‘ costs along the
EDSA super corridor, in pesos ........................................................................... 61
Table 20: Total marginal social costs due to traffic congestion along
the EDSA super corridor, in pesos ..................................................................... 61
1
Acknowledgments
CUTS is implementing a project entitled, ‗Competition Reforms in Key Markets for
Enhancing Social & Economic Welfare in Developing Countries‘ (CREW Project), in four
countries: Ghana, India, Philippines and Zambia, and across two common sectors: Staple
Food and Bus Transport with the support from DFID (United Kingdom) and BMZ
(Germany) facilitated by GIZ (Germany). One of the main goals of this project is to
demonstrate the benefits of competition reforms for consumers and producers, so that greater
attention and support can be provided to this issue by policymakers based in developing
countries.
Efforts of several people have gone into making this report a reality. Involvement in various
forms, such as direct inputs, thought provoking discussions, timely reviews, incessant
encouragement and guidance have been crucial, in development of the report.
First of all, we express our deep gratitude and appreciation to DFID (United Kingdom) and
BMZ (Germany) facilitated by GIZ (Germany) for its extensive support and involvement in
this project. Special thanks are due to colleagues at Nathan Associates.
The preparation of the report would not have been possible without careful guidance and
handholding from our project advisors Frederic Jenny, Chairman, OECD Competition Law
and Policy Committee, France and Rughvir Shyam Khemani, Principal, MiCRA,
Washington DC.
Project Advisory Committee Members made valuable suggestions and provided guidance to
improve the content of this report. A special vote of thanks goes to some of our PAC
members namely Eberhard Feess (Professor of Managerial Economics, Frankfurt School of
Finance & Management, Germany), Natalie Timan (Director of Economics, Competition
and Markets Authority, UK), Owen Gabbitas (Research Manager, Productivity Commission,
Australia) and Tania Begazo (Economist, Competition Policy Thematic Group, Investment
Climate, World Bank).
This report has been prepared by Roehlano Briones and Sonny Domingo of Philippines
Institute of Development Studies (PIDS). Insights and feedback from Filomeno Sta Ana
III and Rafaelita Aldaba is also thankfully acknowledged. A number of senior national
experts and professionals in the Philippines have guided the team from time to time and we
are thankful for their support.

2
We gratefully acknowledge the efforts of Cornelius Dube, Neha Tomar and Shreya
Kaushik for their diligence and hard work in assisting in research and finalising the report.
We also appreciate the efforts of Rajeev D Mathur for editing, Madhuri Vasnani for
proofreading and Mukesh Tyagi for preparing layout of the report.
Last but not the least, this report would not have seen the light of the day without the skillful
direction and guidance of Pradeep S Mehta, Secretary General, CUTS.
Finally, any error that may have remained is solely ours.
Rijit Sengupta Project Coordinator, CREW project

3
Abbreviations
ASEAN: Association of Southeast Asian Nations
AUVs: Asian Utility Vehicles
BAS: Bureau of Agricultural Statistics
BLT: Bureau of Land Transportation
BoT: Board of Transportation
CIF: Cost-Insurance-Freight
COA: Commission on Audit
CPC: Certificate of Public Convenience
CSQs: Country-Specific Quotas
CUTS C-CIER: CUTS Centre for Competition, Investment and Economic Regulation
CREW: Competition Reforms in Key Markets for Enhancing Social &
Economic Welfare in Developing Countries
DCR: Diagnostic Country Report
DoJ: Department of Justice
DOLE: Department of Labour and Employment
DOTC: Department of Transportation and Communication
DPWH: Department of Public Works and Highways
EDSA: Epifanio De Los Santos Avenue
FAOSTAT: Food and Agriculture Organization Corporate Statistical Database
FOB: Freight-On-Board
FX: Filcabs
GAMS: General Algebraic Modeling System
HHI: Herfindahl-Hirschman Index
IAC: Inter-Agency Committee
JICA: Japan International Cooperation Agency
LGUs: Local Government Units
LTFRB: Land Transport and Franchise Regulatory Board
LTC: Land Transport Commission

4
LTO: Land Transportation Office
MAV: Minimum Access Volume
MBOC: Marginal Bus Operators‘ Cost
MEC: Marginal External Cost
MMDA: Metro Manila Development Authority
MMTC: Metro Manila Transit Corporation
MOTC: Ministry of Transport & Communication
MRT: Mass Transit
MSC: Marginal Social Cost
NEDA: National Economic Development Authority
NFA: National Food Authority
NFD: Net Food Disposable
NTP: National Transport Policy
OFC: Office for Competition
PDP: Philippine Development Plan
PNP: Philippine National Police
PSC: Public Service Commission
PUBs: Public Utility Buses
PUC: Public Utility Commission
PUJs: Public Utility Jeepneys
QRs: Quantitative Restrictions
ROI: Return on Investment
SEPO: Senate Economic Planning Office
SUA: Supply and Utilisation Account
TC: Tricycle
TOC: Traffic Operations Centre
TWIST: Total Welfare Impact Simulator for Trade
WISER: Welfare Impact Simulator for Evaluating Research
WTO: World Trade Organization

5
Executive Summary
Overview
This report, the Diagnostic Country Report (DCR) for the Philippines, is a product of the
diagnostic or the research phase of the project entitled Competition Reforms to Enhance
Social and Economic Welfare in Developing Countries (CREW). The project is being
implemented by CUTS Centre for Competition Investment & Economic Regulation with
support from DFID, UK and BMZ through GIZ, Germany. The three year project aims to
demonstrate the implications of competition reforms on producers and consumers in order to
attract the attention of policy makers in developing and least developed countries towards
effective implementation of competition.
The project is being implemented across four countries, namely, Ghana, India, the Philippines
and Zambia, where the common sectors are bus transport and staple food. The project
countries were selected keeping in mind the need to capture contrasting reforms and their
implications across developing and least developed countries, whereas the sectors were
selected because of the high impact they have on common man.
As in many developing countries, post-colonial policy in the Philippines pursued
industrialisation via import substitution. This led to concentration in the manufacturing
sectorand protected domestic markets. With the return to democracy in 1986, numerous
reforms were implemented, which were salutary in subsequent economic development, but
were not enough to dramatically alter the level of market concentration in many industries.
Improved competition and efficiency remains thwarted by remaining entry barriers, such as
franchises and licensing requirements of the government.
The Office for Competition (OFC) was created by Executive Order No. 45, series of 2011,
designating the OFC of Department of Justice (DOJ) as the country‘s Competition Authority.
It is responsible for the investigation and prosecution of cases involving violations of the
competition legislation and its enforcement to protect consumers and supervise behavior of
players in markets, among others. The country, however, is yet to adopt a ‗modern‘
competition law. The process of having a modern competition law is, however, at an
advanced stage in The Philippines – with observers hopeful that the new law will be
embraced before the national elections to be held in 2016. Such a law would have the main
objective of fostering consumer welfare, safeguarding markets from unfair competition, and
promoting economic efficiency.
Regulatory agencies that have been mandated to supervise the two focus markets covered in
this study are Department of Transportation and Communication (DOTC), through the Land
Transport and Franchise Regulatory Board (LTFRB) and Land Transportation Office (LTO),
for bus transport and the National Food Authority (NFA) for rice.

6
Staple foods
The rice sector is regulated by the National Food Authority under a highly interventionist
regime aimed at food security and price stabilisation. Past research on rice industry shows a
high degree of competition in the domestic market, from paddy production to retail
marketing.
The NFA participates in the rice market as a trader, but not enough to significantly affect
paddy prices. Even as domestic production is growing, the increase in consumption has
outpaced the growth in supply, leading to a growth in imports. The domestic price on average
has been higher than the border price. Since 1995 the most significant reform in rice policy
was in the realm of trade liberalisation, mainly due to compliance with World Trade
Organisation (WTO) rules. Furthermore, in recent years the NFA has relaxed its exercise of
import monopoly by authorising private traders to implement the government's import quota.
Consistent with previous studies done on the rice supply chain, a rapid appraisal finds that the
paddy and rice supply chain is multi-layered with many competing players in each layer. At
the farm level, farmers have a choice of buyers competing in their communities—traders
have buying stations, independent agents match producers with millers with the best prices
for a fee, and members of trading cooperatives actively solicit business for their organisation
in consideration of patronage rebates. To get supplies, mills use competitive pricing. Entry
into the rice business is easy if capital, supply source, and potential market are available.
NFA licensing and registration requirements are not an issue.
With the many layers in the rice supply chain and the apparent number and variety of players
in each level, it is difficult to imagine how one group of market players could influence
market directions to their advantage. NFA data shows the existence of an ample number of
market players. Moreover, the cost estimates and prices show no substantial margins as these
are apparently limited to 2 per cent or less of the cost of raw materials up to the wholesale
level and 5 per cent at the Metro Manila retail level. Interviewees consistently say that the
competition is really stiff, especially with tight paddy supplies, a situation that was
pronounced at the time of the interviews.
In one aspect though, competition is seriously curtailed, namely, entry into the import
business. The NFA maintains a statutory monopoly; in conjunction with a self-sufficiency
target, this has led to a declining import quota and an intensifying protection of domestic
producers. Rice importation policies need to be rational and effective in protecting not only
the interests of producers but also consumers and other market participants. Huge differences
in the costs of bringing in imports and moving domestic supplies to consumers makes
smuggling lucrative. Moreover, according to the key informants, quantitative restrictions on
imports as exemplified by NFA‘s regulations allow the concentration of legally imported
supplies in the hands of a few.
Through the use of a simulation model called the Total Welfare Impact Simulator for Trade
(TWIST), both the consumer and producer welfare were computed under varying degrees of
import controls. Actual and counter-factual scenarios were developed for the 2013 rice
market using TWIST. Analysis indicates that if quantitative restrictions were eliminated and

7
rice imports were allowed to freely enter the country, total rice imports would have reached
4.20 million tons, a tenfold increase over actual imports. Such high level of imports would
have brought down the retail price of rice to P19.80 /kg from P33.08 /kg, and the wholesale
price down to P17.66 /kg from P30.04 /kg. Clearly, consumers would have benefited from
free trade given the low market price of rice. Consumer surplus would have increased by
P178,075.65mn. However, this would have led to a P33,985.01mn reduction in producer
surplus. In total, the economy would have benefited by as much as P138,464.10mn.
If instead the import quota were maintained at the previous year's level of 1,000,000 tons,
prices would have fallen. At the retail level, price of rice would have decreased from P33.70
/kg to P31.52 /kg. At the wholesale level, price would have dropped by P2.18 /kg. Consumer
surplus would increase by P25,706.18mn; however, producer surplus would decrease by
P6,598.97mn. The overall impact would have been a P25,203.32mn increase in economic
surplus.
This paper recommends that the government should reconsider its protectionist rice policies.
Relaxing the import quota under private sector participation in trade is welfare-improving,
but ultimately a stop-gap measure. A more permanent reform is tariffication; a properly-set
tariff level under a liberalised import policy, allowing anyone to bring in rice with the
payment of moderate tariffs, can still confer some protection to producers (avoiding severe
dislocation), provide more stability to domestic supplies and prices, and deter any attempt to
control stocks for the purpose of manipulating prices.
Bus Transport
The bus transport sector evolved from a highly regulated and concentrated market in the
1970s to a liberalised market composed primarily of small operators. Major reforms in bus
transport regulation were carried out in the early 1990s in order to liberalise the market.
The market now operates under a highly complicated regime where regulation and
enforcement is shared by several agencies resulting in implementation failures and regulatory
capture in the form of operation of illegal buses and proliferation of ‗kabit‘ system where a
bus owner enters the market through arrangement with an operator with established franchise.
Further, market inefficiency manifests in many operators and buses resulting in traffic
congestion. The study focuses on two routes in Metro Manila, and two inter-city routes
connected to Metro Manila. These routes were selected to represent or illustrate the issues not
only being confronted in regards to these routes but also in the broader context of the sector.
The selected routes fairly represent the existing conditions in the field, and aptly illustrate the
issues being confronted within the broader context of the sector.
In order to curb the oversupply of buses, the government imposed a moratorium in 2000 on
provincial buses and in 2003 on all buses. Further, in addition to the moratorium in 2003,
Route Rationalisation Programme 2003 was implemented in order to reduce the number of
buses going through Epifanio De Los Santos Avenue (EDSA) super corridor. However, from
the number of buses and operators in the market, it is evident that the reforms have not been
effectively implemented and have failed to meet their objectives. Interviews with bus
operators revealed that the moratorium is not binding since it is still possible to acquire a new

8
franchise if one is willing to pay a stiff fixer‘s fee of P150,000 per unit. The official franchise
rate is only P510 for the first 2 units and P70 for each additional unit. Further, in terms of
competition, cut throat competition prevails in the market as is evident from the existing
Boundary System which allows the drivers and conductors to pay a fixed amount (per day) to
the operators and keep the excess amount as profits. During the peak hours, many drivers are
seen driving rashly in order the pick passengers at the earliest.
One of the competition issues that emerged during the research was the fare. It was found that
in spite of the high level of competition, the bus fares are still high. Currently, the fares are
revised by the Land Transport Franchise Regulatory Board through a process of public
hearing after a petition for fare revision is submitted by the franchise. In order to arrest this
issue, the LTFRB is under the process of revising its fare setting mechanism.
Under the research, cost-benefit analysis was undertaken in order to analyse the implications
of congestion due to the excessive buses. Results showed that the value of time wasted due to
traffic congestion is immense. Reducing bus trips will ease congestion and permit faster
travel time on average; buses can also achieve faster turnover hence passengers can expect
equal availability of bus service. It needs to be borne in mind that Metro Manila also has a
fairly high density of cars, with numbers ever-increasing over the years. Therefore, any
decongestion policy will also have to somehow take this into consideration. Merely
regulating the number of buses (means of transport for ordinary people) without any
concurrent strategy for applying the principle of decongestion on other vehicles (especially
personal vehicles like cars) will neither solve the issues nor will be politically appealing.
The assessment of the bus transport market reveals that effective decongestion (involving
implementation of the moratorium of 2000) can lead to a decrease in bus trips by 20 per cent
within the EDSA super corridor, while still sufficiently servicing existing passenger
demands. This would have yield a ‗savings‘ for the country at net present value of P13.2bn in
the medium term (3 years) and P19.86bn in the long term (6 years) at 12 per cent discount
rate. Such benefits of decongestion cannot be overlooked by policymakers – and there is
need for engaging them with this evidence.
Offhand, proper enforcement of existing traffic and transport policies, particularly on
franchise agreements, could result in the targeted decrease in buses plying the routes.
Obviously, if the first option is to be taken, such limits should not be overly restrictive and go
the opposite extreme, leading to failure of contestability and the rise of market power.
Targeting the number of operators will require deeper analysis of the scope and capabilities
of the regulator vis-a-vis the bus operators, and is beyond the scope of this DCR.

9
1. Introduction
Competition reforms seek to promote a market environment in which no party or group is
able to assert its dominance over market outcomes. Competition is expected to result in lower
prices and better quality for consumers; meanwhile producers as an industry benefit from an
open playing field (though reform may be opposed to the interest of an erstwhile dominant
market player).
Competition enforcement is fair to weak in many developing countries, and needs to be
strengthened to ensure that competition reforms lead to measurable and demonstrable welfare
gains. Developing and least developed countries are faced with resource constraints, and
policy makers need to make difficult choices/decisions while allocating scarce resources
between various public policy areas. For resources to be made available to implement
competition reforms in developing countries, it is necessary that impacts of competitive
markets on consumers and producers are properly demonstrated and explained to policy
makers (and development partners as well). However, there is lack of a comprehensive
approach for measuring such impacts.
CUTS Centre for Competition, Investment & Economic Regulation (CUTS C-CIER) has
undertaken a project entitled ‗Competition Reforms in Key Markets for Enhancing Social &
Economic Welfare in Developing Countries‘ (CREW Project). The project is being executed
in Ghana, India, The Philippines and Zambia and across two common sectors: staple food and
passenger transport. One of the main goals of this project is to demonstrate the benefits of
competition reforms for consumers and producers, so that greater attention and support can
be provided to this issue by policy makers.
In the Philippines, the DCR covers rice, the country's main staple. The DCR aims to identify
existing concerns of consumers and producers in the Filipino rice sector and propose market
reforms to help address these concerns, and estimate benefits thereof. More specifically its
objectives are:
review trends in the rice sector in The Philippines, particularly policies affecting the
market and competition in various components of the rice value chain;
describe the state of competition in the Philippine rice industry;
assess the impact of past and current competition reforms (i.e. reforms enhancing
competition in the market) on consumers and producers, and based on this assessment
make recommendations; and
identify concerns (of consumers and producers) and assess the potential impact of
reform measures that can help address such concerns.

10
For passenger transport, the DCR focuses on bus transport services. The DCR examines:
the institutional and regulatory framework governing the bus transport sector;
major competition reforms in the sector and analyses the impact of the reforms on the
welfare of consumers and producers; and
further priority reforms to improve competition and efficiency in the sector.
This DCR should be useful to policy makers and stakeholders in the competition reform
agenda of the Philippines.
Report Structure
Chapter 2: Background
The first chapter presents a brief discussion on the reforms in the overall economic policy in
general and competition policy in particular in the light of the post 80s economic
liberalisation. The chapter also deliberates on the overall policy paradigm and some recent
changes in the focus sectors of staple food and bus passenger transport.
Chapter 3: Competition Reforms in Staple Food Sector (Rice) and Implication on
Beneficiaries
The chapter assesses the important reform measures relating to the rice market in terms of
impact on market structure, competition and welfare on farmers and consumers. Further the
chapter links the impact of the select reforms on the consumers and farmers.
Chapter 4: Competition Reforms in Bus Transport Sector and Implication on
Beneficiaries
The chapter assesses the important reform measures relating to the passenger bus
transportation market in terms of impact on market structure, competition and welfare on
operators and passengers. The chapter also draws the linkage between the reforms and the
impact on passengers and operators.
Chapter 5: Way forward
This final chapter summarises the way forward based on the key findings of the study.

11
2. Background
History of Economic and Competition Reforms
As in many developing countries, post-colonial policy in the Philippines pursued
industrialisation via import substitution. Domestic manufactures were shielded by tariffs,
quantitative restrictions, and administrative allocations. This led to concentration in
manufactures and protected domestic markets (Medalla, 2002a). An indirect result was the
effective protection of agriculture, partly through the trade regime, and more importantly due
to exchange rate overvaluation (Intal and Power, 1991). In the 1970s an authoritarian
government came into power, which reinforced import substitution, and introduced an
interventionist regime in agriculture, spearheaded by several state-owned enterprises, some of
which received favourable market access or outright monopolies, e.g. in sugar, rice, and
fertiliser (David, 2003).
The bankruptcy of the import substitution model became apparent as the country fell into a
deep economic and political crisis in the mid-1980s. The turning point came with the return
to democracy in 1986. The new government disengaged from import substitution, relaxing
and eventually repealing most quantitative restrictions, initiated rounds of unilateral tariff
reduction, and lifted monopolies and export taxes affecting agriculture. Deregulation and
privatisation was also instituted to remove barriers to competition and improve factor
mobility (e.g. liberalisation of capital markets and floating of exchange rates).
Major reforms have been introduced since the late 1980s. In 1987, the power generation was
opened up by terminating the monopoly of the state-owned National Power Corporation.
Similarly, in the early 1990s, telecommunications was liberalised. Shipping was likewise
deregulated by removing controls on first and second class passenger rates. This was
followed by the air industry, in which restrictions on domestic routes were eased and pricing
regulations repealed (Aldaba and Aldaba, 2014).
These liberalisation initiatives, however, do not guarantee competitive markets, as other
factors may come into play, e.g. the presence of non-tradables, industries with high transport
costs, perishables, and services, as well as persistence of regulatory and structural barriers to
entry (Medalla, 2002a). In fact, the nation's wealth continues to be highly concentrated. In
numerous industries concentration ratios remain high; many of the dominant firms are
members of conglomerates owned by a small group of elite families; many of these in turn
wield political power. Only about a hundred political clans control virtually all elective
positions at the national level. Concentrated industries include petroleum, iron and steel,
fertiliser, pulp and paper, home appliance manufacturing, tobacco manufacturing,
telecommunications, shipping, and supermarket retail. De-concentration is thwarted by
remaining entry barriers, such as franchises and licensing requirements of government (Abad,

12
2002). Other rules and regulations that may affect competition include: business registration
requirements; land zoning; labour laws; intellectual property; environmental regulations; and
investment rules and incentives (Medalla, 2002b).
Philippines is one of the few countries in the ASEAN region that does not have a national
competition law yet. In 2007 ASEAN leaders had agreed to the establishment of the ASEAN
Economic Community in 2015. It was also agreed that all ASEAN Member States would
have a national-level competition legislation by 20151. While Philippines does not have
‗modern‘ competition legislation, it does have several competition-related laws and
regulations.
The 1987 Philippine Constitution (Article XXII, Sect. 19) states: "The State shall regulate or
prohibit monopolies when the public interest so requires. No combinations in restraint of
trade or unfair competition shall be allowed." The Penal and Civil Codes respectively define
criminal and civil liabilities for specified anti-competitive behaviour. The Consumer Act (RA
7494) of 1932 promotes consumer product quality and safety standards, and prohibits
deceptive and unfair sales practices, such as through fraudulent weights and measures,
product service warranties, and the like.
A major competition reform enacted in 1991 was RA 7581 or the Price Act. The Act aims at
protection of consumers by stabilising the prices of basic necessities and prime commodities,
and enact measures against undue price increases during emergency situations. Basic
necessities include rice, as well as corn, and other foodstuffs. The Act criminalises acts of
price manipulation and combination, namely: hoarding, profiteering, and formation of cartels.
By virtue of Presidential instruction (Executive Order 45 of 2011), the Department of Justice
(DOJ) has been designated as the country's competition body. The DOJ established an Office
for Competition (OFC) to enforce competition policy, investigate cases of possible violations,
and prosecute violators. There are, furthermore, sector-specific legislations on competition.
Republic Act 8479 provides for Downstream Oil Industry Deregulation Act (1998); Republic
Act 9136 is the Electric Power Industry Regulation Act (2001). Sector-specific regulators
have been established as well, such as the National Telecommunications Commission,
Electricity Regulatory Commission, the Metropolitan Waterworks and Sewerage System
Regulatory Office, the Land Transport Franchise and Regulatory Board (LTFRB), the
National Food Authority (NFA), and the Sugar Regulatory Agency. These regulators have
within their sectors, the mandate of promoting development, social objectives (e.g. universal
coverage), and competition. Of special concern of course is the overlap between the activities
of the competition authority and those of the sector regulators (Aldaba and Sy, 2014).
1 http://www.asean.org/archive/publications/ASEANRegionalGudelinesonCompetitionPolicy.pdf

13
The overlap can be seen in the statement of duties and responsibilities of OFC based on
Executive Order 45:
a. prosecute violators to prevent, restrain and punish monopolisation, cartels, and
combinations in restraint of trade;
b. enforce competition policies and laws to protect consumers from abusive,
fraudulent, or harmful corrupt business practices;
c. supervise competition in markets by ensuring that prohibitions and
requirements of competition laws are adhered to, and to this end, call on other
government agencies and/or entities for submission of reports and provision for
assistance;
d. monitor and implement measures to promote transparency and accountability in
markets;
e. prepare, publish and disseminate studies and reports on competition to inform
and guide the industry and consumers; and
f. promote international cooperation and strengthen Philippine trade relations with
other countries, economies, and institutions in trade agreements.
In short, the OFC is given the mandate to enforce all competition-related laws, without
delimitation by sector. In fact, duty and responsibility seems to empower it to take the lead in
supervising competition in markets. A useful way of distinguishing the roles of the sector
regulators from that of OFC is that the former focus on competition enforcement, whereas the
latter specialise in criminal aspects of competition law. It is also the competition enforcer of
last resort, stepping in when sector regulators may be in remission of their duties, perhaps due
to regulatory capture.
Discussion of Reforms Undertaken in the Selected Sectors
The rice sector is regulated by the National Food Authority (NFA), which participates in the
rice market as a trader. Even as domestic production is growing, the increase in consumption
has outpaced the growth in supply, leading to a growth in imports. NFA holds a statutory
monopoly on importation of rice.
This Report shows that the paddy and rice supply chain is multi-layered with many
competing players in each layer. At the farm level, farmers have a choice of buyers
competing in their communities, traders have buying stations, independent agents match
producers with millers with the best prices for a fee, and members of trading cooperatives
actively solicit business for their organisation in consideration of patronage rebates. To get
supplies, mills use competitive pricing. Entry into the rice business is easy if capital, supply
source, and potential market are available. Since 1995 the most significant reform in rice
policy was in the realm of trade liberalisation, occasioned by the country‘s accession to the
WTO. In recent years the NFA has relaxed its exercise of import monopoly by authorising
private traders to implement the government's import quota.

14
Meanwhile, the bus transport sector evolved from a highly regulated and concentrated market
with a handful of players in the 1970s to a more liberalised albeit still regulated market with
hundreds of small operators. Major reforms in bus transport regulation were carried out in the
early 1990s and 2000s among which were more liberal policy and a supposed moratorium on
new franchises. The current market operates under a complicated regime where regulation
and enforcement is shared by several agencies. Market inefficiencies manifest in many
operators and buses, and indiscipline in the road adding to traffic congestion problems in
Metro Manila and key urban communities. There is also the proliferation of illegal non-
franchised buses and kabit system where a bus owner enters the market through arrangement
with an operator with established franchise. The fragmented nature of both the sector‘s
regulatory and supply side impedes synchronisation among stakeholders and incurs huge
costs to industry operators and the riding public.
The DCR undertakes a case study focusing on two routes in Metro Manila, and two inter-city
routes connected to Metro Manila. The selected routes fairly represent the existing conditions
in the field, and aptly illustrate the issues being confronted within the broader context of the
sector. A cost-benefit analysis implemented in this DCR shows the tremendous magnitude of
benefits from implementing an effective regulatory regime that addresses the congestion
problem along the main intra-city route. There is therefore significant scope for undertaking
further reform in terms of rationalising competition in the congestion-prone bus transport
sector.

15
3. Competition Reforms in Staple Foods Sector (Rice) and Implication on Beneficiaries
The Rice Sector of the Philippines
The rice sector is regulated by the NFA under a highly interventionist regime aimed at food
security and price stabilisation. Presidential Decree No. 4 of 1972 established the charter of
the NFA (then called the National Grains Authority). The NFA was established to encourage
grains production and productivity and assure a "fair return" on investment of producers. Its
mandate is to maintain food security in staple cereals in times and places of natural or man-
made calamity/emergency, as well as stabilisation of staple cereal supply and prices. To do so
it was given a broad set of powers, including:
maintain a national buffer stock;
procure and sell grain;
monitor grain storage;
seize stocks in case of hoarding;
establish and enforce standards in grading, sampling, and inspection;
register, license, and supervise warehouse, mills, and other businesses related to
grains;
control the importation of grains so as to maintain parity between domestic and world
prices; and
control the export of grains.
The NFA also regulates a number of rice-related processing and servicing activities, namely:
mechanical drying, threshing, and other post production equipment
transportation
milling
warehousing
manufacture of rice-based and corn-based products
grains packaging
retailing/wholesaling
importing/exporting/indenting
Each of these activities requires a license from NFA, which is typically valid for a year and
subject to renewal.
Competition regulation in the rice sector is guided by relevant provisions in the Constitution
and the Price Act. The enforcement agency for the case of rice is the NFA. In recently highly
publicised campaigns, the NFA has joined other law enforcement agencies (such as the
Philippine National Policy, Bureau of Customs, and National Bureau of Investigation) in

16
investigating suspected smugglers and hoarders, revoking licenses of rice traders conducting
illegal practices, and impounding stocks of errant traders.
Since 1995 the most significant reform in rice policy was its compliance with WTO rules
and decisions. In 1995 the Philippines acceded to the World Trade Organisation (WTO),
particularly articles on conversion of quantitative restrictions (QRs) into equivalent tariffs
(tariffication). However the Philippines obtained a Special Treatment for rice up to 2005,
allowing it to maintain its rice QR. Nevertheless the country conceded a minimum market
access, ranging from 30,000 tons in 1995 up to 224,000 tons in 2004. Volumes within the
market access charged a maximum tariff of 50 per cent. Upon expiration in 2005, the country
negotiated and obtained an extension of its special treatment for rice up to 2012. In exchange
the country raised its minimum access to 350,000 tons, of which 163,000 were in the form of
Country Specific Quotas (CSQs) to Thailand, China, India, and Australia. In practice, the
high prices of rice produced in these countries tend to limit the usage of CSQs by private
traders. Currently, the Philippines has applied for an extension of special treatment with the
WTO up to 2017, in the meantime maintaining status quo in its import policy while approval
is pending.
RA 8178 (1996) Agricultural Tariffication Act, converted trade barriers into tariffs, to meet
the country's WTO obligations. However RA 8178 specifically exempted rice; rather, it
confers the NFA the authority to undertake direct importation of rice, or allocate the import
quota among licensed importers.
One positive development was the shift to private sector importation beginning in 2008,
which intensified in 2010 onwards. In 2008, the allocation to private importers was only
200,000 tons, of which only 76,000 was actually imported; total imports that year totaled 2.2
million tons (Figure 1). Private sector engagement was low due to very high world prices
prevailing at the time; moreover as explained above, the CSQ scheme prevented importers
from selecting their least cost supplier. By 2011 the private sector (inclusive of farmer
organisations) was allowed to import 660,000 tons, 77 per cent of that year's import quota of
860,000 tons. However the annual import quota is now restricted to the minimum market
access owing to the self-sufficiency target of 100 per cent by 2013, to be sustained up to
2016. In 2013 the import quota is 350,000 tons, of which 163,000 is assigned to the private
sector under the CSQs.

17
Figure 14: NFA and private sector import arrivals, 1990 – 2013 ('000 tonnes)
Source: NFA.
Import allocation policy ceded some responsibility for price stabilisation to the private sector;
it also eased some fiscal pressure on NFA as imported stock could be released by the private
sector at prevailing market prices, rather than by the NFA under its low-price retail
distribution programme. However as private sector importation was carried out under an
overall QR regime, with its allocation mechanism later being questioned for lack of
transparency, the reform did not significantly alter the distortionary features of the NFA
import monopoly.
The input distribution system for rice is characterised by low levels of government
intervention. In this study it is posited at the level of the farm, producing paddy (husked, or
rough rice); there is of course a prior input distribution system, for which the state of
competition is fairly well characterised (Box 1).
Past research on rice industry shows a high degree of competition in the domestic
market, from paddy production to retail marketing. As early as the mid-1960s, analysis
by Mangahas and Recto (1966) of rice market found that price changes at one level of the
marketing system are typically reflected with little change in the marketing margin, at other
levels. Market power if any is only transitory or of local significance. This was echoed in the
analysis of Mears and Anden (1970), which shows that "hoarding" of palay or milled rice
during the off-season does not necessarily create abnormal profit to the trader; when
opportunity costs of storage are taken into account, both farmers and traders face a high
probability of loss from holding paddy rice for sale after harvest. The astute trader may
realise profit, but even so may sustain losses in some years; it is unrealistic to suppose that a
farmer with less familiarity and information could fare better.
In the mid-1980s, studies on rice marketing continued to emphasise recurrent themes of
multiple market layers, numerous players, and the pervasiveness of government intervention.
-
500
1,000
1,500
2,000
2,500
3,000
1990 1995 2000 2005 2010
NFA Private sector

18
During that period, when the degree of self-sufficiency was greater than the past decade,
Umali and Duff (1992) found that there was a diversity of prices throughout the marketing
chain, generally reflecting differences in grain quality. Competition in the private marketing
system had been steadily increasing in rice retail, wholesale, and transportation sectors, as
well as in warehousing. However, rice processing was not as competitive as government
licensing served as an entry barrier.
Box 1: The Rice Input System
The main variable inputs to rice production are fertiliser, agro-chemicals, and seed.
According to BAS data, agro-chemicals account for less than 3 per cent of total production
cost; seed has a similar share, while fertiliser accounts for 10 per cent of production cost.
Only 29 per cent of seeds is certified as hybrid seeds; the rest is "good seeds" (purchased but
not certified) or farmers' own seed. Privately-bred seeds (distributed by large agribusiness
companies) account for just 10 per cent of all rice seeds (Sombilla and Quilloy, 2014).
Meanwhile in the case of fertiliser, over 70 per cent of domestic supply is sourced from
imports. It can be shown that domestic and world prices of urea (the most important form of
fertiliser) are integrated, in the sense that the margin between world and domestic price is
mostly explained by marketing cost. Import permits are not required, although importers
need to be licensed and imported products need to be registered. Tariffs on imports are
minimal; 85 per cent of imports are from free trade partners for whom the preferential rate is
zero. There have been no major fertiliser subsidy schemes since 1986. The fertiliser
distribution system is characterised by numerous players; as of 2009 there were 483 licensed
handlers in the fertiliser industry, spanning importation, distribution, repacking, export, and
manufacturing. Of these, 134 were listed as importers; 7 handlers were also listed as end-
users (e.g. large plantations). Many more handlers are farmer cooperatives or associations
(e.g. sugar planter organisations) who distribute fertiliser to their members. Briones (2014)
finds that fertiliser handlers report no major issues in obtaining licenses and registering
fertiliser products. Moreover, domestic and world markets are integrated, i.e. arbitrage
opportunities between world and domestic prices are exhausted. (This of course does not rule
out cartelisation in the world markets, which may artificially elevate world prices).
In the 2000s, government implemented the Hybrid Rice Commercialisation Programme, the
flagship project to boost rice productivity in the country. The programme promoted
dissemination of hybrid rice varieties combined with seed and fertiliser subsidy. The
programme was terminated in 2010 by the succeeding administration. Criticisms of the
programme had been mounting, first from farmer organisations themselves (GRAIN, 2005),
as well as from government managers and auditors due to fund anomalies. Since then there
have been no major subsidy programmes for rice seeds and fertilisers. The lack of opposition
to the closure of the programme suggests that intended beneficiaries never felt substantial
benefits from the subsidy allocations due to the aforementioned leakages.
The authors also examined the issue of market integration, i.e. the degree to which trading
activity arbitrages away differences in space or level of marketing, leaving only "pure"
(opportunity) costs of transport and marketing. They found that wholesale and retail levels of
19
the market were integrated, although the degree of connection between farm and wholesale
markets was much lower.
The integration result is consistent with that of symmetry of price changes found by Reeder
(2000). Using official data on farm gate, wholesale, and retail prices, he finds that traders do
adjust their prices upwards when cost increases; they are equally likely to pass on falling
costs by providing price discounts. There is no evidence to support the view that traders over-
react to unanticipated market news (i.e. of shortages); shocks tend to propagate from the farm
level, to the wholesale, and then the retail level. Finally, Rufino (2008) finds that regional
wholesale prices of regular milled rice are well integrated in the long run; moreover, even
short-run deviations from long run equilibrium dissipate rapidly. Apparently by the 1990s,
entry barriers were not affecting the competition across space, given the study's failure to
detect arbitrage opportunities across regions.
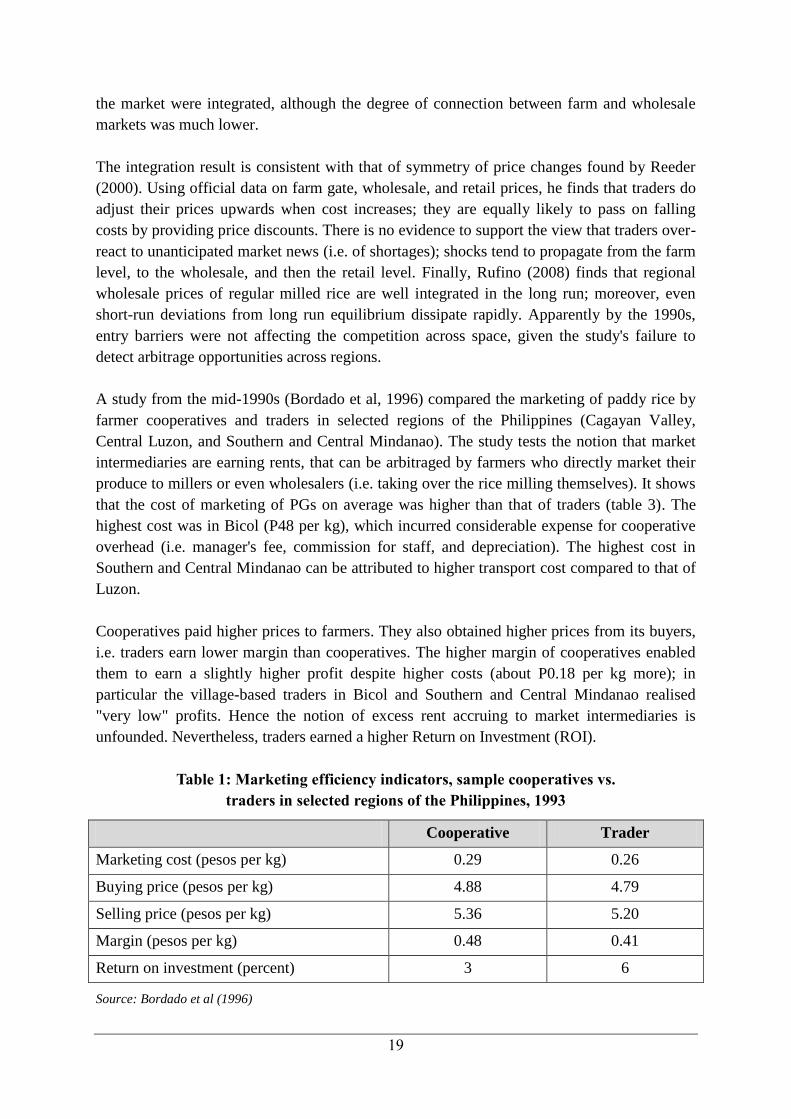
A study from the mid-1990s (Bordado et al, 1996) compared the marketing of paddy rice by
farmer cooperatives and traders in selected regions of the Philippines (Cagayan Valley,
Central Luzon, and Southern and Central Mindanao). The study tests the notion that market
intermediaries are earning rents, that can be arbitraged by farmers who directly market their
produce to millers or even wholesalers (i.e. taking over the rice milling themselves). It shows
that the cost of marketing of PGs on average was higher than that of traders (table 3). The
highest cost was in Bicol (P48 per kg), which incurred considerable expense for cooperative
overhead (i.e. manager's fee, commission for staff, and depreciation). The highest cost in
Southern and Central Mindanao can be attributed to higher transport cost compared to that of
Luzon.
Cooperatives paid higher prices to farmers. They also obtained higher prices from its buyers,
i.e. traders earn lower margin than cooperatives. The higher margin of cooperatives enabled
them to earn a slightly higher profit despite higher costs (about P0.18 per kg more); in
particular the village-based traders in Bicol and Southern and Central Mindanao realised
"very low" profits. Hence the notion of excess rent accruing to market intermediaries is
unfounded. Nevertheless, traders earned a higher Return on Investment (ROI).
Table 1: Marketing efficiency indicators, sample cooperatives vs.
traders in selected regions of the Philippines, 1993
Cooperative Trader
Marketing cost (pesos per kg) 0.29 0.26
Buying price (pesos per kg) 4.88 4.79
Selling price (pesos per kg) 5.36 5.20
Margin (pesos per kg) 0.48 0.41
Return on investment (percent) 3 6
Source: Bordado et al (1996)

20
Hayami and Kikuchi (2000) conducted a reconnaissance of the marketing system in Laguna
province in 1995 – 1997 from paddy procurement to retail. Their study revealed the "highly
competitive" nature of rice marketing in the locality. Countless middlemen compete in the
procurement of paddy; these include small community-based collectors, who virtually any
villager can engage with. These buyers compete with numerous rice mills; in one
municipality (Pila, Laguna), as many as nine mills compete for paddy rice. These mills are
also competing with other mills, not only in Laguna, but also in other provinces. Widening
procurement area allows mills to obtain rice over different harvesting seasons and thereby
avoid excess capacity; hence no mill, even large ones, exercises monopoly power. Intense
competition is also observed between wholesaling of rice by mills to retailers, and in retailing
to consumers.
The authors do observe long-term trade relationships between farmers and collectors,
collectors and rice mills, and rice mills and retailers, often with credit tying; however such
relationships are motivated by savings in transaction costs arising from possible opportunism,
and reduction of risk, rather than exercise of monopoly or monopsony power. "Farmers,
middlemen and consumers continue to maintain long-term trade relationships so long as it is
beneficial to them, but it is very easy to switch trade partners if the present relationship is
found to be unsatisfactory. Thus the market is highly ‗contestable‘ if not perfectly
competitive (pp. 204 – 205)."
The most recent study to use primary data traces the value chain from the farm to the
wholesale level (Dawe et al 2008), comparing two similarly situated marketing channels in
Thailand and the Philippines. The gross marketing margin in Thailand is much smaller
(US$16 per ton, compared to US$67 per ton in the Philippines). Marketing costs are 100 per
cent of the gross marketing margin in Thailand, and 55 per cent that of the Philippines
(US$29 per ton). The most important source of the difference in marketing cost is the higher
interest rate for working capital in the Philippines, accounting for 58 per cent of the
difference in marketing costs. Nevertheless the large difference in net margin implies some
excess profit in the Philippines, i.e. a positive and significant difference between gross
margin and measured marketing cost.
In principle, the excess profit should encourage expansion by existing players, as well as
entry of new players, until the excess is competed away. Hence persistence of excess profit
may be explained as follows: first, new players are not necessarily low cost traders, i.e. the
low cost traders have already entered the market; second, low cost traders already in the
market face constraints in gaining access to working capital, forestalling expansion of their
operations; third, there may be large hidden costs of doing business in the Philippines which
may be constraining entry and expansion of low cost traders; and fourth, entry of more
efficient foreign investors (e.g. from Thailand) into domestic rice trade may be prevented by
statutory barriers against foreign investment in the rice business.

21
Some past studies suggest that marketing inefficiency in the Philippines manifests in
many rather than few traders. Tadem (2002) alleges that rice marketing in the Philippines
involves a network of middlemen working closely with rice cartels which control 90 per cent
of the country's rice supply. The biggest is the "Binondo rice cartel" composed of Filipino-
Chinese traders. Intal and Garcia (2005), refer to a so-called ―rice cartel‖ composed of seven
Chinese families, associated with Binondo due to two streets in Chinatown characterised by a
heavy concentration of large rice wholesalers in Manila. However, the existing literature
debunks this view of a cartelised market.
Dawe et al (2008) note that allegation of a cartel is certainly not true between farm gate to the
mill, or from the wholesale to the retail levels. In fact it is likely that large marketing margins
are perhaps due to proliferation of traders, leaving scale economies in trade unexploited. It
takes about 18 marketing agents (traders and millers) to process 90,000 tons of dry palay,
compared to one miller in Thailand. As discussed above, the efficient traders/millers are
unable to expand their operations, unlike those in Thailand. The authors do concede that
collusion may still occur among the "very large traders" who operate at the wholesale level.
However they compare the marketing margin at wholesale-to-retail stage between Bangkok
and Manila; while the latter is lower, the difference is only P0.33 per kg of palay; adjusting
for higher capital costs in Manila, the upper bound estimate of the excess margin due to
collusion. Even if collusion exists, it exerts only a small influence on the market price.
The rice marketing chain covered in this study is shown in figure 2. Typically, the farm
produce is sold to traders, who then sell paddy rice to rice mills. Rice millers process the
paddy into milled rice. From the mill, the rice goes to wholesalers, who may also obtain
milled rice from importers; rarely is rice imported in paddy form. Wholesalers then sell it to
retailers, which in turn are divided into traditional retail outlets (rice sold in public or wet
markets, or roadside stalls), as well as modern retail outlets (i.e. supermarkets and retail
chains). The latter are often pre-packed and sealed, whereas the former are often sold loose.
Figure 2: Schematic of the rice marketing chain
ProductionMarketing (farmgate)
Milling (processing)
Marketing (wholesale)
Imp
ort
Retail
FarmersPaddy traders
MillersWholesalers
Retailers (traditional, modern retail); Consumers
Importers

22
Figure 2 is a simplification of a much more complicated state of affairs in the marketing
chain. There may be multiple layers especially between farmers and millers, working as
consolidators, commission agents, independent traders, etc. Millers may also procure directly
from farmers or sell to retailers; likewise wholesalers can be simultaneously importers and/or
retailers.
Note that the price spread in the marketing chain is narrower at the retail level, compared to
the wholesale level. The trend in price at the paddy, wholesale, and retail levels are shown in
Figure 3.
Figure 3: Paddy wholesale, and retail prices, national averages
Source: BAS CountryStat.
The price spread (as a share of retail price) ranges from 6 to 8 per cent at the wholesale-to-
retail level; the price spread at the paddy-to-wholesale level is much wider, ranging from 40
to 44 per cent. This is likely a reflection of higher costs along that segment of the chain, as it
covers processing (e.g. processing cost and quantity adjustment for milled rice recovery) as
well as assembly cost from paddy farmers to millers.
Competition Concerns in the Rice Sector
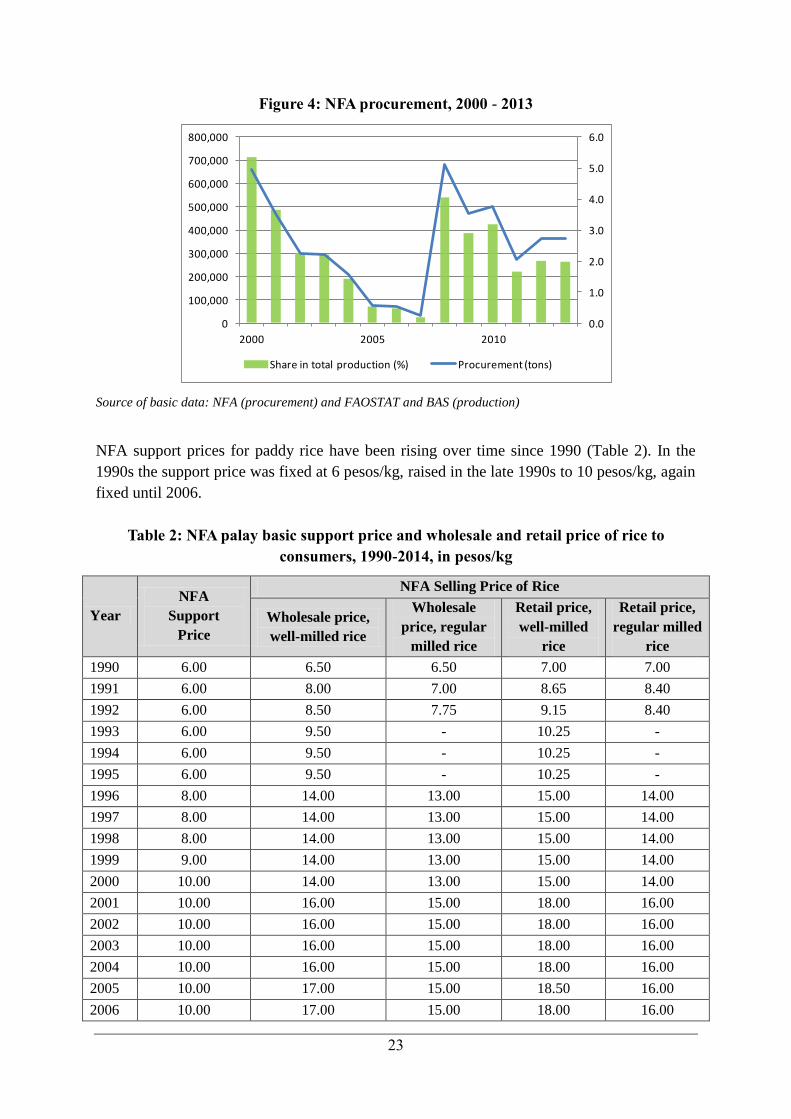
The NFA participates in the rice market as a trader, but not to an extent that its procurement
activity significantly affects paddy rice prices. For rice, the NFA does paddy procurement,
storage and distribution. Based on NFA‘s historical data on volume of paddy procurement,
the trend shows varying degrees of paddy procurement throughout the last decade (Figure 4).
Although it annually sets a target, there appears to be no consistent threshold level for paddy
procurement. For instance, in 2005 up to 2007, procurement levels were below 100,000 ton.
Then, in 2008, it shot up to 683,402 tons, which was the highest record since 1980.
0
5
10
15
20
25
30
35
2002 2003 2004 2005 2006 2007 2008 2009 2010 2011 2012
Paddy price Wholesale price Retail price
23
Figure 4: NFA procurement, 2000 - 2013
Source of basic data: NFA (procurement) and FAOSTAT and BAS (production)
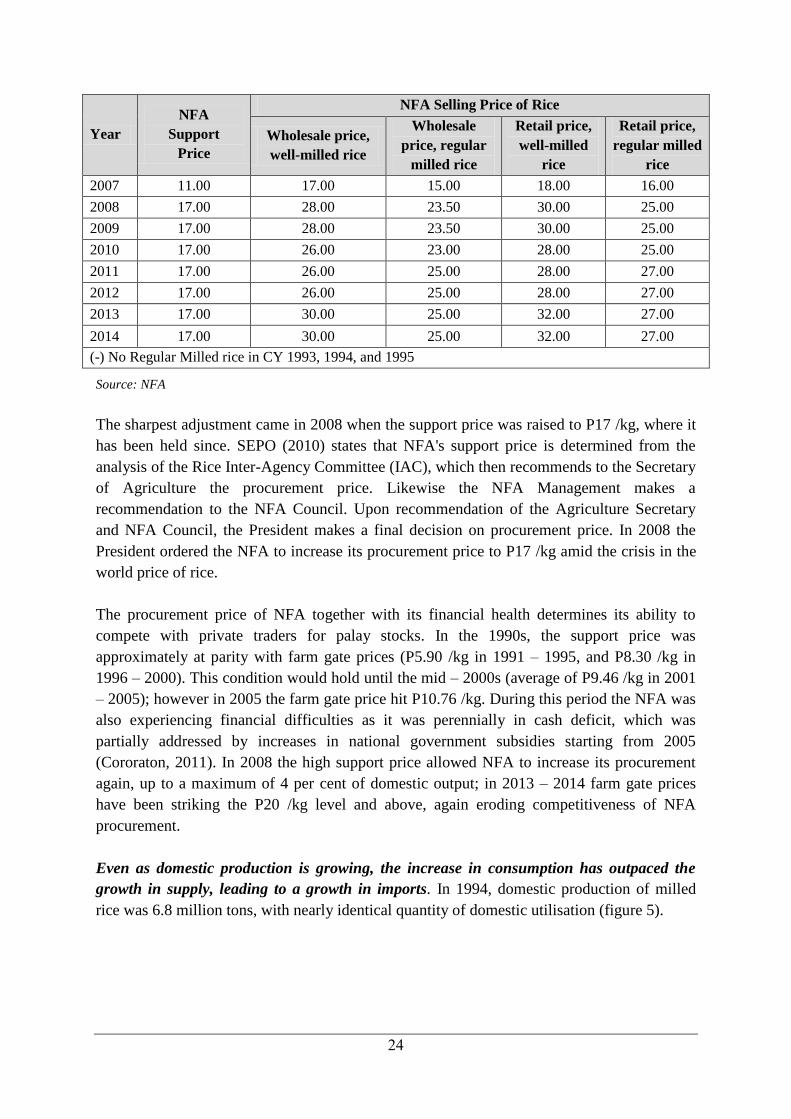
NFA support prices for paddy rice have been rising over time since 1990 (Table 2). In the
1990s the support price was fixed at 6 pesos/kg, raised in the late 1990s to 10 pesos/kg, again
fixed until 2006.
Table 2: NFA palay basic support price and wholesale and retail price of rice to
consumers, 1990-2014, in pesos/kg
Year
NFA
Support
Price
NFA Selling Price of Rice
Wholesale price,
well-milled rice
Wholesale
price, regular
milled rice
Retail price,
well-milled
rice
Retail price,
regular milled
rice
1990 6.00 6.50 6.50 7.00 7.00
1991 6.00 8.00 7.00 8.65 8.40
1992 6.00 8.50 7.75 9.15 8.40
1993 6.00 9.50 - 10.25 -
1994 6.00 9.50 - 10.25 -
1995 6.00 9.50 - 10.25 -
1996 8.00 14.00 13.00 15.00 14.00
1997 8.00 14.00 13.00 15.00 14.00
1998 8.00 14.00 13.00 15.00 14.00
1999 9.00 14.00 13.00 15.00 14.00
2000 10.00 14.00 13.00 15.00 14.00
2001 10.00 16.00 15.00 18.00 16.00
2002 10.00 16.00 15.00 18.00 16.00
2003 10.00 16.00 15.00 18.00 16.00
2004 10.00 16.00 15.00 18.00 16.00
2005 10.00 17.00 15.00 18.50 16.00
2006 10.00 17.00 15.00 18.00 16.00
0.0
1.0
2.0
3.0
4.0
5.0
6.0
0
100,000
200,000
300,000
400,000
500,000
600,000
700,000
800,000
2000 2005 2010
Share in total production (%) Procurement (tons)
24
Year
NFA
Support
Price
NFA Selling Price of Rice
Wholesale price,
well-milled rice
Wholesale
price, regular
milled rice
Retail price,
well-milled
rice
Retail price,
regular milled
rice
2007 11.00 17.00 15.00 18.00 16.00
2008 17.00 28.00 23.50 30.00 25.00
2009 17.00 28.00 23.50 30.00 25.00
2010 17.00 26.00 23.00 28.00 25.00
2011 17.00 26.00 25.00 28.00 27.00
2012 17.00 26.00 25.00 28.00 27.00
2013 17.00 30.00 25.00 32.00 27.00
2014 17.00 30.00 25.00 32.00 27.00
(-) No Regular Milled rice in CY 1993, 1994, and 1995
Source: NFA
The sharpest adjustment came in 2008 when the support price was raised to P17 /kg, where it
has been held since. SEPO (2010) states that NFA's support price is determined from the
analysis of the Rice Inter-Agency Committee (IAC), which then recommends to the Secretary
of Agriculture the procurement price. Likewise the NFA Management makes a
recommendation to the NFA Council. Upon recommendation of the Agriculture Secretary
and NFA Council, the President makes a final decision on procurement price. In 2008 the
President ordered the NFA to increase its procurement price to P17 /kg amid the crisis in the
world price of rice.
The procurement price of NFA together with its financial health determines its ability to
compete with private traders for palay stocks. In the 1990s, the support price was
approximately at parity with farm gate prices (P5.90 /kg in 1991 – 1995, and P8.30 /kg in
1996 – 2000). This condition would hold until the mid – 2000s (average of P9.46 /kg in 2001
– 2005); however in 2005 the farm gate price hit P10.76 /kg. During this period the NFA was
also experiencing financial difficulties as it was perennially in cash deficit, which was
partially addressed by increases in national government subsidies starting from 2005
(Cororaton, 2011). In 2008 the high support price allowed NFA to increase its procurement
again, up to a maximum of 4 per cent of domestic output; in 2013 – 2014 farm gate prices
have been striking the P20 /kg level and above, again eroding competitiveness of NFA
procurement.
Even as domestic production is growing, the increase in consumption has outpaced the
growth in supply, leading to a growth in imports. In 1994, domestic production of milled
rice was 6.8 million tons, with nearly identical quantity of domestic utilisation (figure 5).

25
Figure 5: Milled rice output, utilisation, and imports, 1994 - 2011
Source: BAS CountryStat.
By 2010 domestic production reached 10.9 million tons, while domestic utilisation reached
12.4 million tons. In the long run the gap between production and utilisation (supply and
demand) must be bridged by imports, which have increased from an average of 0.4 million
tons (1994 – 1996) to 1.6 million tons (2009 – 2011). This highlights the increasing
importance of foreign supply in meeting domestic demand since the 1990s.
The domestic price on average has been higher than the world price. Despite growing
importance of imports, the domestic price of rice has been consistently above the border
price. In figure 6 the domestic price of rice is proxied by the national average wholesale price
of well-milled rice; the border price is proxied by the landed price of Thai white rice 5 per
cent broken, converted to peso using the market exchange rate.
The average nominal protection rate (the difference between the border price and comparable
domestic price as a share in the border price) is 45 per cent. The world rice price crisis of
2008 narrowed the gap between domestic and border prices; however since then the
difference has reappeared.
As discussed earlier, difference in marketing cost accounts for part of the difference.
However, this is only a minor part; in 2002, between Thailand and the Philippines, the
difference in mark-up from paddy to wholesale (in paddy equivalent) is six percent, and mill
gate to wholesale is 17 per cent. (Dawe et al, 2008). However the difference in paddy price
is about 66 per cent. Price of paddy rice is much higher in the Philippines due to higher
production cost (Cabling and Dawe, 2007). Again, restrictions in imports allow domestic
production to expand, causing an increase in domestic price to incentive farmers to bear the
increasing marginal production cost.
0
500
1,000
1,500
2,000
2,500
3,000
0
2,000
4,000
6,000
8,000
10,000
12,000
14,000
1994 1999 2004 2009
Imports Production Utilization

26
Figure 6: Monthly border and wholesale prices of rice, 1990 - 2011
Source: BAS CountryStat.
NFA manages to stabilise retail prices, but keeps domestic prices high by means of an
import monopoly. The NFA maintains a buffer stock of about 15 days‘ worth of national
consumption at any one time, with a required inventory of 30 days on July 1 of every year.
Rice milling is outsourced; the NFA does sell milled rice under its distribution program. NFA
rice currently sells at P26 – 28 /kg through accredited retailers; compare this with prevailing
retail prices of about P32 – 36 per kg. In 2010 to 2013, NFA rice distribution averaged 1.1
million tons of milled rice per year (figure 7). During the first half of 2013, the volume of rice
distribution was the lowest among the years being compared in figure 6, but it increased
toward the latter part of the year.
Umali and Duff (1992) had shown that government intervention in the 1970s had kept
consumer prices low, putting the pressure on farm gate prices; however due to insufficient
resources and an unrealistically low floor price, government was unable to defend paddy
prices. Market integration improved after 1983, after government reduced its role in the
market. More recently Yao et al (2007), using regression analysis, show that the NFA exerts
only a mild influence on farm gate and retail prices at the national level, and exerts
significant influence in only a few regions. Intal et al (2012), using a different regression
model, on the other hand show that NFA distribution is able to contribute to price stability at
the retail level. However, they confirm that NFA procurement was unable to stabilise farm
gate prices. The reason is that NFA procurement accounts for only a small percentage of
paddy production; but is a much bigger share of distribution.
However while NFA has managed to stabilise (to some extent) consumer prices, its charter
grants it an import monopoly. This starkly anti-competitive policy is responsible for keeping
domestic prices above the world price. The monopoly is administered according to an annual
import quota. The import quota is decided by the NFA Council, the governing body of the
0
5
10
15
20
25
30
35
40
45
Border Price of Thai White Rice 5% broken (peso/kg)
Wholesale Price of Well Milled Rice (peso/kg)

27
Authority, which is chaired by the Secretary of Agriculture. The quota is decided upon
recommendation of an Inter-Agency Committee on Rice and Corn, which evaluates the
supply and demand situation to determine the country's import requirement.
Figure 7: NFA total rice distribution, by month, Philippines (2010-2013)
Source: NFA
In the 2000s the implicit protection rate averaged 45 per cent (Briones and Parel, 2011).
Partial equilibrium analysis by Roumasset (2000; cited in Cororaton (2005), estimates the
excess burden of NFA operations (including its import monopoly) at P49bn. Cororaton and
Cockburn (2006) extend this analysis using general equilibrium analysis and find that a shift
from the import monopoly to free trade has a net effect of reducing poverty, through a
reduction in consumer price, despite the accompanying reduction in producer price.
Controversy over NFA operations has led to frequent leadership changes. In 2013, the NFA
administrator was replaced and the NFA transferred from Department of Agriculture to the
Office of the President. As there has been no change in NFA functions and policies, the
current administration clearly perceives the problem as mainly procedural or operational (i.e.
failure to store and release stocks, failure to distribute rice, failure to apply audit and other
controls on the use of funds, failures in procurement, etc.) rather than policy-related.
Potential Impact of Competition Reforms in the Domestic Rice Market
To assess the relevance of competition reform in the staple food sector, the study adopted the
rapid appraisal method based on interviews of key informants. Informants were selected from
each of the nodes of the Metro Manila value chain, beginning at retail market in Manila,
tracing it back to the biggest rice-producing province in the country, Central Luzon, 3 hours
north of Manila by car. Interviews were conducted for consumers and retailers (in Metro
Manila), a wholesaler and rice mill in Greater Manila (Metro Manila and periphery), the
National Food Authority, as well as rice miller, wholesaler, palay trader, and farmers in
Central Luzon.
28
As discussed earlier, the review of literature indicates the key competition distortion in the
staple foods sector is the statutory import monopoly of NFA. The study developed a model
for economic surplus analysis, called the Total Welfare Impact Simulator for Trade (TWIST).
The model is derived from the Welfare Impact Simulator for Evaluating Research (WISER),
described in Briones and Galang (2012). It follows the same framework in Roumasset (2000)
and runs in General Algebraic Modeling System (GAMS). Equations and GAMS code are
shown in the annexure.
Two scenarios are examined: first is free trade; the second is an increase in the import quota.
Free trade is the limiting case of competition reform in international trade; this is
implemented in TWIST by setting the wholesale price equal to the border price. Meanwhile
the import quota scenario maintains the current policy but implements it more flexibly, i.e.
avoiding the more onerous protectionism incurred by self-sufficiency targeting.
The limitation of the economic surplus model is that analysis is restricted to a single market
layer; the supply chain is kept in the background (i.e. as a set of fixed marketing margins).
However, without performing the numerical computation, we may surmise the following
directions of change: reducing the level of protection would lead to reduction in domestic
price at all layers (farm gate, wholesale, retail); reduced domestic production and related
inputs (hiring of labour, purchase of fertiliser, deployment of farm equipment, etc.); and
increased domestic consumption.
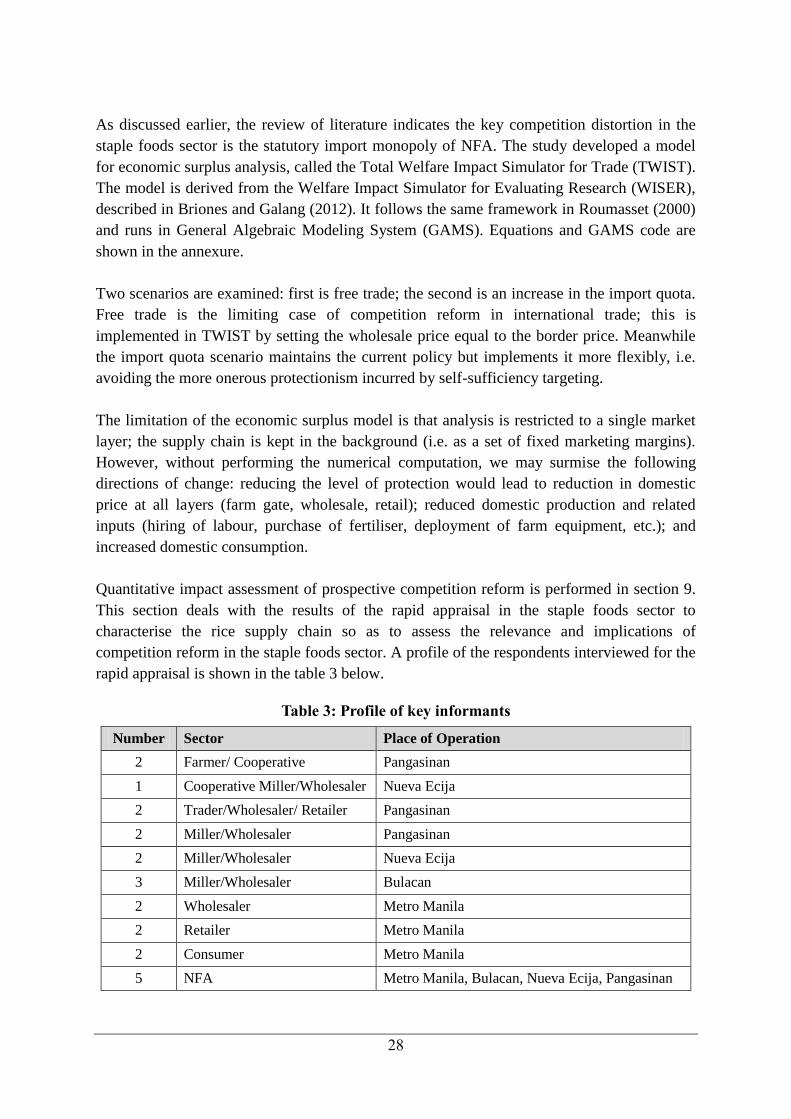
Quantitative impact assessment of prospective competition reform is performed in section 9.
This section deals with the results of the rapid appraisal in the staple foods sector to
characterise the rice supply chain so as to assess the relevance and implications of
competition reform in the staple foods sector. A profile of the respondents interviewed for the
rapid appraisal is shown in the table 3 below.
Table 3: Profile of key informants
Number Sector Place of Operation
2 Farmer/ Cooperative Pangasinan
1 Cooperative Miller/Wholesaler Nueva Ecija
2 Trader/Wholesaler/ Retailer Pangasinan
2 Miller/Wholesaler Pangasinan
2 Miller/Wholesaler Nueva Ecija
3 Miller/Wholesaler Bulacan
2 Wholesaler Metro Manila
2 Retailer Metro Manila
2 Consumer Metro Manila
5 NFA Metro Manila, Bulacan, Nueva Ecija, Pangasinan

29
Most of the rice sold in Metro Manila comes from paddy produced in Pangasinan, Nueva
Ecija, Isabela, Cagayan, Tarlac, Pampanga and Bulacan (regions 1, 2 and 3). Region 4
typically supplies the south; i.e. Davao, General Santos, Cebu and Leyte, because access to
shipping facilities makes doing so more lucrative compared to competing in Metro Manila.
Region 5 is typically rice-deficit and also gets rice from Region 4. There have been reported
cases of rice coming from Cebu into Metro Manila but industry analysts think that this is
possibly rice smuggled from outside the country.
Farmers typically sell dry paddy on pavements under the sun to (a) paddy traders who set up
buying stations in the farming communities, (b) millers who buy through independent agents
that operate in the area, and (c) cooperatives which trade for their members. Some
cooperatives and mills also have mechanical dryers but these are viewed as mainly for
emergency use during the storm season because solar drying is definitely more efficient.
Farmers may also sell to NFA (though as shown earlier, NFA accounts for only a small share
of paddy output). A farmer or a farmer cooperative can sell to the NFA upon acquiring a
passbook to log transactions. The passbook can be obtained by filing the necessary
paperwork, i.e. for individual farmers, a certificate of land title, and certificate of farmer
status issued by the Department of Agriculture. Farmers with passbooks simply bring their
paddy to the nearest NFA buying station. The NFA then inspects, weighs, and values the
stock, and makes payment. However some studies have shown that the average farmer is
discouraged from selling to NFA owing to the paperwork (i.e. securing the passbook),
stringent requirements for moisture content and quality, and even promptness in making cash
payment (SEPO, 2010).
Traders who do not have mills also sell the paddy to millers or pay to have these milled and
then sell the rice to wholesalers or retailers. Traders interviewed in Pangasinan have the
paddy milled in nearby mills and sell the rice directly to consumers and to other retailers in
surrounding municipalities although one brings some paddy to a miller/wholesaler in
Bulacan. Traders generally put up buying stations and have stores to transact business but no
significant warehouses.
Millers have warehouses where paddy and rice can be stored. Paddy stocks store longer and
are thus intended for future sales while milling is done in anticipation of rice being sold in a
few days. The big mills/warehouses, with capacity to store paddy longer, are reported to be
in Nueva Ecija and Isabela while Pangasinan and other Luzon provinces generally have small
to medium sized mills/warehouses. Millers interviewed in Pangasinan and Nueva Ecija buy
directly from farmers, picking up the produce after volume and price agreements are made
through their own or independent agents and profess going out of their province, notably to
Tarlac and Isabela, in search of paddy. They also buy from paddy traders who deliver to
their mills and likewise mill for traders. They eventually sell the rice to wholesalers in
Pampanga, Metro Manila, Cavite, Laguna and Rizal with one miller in Nueva Ecija shipping
to Cebu and Cagayan de Oro.

30
In 2012, the NFA price exceeded the trader's price (P17 /kg for NFA, compared to P14.35 to
P16.22 /kg for traders). By 2013 traders had matched or exceeded the fixed NFA price
(paying P16.93 to P17.79 /kg). In 2014, the fixed NFA price was consistently below the
private trader's price, which was hitting P20 /kg by March-April).
Bulacan hosts small millers/wholesalers, many in Intercity, an industrial estate where about
125 small rice mills do brisk 24-hour business buying and milling paddy and essentially
acting as rice staging area for wholesalers and retailers in Manila. This privately-developed
property in Bocaue is strategically located and, due to the number of adjacent independent
mills/warehouses competing for the business, is known to offer very competitive prices to
paddy traders and rice buyers as well as traders in need of milling services. Those who go to
Intercity are described as ―guerilla type‖ traders – they are not as established and they do not
deal in big volumes. An NFA official estimates that some 70 to 80 per cent of rice going
through Intercity get distributed in Metro Manila and Southern Tagalog. The rest may go to
Visayas. Another private property near in Bulacan, the Golden City, is currently being
developed for the same purpose and now hosts around 15 small mills/warehouses.
Wholesalers, mostly supplying retailers in the wet markets, normally maintain stocks good
only for 2-3 days in Metro Manila warehouses. The stock is refilled regularly from own or
contact mills/warehouses outside Manila which usually stock paddy enough for three months.
Retailers in Manila get stocks from wholesalers, mostly once or twice a week. Some pool
together requirements and buy the pooled requirements from Intercity. Retailers are present,
often more than one, in all the markets in Manila as well as in community commercial areas.
Degree of Competition
The interviews revealed very strong competition among the current players in practically all
levels of the supply chain, at least among the places visited. At the farm level, interviewees
report that farmers have a choice of buyers located within their communities due to the
presence of a number of buying stations and agents competing for the product. Thus, farmers
easily get the highest price for paddy, especially now that supply is tight. Some farmers still
get production and/or harvesting loans from traders but these traders are forced to give them
the highest price come harvest time rather than lose out to another buyer and risk not being
able to collect the loan. One trader says, ―What is giving up a few centavos per kilo paddy
compared to losing the loan amount due to non-payment?‖
Competition in the paddy production centers increases further as agents, who get 10 centavos
per kilo of paddy sold with their referral, prefer to be independent. These agents normally ask
around for the highest offer from trader and mill contacts not present in the community but
ready to pick up the produce once a transaction is agreed on. They strive to get the highest
price for the producers because their business sustainability relies on their reputation of
ability to get the best deals. Farmer members of trading cooperatives add to the competition
as they also actively solicit business for their organisation in consideration of patronage
rebates.

31
Mills that buy paddy and sell rice earn through volume traded because competition keeps
margins low at about P30 – P50 per 50 kilo sack of rice traded. They need to price at
prevailing market levels when they buy and sell because a difference of 5 centavos per kilo
paddy or P10 per sack of rice will send customers to the next buyer/mill/seller.
Millers also learn to be very flexible to maximise the use of their facilities and recoup
investments, operating expenses and interest on loans. To get supplies, they buy both from
traders delivering to their mill and directly from producers through their own buying stations
and independent agents in the farming communities. While they generally buy the paddy they
store and mill, they also offer milling services at P60 per sack for those who do not want to
sell their paddy and prefer to trade rice. Some mills also have mechanical dryers which
paddy suppliers can use for a fee but, if the sun permits, they also use their yards as no-cost
drying pavements just to hold on to customers who face difficulty in drying paddy. As noted
above, mechanical dryers are not a good investment, requiring fuel and, for the flatbed drier,
manual shifting, while any pavement under the sun dries paddy faster at no cost.
A farmer interviewed narrates how he delivered his wet paddy to the mill to dry during some
rainy season but the mechanical dryer had a queue. While waiting, the sun shone so he asked
the miller if he could just spread out his paddy in the miller‘s yard to which the miller agreed
as long as the farmer did his own shifting. He did and sold his dried paddy to the mill before
those in the dryer queue did. One miller says that he lowers his rice selling price to
accommodate regular wholesale customers who haggle because he figures that he already
earned in drying and milling, and even when he did not, he earns goodwill.
In Intercity, where warehouses are smaller, the rate of stock turn-over is the key to earnings.
They are very conscious of prevailing prices because very small differences in price offerings
matter where more than 100 mills exist side by side. Buyers and sellers normally go through
agents who stand at the Intercity‘s two gates. These agents are independent of the mills and
generally point the buyer or seller to the mill currently offering the highest prices or having
the stocks or space.
An Intercity miller interviewed competes for buyers by ensuring that he has some minimum
amount of stocks for each of the varieties or qualities of rice. He notes that retailers have
boxes of different rice qualities and prices offered to consumers. Since most of those who go
to Intercity are the small and less established traders, they are likely to need the various
varieties when they buy. To better categorise and improve the quality of his stocks, he
invested in additional equipment like colour sorter and polisher.
To compete in niche markets that prefer premium quality rice, like restaurants, corporate and
other institutional accounts, millers/wholesalers invest in mechanical weighing and packaging
equipment. They brand their products and produce smaller packs of 5, 10 and 25 kilos for
retail in supermarkets. One miller infuses his rice with plant-based fragrances like vanilla
and pandan to enhance aroma. At the input end, they maintain a ―suki‖ relationship with
trusted sources in areas known to produce good quality paddy and buy at higher prices to

32
encourage farmers to invest in good production inputs. They buy everything the ―suki‖ sells
even if the crop quality does not meet the quality standard in order to maintain goodwill. On
the other hand, institutional buyers do not offer term contracts; instead they issue purchase
orders, some over a duration of three months, with prices following prevailing trends.
Rice wholesalers who cater to retailers in Manila also rely on volume for profits and maintain
low margins of P20 - 30 per sack to compete. They offer payment terms of 15 to 30 days to
maintain regular clients.
The retailers compete by offering variety and convenience. Many make available different
types of rice in terms of quality and price so that there is something suitable for every
shopping budget. Also, rice is only one among a variety of products these retailers sell. In
fact, rice retailers are usually market variety stores or neighbourhood convenience stores,
including supermarkets. Market and neighbourhood stores show rice offerings in boxes
representing different prices and qualities from where rice is weighed and packed according
to the customer‘s order while supermarkets sell different brands and varieties of rice in 5, 10
and 25 kilo clear packs. Retailers generally price according to the price they buy the rice plus
a margin of about P100 per sack. They can give discounts of up to P20 to those who buy 25
or 50 kilo sacks.
Majority of those interviewed say that they follow prevailing prices. Many paddy buyers i.e.
traders and millers source price information from rice buyers, especially big established
wholesalers around Metro Manila as well as in fast markets like Intercity. Then they work
backwards, imputing their costs to arrive at their maximum paddy buying prices. They work
out actual buying prices considering competition and supply conditions in their area.
Table 4 provides a breakdown of cost and margins in the rice marketing chain. Paddy during
the time of the appraisal cost P18-20 /kg or P900 – 1,000 per sack. According to official data,
farmers earned a net margin of P106 per sack in 2012. Milling costs are P60 /kg and milling
recovery (rice produced from paddy) ranges from 60 to 65 per cent. Using 60 per cent
recovery the cost of rice ex-mill is about P1,716 /sack. Transport costs of P70.00 /sack bring
the rice cost ex-Manila at P1,786 /sack. A miller explains that the cost difference between
low quality vs medium quality and medium quality vs high quality rice is P200 /sack. This
means that low quality rice will cost around P1,586 /sack, medium quality will be around
P1,786 /sack, while high quality rice will be around P1,986/sack in Manila excluding all the
margins.

33
Table 4: Estimated costs and prices of rice, Metro Manila, in pesos per sack
Ex-Manila cost (medium quality)
Cost
% of
total
Palay price 1,000.00 92.7
Milling cost 60.00 3.4
Cost ex-mill 1,716.25
Transport cost 70.00 3.9
Total 1,786.25 100.0
Cost in Manila
Low Medium High Small packs
Price (pesos/sack) Cost
% of
total Cost
% of
total Cost
% of
total Cost
% of
total
Ex-Manila cost 1,586.25 89.8 1,786.25 90.8 1,986.25 91.7 2,186.25 88.6
Repacking
100.00 4.1
Margins
Trader's 20.00 1.1 20.00 1.0 20.00 0.9 20.00 0.8
Miller's 40.00 2.3 40.00 2.0 40.00 1.8 40.00 1.6
Wholesaler's 20.00 1.1 20.00 1.0 20.00 0.9 20.00 0.8
Retailer's 100.00 5.7 100.00 5.1 100.00 4.6 100.00 4.1
Total cost 1,766.25 100.0 1,966.25 100.0 2,166.25 100.0 2,466.25 100.0
Retail price
(pesos/kg) 35.33
39.33
43.33
49.33
Note: The milling recovery is 60.38 per cent; one sack = 50 kg.
Source: Authors' data (derived from the Rapid Appraisal Surveys conducted under the project)
An interviewed Metro Manila retailer says that their average margin is P100 /sack while the
interviews with traders, millers and wholesalers suggest that their margins per sack, including
storage costs, are about P20 for the trader, P40 for the miller and P20 for the wholesaler, or
P80 cumulative up to the wholesaler and P100 for the retailer. Note that these are all dwarfed
by the gross margin at the farm level, which reaches P584 per sack based on Philippines
Statistics Authority – Bureau of Agricultural Statistics (PSA – BAS) cost and returns data.
Adding these to the costs, the computation places the price of rice in Metro Manila at about
P35 /kg for low quality, P39 /kg for medium quality and P43 /kg for high quality, which are
very near to what we are seeing now in the markets. Rice packed in smaller volumes is higher
by P2 /kg (P100 per 50 kilos) when it leaves the mill and with wholesaler and retailer
margins bigger, prices in the supermarkets are, not surprisingly, much higher.
Barriers to Entry
The interviewees say that entering the market would be easy if you have the capital and the
supply source or the potential market. But the financial requirements are quite substantial. A
10,000 sack warehouse will easily require a minimum of P15mn for working capital for rice

34
alone at P1,500 per sack. Also, like any business, there is a learning curve and the first few
years can prove very risky for a new entrant. In fact, many of the interviewees, despite their
long years of operation, admit to still feeling vulnerable to the following risks: (a) bad
weather severely limiting supplies that further intensify competition especially from the big
players; (b) unplanned or hastily-decided imports and uncontrolled smuggling that make
huge volumes of low-cost rice available after they bought stocks or sold on credit at higher
prices; and (c) swindlers who get your trust through regular good orders but disappear once
you give them credit. For the last reason, more than a few millers/wholesalers interviewed
expressed reluctance to enter the Metro Manila market where the norm is for wholesalers to
give 15 or 30-day term credit to retailers and where stories of swindling of those who tried to
enter the market in the past abound.
While the NFA licenses all types of grains businesses from paddy trading, warehousing, and
milling to wholesaling and retailing and registers rice facilities and equipment, further
requiring that licenses and registrations be renewed annually, none of the interviewees had
any issue with the same. For them, the requirements and procedures are clear and easy to
comply with. The documentary requirements are the standard proofs of legitimacy of
business, location and facilities layout plans, proofs of compliance with applicable zoning
and environmental regulations and proof of insurance and guarantee of stocks. Provided the
requirements are complete, the application can be processed and a temporary license can be
issued in 30 minutes.
According to table 5, in 2013, there were a total of 95,000 licensed players in the rice market,
majority of whom are in retail (54,000); next are warehouse operators (1,200). There are over
8,000 rice mills operating all over the country. Even specialised wholesalers number over
3,300. A large number of players (close to 10,000) are wholesalers who also operate a retail
outlet. The number of retailers rose from 1990 to 2000; there may have been consolidation at
the retail level since then. Likewise the number of rice mills has been on the decline since
1990. On the contrary, the number of licensed warehouse operators has been increasing from
1990 to 2010, before declining somewhat until 2013.
After licensing, there is little monitoring of registered businesses outside of processes
involved in the estimation of commercial stocks which NFA does monthly by province or
sub-province; i.e. provincial offices estimate total commercial stocks based on data on stocks
from a sample of millers/warehouses, normally 100 per cent enumeration for big and a small
sample for small players.
Table 5: Total number of applicants per line of activity: Philippines (1990-2013)
Line of Activity 1990 1995 2000 2005 2010 2013
TOTAL 127,038 116,622 123,249 112,319 109,447 94,629
Retail 66,422 63,218 77,193 70,433 66,960 54,032
Wholesale 4,628 4,873 3,614 3,073 3,065 3,314
Retail-wholesale 16,785 14,367 11,457 10,370 10,852 9,936

35
Line of Activity 1990 1995 2000 2005 2010 2013
Mill 12,739 12,324 10,469 9,672 8,383 8,288
Warehouse 8,809 10,679 11,042 10,912 13,130 11,783
Threshing 1,735 1,706 1,116 638 419 370
Shelling 614 553 330 199 125 125
Drying 104 213 473 496 496 645
Manufacture 1,265 488 357 234 209 221
Importing 188 60 165 153 160 95
Exporting 5 6 11 11 8 9
Indenting 29 18 27 15 12 7
Packaging 9 16 35 49 43 35
Transporting 6,103 5,460 5,293 4,815 4,693 4,842
Others 7,603 2.634 1,667 1,249 892 927
Source: NFA (GMOD-MRSD and ISD-IRD).
As for rice storage, as of December 2013, there are 450 NFA warehouses in the Philippines,
which have a total capacity of 30.22 million metric tons of rice (Error! Reference source
not found.). Only 6.33 million metric tons are stored in these warehouses, which is
equivalent to only 20.93 per cent utilisation rate. The NFA data contrasts sharply with PSA-
BAS data, which shows NFA stocks down to just 300,000 tons.
With respect to additional investments, many of the respondents are not keen about investing
more to expand facilities. Some want to upgrade to make their operations more efficient but
the aforementioned risks discourage them. They figure that rice areas are not getting bigger,
the population is growing, and the incidence of adverse weather will be increasing so paddy
supplies will always be tight. Also, the high paddy prices mean the traders and millers need
more working capital to maintain the same level of operations so any additional investments
go to the back burner. Moreover, they feel that the Bureau of Customs will never be able to
control smuggling and smuggled rice, because it is tariff free and undocumented, is difficult
to compete with. In fact, some in the industry would prefer that government allow imports as
long as these are controlled, taxed, properly documented and transparent, because they can
work around this.
Table 21: Summary of warehouse capacity (as of December 31, 2013)
Region Total
Capacity Utilisation
(%) NFA-
owned Leased Total
Philippines 450 25,132,630 5,090,828 30,223,458 20.93
Ilocos Region 31 1,460,500 407,600 1,868,100 6.04
Cagayan valley 53 2,452,650 15,750 2,468,400 5.51
Central Luzon 63 4,166,200 630,500 4,796,700 15.63
Southern Tagalog 59 1,811,600 809,050 2,620,650 30.53

36
Region Total
Capacity Utilisation
(%) NFA-
owned Leased Total
Bicol Region 41 872,076 931,298 1,803,374 25.23
Western Visayas 25 1,669,850 291,918 1,961,768 11.35
Central Visayas 15 968,500 235,000 1,203,500 45.68
Eastern Visayas 23 979,500 200,000 1,179,500 28.66
Western Mindanao 19 1,355,000 0 1,355,000 13.61
Northern Mindanao 20 1,965,000 7,712 1,972,712 33.14
Southern Mindanao 24 1,360,550 289,000 1,649,550 32.01
Central Mindanao 29 2,278,470 0 2,278,470 6.40
NCR 23 2,664,734 893,000 3,557,734 30.81
ARMM 11 273,000 290,000 563,000 13.35
Carag 14 855,000 90,000 945,000 29.45
Source: NFA
Substitute Products
Consumers buy rice according to ability to pay, but if the budget permits, they prefer rice that
is white, has few brokers, and is fragrant. This is why those interviewed say that they will not
buy the cheaper NFA rice, which they believe is of poor quality. The retailers say that the
most demanded varieties are those of the medium-price range. Among the discriminating,
one of the most preferred varieties is the high-priced dinorado known for being aromatic and
slightly sticky.
Interviewed consumers claim that they will continue to consume the same amount of rice
even though rice prices increase because available substitutes like bread and pasta are still
more costly. They eat bread or pasta for convenience and variety of fare. They will cope with
rice price increases by choosing what they feel is the best rice variety they can afford instead
of the variety they really prefer. It is however accepted that instant noodles substitute for rice
among the poor because of affordability and because of convenience for other income
classes.
Interviewed consumers also say that they change rice varieties or the stores they buy from
when they sense that the rice they get is not as they expected. Because stores present rice in
boxes, one really does not know what one gets even if the retailers place the variety common
names beside the prices to identify the contents of the boxes. It is widely known that not a
few retailers or wholesalers - each one pointing to the other - mix poor quality stocks with
higher quality rice just to move the former or to moderate prices for the latter. Thus a
consumer may buy dinorado rice but actually get only 75 per cent dinorado rice. The
assurance of quality is another reason why branded packed rice in supermarkets is priced
much higher. In this regard, product labeling regulations on rice need to be better enforced
while consumer awareness of rice quality standards need to be enhanced.

37
Anti-competitive Behaviour
Given the number of layers in the chain and the apparent number and variety of players in
each level, it is difficult to imagine how one or a group of market players would be able to
influence market directions to their advantage. In fact the cost estimates and prices show no
substantial margins as these are apparently limited to 2 per cent or less of raw materials up to
the wholesale level and 5 per cent at the Metro Manila retailer level. Interviewees
consistently say that the competition is really stiff, especially with tight paddy supplies, a
situation especially pronounced at the time of the interviews which were done following the
end of the rice lean season (July to September) and around the occurrence in October of a
typhoon that destroyed crops ready to be harvested in Nueva Ecija, the biggest rice producer
in the country.
However, some respondents do not discount that a group may be able to control certain
markets in certain situations. That the Philippines is an archipelago, there is lack of sufficient
infrastructure and rice production is seasonal make possible circumstances in which certain
groups are able to control the market. However given the empirical work cited earlier by
Rufino, Reeder, and others, such control must be episodic and transitory, as rice markets are
integrated across space. There may be differences across horizontal segments owing to
transport costs (which can be significant due to the poor state of infrastructure in the
countryside); however, accounting for these costs, arbitrage opportunities due to price
differences are generally competed away.
In Metro Manila, it is opined that a group that can control 20 - 30 per cent of commercial
supply, possible in September, may be able to influence price movements. The NFA accounts
for 15 -25 per cent of the retail market during the lean season but the reputation of the
quality of its rice makes it a less preferred product among many buyers, thus limiting its
impact on the commercial sector. However, industry players are quick to point out that some
price increase in September should be expected because palay stocks shrink by 1 - 2 per cent
per month of storage and there are other storage costs incurred. Besides, storing and price
speculation are legitimate business practices. The only issue is how many have the
wherewithal to do so. Also, there is considerable risk in speculation because government
allows some importation during the lean months and it cannot seem to control smuggling.
One wholesaler interviewed notes that the current importation quota distribution rules, where
the importer has to bring in a minimum of 2,000 tons and as much as 5,000 tons, favour big
players thus facilitating cartel-like behaviour. Two thousand tons of rice cost about
US$700,000 or P30.8mn (at US$350 /ton ex Hanoi and P44 per dollar) without freight and
tariff. If the system will allow smaller players to import, say a 10 or 20 ton container load,
the supplies cannot be concentrated in a few big players. In this regard, many of the
interviewees believe that the country will never be able to attain self-sufficiency and thus
support some controlled importation policy. One interviewee points out that controlled and

38
transparent legitimate importation may not disrupt their market operations the way
uncontrolled smuggling does.
To summarise: the rapid appraisal confirms the findings of the literature survey showing a
competitive market structure for domestic rice production and marketing. However bringing
in foreign stocks of rice is highly uncompetitive, being a statutory monopoly of the NFA. As
discussed earlier we propose to analyse introduction of competition in rice importation using
TWIST, in the next section.
Computing Impact of International Market Competition Reform
Economic Surplus Approach
As discussed earlier, the review of literature indicates the key competition distortion in the
staple foods sector is the statutory import monopoly of NFA. The study developed a model
for economic surplus analysis, called the Total Welfare Impact Simulator for Trade (TWIST).
The model is derived from the Welfare Impact Simulator for Evaluating Research (WISER),
described in Briones and Galang (2012). It follows the same framework in Roumasset (2000)
and runs in General Algebraic Modeling System (GAMS). Welfare is measured by
calculating areas of triangles corresponding to producer surplus and consumer surplus, based
on linear supply and demand functions. These functions in turn are calibrated using baseline
data, working backwards from elasticities to function parameters. Equations and GAMS code
are shown in the annexure.
Two scenarios are examined: first is free trade; the second is an increase in the import quota.
Free trade is the limiting case of competition reform in international trade; this is
implemented in TWIST by setting the wholesale price equal to the border price. Meanwhile
the import quota scenario maintains the current policy but implements it more flexibly, i.e.
avoiding the more onerous protectionism incurred by self-sufficiency targeting.
It should be noted that the limitation of the economic surplus model is that analysis is
restricted to a single market layer; the supply chain is kept in the background (i.e. as a set of
fixed marketing margins). However, without performing the numerical computation, we may
surmise the following directions of change: reducing the level of protection would lead to
reduction in domestic price at all layers (farm gate, wholesale, retail); reduced domestic
production and related inputs (hiring of labour, purchase of fertiliser, deployment of farm
equipment, etc.); and increased domestic consumption.
Economic surplus analysis of trade policy reform uses baseline data for 2013, as follows:
Data Remarks
Quantity 11,601 thousand tons
Retail price 33.70 pesos per kg
Wholesale price 31.56 pesos per kg

39
Exchange rate 42.45 pesos per dollar
Quota 404.702 thousand tons
Border price 415.95 Vietnam white rice 5 per cent broken in dollars per ton
Elasticity demand -0.5046
Elasticity supply 0.28
The retail price is 8 per cent higher than in 2011, when the import quota was much less
restricted, at 1 million tons.
The PSA-BAS is the main reference for the production quantity. Under the Supply and
Utilisations Account (SUA), the Net Food Disposable (NFD) is used as the basis for the
supply and demand quantity. BAS defines it as ―the volume of food commodity available in
its original (unprocessed) form for human consumption‖. The same source is used for the
retail-level and wholesale-level prices of rice (pesos per kilo). Other important variables in
the model are import quota and world price. The Philippines has import commitments to the
WTO, which is the Minimum Access Volume (MAV) of 350,000 metric tons annually. The
import quota is solely decided upon by the NFA through the NFA Council, which is headed
by the Secretary of Agriculture. In 2013, 404,702 metric tons of rice was imported, compared
to about one million tons in 2012.
The World Bank‘s Pink Data is used to get the average nominal world price of Vietnamese
rice (5 per cent broken) in dollars, which is considered as the Free -on-board (FOB) price.
This is then converted to its estimated cost-insurance-freight (CIF) equivalent by dividing it
by the computed ratio of FOB to CIF (0.95). The prevailing exchange rate for 2013 is
adopted to transform the price from dollars to pesos.
Anothe r important assumption made under the baseline case is the elasticities of supply and
demand. The demand elasticity and supply elasticity are lifted from the study of Lantican et
al. (2011) and of Edillon (2004), respectively. The primary runs correspond to the last
column for demand elasticity of -0.5. The first two columns shown runs for sensitivity
analysis using elasticity values of -0.25 and -0.75.
Results
Baseline run. Results are shown in table 7. The main set of estimates are found in the first
column (under elasticity = -0.50). The monetary equivalent of the benefits enjoyed by
consumers in 2013 amounted to P387, 389.72mn. On the other hand, producers enjoyed only
P49,469.72mn. Importers gained P5,626.54mn from the rice market. Overall, the total
economic surplus amounted to P442,485.98mn.
Alternative scenario 1: free trade. If quantitative restrictions were eliminated and rice
imports were allowed to freely come in the country, total rice imports would have reached
4.20 million ton. Such high level of imports would have brought down the retail price of rice
to P19.80/kg and P17.66/kg at the wholesale level. Clearly, consumers would have benefited

40
from free trade given the low market price of rice. Consumer surplus would have increased
by P178,075.65mn. However, this would have led to a P33,985.01mn reduction in producer
surplus. In totality, the economy would have benefited by as much as P 138,464.10mn above
the baseline.
Alternative scenario 2: Increase in import quota. If the import quota were increased from
404,702 ton to 1,000,000 ton, prices would have fallen. At the retail level, price of rice would
have decreased from P33.70/kg to P31.52/kg. At the wholesale level, price would have
dropped by P2.18/kg. In terms of welfare, consumer surplus would have increased by P25,
706.18mn. Conversely, producer surplus would have decreased by P6,598.97 mn. The overall
impact of such reduction in the import quota would have been a P25, 203.32mn increase over
the baseline.
Table 7: Results of TWIST
Elasticity of demand
-0.50 -0.25 -0.75
Baseline
Imports
Retail price (P/kg)
Welfare measures (P millions)
Consumer surplus
Producer surplus
Importers revenue
Economic surplus
404,702
33.70
387,390
49,470
5,627
442,486
404,702
33.70
781,907
49,470
5,627
837,004
404,702
33.70
260,636
49,470
5,627
315,732
Changes from baseline
Free trade
Imports
Retail price (P/kg)
Welfare measures (P millions)
Consumer surplus
Producer surplus
Importers revenue
Economic surplus
3,796,035
-13.90
178,076
-33,985
-5,627
138,464
2,577,522
-13.90
169,605
-33,985
-5,627
129,994
4,970,516
-13.90
186,240
-33,985
-5,627
146,628
Increased quota
Imports
Retail price (P/kg)
Welfare measures (P millions)
Consumer surplus
Producer surplus
Importers revenue
Economic surplus
595,298
-2.18
25,706
-6,599
6,096
25,203
595,298
-3.21
37,694
-9,554
5,065
33,205
595,298
-1.67
19,675
-5,082
6,611
21,204
Source: Authors' calculation.

41
Finally, the runs for sensitivity analysis in table 7 (under elasticity headings -0.25 and -0.75)
indicate the same pattern of results. Compared to the primary run, lower elasticity of demand
than in the primary run leads to a smaller gain for the economy under free trade, owing to a
smaller gain from consumer surplus. Meanwhile the gains from increased quota are greater
mostly due to a greater gain from consumer surplus. On the other hand, higher elasticity of
demand leads to a greater gain to the economy under free trade compared to the primary run,
due to a greater increase in consumer surplus. Meanwhile the gains from increased quota are
smaller compared to the primary run.
Again, these gains arise because restrictive import policies permit domestic prices to rise
above world prices. Based on standard theory, the high domestic price does indeed raise the
producer surplus (compared to the surplus under free trade price). However note that this is
not the same as "monopoly profit" as higher surplus co-exists with price-taking behaviour of
producers and traders in the domestic market. The higher producer surplus arises simply from
the higher price to all units of output, whereas the higher price is needed to pay for the
marginal cost of the last unit of output produced. Obviously, with repeal or relaxation of
these restrictions, producer surplus must fall, to the detriment of farmers, as clearly indicated
in table 21. One way to ease the burden of adjustment is to apply a moderate level of tariff,
thereby striking a compromise between the benefits to consumers and the losses to producers.
Key Findings
Consistent with previous studies done on the rice supply chain, the rapid appraisal finds that
the paddy and rice supply chain is multi-layered with many competing players in each layer.
At the farm level, farmers have a choice of buyers competing in their communities—traders
have buying stations, independent agents match producers with millers with the best prices
for a fee, and members of trading cooperatives actively solicit business for their organization
in consideration of patronage rebates. To get supplies, mills use competitive pricing. Entry
into the rice business is easy if capital, supply source, and potential market are available.
NFA licensing and registration requirements are not an issue.
With the many layers in the rice supply chain and the apparent number and variety of players
in each level, it is difficult to imagine how one group of market players could influence
market directions to their advantage. NFA data shows the existence of an ample number of
market players. Moreover, the cost estimates and prices show no substantial margins as these
are apparently limited to 2 per cent or less of the cost of raw materials up to the wholesale
level and 5 per cent at the Metro Manila retail level. Interviewees consistently say that the
competition is really stiff, especially with tight paddy supplies, a situation that was
pronounced at the time of the interviews.
In one aspect though competition is seriously curtailed, that is, entry into the import business.
The NFA maintains a statutory monopoly; in conjunction with a self-sufficiency target, this
has led to a declining import quota and an intensifying protection of domestic producers. Rice

42
importation policies need to be rational and effective in protecting not only the interests of
producers but also consumers and other market participants. Huge differences in the costs of
bringing in imports and moving domestic supplies to consumers makes smuggling lucrative.
Moreover, according to the key informants, quantitative restrictions on imports as
exemplified by NFA‘s regulations allow the concentration of legally imported supplies in the
hands of a few.
Through the use of a simulation model called the TWIST, both the consumer and producer
welfare were computed under varying degrees of import controls. Actual and counter-factual
scenarios were developed for the 2013 rice market using TWIST. Analysis indicates that if
quantitative restrictions were eliminated and rice imports were allowed to freely enter the
country, total rice imports would have reached 4.20 million tons, a tenfold increase over
actual imports. Such high level of imports would have brought down the retail price of rice to
P19.80 /kg from P33.08 /kg, and the wholesale price down to P17.66 /kg from P30.04 /kg.
Clearly, consumers would have benefited from free trade given the low market price of rice.
Consumer surplus would have increased by P 178,075.65mn. However, this would have led
to a P33,985.01mn reduction in producer surplus. In total, the economy would have benefited
by as much as P138,464.10mn.
If instead the import quota were maintained at the previous year's level of 1,000,000 tons,
prices would have fallen. At the retail level, price of rice would have decreased from P33.70
/kg to P31.52 /kg. At the wholesale level, price would have dropped by P2.18 /kg. Consumer
surplus will increase by P25,706.18mn; however, producer surplus will decrease by
P6,598.97mn. The overall impact would have been a P25,203.32mn increase in economic
surplus.

43
4. Competition Reforms in Bus Transport Sector and Implication on Beneficiaries
Among the road-based transportation options, buses offer more in terms of affordability and
efficiency as they carry more people using less road space. With inadequate mass transport
infrastructure in most urban centers, buses become an indispensable alternative for the
commuting public. The welfare impacts of competition and other regulatory reforms for
public conveyance, particularly for the bus transport sector, must be viewed within the
context of the carrying capacity of road infrastructure, economic and social activities in
covered areas, optimal vehicular flows including the number of buses and other public utility
vehicles (PUVs), and private vehicles. This section provides a diagnostic report on the
regulatory and industry issues affecting the operation of buses in the country.
Reforms Undertaken in the Bus Transport Sector Over Time
Major reforms in bus transport regulation were carried out in the early 1990s. In the mid-
70s, bus operation in Metro Manila was provided by four private consortia and the Metro
Manila Transit Corporation, a public-owned bus operator. The government gradually allowed
the formation of more consortia with a minimum of 100 buses each. By late 1970s, 14
companies were operating with at least 100 units each. Although liberalisation policies and
principles have been attempted over the past three decades, the sector‘s policy backdrop
remains dominantly conservative and regulated.
Department Order No. 92-587 (1992) formalised the liberalisation policies by providing a set
of rules for entry and exit as well as fare-setting, namely:
Entry and Exit – the control of entry and exit out of the industry is liberalised to introduce
or enhance the level of competition in fares and quality of service. Each route is required
to have a minimum of 2 operators. An operator who develops a new route will be allowed
a maximum of 2 years to operate solely, after which the route will be opened to at least
one additional operator. A new entrant will be allowed to operate in an existing route if
the entrant satisfies any of the following conditions:
1) the new operator is able to provide a more efficient/cost-effective service than
existing operators;
2) the new operator introduces quality or service improvements and/or
innovative/technologically-advanced services;
3) the route warrants additional capacity;
4) practice of existing operators result in lack of competition;
5) the existing operators has ceased operation;
6) the existing operator/s have violated the terms of their franchise rules and regulations.
Franchise Terms- a Certificate of Public Convenience (CPC) or franchise describes the
route and service area and is valid for five years and can be renewed up to three times.
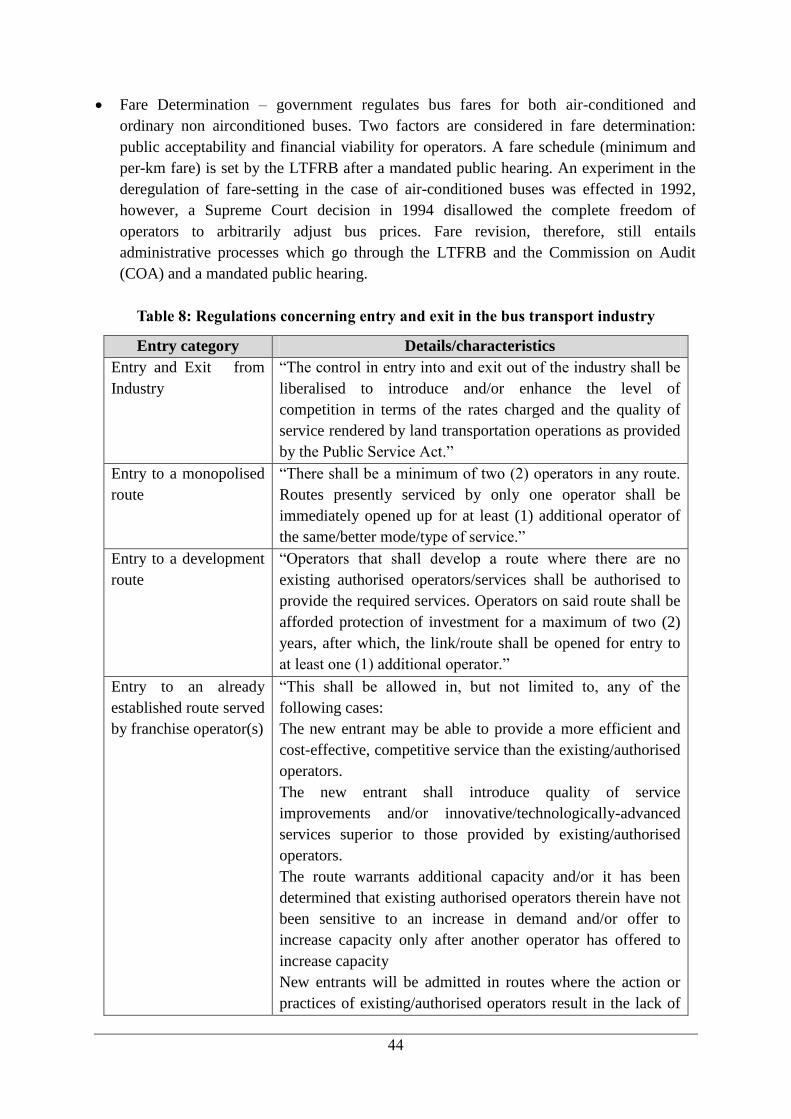
44
Fare Determination – government regulates bus fares for both air-conditioned and
ordinary non airconditioned buses. Two factors are considered in fare determination:
public acceptability and financial viability for operators. A fare schedule (minimum and
per-km fare) is set by the LTFRB after a mandated public hearing. An experiment in the
deregulation of fare-setting in the case of air-conditioned buses was effected in 1992,
however, a Supreme Court decision in 1994 disallowed the complete freedom of
operators to arbitrarily adjust bus prices. Fare revision, therefore, still entails
administrative processes which go through the LTFRB and the Commission on Audit
(COA) and a mandated public hearing.
Table 8: Regulations concerning entry and exit in the bus transport industry
Entry category Details/characteristics
Entry and Exit from
Industry
―The control in entry into and exit out of the industry shall be
liberalised to introduce and/or enhance the level of
competition in terms of the rates charged and the quality of
service rendered by land transportation operations as provided
by the Public Service Act.‖
Entry to a monopolised
route
―There shall be a minimum of two (2) operators in any route.
Routes presently serviced by only one operator shall be
immediately opened up for at least (1) additional operator of
the same/better mode/type of service.‖
Entry to a development
route
―Operators that shall develop a route where there are no
existing authorised operators/services shall be authorised to
provide the required services. Operators on said route shall be
afforded protection of investment for a maximum of two (2)
years, after which, the link/route shall be opened for entry to
at least one (1) additional operator.‖
Entry to an already
established route served
by franchise operator(s)
―This shall be allowed in, but not limited to, any of the
following cases:
The new entrant may be able to provide a more efficient and
cost-effective, competitive service than the existing/authorised
operators.
The new entrant shall introduce quality of service
improvements and/or innovative/technologically-advanced
services superior to those provided by existing/authorised
operators.
The route warrants additional capacity and/or it has been
determined that existing authorised operators therein have not
been sensitive to an increase in demand and/or offer to
increase capacity only after another operator has offered to
increase capacity
New entrants will be admitted in routes where the action or
practices of existing/authorised operators result in the lack of

45
Entry category Details/characteristics
effective competition.
The existing authorised operator(s) has/have been defiantly
violating the Public Service Law and/or terms and conditions
of its/their Certificate(s) of Public Convenience and/or
LTFRB Rules and Regulations.‖
Source: DOTC and UP NCTS [2012]; Department Order No. 92-587 (1992)
To be able to operate and provide adequate and quality bus transport service to the
commuting public, an operator must first secure a Certificate of Public Convenience (CPC) as
specified in section 15 of Commonwealth Act No. 146 (Public Service Law). Section 15 of
CA No. 146 specifically indicates that the granting of CPC must ensure that ―the operation of
said service and the authorisation to do business will promote the public interests in a proper
and suitable manner.‖ Aside from these regulations, the applicants must also undergo
financial and technical evaluation by the LTFRB so as to assess if they are indeed capable of
starting and maintaining their operations (DOTC and UP NCTS 2012). In practice the
approval of franchise applications has led to a proliferation of operators.
Labour standards and compensation arrangements among bus operators and their drivers and
conductors have shifted over the years. The ―boundary system‖ of compensation where the
daily earnings of drivers were based on how well they competed with other bus drivers for
passengers within franchised routes has been a major contributor to indiscipline on the road.
Recent attempts to curb this practice led LTFRB to issue Memorandum Circular No.2012-
001 where part-fixed-part-performance based compensation is enjoined. The directive,
however, is still less than satisfactory as drivers and conductors are still unduly burdened
with operational risks.
Following these reforms, congestion became a serious problem, based on previous studies
(JICA, 1997; 2009) and interviews with stakeholders. In an attempt to address congestion
issues, government imposed a moratorium on issuance of franchises for provincial buses in
2000, followed by a nation-wide moratorium on all new buses and new franchise in 2003. A
further attempt to reduce the number of buses plying Metro Manila was through the ‗Bus
Rationalisation Programme‘ of 2007. Nonetheless, the respective entry and prolonged stay of
new operators and buses were made possible through sectoral accommodation and temporary
suspension of the moratorium on issuance of new CPCs.
The market operates under a highly complicated regime where regulation and enforcement
is shared by several agencies. Bus transportation in the Philippines is governed by the
Department of Transportation and Communication (DOTC) through its line agencies, the
Land Transportation Franchising and Regulatory Board (LTFRB) and the Land
Transportation Office (LTO). The two line agencies respectively manage the economic and
safety regulations with the sector. The LTFRB regulates entry and exit of bus operators and

46
sets/regulates bus fares; the LTO helps implement the said regulations through its registration
and inspection functions. Traffic regulation is undertaken by other agencies which include
the Metro Manila Development Authority (MMDA), the Philippine National Police (PNP)
and the relevant local Government.
Also indirectly involved through planning and development of road infrastructure are the
Department of Public Works and Highways (DPWH) and National Economic Development
Authority (NEDA).
Table 9 enumerates the different institutions mandated to perform specific functions within
the country‘s land transportation system. Figure 8 presents the institutional and policy
timeline relevant to the Bus sector.
Table 9: Agencies/institutions involved in the land transport system and its functions
Agency Laws/Regulations
Creating the
Agency
Mandate/Functions
Department of
Transportation
and
Communications
(DOTC)
Executive Order
Nos. 125 and 125-A
as amended by EO
No. 226
Serves as the primary policy, planning,
programming, coordinating, implementing and
administrative government agency on the
promotion, development and regulation of a
dependable and coordinated network of
transportation and communications systems, as
well as in the fast, safe, efficient and reliable
transportation and communications services
LTFRB: Attached
to DOTC
Executive Order No.
202
To promulgate, administer, enforce, and monitor
compliance of policies, laws, and regulations of
public land transportation services except
tricycles and non-motorised vehicles.
Land
Transportation
Office (LTO) –
Attached to
DOTC
Executive Order
Nos. 125 and 125-A
as amended by EO
No. 226
Responsible for the (i) inspection and registration
of motor vehicles; (ii) issuance of licenses and
permits; (iii) enforcement of land transportation
rules and regulations; (iv) adjudication of traffic
cases; and (v) collection of revenues for the
government
Metro Manila
Development
Authority
(MMDA)
Republic Act 7924 Perform planning, monitoring, coordinating and
implementing functions where appropriate, and in
the process, exercise regulatory and supervisory
authority over the delivery of metro-wide
services within Metro Manila
Department of
Labour and
Employment
Republic Act 4121 Monitors the compliance of bus operators with
Department Order No. 118-12, Series of 2012
(The Rules and Regulations Governing the

47
Agency Laws/Regulations
Creating the
Agency
Mandate/Functions
(DOLE) Employment and Working Conditions of Drivers
and Conductors in the Public Utility Bus
Transport Industry) and provides technical
assistance on how to comply to the said DO
National
Economic and
Development
Authority
(NEDA)
Presidential Decree
No. 107
Responsible for the creation and coordination of
policies in transport (roads, maritime, air, etc.) in
the Philippine Development Plan
Sources: DOTC; LTFRB; LTO;DOLE;The World Bank [2005]
Figure 8: Policy and institutional timeline in the bus sector
Market Structure and Competition in Bus Transport
The Philippines is a country of over 92 million people concentrated in highly dense urban
agglomerations like Metro Manila. Given low motorisation (9 cars per 1,000 people) bus
transport offers an affordable alternative mode of transportation. Competition policies in the
bus transport sector—in the form of transparent rules for entry and exit, fare setting, and
regulatory mechanisms that promote competition—can potentially have positive impacts by
providing bus operators with a competitive environment and the public with affordable and
efficient bus service.
Public transportation in the Philippines is fraught with problems such as inadequate road
infrastructure and congestion in the urban areas. The welfare impacts of competition reforms
must thus be viewed within the context of other factors affecting the optimal number of buses
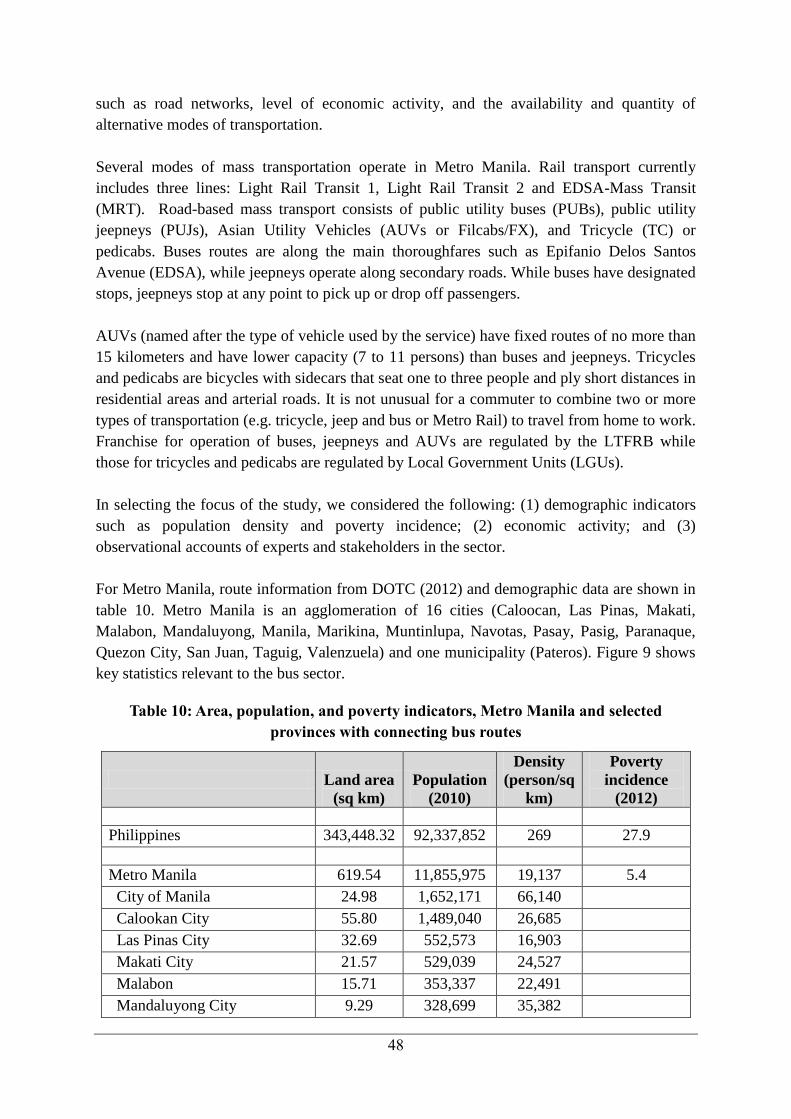
48
such as road networks, level of economic activity, and the availability and quantity of
alternative modes of transportation.
Several modes of mass transportation operate in Metro Manila. Rail transport currently
includes three lines: Light Rail Transit 1, Light Rail Transit 2 and EDSA-Mass Transit
(MRT). Road-based mass transport consists of public utility buses (PUBs), public utility
jeepneys (PUJs), Asian Utility Vehicles (AUVs or Filcabs/FX), and Tricycle (TC) or
pedicabs. Buses routes are along the main thoroughfares such as Epifanio Delos Santos
Avenue (EDSA), while jeepneys operate along secondary roads. While buses have designated
stops, jeepneys stop at any point to pick up or drop off passengers.
AUVs (named after the type of vehicle used by the service) have fixed routes of no more than
15 kilometers and have lower capacity (7 to 11 persons) than buses and jeepneys. Tricycles
and pedicabs are bicycles with sidecars that seat one to three people and ply short distances in
residential areas and arterial roads. It is not unusual for a commuter to combine two or more
types of transportation (e.g. tricycle, jeep and bus or Metro Rail) to travel from home to work.
Franchise for operation of buses, jeepneys and AUVs are regulated by the LTFRB while
those for tricycles and pedicabs are regulated by Local Government Units (LGUs).
In selecting the focus of the study, we considered the following: (1) demographic indicators
such as population density and poverty incidence; (2) economic activity; and (3)
observational accounts of experts and stakeholders in the sector.
For Metro Manila, route information from DOTC (2012) and demographic data are shown in
table 10. Metro Manila is an agglomeration of 16 cities (Caloocan, Las Pinas, Makati,
Malabon, Mandaluyong, Manila, Marikina, Muntinlupa, Navotas, Pasay, Pasig, Paranaque,
Quezon City, San Juan, Taguig, Valenzuela) and one municipality (Pateros). Figure 9 shows
key statistics relevant to the bus sector.
Table 10: Area, population, and poverty indicators, Metro Manila and selected
provinces with connecting bus routes
Land area
(sq km)
Population
(2010)
Density
(person/sq
km)
Poverty
incidence
(2012)
Philippines 343,448.32 92,337,852 269 27.9
Metro Manila 619.54 11,855,975 19,137 5.4
City of Manila 24.98 1,652,171 66,140
Calookan City 55.80 1,489,040 26,685
Las Pinas City 32.69 552,573 16,903
Makati City 21.57 529,039 24,527
Malabon 15.71 353,337 22,491
Mandaluyong City 9.29 328,699 35,382

49
Land area
(sq km)
Population
(2010)
Density
(person/sq
km)
Poverty
incidence
(2012)
Marikina City 21.52 424,150 19,710
Muntinlupa City 39.75 459,941 11,571
Navotas 8.94 249,131 27,867
Parañaque City 46.57 588,126 12,629
Pasay City 13.97 669,773 47,944
Pasig City 48.46 392,869 8,107
Pateros 10.40 64,147 6,168
Quezon City 171.71 2,761,720 16,084
San Juan 5.95 121,430 20,408
Taguig 45.21 644,473 14,255
Valenzuela City 47.02 575,356 12,236
Cordillera Administrative
Region 19,422.0
1,616,867 83 28.7
Baguio Citya/ 57.51 318,676 5,541 6.0
Region IV-A 16,873.3 12,609,803 747 14.3
Lucena Cityb/
80.21 246,392 3,072 29.2
a/ Poverty incidence is at the provincial level (Benguet)
b/ Poverty incidence is at the provincial level (Quezon)
Sources: Philippine Statistical Authority.
Figure 9: Key statistics in the study area
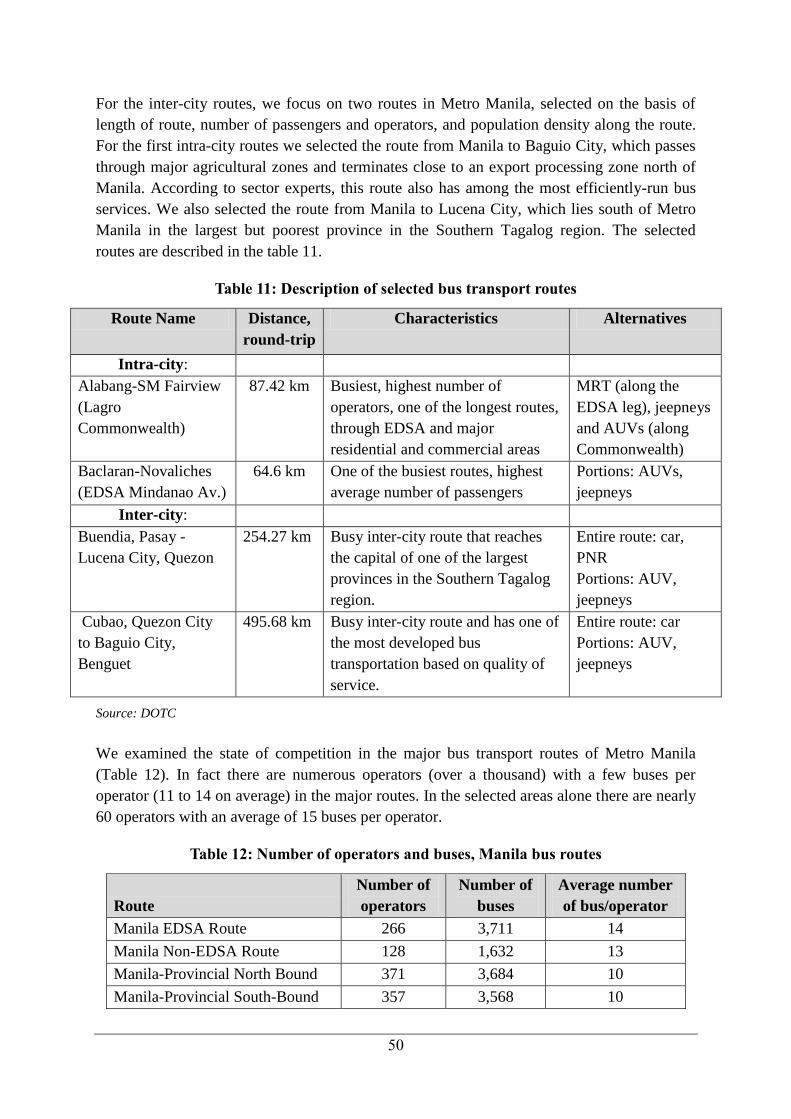
50
For the inter-city routes, we focus on two routes in Metro Manila, selected on the basis of
length of route, number of passengers and operators, and population density along the route.
For the first intra-city routes we selected the route from Manila to Baguio City, which passes
through major agricultural zones and terminates close to an export processing zone north of
Manila. According to sector experts, this route also has among the most efficiently-run bus
services. We also selected the route from Manila to Lucena City, which lies south of Metro
Manila in the largest but poorest province in the Southern Tagalog region. The selected
routes are described in the table 11.
Table 11: Description of selected bus transport routes
Route Name Distance,
round-trip
Characteristics Alternatives
Intra-city:
Alabang-SM Fairview
(Lagro
Commonwealth)
87.42 km Busiest, highest number of
operators, one of the longest routes,
through EDSA and major
residential and commercial areas
MRT (along the
EDSA leg), jeepneys
and AUVs (along
Commonwealth)
Baclaran-Novaliches
(EDSA Mindanao Av.)
64.6 km One of the busiest routes, highest
average number of passengers
Portions: AUVs,
jeepneys
Inter-city:
Buendia, Pasay -
Lucena City, Quezon
254.27 km Busy inter-city route that reaches
the capital of one of the largest
provinces in the Southern Tagalog
region.
Entire route: car,
PNR
Portions: AUV,
jeepneys
Cubao, Quezon City
to Baguio City,
Benguet
495.68 km Busy inter-city route and has one of
the most developed bus
transportation based on quality of
service.
Entire route: car
Portions: AUV,
jeepneys
Source: DOTC
We examined the state of competition in the major bus transport routes of Metro Manila
(Table 12). In fact there are numerous operators (over a thousand) with a few buses per
operator (11 to 14 on average) in the major routes. In the selected areas alone there are nearly
60 operators with an average of 15 buses per operator.
Table 12: Number of operators and buses, Manila bus routes
Route
Number of
operators
Number of
buses
Average number
of bus/operator
Manila EDSA Route 266 3,711 14
Manila Non-EDSA Route 128 1,632 13
Manila-Provincial North Bound 371 3,684 10
Manila-Provincial South-Bound 357 3,568 10

51
Route
Number of
operators
Number of
buses
Average number
of bus/operator
TOTAL 1,122 12,595 11
Alabang-Fairview 21 341 16
Baclaran-Novaliches 17 171 10
Manila-Baguio 7 240 34
Manila-Lucena 8 132 17
TOTAL 58 862 15
Source: LTFRB.
The large number of operators appears puzzling given the moratorium in place since 2000.
Interviews with bus operators also revealed that the moratorium is not binding since it is still
possible to acquire a new franchise if one is willing to pay a stiff fixer‘s fee of P150,000 per
unit. However, the official franchise rate is only P510 for the first 2 units and P70 for each
additional unit. Though excessive entry into the sector leads to congestion and possibly
suboptimal profits, the low market concentration and high number of operators are indicative
of positive profit from bus operation. This constitutes the incentive for entry into the sector.
Competition Concerns in the Bus Transport Sector
In the context of Manila‘s developing urban areas, designing a regulatory policy for the
optimal level of buses needs to address both competition policy and congestion issues. An
optimal level of regulation must take into consideration the level of economic activity and
infrastructure development. The literature also points to inefficiencies in the market due to
information asymmetry on both the sides of bus operators and the riding public. The
challenge is to incorporate these concerns in future efforts to improve market efficiency and
enhance competition in the bus sector.
The 2011-2016 Philippine Development Plan (PDP) has identified several challenges that
currently face the transport sector. To tackle these challenges, the NEDA suggested for the
adoption of a comprehensive long-term National Transport Policy (NTP) in the country.
Some of the challenges are as:
(i) lack of integrated and coordinated transport network;
(ii) overlapping and conflicting functions of transport and other concerned agencies;
(iii) transport safety and security concerns; and
(iv) underdeveloped transport facilities in conflict-affected impoverished areas.
Another strategy raised in the PDP was the implementation of the Road Safety Action Plan
which shall strengthen the country‘s safety and security policies on land transport. Box 2
describes a case of poor road safety enforcement; table 14 shows the number of road traffic
accidents, by type of motor vehicle. In 2012 buses accounted for about 10 per cent of motor
vehicles involved in accidents.

52
Aside from the PDP, the national government has partnered with international development
organisations to come up with infrastructure development plans that would address land
transport concerns and ameliorate problems due to traffic congestion. Among these initiatives
are the National Transport Plan by AusAid (2010) and the Mega Manila Infrastructure
Development Roadmap by JICA (2014).
Box 2: Bus transport safety
A specific case of inadequate transport safety and weak enforcement in bus transport sector is
that of the Don Mariano Transport Corporation. A bus company suffered an accident which
led to the death of 18 people last December 2013. With this, the license to operate (i.e.
Certificate of Public Convenience) of the Don Mariano Transport Corp. has been suspended
for 30 days (LTFRB 2013). In 2011, the said bus company also ranked highest in terms of the
number of damage to property caused in Metro Manila. It was then reported that it has been
operating with an expired Labour Standards Compliance Certificate which is issued by the
Department of Labour and Employment on a regular basis (Padua 2013).
Table 13: Number of motor vehicles involved in accidents, by type (2008-2012)
2008 2009 2010 2011 2012
Bus 1,443 2,146 2,692 1,707 1,316
Truck 1,519 2,912 3,099 2,422 1,770
Automobile 4,059 9,599 10,457 6,973 5,428
Jeep 2,194 2,353 1,864 1,316 879
Tricycle 1,659 1,638 1,578 1,389 925
Motorcycle 3,408 4,311 3,543 3,665 3,112
Other 836 390 359 473 322
Total 15,118 23,349 23,592 17,945 13,752
Source: PSA – NSCB.
Further, managing competition within the bus sector, either intentionally or by accident, has
been a key issue over the years. Government decision makers had always looked for the right
formula in balancing the concerns of sectoral stakeholders as evidenced by how policy and
institutions had evolved. Box 3 narrates an example in competition-related policy reforms,
which had impacted the market structure of the sector.

53
Box 3: Contradiction in Competition Policy
Experts agree that the
golden years of the bus
sector were experienced by
the country during the time
when the sector players
were agglomerated into a
few big organisations/
corporations.
It started in 1976 when the
government, under martial
rule, ordered the reorganisation of private operators into 4 consortia with the government-
owned Metro Manila Transit Corporation (MMTC) as the fifth operator. At that time, the
MMTC was the biggest bus operator, owning almost 20 per cent of all units plying the
streets. By 1980, the bus operators had regrouped to 14 functional consortia, allowing for
ease in regulation and in-sector policing. However, a parallel bus leasing programme by the
government which culminated in 1989 compromised the sector‘s agglomerated structure,
decreased its market concentration, and flooded the sector with reconditioned imported
second-hand buses. This started the unfettered evolution of the bus sector into what it is now
fragmented with literally thousands of operators operating an oversupply of units within
franchised routes. This evolved setting comes with a price: uncontrolled traffic congestion,
indiscipline in the streets, and increasing marginal social costs.
Potential Impact of Rationalising Competition in the Bus Transport Sector
Overview of the Cost-benefit Methodology
The following cost-benefit analysis for the bus transport sector relates to the congestion
aspect of franchise regulation. Road safety and pollution are also important concerns;
unfortunately there is not enough information on these to parametrise benefits and costs from
improved regulations. This section attempts to measure the costs and benefits from reducing
bus congestion in Metro Manila along the selected traffic routes. Traffic congestion costs and
externalities arise as travel time is delayed when infrastructure capacity reaches a level of
saturation. Absence of perfect information usually leads private motorists to use a road
network even if the saturation level or maximum vehicle flow capacity has already been
reached. In the case of public transport like buses, oversupply in certain routes clog the
system resulting in time delays and corresponding external costs and business operation
costs.

54
Figure 10 presents the theory of urban public transport congestion as defined by cost and
benefit per trip to passengers and bus operators given infrastructure demand and congestion
rates. Demand curves D1, D2 and D3 illustrate motorists‘ increasing demand on the use of a
particular road infrastructure. As can be inferred from the diagram, between vehicle flow
rates of 0 and V2, the assumed road carrying capacity, there is no congestion.
Figure 10: Bus congestion marginal cost and benefit framework
Once this point is breached due to shifts in road use demand D2 and D3, marginal costs are
incurred by passengers and operators from the accompanying traffic congestion. Thus, the
total marginal social cost (MSC) per trip due to traffic congestion at a given demand level D
is computed as the sum of Marginal External Cost (MEC) and Marginal Bus Operators‘ Cost
(MBOC). The parameters are respectively computed from the opportunity cost of wasted
time for working passengers and decreased revenue runs and attached costs for bus operators.
MSCt (marginal social cost of congestion) = MECt + MBOCt
Where MECt is a function of time delay due to congestion, number of passengers affected,
and prevailing wages rate; while MBOCt is a function of decreased revenue runs and
operating cost per bus-km (consisting of driver-conductor commissions, fuel and lubricant
costs, and repair and maintenance costs) at time t. The goal for traffic managers in this case
would be to move traffic flows to optimal rates/levels (from V3 to β and V4 to α) where
marginal social costs equal marginal social benefits. We estimate the movement in marginal
social cost as traffic de-congestion is assumed given hypothetical policy augmentations.
The study applies this framework to the main trunk-lines of all north and southbound bus
routes, the EDSA, particularly its ‗super corridor‘ from Magallanes to East Avenue (figure
11).

55
Figure 11: EDSA Super Corridor (Transportas Consulting 2006)
Limiting the route range served the study well as traffic congestion on EDSA‘s super corridor
is reflective of the overall bus transit situation in Metro Manila. It accounts for the largest
number of passenger flows generated by business districts (Makati and Ortigas) as well as
several malls (Ayala Center, Megamall, SM City, Araneta Center). Furthermore, the four
intracity and intercity study routes mentioned in the previous sections of the paper also pass
through certain sections of EDSA.
Results
Transportas Consulting Co. (2006) estimated that around three-fourths of all daily total
person trips in the metro are carried by public transport. They concluded that there is an
excess of buses on the 30 operational routes with load factors well below capacity, except for
some short sections during peak hours. On a typical weekday, load factor averaged 51.3 per
cent; slightly lower at 47.5 per cent on a weekend. For selected sections of the network, the
load factors were also well below desirable thresholds – even during peak hours. The excess
bus capacity will be further highlighted if existing bus productivity can be improved to
service nearly a million daily passengers on a typical weekday. The volume of commuters
dips by about 20 per cent on weekends, but bus-trips remain relatively the same. Considering
all these, and adopting a more conservative stance, this analysis assumes a 20 per cent
reduction in bus trips along the super corridor, accounting for the excess 20 per cent that plies
the Magallanes to East Ave route on a daily basis. It is further assumed that this level of bus
traffic would be able to service the current daily passenger volume (see table 15).

56
Table 14: Mean daily supply and demand situation within the EDSA super corridor
Super Corridor
Daily passenger
volume Actual bus trips Bus trips
NB SB NB SB Required Excess Percent
Excess
Magallanes-
Ayala 115,652 128,554 4,156 4,216 7,005 1,367 0.16
Ayala-
Guadalupe 120,272 112,181 4,156 4,216 6,668 1,705 0.20
Guadalupe-
Aurora 113,177 101,839 4,156 4,216 6,168 2,205 0.26
Aurora- East
Ave 134,052 102,820 4,144 4,074 6,794 1,424 0.17
Magallanes-East
Ave (aggregate) 483,153 445,394 16,612 16,722 26,635 6,701 0.20
Note: passenger volume and bus trips are counted per major stop within the North Bound (NB) and South
Bound (SB) routes
Source: Transportas Consulting (2006).
Clearly, there is an excess supply of buses plying the major thoroughfares of Metro
Manila especially during off-peak hours of the day. This congestion scenario results in
time delays for public commuters as well as decreased revenue runs for bus operators.
Related literature has also shown diminishing revenue runs on a bus-kilometer basis for fleet
operators in the city. Estimated average revenue runs over the past two decades were 184
bus-km in 1996, 172 bus-km in 2002 and 162 bus-km in 2006 (Transportas Consulting 2006,
Montalbo 1997, Kobune 2002). Table 16 presents estimates on revenue runs and operational
costs per bus per day as broken down into driver and conductor commissions, fuel and
lubricants, and repair and maintenance.
Table 15: Revenue runs and operational costs for different bus fleet sizes,
compounded to present value from 1997 data
Operational detail
Fleet Size
>= 100 51 to
99
26 to
50
11 to
25 <=10
Aggre
gate
Revenue run bus-km per month 5,238 5,003 5,359 5,878 3,175 5,172
Revenue run bus-km per year 62,856 60,034 64,308 70,533 38,098 62,061
Revenue run bus-km per day 187.07 178.67 191.39 209.92 113.39 184.7
Cost breakdown per bus per day 5,911 3,625 2,253 6,044 2,383 4,547
Driver& conductor daily commission 1,734 1,056 595 1,430 522 1,293
Fuel, oil, & lubricants per day 2,477 1,799 1,274 3,143 1,083 2,095
Repair & maintenance per day 1,700 770 383 1,469 779 1,160
Source: Montalbo and Ishida (1997)

57
A graphical presentation of the excessive bus supply situation within the 12 km stretch of
EDSA‘s super corridor is evident (Figure 10). This is seen in the difference between the
authorised seat capacity of buses and the estimated passenger demand over the length of
EDSA (Figure 12). Transportas Consulting (2006) reported that the highest time-specific bus
flow of 1,722 buses was recorded between Guadalupe and Bony Avenue from 06:00 to 09:00.
The load factors during that period were 45.6 per cent SB and 44.4 per cent NB. To raise the
peak-hour load factor to 100 per cent, it would be necessary to reduce the frequency from
1,722 to 859. In terms of headways, the required reduction is from 1 bus per 11.2 seconds to
1 bus per 22.5 seconds. The oversupply on the super EDSA corridor is, therefore, around 50
per cent. When applied to the base fleet of 3,414, the oversupply is as much as 1,700 units.
When applied to the operational buses during that day, the excess is 1,012 buses.
Figure 12: Authorised seat capacity and estimated passenger demand within EDSA
Source: Transport Consulting (2006)
In spite of such gross under-utilisation of the seating capacity in the buses, there is a steady
supply of buses in Metro Manila. This implies that running buses in Metro Manila region is a
fairly attractive business proposition. Given that with such limited seat occupancy a bus
operator can derive profits, raises questions about the ‗level‘ of fares. Currently, the LTFRB,
does not have a formula for automatic fare revision. Instead, petitions are put forth to the
LTFRB by the operators and the same is addressed through public hearing, in consultation
with the National Economic Development Authority (NEDA). To regularise the fare, the

58
Center for University of Philippines National Transport Studies is being consulted by the
LTFRB to develop a fare formula.
In terms of travel time within the super corridor‘s 12 km stretch ranged from 18 to 138
minutes depending on the level of traffic congestion at certain times of the day. Policy
measures to address Metro Manila‘s congestion should strive to narrow down this huge delay
in travel time. Figure 13 presents a scatter plot of bus travel times from Magallanes to East
Avenue. It reflects the range of time delays while traversing the super corridor. Table 17
summarises the key assumptions from the sections above and cites additional figures on
minimum wages, and working days, travel times and decongestion levels.
Traffic congestion directly impacts the productivity of both the passengers and buses plying
the routes along metro Manila‘s thoroughfares as time delays cut the number of bus trips and
eat up the passengers‘ productive time at work. Estimating the marginal social costs due to
congestion issues indirectly relates to the benefit streams from improved vehicular flow as a
result of better transport management or policy. The range of total marginal costs as a result
of congestion are the same as the range of overall benefits accruing to passengers and bus
operators once the congestion conundrum (or part of it) is solved.
Figure 13: Bus travel time and time of day, EDSA, Magallanes to East Ave
Source: Transportas Consulting (2006)

59
Table 16: Key parameters for the computation of marginal social costs
Parameter Value Unit
Assumed total length of super corridor (km) 12.00 Km
Assumed minimum travel time (minutes) 18 min/km
Assumed maximum travel time(minutes) 138 min/km
Average travel time delay per km 10.00 min/km
Assumed minimum wage 466 pesos/day
Assumed number of working days 260 days/yr
Number weekend days 105 days/yr
Assumed bus decongestion under optimal supply 20 percent of bus trips
Assumed dip in passengers over the weekends 20 percent
Results showed that the value of time wasted due to traffic congestion is immense. This
is despite the focus of the estimation process on the public bus transport system within
the 12 kilometer stretch of EDSA‘s super corridor. The annual marginal social cost due
to congestion was estimated at P5,508,971,237. The figure is broken down into
marginal external costs from forgone wages of passengers amounting to P4,569,759,077
and marginal bus operators’ cost of P939,212,160. It is worth noting that the marginal
cost due to forgone opportunities for the passengers is five times higher than the marginal bus
operators‘ costs (see tables 18 to 21).
If the moratorium in the early 2000s was enforced more effectively leading to a 20 per cent
reduction in bus trips per unit time within the EDSA super corridor, it would have yielded a
net present value of P13.2bn in the medium term (3 years) and P19.86bn in the long term
(6 years) at 12 per cent discount rate.2
Table 17: Estimated time delays due to congestion along the EDSA super corridor
Route
distance
(km)
Time delay due to congestion (in minutes)
Average
bus delay
per
section
Northbound
passengers
(NB) per
day
Southbound
passengers
(SB) per
day
Total delay
for all
passengers
per day
Magallanes- Ayala 1.40 14.00 1,619,128 1,799,756 3,418,884
Ayala-Guadalupe 5.00 50.00 6,013,600 5,609,050 11,622,650
Guadalupe- Aurora 4.30 43.00 4,866,611 4,379,077 9,245,688
Aurora- East Ave 1.30 13.00 1,742,676 1,336,660 3,079,336
2 The official rate of the NEDA is 15 per cent, which was set in the 1970s before capital account liberalisation.
For some purposes a lower rate is recommended; for instance, 12 per cent has been suggested, consistent with
more open capital markets in the country (Medalla, 2014).

60
Table 18: Marginal external costs from forgone wages of bus passengers, in pesos
Forgone
wages per
minute
Wages
forgone daily
50% of
passengers
working
75%
passengers
working
Magallanes- Ayala 0.97 3,319,167 1,659,583 2,489,375
Ayala-Guadalupe 0.97 11,283,656 5,641,828 8,462,742
Guadalupe- Aurora 0.97 8,976,022 4,488,011 6,732,017
Aurora- East Ave 0.97 2,989,522 1,494,761 2,242,142
Magallanes-East
Ave
0.97 26,568,367 13,284,183 19,926,275

61
Table 19: Estimated marginal bus operators’ costs along the EDSA super corridor, in pesos
Average
route cost
Northbound
buses
Southbound
buses
Total bus
operating cost
Cost from excess
bus trips/supply
Magallanes- Ayala 44.80 186,188.80 188,876.80 375,065.60 61,241.60
Ayala-Guadalupe 160.00 664,960.00 674,560.00 1,339,520.00 272,800.00
Guadalupe- Aurora 137.60 571,865.60 580,121.60 1,151,987.20 303,408.00
Aurora- East Ave 41.60 172,390.40 169,478.40 341,868.80 59,238.40
Magallanes-East Ave 384.00 6,379,008.00 6,421,248.00 12,800,256.00 2,573,184.00
Table 20: Total marginal social costs due to traffic congestion along the EDSA super corridor, in pesos
Marginal bus
operators Cost
per day
Marginal
external cost
per day 50%
Marginal
social cost
per day
Marginal bus
operators'
cost per year
Marginal social
cost per year
(260 weekdays)
Marginal social
cost per year
(105 weekends)
Total marginal
cost per year
Magallanes-
Ayala
61,242 1,659,583 1,720,825 22,353,184 447,414,468 145,835,363 593,249,831
Ayala-
Guadalupe
272,800 5,641,828 5,914,628 99,572,000 1,537,803,285 502,557,554 2,040,360,839
Guadalupe-
Aurora
303,408 4,488,011 4,791,419 110,743,920 1,245,768,953 408,850,768 1,654,619,721
Aurora-
East Ave
59,238 1,494,761 1,553,999 21,622,016 404,039,848 131,779,957 535,819,806
Magallanes-
East Ave
2,573,184 13,284,183 15,857,367 939,212,160 4,122,915,514 1,386,055,722 5,508,971,237

62
Key Findings
Over the years, the bus transport sector had evolved from a highly regulated and concentrated
market with a handful of players in the 1970s to a more liberalised albeit still regulated
market with hundreds of small operators. The separation between the state and the bus market
was tempered when the government disengaged from bus service provision through the
dissolution of MMTC. The challenge now is to rationalise its regulatory function and
harmonise policy.
The essence of the 1992 liberalisation policy is still in effect albeit the existence of a
moratorium on franchise issuance as indicated in the year 2000-2003 directives, 15-year age
requirement for vehicles, and the regulated fare-setting for all PUVs. Industry
accommodation has also allowed new operators to bypass the moratorium directive, while
selective enforcement (or non-enforcement in this case) has allowed older buses to service
the public.
Market inefficiency manifests in too many operators and buses resulting to traffic indiscipline
and congestion. This highly fragmented nature of the sector, both on the regulatory and
supply side, results to poor synchronisation among bus operators, public commuters, and
government regulators as manifested in market inefficiencies. In the above-mentioned
premises reside the confusion and contradiction in policy, and the impetus to streamline the
service being offered by the industry through apt competition policy.
Although alternative modes of transport are available to the commuting public, the market for
the bus sector is well defined by patrons who opt for low cost and accessibility in their means
of conveyance. The large number of operators appears puzzling given the moratorium in
place since 2000. Interview with bus operators also revealed that the moratorium is not
binding since it is still possible to acquire a new franchise if one is willing to pay a stiff
fixer‘s fee of P150,000 per unit against the official franchise rate of only P510 for the first 2
units and P70 for each additional unit thereafter.
It is clear that supply side issues add to traffic congestion within major thoroughfares and
suboptimal profits for players in the sector. However, the low market concentration and high
number of operators in the sector are indicative of positive cash flows/investment outcomes
from bus operations. Data indicates the presence of numerous operators (over a thousand)
with a few buses per operator (11 to 14 on average) in the major routes. In the selected areas
alone there are nearly 60 operators with an average of 15 buses per operator. The evidentiary
basis that there is oversupply or excess seating capacity within the studied routes is also well
grounded in literature. The implemented bus rationalisation plan by LTFRB was also founded
on this claim. JICA (2007, 1999) and PLANNADES (2013) further mentioned in their study
that even a reduction in bus trips of as much as 50 per cent within the EDSA super corridor
will still be acceptable given the current situation and will not compromise transport service
for the commuting public.

63
The cost-benefit analysis implemented in this DCR shows the tremendous magnitude of
benefits from implementing an effective regulatory regime that addresses the congestion
problem. Results show that the value of time wasted due to traffic congestion is immense.
Reducing bus trips eases congestion and permits faster travel time on average; buses can
also achieve faster turnover hence passengers can expect equal availability of bus
service. An effective decongestion policy that will lead to a decrease in bus trips by 20 per
cent within the EDSA super corridor, while still sufficiently servicing existing passenger
demands, will yield a net present value of P13.2bn in the medium term (3 years) and
P19.86bn in the long term (6 years) at 12 per cent discount rate.

64
5. Conclusion and the Way Forward
Competition policy is in the process of being consolidated in the Philippines. It should be
noted that the scope of competition policies is wide, encompassing anti-trust, prohibitions on
anti-competitive practices, removal of investment restrictions and other entry barriers, trade
liberalisation (i.e. openness to foreign competition), and competent regulation (to ensure a
suitable level competition in cases of market failure, e.g. externalities).
In the rice sector, consistent with previous studies done on the rice supply chain, the rapid
appraisal reported in this DCR finds that the paddy and rice supply chain is multi-layered
with many competing players in each layer. The rapid appraisal also finds no evidence of any
cartel-like behaviour in the areas studied. Margins are limited to 2 per cent or less of raw
materials at all levels before retail. Profits are enhanced by volume, fast turnover of stocks,
integration of operations across levels, and investments for quality consistency. The greatest
threats to current players are weather risks and continuing tight local paddy supplies that
spawn greater competition and increase management costs. The increased costs also highlight
the lower cost option of bringing in foreign rice.
Rice importation policies need to be rationalised, to protect the interests not only of producers
but also of consumers and other market participants. Huge differences in the costs of bringing
in imports and moving domestic supplies to consumers makes smuggling lucrative.
Quantitative restrictions on imports as exemplified by NFA‘s regulations raise the domestic
price of rice and allow the concentration of legally imported supplies in the hands of a few.
Tariffication – involving liberalised importation of rice subject to payment of import duty -
can still confer some protection on producers, while reducing the price of rice, stabilising
domestic supplies and prices, and deterring any attempt to control supplies to manipulate
market prices.
Opposition to the above-mentioned reforms remains strong. Organised farmer groups
constitute a strong lobby against import liberalisation; such organisations contain a mix of
farmer types, i.e. these are not dominated by large farmers. In fact in rice, a farmer is already
"large" when he or she cultivates about seven hectares – really large rice land holdings no
longer exist due to the country's land reform programme (which had covered rice since 1972).
The local miller's association is also active, but has not been described in the press nor in the
literature as a significant lobby group. Tolentino and de la Pena (2012) have identified the
following lobby groups:
The NFA Employee's Association;
The various service providers to NFA (trucking, logistics, warehouses, etc.);
Financial institutions which lend to NFA;
Network of corruption within NFA that exploits the difference between NFA retail
price and market price, and between domestic market price and world market price

65
The last is quite significant: "The NFA selectively provides access to a favoured few to its
stock of imported rice, which is likely to have been imported at the low border price, and
which may be sold in the domestic market at the relatively high domestic retail price. Many
of those favoured with access are the local political elites." (p. 196).
Such opposition appears formidable. However there are countervailing forces – namely the
country's economic managers who are trying to arrest food price inflation and reduce the
NFA debt; and WTO commitments of the country, which obligate it to undergo tariffication
by 2017.
As we near 2017, it is crucial for policy makers to evaluate and weigh the pros and cons of
renewing the QR and abolishing it. The economic losses suffered from the QR have already
been discussed in the report. At the same time, if the QR is abolished, domestic farmers will
be subject to international competition, which they are unprepared for. It has hence been
argued by the some observers that the implications of the QR abolishment on the farmers,
middle men, millers and the consumers be envisaged and accordingly a scheme be framed in
order to prepare the rice supply chain for international competition. Unlike past reform
efforts, which have ended in failure, the next few years should well be the turning point in
staple foods competition policy in the country.
Meanwhile, competition reforms in the bus transport sector must consider the network
characteristics of bus transport service. Such a regime may, to be feasible, entail organisation
or possible agglomeration among operators. Obviously such a course should not be overly
restrictive and go the opposite extreme, leading to failure of contestability and the rise of
market power.
Realising these large benefits require a mixture of regulatory and administrative enforcement
to optimise vehicular flows in major road networks. This is to decrease marginal social costs
by closing in to the desired number of bus trips in given routes and lessening delays in travel
time for commuters. Both have positive impacts on operators‘ direct expenses and
commuters‘ forgone opportunity. To address this, the two options enumerated in the report
included interventions within the bus sector in particular, and a wide spectrum approach for
all road users (including private cars) as a whole.Proper enforcement of existing traffic and
transport policy, particularly on franchise agreements, could help achieve the targeted
decrease in buses trips and travel time delays. The same issues on road safety can also be
stringent implementation of appropriate safety regulations and corresponding compliance
among industry operators. Again, the shortest way to push this is through enforcement of
existing policy.
A semblance of organisation among bus operators should be enjoined. In particular,
regulation of numerous small players is unwieldy, compared to regulating a fewer number of
players, whether corresponding to actual companies, or organised franchise holders.

66
Regulatory controls on entry should not be overly restrictive and go the opposite extreme,
leading to failure of contestability and the rise of market power.
Targeting the number of operators and regulating the general flow of traffic for all vehicles
covering the full road network within Metro Manila will require deeper analysis of the scope
and capabilities of the regulator vis-a-vis the bus operators and private motorists. The social
costs of addressing congestion through other means should also be assessed in future studies.
Such may include appropriate infrastructure improvements, development of mass transport
systems, imposition of price control and road use fees, and information asymmetry remedies.
Identifying the correct mix of policies is however beyond the scope of this diagnostic report.
The way forward for the bus transport sector should optimise the trade-off between social
costs and benefits of policy augmentation, execution, and enforcement. Due consideration
should be given to the welfare of industry operators, the common worker including drivers
and conductors, and the general commuting public.

67
6. Annexure
Equations for TWIST
The TWIST model is a simple linear version of the standard economic surplus model: Let
QD be quantity traded at the retail level, with corresponding retail price RP. On the other
hand, let QSdom be the domestic at the wholesale level, with corresponding wholesale price
WP. Let QS be the domestic quantity and the volume of quota. The intercepts of the demand
and supply functions are α and β, while their slopes are Dslope and Sslope, respectively.
– *QD Dslope RP
*QSdom Sslope WP QS QSdom quota
The difference between RP and WP is called the margin (mar).
Imports are computed as follows:
– import QD QSdom
To calculate the consumer surplus (CS) and producer surplus (PS), it is important to solve
first for WPe, RPe, QDe, QSdome, QSe (e denotes equilibrium), using QS=QD. The baseline
is denoted by ―0‖:
0 0 – * /DDslope Q RP
0 0 – * /SSslope Q WP,
where εD and εS, denote the elasticity of demand and supply, respectively.
The consumer surplus is computed as follows:
0.5 * – CS QDe Dinter RPe,
where /Dinter Dslope .
The producer surplus is calculated as follows:
Case 1. 0 ; 0Sinter
0.5 * – 0.5 *PS QSdome WPe Sinter Sinter
,
where /Sinter Sslope .
Case 2. 0 ; 0Sinter

68
0.5 * – PS QSdome WPe Sinter
To compute for the net revenues from imports, use the following formula:
* – – netimprev import RP mar BP
Finally, the total welfare or the economic surplus is computed as follows:
ES CS PS netimprev .
GAMS Code
***** DATA
$call =xls2gms r=sheet1!a1:b10 i=c:/TWIST/TWISTinput.xlsx o=input.inc
Table INPUT(*,*)
$include input.inc
***** MODEL
Parameters
eldem, elsup, QD0,QSdom0,QS0, RP0, WP0, mar,BP0,
DSlope, SSlope,alpha, beta,
Dinter, Sinter, quota;
Variables
RP, WP, QSdom, QS,QD, ED, IMPORT;
Equations EqQD, EqQSdom, EqQS_QR, EqWP, EqRP, EqIMPORT;
EqQD..
QD =e= alpha - DSlope*RP ;
EqQSdom..
QSdom =e= beta + SSlope*WP ;
EqQS_QR..
QS =e= QSdom + quota ;
EqWP..
WP =e= RP - mar ;
EqRP..
ED =e= (QD - QS)*(QD - QS) ;
EqIMPORT..
IMPORT =e= QD - QSdom ;
Model TWISTQR /EqQD, EqQSdom, EqQS_QR,EqWP, EqRP,EqIMPORT/ ;
***** CALIBRATION
eldem = INPUT("Elasticity_demand","Market");
QD0 = INPUT("Quantity","Market")*1000;
RP0 = INPUT("Retail_price","Market")*1000;
DSlope = -eldem*QD0/RP0;
alpha = QD0 + DSlope*RP0;
Dinter = alpha/DSlope
Display alpha, DSlope, Dinter;

69
Elsup = INPUT("Elasticity_supply","Market");
WP0 = INPUT("Wholesale_price","Market")*1000;
mar = RP0 - WP0;
quota = INPUT("Quota", "Market")*1000;
QS0 = QD0;
QSdom0 = QS0 - quota;
SSlope = elsup*QSdom0/WP0;
beta = QSdom0 - SSlope*WP0;
Sinter = beta/SSlope
Display beta, SSlope, Sinter;
BP0 = INPUT("Border_price","Market")*INPUT("Exchange_rate","Market");
Option NLP = Minos5;
Solve TWISTQR minimizing ED using NLP;
***** CHECKS
Parameter ChRP,ChQD, ChIMPORT;
ChRP = 100*(RP.L - RP0)/RP0;
ChQD = 100*(QD.L - QD0)/QD0;
ChIMPORT = IMPORT.L - quota;
Display ChRP, ChQD, ChIMPORT;
***** WELFARE
Parameters CS0, PS0, netimprev0, ES0;
CS0 = 0.5*QD.L*(Dinter - RP.L)/1000000 ;
PS0$(beta > 0) = (0.5*QSdom.L*(WP.L - Sinter) + 0.5*beta*Sinter)/1000000 ;
PS0$(beta<0) = (0.5*QSdom.L*(WP.L - Sinter))/1000000 ;
netimprev0 = (IMPORT.L*(RP0 - mar - BP0))/1000000 ;
ES0 = CS0 + PS0 + netimprev0 ;
Display Dinter, Sinter, CS0, PS0, netimprev0;
Parameter
WP1,RP1, QD1, QSdom1, QS1, import1, CS1, PS1, netimprev1,ES1,
deltCS1, deltPS1, deltnetimprev1, deltES1;
$include tariffication
*$include adjust quota
***** REDUCED QUOTA
quota = 186000
Solve TWISTQR minimizing ED using NLP ;
WP1 = WP.L ;
RP1 = RP.L ;
QSdom1 = QSdom.L ;
QD1 = QD.L ;
import1 = IMPORT.L ;
netimprev1 = (RP1 - mar - BP0)*import1/1000000 ;

70
CS1 = 0.5*QD1*(Dinter - RP1)/1000000 ;
PS1$(beta > 0) = (0.5*QSdom1*(WP1 - Sinter) + 0.5*beta*Sinter)/1000000 ;
PS1$(beta < 0) = (0.5*QSdom1*(WP1 - Sinter))/1000000 ;
ES1 = CS1 + PS1 + netimprev1 ;
deltCS1 = CS1 - CS0 ;
deltPS1 = PS1 - PS0 ;
deltES1 = ES1 - ES0 ;
Display WP1, RP1, import1,
deltCS1, deltPS1, deltES1 ;
***** TARRIFICATION
* Assumes that imports are positive even with tariff
Parameter tar ;
tar = 0 ;
WP1 = BP0*(1 + tar) ;
RP1 = WP1 + mar ;
QSdom1 = beta + SSlope*WP1 ;
QD1 = alpha - DSlope*RP1 ;
import1 = QD1 - QSdom1 ;
netimprev1 = (RP1 - mar - BP0)*import1/1000000 ;
CS1 = 0.5*QD1*(Dinter - RP1)/1000000 ;
PS1$(beta > 0) = (0.5*QSdom1*(WP1 - Sinter) + 0.5*beta*Sinter)/1000000 ;
PS1$(beta < 0) = (0.5*QSdom1*(WP1 - Sinter))/1000000 ;
ES1 = CS1 + PS1 + netimprev1 ;
deltCS1 = CS1 - CS0 ;
deltPS1 = PS1 - PS0 ;
deltES1 = ES1 - ES0 ;
Display WP1, RP1, import1,
deltCS1, deltPS1, deltES1 ;
71
References
Abad, A., 2002. Recommendations for Philippine Antitrust Policy and Regulation. In:
Toward a National Competition Policy for the Philippines. E. Medalla, ed. Philippine
APEC Study Centre Network Secretariat, Philippine Institute for Development
Studies, Makati City, 339 – 402.
Aldaba, R., and F. Aldaba, 2013. Service liberalization in the Philippines: a capacity needs
assessment for ASEAN Economic Community 2015. Philippine Journal of
Development 34(1-2): 23 – 48.
Aldaba, R., and G. Sy, 2014. Designing A Cooperation Framework For Philippine
Competition and Regulatory Agencies. Discussion Paper Series No. 2014 – 31.
Philippine Institute for Development Studies, Makati City.
Allport, Roger, et al. 1998. ―A New Approach to Setting the Future Transport Agenda.‖
EDRC Occasional Papers. June 1998. Asian Development Bank.
Bordado, G., M.E. Orden, L. Oliva, and A. Domingo, 1996. Marketing of rice by small
producer groups in selected regions of the Philippines. In: Librero, A.R. and A.G.
Tidon. Marketing of agricultural commodities by producer groups in the Philippines.
Los Banos, Laguna: PCARRD and IDRC, 1996. 419p. - (Book Series No. 158).
Briones, R., 2014. The Role of Mineral Fertilisers in Transforming Philippine Agriculture.
Discussion Paper Series No. 2014-14. Makati City: Philippine Institute for
Development Studies.
Briones, R., and D. Parel, 2011. Putting Rice on the Table: Rice Policy, the WTO, and Food
Security. Policy Notes No. 2011-11. Makati City: Philippine Institute for
Development Studies.
Briones, R., and I. Galang, 2012. Assessment of Prospective Impact of Fruits and Vegetables
Research at the Industry Level in the Philippines: the Case of the ACIAR-PCAARRD
Horticulture Project. Discussion Paper Series No. 2012-40. Makati City: Philippine
Institute for Development Studies.
Button, K. 2010. Transport Economics. Edward Elgar Publishing. Cheltenham.
Cabling, J., and D. Dawe, 2007. "Filipino farmers receive high palay prices." In: D. Dawe, P.
Moya, and C. Casiwan, eds. Why does the Philippines Import Rice? Meeting the
Challenge of Trade Liberalization. International Rice Research Institute and
Philippine Rice Research Institute, Los Baños, Laguna, Philippines.
Cororaton, C., 2004. Rice Reforms and Poverty in the Philippines: A CGE Analysis.
Discussion Paper Series No. 2004-14. Makati City: Philippine Institute for
Development Studies.
Cororaton, C., 2011. Philippines. In: Orden, D., D. Blandford, and T. Josling, eds. WTO
Disciplines on Agricultural Support: Seeking a Basis for Trade. Cambridge University
Press, Cambridge.
Cororaton, C., and J. Cockburn, 2006. WTO, Trade Liberalization, and Rural Poverty in the
Philippines: Is Rice Special? Review of Agricultural Economics 28 (3): 370-377.
David, C. 2003. "Agriculture." The Philippine Economy: Development, Policies,
andChallenges. A. Balisacan and H. Hill, eds. Ateneo de Manila University Press.

72
Dawe, D., P. Moya, C. Casiwan, and J. Cabling. 2008. Rice marketing systems in Philippines
and Thailand: Do large numbers of competitive traders ensure good performance?
Food Policy 33(5):455-463.
Department of Transportation and Communication (DOTC), Republic of the Philippines
(2012) Development of a Mega Manila Public Transportation Planning Support
System, Final Report.
Edillon, R., 2004. Supply Elasticities of the Crop Sector in the Philippines: Estimates and
Explanations. (Processed.)
Hayami, Y., and M. Kikuchi. 2000. A Rice Village Saga: Three Decades of Green Revolution
in the Philippines. Barnes and Noble, International Rice Research Institute, and
Macmillan Press.
Intal, P. J., L. Cu, J. Illescas, 2012. Rice Prices and the National Food Authority. Discussion
Paper Series No. 2012-27. Makati City: Philippine Institute for Development Studies.
Intal, P. Jr., and M. Garcia, 2005. Rice and Philippine Politics. Discussion Paper Series No.
2005-13. Makati City: Philippine Institute for Development Studies.
Intal, P., and J. Power, 1991. The Philippines. In: A. Krueger et al (eds.), The Political
Economy of Agricultural Pricing Policy Vol. 2: Asia. Baltimore and London: Johns
Hopkins University Press, 149 – 94.
Integration Study (MMUTIS), Final Report, Almec Corporation, Pacific Consultants
International and Yachiyo Engineering Co., Ltd.
Japan International Cooperation Agency (1999) Metro Manila Urban Transportation
Japan International Cooperation Agency (2007) Mega Manila Public Transport Study
Lantican, F., K. Quilloy, and M. Sombilla, 2011. Estimating the Demand Elasticities of Rice
in the Philippines. Final report submitted to the Philippine Rice Research Institute.
Los Baños, Laguna : SEARCA.
Mangahas, M, A. Recto and V. Ruttan. 1966. Production and market relationship for rice and
corn in the Philippines. Laguna, Philippines: International Rice Research Institute.
Mears, L., and T. Anden, 1970. Who benefits from the post-harvest rice price rise?
Philippine Review of Economics and Business 7(20): 1 – 25.
Medalla, E., 2002a. Overview and Integrative Report. In: Toward a National Competition
Policy for the Philippines. E. Medalla, ed. Philippine APEC Study Centre Network
Secretariat, Philippine Institute for Development Studies, Makati City, 1 – 32.
Medalla, E., 2002b. Government Policies and Regulations: Interface with Competition
Policy. In: Toward a National Competition Policy for the Philippines. E. Medalla, ed.
Philippine APEC Study Centre Network Secretariat, Philippine Institute for
Development Studies, Makati City. 307 - 338.
Medalla, E., 2014. Using the social rate of discount in evaluating public investment in the
Philippines. Policy Notes 2014-02. PIDS, Makati City.
MMPTS, Final Report, Pacific Consultants International Philippines, Inc. and U.P. Planning
and Development Research Foundation, Inc.
Montalbo, C and Ishida, H. 1997. Assessments of Cost of Bus Transit Operations in Metro
Manila. Journal of the Eastern Asia Society for Transportation Studies, Vol. 2, No. 5.

73
Reeder, M., 2000. Asymmetric prices: implications on trader‘s market power in the
Philippine rice. Journal of Philippine Development, 49 v. 27 (1), 49-69.
Roumasset, J., 2000. Market Friendly Food Security: Alternatives for Restructuring NFA,
Unpublished paper, Department of Economics, University of Hawaii, Honolulu.
Rufino, C., 2008. Inter-Regional Integration of the Philippine Rice Market. DLSU-AKI
Working Paper Series 2008-06. Manila City : De La Salle University.
Senate Economic Planning Office, 2010. Subsidizing the National Food Authority. Policy
Brief PB-10 04, SEPO, Manila.
Sombilla, M., and K. Quilloy, 2013. Strengthening the Philippine Rice Seed System.
Tadem, T., 2002. NGOs Organizing Cooperatives: The Philippine Case. In: Asian Review
2002, Vol. 15: Popular Movements. Institute of Asian Studies, Chulalongkorn
University, Bangkok. pp. 62-77.
Transportas Consulting Co. 2006. EDSA Bus Route Revalidation Survey. Japan Internal
Cooperation agency (JICA). Manila, Philippines.
Umali, D., and B. Duff, 1992. The Philippine Rice Marketing System: Implications for Grain
Quality Improvement. In: Unnevehr, L., B. Duff, and B. Juliano (eds.), 1992.
Consumer Demand for Rice Grain Quality. International Rice Research Institute:
Philippines.
University of the Philippines NCTS, ―Development of a Mega Manila Public Transportation
Planning and Support System‖, Accessed November 2013.
World Bank, 2005. ―Chapter 8: Roads‖, in The World Bank, Philippines: Meeting
Infrastructure Challenges. Manila, Philippines.
Yao, R., G. Shively, and W. Masters, 2007. How Successful are Government Interventions in
Food Markets? Insights from the Philippine Rice Market. Philippine Journal of
Development, 62 v. 34 (1), 35-59.
