implications of a long term increase in oil prices for tourism
TRANSCRIPT

Implications of a long-term increase in oil prices fortourism
Author
Becken, Susanne, Lennox, James
Published
2012
Journal Title
Tourism Management
DOI
https://doi.org/10.1016/j.tourman.2011.02.012
Copyright Statement
© 2012 Elsevier. This is the author-manuscript version of this paper. Reproduced in accordancewith the copyright policy of the publisher. Please refer to the journal's website for access to thedefinitive, published version.
Downloaded from
http://hdl.handle.net/10072/51812
Griffith Research Online
https://research-repository.griffith.edu.au

1
Implications of a long term increase in oil prices for
tourism
Susanne Becken (Lincoln University, Griffith University) and James Lennox (Landcare
Research), Published in Tourism Management
Please cite as:
Becken, S. & Lennox, J. (2012). Implications of a long term increase in oil prices for tourism.
Tourism Management, 33(1), 133-142.
1. Introduction
Concern over the availability of oil as a finite natural resource has been prevalent since the oil
crises in the 1970s. More recently, speculations about peak oil have sparked substantial
interest, reflected in an increasing number of scientific publications, dedicated websites (e.g.
www.theoildrum.com) and media coverage. Examples include “Global downturn cushioned
peak oil impact” (Waters, 2010, ABC news) and “A new era of cheap oil is just wishful
thinking” (Halligan, 2008, Telegraph). Despite differences in the various oil assessments
(Bentley, 2002; Campbell & Laherrere, 1998; Greene, Hopson & Li, 2006; Hirsch, 2008),
there now seems to be a wide belief that conventional oil is likely to decline in the near
future, probably before 2020 but no later than 2030 (UK Energy Research Centre, 2009). The
International Energy Agency’s (IEA) World Energy Outlook (2009) estimates that non-OPEC
conventional oil production peaks around 2010, which means that the predicted global oil
2
demand growth of 1% p.a. from 2007 to 2030 needs to be meet with oil from increased
production of OPEC countries and of non-conventional resources (e.g. oil sands).
A large number of factors influence the price of oil in the short term, but long term prices are
driven by world oil demand and supply, which is ultimately limited by resources. Several
studies show the negative economic impacts of oil supply shocks for net oil-importing
countries (Blanchard & Gali, 2007; Jones, Leiby & Paik, 2004). Countries’ oil vulnerability
depends on a range of market and supply factors, such as share of oil costs in national income,
the intensity and technical efficiency of use of oil in production, flexibility of the labour
market, the ratio of value of domestic reserves to oil consumption, exposure to geopolitical
risks, and the availability of alternative energy sources and the ability to substitute to these
(Gupta, 2008; Peersman & Robays, 2009). Also, some individual industries are more
vulnerable to high oil prices than others. The aviation industry alone, for example, currently
consumes 6.3% of world refinery production (Nygren, Aleklett & Höök, 2009).
Tourism is clearly dependent on oil, largely because of its inherent transport component
(Becken, 2008). Additionally, there are a range of particularly vulnerable tourism activities,
such as recreational activities that depend substantially on fossil fuels (e.g. scenic flights,
jetboating, and boat cruises, Becken & Simmons, 2002). Countries that rely strongly on
tourism as an export industry are potentially relatively more vulnerable than those that do not
rely on people being transported between and within destinations. Current tourism forecasts,
both by the United Nations World Tourism Organisation for global travel and by national
agencies such as the New Zealand Ministry of Tourism indicate on-going growth, ignoring
potential impacts of higher oil prices. This oversight is risky, especially when major
investments, such as expansions of airports, are made based on expected demand increases.

3
Tourism has proven relatively resilient to many adverse events, including terrorism,
pandemics, flight disruptions due to the volcanic ash cloud in April 2010, climate change
concerns and high fuel prices. However, the extreme increase in operating costs for airlines in
2008 due to unprecedented prices for aviation fuel also meant, that despite the introduction of
fuel charges, the global airline industry recorded record losses (in the order of US$ 5.2 billion
for the year 2008, International Air Transport Association, 2008). Even if alternative fuels
become commercially available for airlines they are still likely to be more expensive than
present aviation fuel. Higher airfares in the future are likely to lead to reductions in travel and
cause tourists to shift from more distant to closer destinations (e.g. Gillen, 2004). While some
of the economic responses to higher oil prices are obvious, assessing the overall economic
impacts on tourism is difficult. Long-term changes in global oil price rises will be
concomitant with global changes in other commodity prices, exchange rates, and incomes. It
is therefore important to consider the impacts of high oil prices on tourism from a general
equilibrium perspective, rather than relying only on bottom-up, partial equilibrium
approaches.
This paper describes a two-stage modelling approach to construct and analyze high oil price
scenarios for New Zealand. In the first stage, we use a global general equilibrium model to
simulate a negative productivity shock to global oil production that causes a 100% increase in
global oil prices. From these simulation results, we determine (a) macroeconomic impacts on
tourist origin countries and so the effect on tourism demand from these countries, (b) the
changes in relative prices of goods and services imported to and exported from New Zealand,
and (c) changes in demand for New Zealand’s non-tourism exports. These changes are then
analysed using a purpose-built CGE model of New Zealand, which focuses on describing
tourism supply and demand in some detail.

4
2. Background
Research in Scotland (Yeoman et al., 2007) and more recently in New Zealand (Becken,
2008; Becken & Schiff, 2011) suggests that tourism is likely to suffer in an environment of
high oil prices. Given that tourism destinations typically receive tourists from a range of
origins it would be useful to understand if some countries are more vulnerable to increasing
oil prices than others. Several studies provided evidence that net oil importing countries are
more vulnerable to higher oil prices than oil exporting countries (Gupta, 2008; International
Monetary Fund, 2006). For the particular case of New Zealand, Figure 1 shows the top ten
countries of origin for international visitor arrivals and the percentage of net oil imports or
exports in their GDP. Only Canada is a net oil exporter.
Fig. 1. Top 10 countries of origin for New Zealand international visitors and importance of oil in GDP
(Source: NZ Ministry of Tourism, 2009, UN Statistics Division, 2008) (Note: Singapore differs from
the other countries in that it is a major oil refiner and trade hub).

5
New Zealand is a long-haul destination for all of its major markets, except for Australia, and
major increases in the cost of international air transport threaten international tourism to New
Zealand (Becken, 2008). Recent work by Small and Sweetman (2009) indicates that based on
tourist arrivals between 1996 and 2008, changes in the oil price and airfares each had
significant but weak effects on tourist arrivals to New Zealand. Other macroeconomic
variables are generally found to be more important, especially income (Davis & Mangan,
1992; Dritsakis, 2004; Munoz & Amaral, 2000). Income in countries of origin influences both
travel propensity and distance (Nicolau, 2008; Lim, Min & McAleer, 2008). In many cases,
higher oil prices are likely to be associated with negative income effects that are likely to
reduce global tourism and redistribute flows (Becken, Ngyen & Schiff, 2010). Reduced
economic activity is also likely to result in reduced volumes of business travel (Njegovan,
2005).
While both economic theory and empirical studies (e.g. on income effects) indicate negative
impacts on tourism demand, the exact effects of higher oil prices for specific destinations are
far from clear. First, different market segments show different sensitivities to price changes. It
is plausible that visitors to long haul destinations are generally wealthier than average and
therefore potentially less affected, as energy costs would be a smaller proportion of their
income compared with those from less wealthy groups. No research could be found on such
differential effects in countries of origin. Second, oil prices do not linearly translate into
higher transport costs, especially not on air routes that are highly competitive and that are
maintained for strategic reasons. Third, many other factors shape tourists’ decision making,
including emotional drivers or those related to images, fashions and perceptions. Increasing
environmental awareness of tourists could also be an important factor in the future (Becken,
2007).

6
Apart from international transport, tourism is also reliant on oil for most in-country transport
and many tourism activities. For example, tourism in New Zealand is comparatively energy
intensive, largely due to high use of cars, vans and domestic air transport. More recently,
Becken and Schiff (2010) have analysed the impact of transport prices1 on tourists’ travel
choices within New Zealand, finding that travel patterns are rather price-insensitive but differ
significantly between market segments based on tourist origins and other characteristics. A
related study on price elasticities established quite different values for 18 international tourist
market segments. This research also highlighted the importance of exchange rate both for
arrivals to New Zealand and consumption of tourism products and services within the country
(Schiff & Becken, 2011). It can therefore be assumed that an increase in prices (due to oil or
other factors) will affect both the market composition and tourist behaviour.
Changes in tourism activity clearly have wider economic implications, especially in countries
like New Zealand where tourism is very important to both the national and local economies.
Detailed information on the supply of tourism characteristic industries (e.g. domestic aviation
and accommodation) and tourism related industries (e.g. retail) may be found in Tourism
Satellite Accounts. As well established in the tourism literature, tourists’ expenditure will
filter through the entire economy and may provide an important impetus for overall economic
activity. The flow-on effects of tourism expenditure to other industries may be quantified
using input-output multipliers.
Much of the literature on macroeconomic impacts of oil prices has focussed on price shocks
resulting from events that are discrete and relatively short-lived (embargoes, wars, etc.). The
1 The analysis of transport prices included changes in fuel costs between 1997 and 2007; the higher oil prices of
2008 are not reflected in the analysis due to data availability at the time.

7
long-run implications of enduring changes to supply- and demand-side conditions may differ
qualitatively, for example due to investment responses of producers, consumers and
governments in alternative energy sources and more energy-efficient plant, vehicles and
infrastructure. Only a few recent studies begin to address the issue from this perspective (e.g.
Schubert & Turnovsky, 2011). It is the aim of this present study to analyse the implications of
a long term increase in oil prices for a specific tourism destination, namely New Zealand.
3. Building and testing the model
3.1 Modelling approach
Computable general equilibrium (CGE) models are widely used to study economy-wide
impacts of domestic or external economic shocks and may be used in studying long-run
impacts of supply- and/or demand-side developments in the energy sector. For example,
Ciscar, Russ, Parousos and Stroblos (2004) use the GEMINI-E3 model to simulate supply-
side restrictions yielding a US$30 increase in the oil price. Here we adopt a similar modelling
approach using the commercially available Global Trade Analysis Project (GTAP) model to
simulate a global negative productivity shock in the oil sector, yielding a 100% increase in
world oil prices. Our choice of the GTAP model is motivated in part by the relatively high
(for a global CGE model) number of countries (including New Zealand) and industries that
may be distinguished, as well as by purely practical considerations (commercial availability
and familiarity).
‘General purpose’ CGE models such as GTAP do not, however, provide an explicit or
detailed representation of tourism demand, nor a detailed representation of tourism
characteristic industries. Supply or demand-side shocks leading to high oil prices are liable to
affect both tourism demand and costs of tourism characteristic industries. We therefore adopt

8
a two-stage approach, first using the GTAP model to construct a coherent global scenario
involving a doubling of oil prices, and then use results from this scenario to shock the
tourism-specific New Zealand Tourism General Equilibrium Model (NZTGEM) (Lennox,
2010). The simple linking approach adopted (Horridge & Ferreira-Filho, 2003) allows us to
account for both global general equilibrium effects, as well as to model in detail impacts on
the New Zealand tourism sector and wider economy, incorporating features and data that
could not easily be built directly into a global CGE model.2
The main limitation of our approach is that global interactions within the tourism sector (e.g.
substitution between destination countries) are not well accounted for. Modelling such effects
within a global CGE model would, however, be empirically very challenging, given current
limitations of global datasets and scarce estimates of key behavioural parameters (i.e.
elasticities). We are aware of only one attempt (Berrittella, Bigano, Roson & Tol, 2006) to
model tourism within a global CGE model.
3.2 GTAP scenarios
We use the GTAP model to simulate negative supply-side shocks to oil sector productivity in
all countries that result in a long-term doubling of global oil prices.3 This scenario is designed
not so much for its realism as for its simplicity and illustrative value. Constructing a ‘realistic’
2 A technically superior, but more complicated approach would be to ‘hard-link’ the two models (Bohringer &
Rutherford, 2009); effectively replacing the representation of New Zealand in GTAP with NZTGEM.
3 While the GTAP v7 benchmark data nominally pertain to the year 2004, this doubling of oil prices should not
be interpreted with reference to the particular average oil price level in 2004, but to any doubling of average oil
prices from a ‘reasonably’ similar initial level. Indeed, as we model a long-run response, the ‘average price’
refers to a period of several years, if not longer.

9
future scenario would require consideration of differential rates of economic growth,
technological improvement, depletion of oil resources, development of alternative resources,
etc. Given the wide range of possible developments along many of these dimensions, this
would not add greatly to our analysis of impacts on New Zealand tourism.
We aggregate countries in GTAP distinguishing New Zealand and eight individual countries
of importance for tourism (Australia, United States of America, Canada, United Kingdom,
Germany, Japan, China and South Korea) and three other country groups (Rest of the
European Union 15, oil exporting countries, and the rest of the world). We distinguish 50
commodities so that we can link GTAP with NZTGEM at a relatively fine commodity
resolution (Lennox, 2010). The GTAP scenario outputs used are: i) Real and nominal gross
domestic product (GDP) for each country/group, ii) Consumer price index (CPI) for each
country/group, iii) New Zealand export prices and quantities, and iv) New Zealand import
prices.
3.3. Modelling tourism and economy-wide impacts in New Zealand
NZTGEM models the New Zealand economy, providing a detailed representation of tourism
demand and supply, distinguishing five types of accommodation and seven modes of
domestic transport. The model and the underlying tourism social accounting matrix (SAM)
are described in detail in Lennox (2010). Non-tourism features are based largely on the model
described in Lennox and van Nieuwkoop (in press). NZTGEM builds on a now well-
established tradition of tourism-specific CGE modelling, to which early contributions were
made by Blake (2000) and by Madden and Thapa (2000), studying the economic impacts of
tourism in Spain and Australian State of New South Wales respectively. Naturally, a great
deal of attention has been paid to very small tourism-dependent economies (e.g. Blake,

10
Sinclair & Sugiyarto, 2003; Narayan, 2004; Sinclair, Blake & Gooroochurn, 2005; Yeoman et
al., 2007), but this is the first such model developed for New Zealand.
For this study, we have specified foreign demands for non-tourism exports with finite rather
than infinite elasticities (as in the standard NZTGEM model). This is necessary to replicate
the changes in export demands simulated using GTAP, reproducing percentage changes in
both export prices and quantities. Elasticities were derived from the GTAP model. We retain
our specification of import supply as infinitely elastic. Consequently, we can replicate only
the percentage changes in import prices (not quantities) simulated with GTAP.
We distinguish international tourism demand from ordinary export demands and domestic
leisure tourism demands within household consumption. The 18 international plus one
domestic tourist market segments differ in the composition of expenditure and in behavioural
parameters (elasticities). Data on the composition of tourist expenditure is based on an
analysis of the ‘consumption bundles’ of 18 market segments (Becken, Carboni, Vuletich &
Schiff, 2008). In these, tourist expenditure is disaggregated based on five spending categories:
accommodation, air transport within New Zealand, other transport, fuel, and other (including
hospitality, attractions and retail) (Figure 2). In addition, information on tourists’ expenditure
on international airfares provided through the International Visitor Survey was analysed. The
typical expenditure for air travel to New Zealand was taken as the median airfare reported for
each segment in 20064.
4 The median was used rather than the mean to minimise the effect of some excessively high and low airfares
that have been reported in the IVS historically.

11
Fig. 2. Consumption bundles for 18 market segments in New Zealand for 2007 (for better readability
domestic air and land transport were combined into ‘transport’) (based on Becken et al., 2008).
We model substitution at a number of levels. At the lowest level, we allow for some
substitution between specific products types (e.g. within the category of accommodation:
hotels, models, camping, backpacker, other commercial and other non-commercial). At an
intermediate level, we allow for substitution between the accommodation, travel in-country,
and other expenditure. At the top level, we allow for substitution between in-country
consumption and travel to and from New Zealand (Table 1). As we model behaviour at the
aggregate level of market segments, rather than at the level of individual tourists, these
substitution possibilities encompass both individual responses and changes in market
composition (within a segment) in response to relative price changes. They also encompass
0% 20% 40% 60% 80% 100%
Australia FIT Holiday
Australia FIT VFR
Australia FIT Other
Australia Tour
UK Holiday
UK VFR and Other
USA FIT Holiday
USA FIT VFR and Other
USA Tour
Japan FIT Holiday
Japan FIT VFR and Other
Japan Tour
South Korea All
China FIT
China Tour
Germany All
Rest of World FIT
Rest of World Tour
TRANSPORT FUEL ACCOMMODATION ALL OTHER

12
changes in quality attributes and length of stay. We model product substitution in the
domestic leisure market in the same way, as well as substitution between domestic leisure
tourism and international air travel, which we take as a proxy for outbound international
tourism. A composite of domestic leisure and outbound international tourism is then
substitutable with non-tourism consumption of households.
For inbound international tourists, we model the influences of the overall price level for New
Zealand tourism (including international air travel) and of income in a reduced form. That is,
we model responses with price and income elasticities, rather than attempting to model tourist
behaviour more comprehensively (accounting for substitution between alternative
international and domestic destinations and for the overall price and income elasticities of
tourism consumption).
Table 1 Elasticities for 18 tourist segments to New Zealand
Segment Own-price elasticity
of NZ tourism
Elasticity of substitution
between International
Air and In-Country
Australia FIT Holiday −1.69**
0.54**
Australia FIT Other −1.89 0.12
Australia FIT VFR −1.27**
0.16
Australia Tour −1.42**
0.16*
UK Holiday −1.81**
0.25**
UK VFR and Other −1.28**
0.31*
Germany All −1.295+ 0.33
USA FIT Holiday −0.78**
0.56**
USA FIT VFR and Other −0.95**
0.44*
USA Tour −1.66**
0.97**
Japan FIT Holiday −0.67 0.32
Japan FIT VFR and Other −0.57 0.21
Japan Tour −1.31**
0.53**
China FIT −0.72+ 0.44
+
China Tour −1.31+ 0.52
**
South Korea All −1.50 0.6
Rest of World FIT −0.74++
0.42
Rest of World Tour −1.43++
0.57**
FIT = Free, independent traveller; VFR = visiting friends and relatives; Tour = tour group
13
Based on Lennox and Schiff (2008) and Lennox (2010). *Statistically significant at 10% level. **Statistically significant at 5% level.
+Replaced originally estimated insignificant and implausible value with value based on expert judgment.
++No original
estimates. Value based on expert judgment.
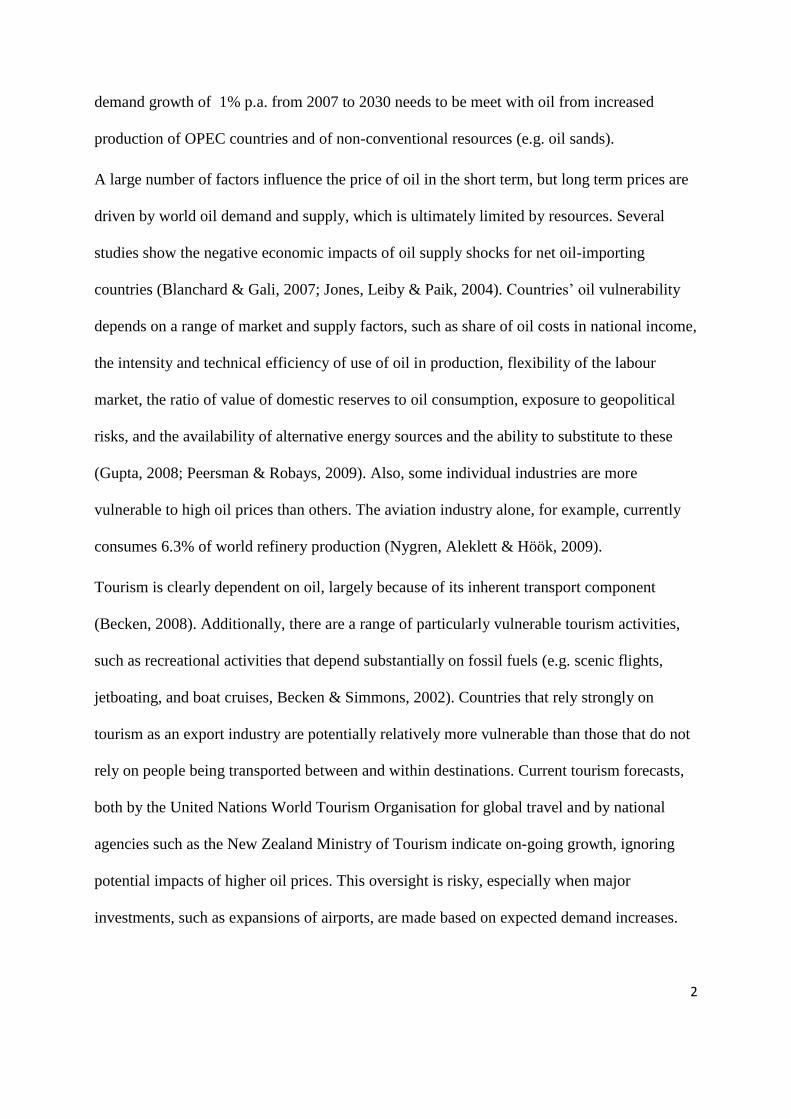
Elasticities of substitution between international air travel and in-country consumption tend to
be relatively low (all but one of the statistically significant values is below 0.6). This seems
intuitively reasonable. International travel is effectively an unavoidable component of any
individual tourists’ visit. Individual tourists may, however, vary the length of their visit to
New Zealand and/or vary the quantity and quality of in-country goods and services.
Furthermore, at the level of aggregate visitor markets, individual tourists may enter or exit NZ
inbound markets. We have not estimated the elasticity of substitution between domestic
leisure travel and outbound international travel econometrically, but assume an elasticity of
substitution of 2. This is justified on the grounds that (at least for leisure tourism) domestic
and international travel are gross substitutes. This seems intuitively logical and is supported
empirically by e.g. Njegovan’s (2006) finding of positive cross-price elasticities for the UK.
Differences in destination characteristics and travel purpose clearly preclude a very high
elasticity. However, we choose a value greater than 1 given the affordability and relatively
similar characteristics of major Australian destinations for New Zealanders. We also test the
sensitivity of the results to a lower value of 1.
Since high oil prices involve significant changes in national income, we also attempt to
account for the income effects on demand for New Zealand tourism. We assume that
percentage changes in tourists’ income are identical to percentage changes in national income
of their origin countries. Also, we have not estimated income elasticities of demand for New
Zealand tourism econometrically, but assume values of 2.0 for all international market
segments. This is generally consistent (if not conservative) with studies in the literature that
find high income elasticities for international travel (e.g. Bonham et al., 2009 [elasticities of
14
2.23-3.96]; Davies & Mangan, 1992 [elasticity of 2.10]; Dritsakis, 2004 [elasticities of 2.16-
6.02]; Munoz & Amaral, 2000 [2.07]).
As the values of most of these elasticities are quite uncertain, we test the sensitivity of the
results to these uncertain parameters by running alternative simulations, halving each
elasticity or set of elasticities (i.e. for all international markets simultaneously) in turn.5
4. Results
The results will be presented in two sections. The macroeconomic effects as modelled through
GTAP will be shown first, followed by tourism-specific results which are derived from the
national NZTGEM.
4.1 Countries of origin
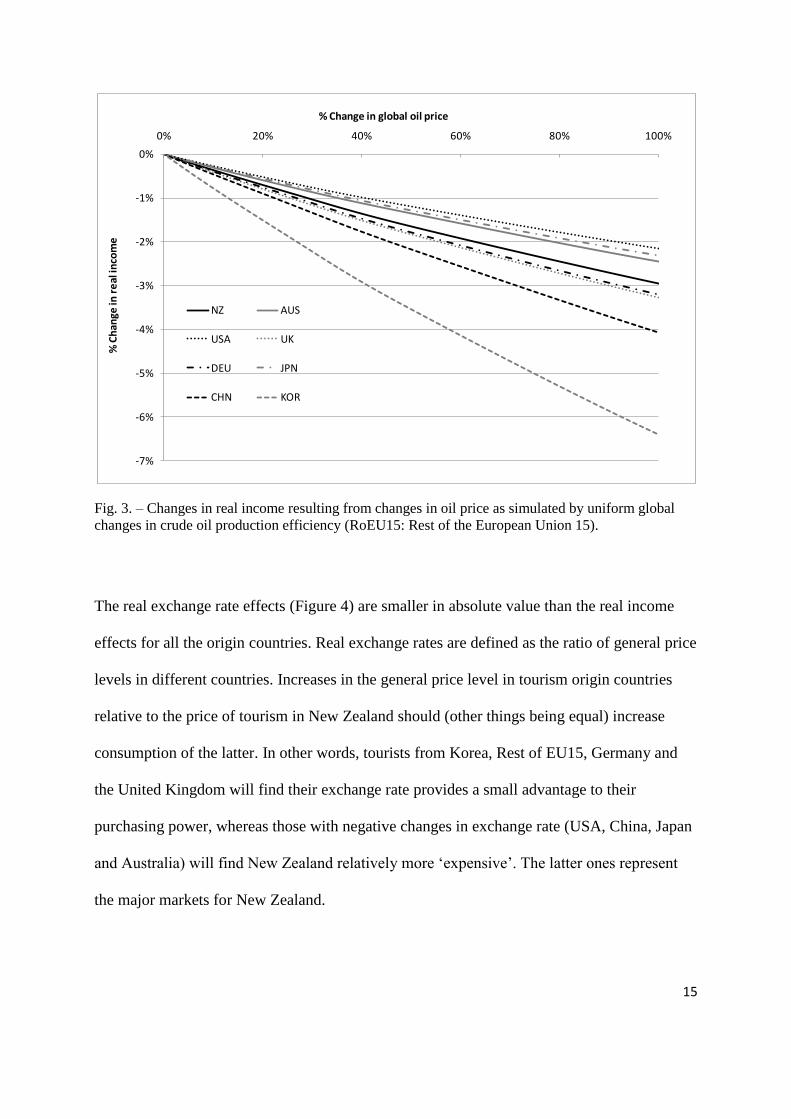
Impacts on real income differ vastly between the nine countries in the model, following oil
price increase up to 100%. South Korea, followed by China, suffers the greatest fall in real
income in the order of 4-6% (Figure 3). The seven developed countries fall into two groups:
one, comprising the USA, Japan and Australia, suffering slightly less reduction of real income
than New Zealand, Germany, UK and the Rest of the European Union 15. These results are
consistent with other findings that developing countries are generally likely to be worse
affected by higher oil prices than developed countries (Gupta, 2008).
5 We found the effects to be approximately symmetric when elasticities are doubled instead of halved, so
present results only for the latter cases.
15
Fig. 3. – Changes in real income resulting from changes in oil price as simulated by uniform global
changes in crude oil production efficiency (RoEU15: Rest of the European Union 15).
The real exchange rate effects (Figure 4) are smaller in absolute value than the real income
effects for all the origin countries. Real exchange rates are defined as the ratio of general price
levels in different countries. Increases in the general price level in tourism origin countries
relative to the price of tourism in New Zealand should (other things being equal) increase
consumption of the latter. In other words, tourists from Korea, Rest of EU15, Germany and
the United Kingdom will find their exchange rate provides a small advantage to their
purchasing power, whereas those with negative changes in exchange rate (USA, China, Japan
and Australia) will find New Zealand relatively more ‘expensive’. The latter ones represent
the major markets for New Zealand.
-7%
-6%
-5%
-4%
-3%
-2%
-1%
0%
0% 20% 40% 60% 80% 100%
% C
han
ge in
re
al in
com
e% Change in global oil price
NZ AUS
USA UK
DEU JPN
CHN KOR

16
Fig. 4. – Changes in real exchange rates (relative to NZ$) resulting from changes in oil price as 4.2
New Zealand macroeconomic impacts
A 100% increase in world oil prices leads to a 0.9% decrease in gross domestic product
(GDP) and a 1.7% decrease in real gross national disposable income (RGNDI). Higher import
prices, particularly for oil and petroleum products, cause the aggregate volume of imports to
fall 3.8%, although the real value of imports decreases only 1.0%, due to the higher world
prices of petroleum in particular. Decreases in demand for exports cause their aggregate
export volumes to fall by 2.6% and their real value to fall 2.4% (Table 2). Tourism is affected
much more severely, with exports falling 11.0% in volume and only slightly less (9.0%) in
value. The accommodation sector, which is central to tourism supply, is modelled to decrease
by 4.6% in volume and slightly more (5.8%) in value. Tourists demand less accommodation
and its real price falls in response to reduced demand. This could reflect not only reduced
-1.5%
-1.0%
-0.5%
0.0%
0.5%
0% 20% 40% 60% 80% 100%
% C
han
ge i
n r
eale
xch
ange
rat
e w
ith
New
Zea
lan
d
% Change in global oil price
NZ AUS
USA UK
DEU JPN
CHN KOR

17
arrivals, but reduce length of stay and reductions in the ‘quality’ of accommodation
consumed.
Table 2 Macroeconomic changes in New Zealand under the assumption of a 100% increase in oil price
% change in
volume
% change in real
value
Real GDP -0.9 n.a.
RGNDI n.a. -1.7
Imports -3.8 -1.0
Exports -2.6 -2.4
Tourism exports -11.0 -9.0
Accommodation gross output -4.6 -5.8
4.3 New Zealand market-specific impacts
Considering first the impacts on total tourist consumption (i.e. international airfare plus in-
country consumption) in Table 3 (left half), the large variation of price and quantity changes
both within and between countries can be noted. The largest price increase of 10.0% is
observed for tourists from the United Kingdom who travel for visiting friends or other reasons
(usually business) (UK VFR Other). This is despite a slightly favourable exchange rate
effect. The smallest price increase is only 1.5%, namely for Australian tour group visitors.
Other Australian markets also see relatively small increases in price, explained by the
relatively small component of airfares in the total tourism consumption bundle and relatively
lower jet fuel costs as a share of the airfare compared with long-haul flights.
Changes in prices affect markets differently because of large variations in price elasticities of
New Zealand tourism. In addition, changes in income significantly affect demand in all
markets. Hence, even those markets that experience similar real price changes can respond
quite differently. For example, a price increase of 3.1% for South Korea is accompanied by a
quantity decrease of 17.2%, while price increases of between 3.5 and 5.0% for different

18
Japanese market segments are accompanied by decreases in quantity of between 6.8 and
9.4%. For the British markets, a price increase of 7.9% for holiday visitors is accompanied by
a 18.6% decrease in quantity, while UK VFR Other respond less strongly (decrease in
quantity of 17.5%), despite a more pronounced price increase of 10.0%. Demand from
Chinese tour group visitors and South Korean tourists will reduce substantially under the
selected high oil price scenario. In the case of China, effects of higher tourism prices due to
higher oil prices are exacerbated by real exchange rate effects.
The real value of tourist consumption – as opposed to changes in quantity – is important as it
gives an indication of how much tourists spend. Value represents a combination of changes in
price and quantity, and it can be seen that while tourist expenditure (value) decreases for all
market segments in terms of total tourism consumption, it does so to a lesser degree than
quantity, because real prices of tourism rise overall (Table 3). The greatest effect can be
observed for British VFR and Other tourists, where a large decrease in quantity (17.5%) is
associated with a much lesser (9.2%) decrease in real expenditure.
Table 3 Impacts on inbound international and domestic tourism consumption (% change)
Total consumption In-country consumption
Price Quantity Value Price Quantity Value
Domestic Leisure n.a. n.a. n.a. 6.3 0.7 7.0
Australia FIT Holiday 3.8 -10.8 -7.4 2.1 -10.0 -8.4
Australia FIT Other 2.1 -8.7 -6.8 -0.4 -8.4 -9.1
Australia FIT VFR 3.5 -9.2 -6.0 0.8 -8.8 -8.4
Australia Tour 1.5 -7.1 -5.7 -0.2 -6.9 -7.4
UK Holiday 7.9 -18.6 -12.2 0.4 -17.1 -16.5
UK VFR and Other 10.0 -17.5 -9.2 0.2 -15.1 -14.6
Germany all tourists 6.2 -13.7 -8.3 0.3 -12.0 -11.4
USA FIT Holiday 7.3 -9.7 -3.1 2.7 -7.5 -6.4
USA FIT VFR and Other 5.9 -9.6 -4.3 1.6 -7.9 -7.8
USA Tour 4.8 -11.5 -7.3 0.9 -8.2 -8.7
Japan FIT Holiday 5.0 -8.0 -3.4 0.5 -6.7 -7.0
Japan FIT VFR and Other 3.5 -6.8 -3.5 0.1 -6.1 -6.8
Japan Tour 3.8 -9.4 -5.9 -0.1 -7.5 -8.3
China FIT 4.0 -11.0 -7.4 0.5 -9.7 -10.4

19
China Tour 6.3 -15.4 -10.0 0.2 -12.7 -13.8
South Korea All 3.1 -17.2 -14.7 -1.2 -15.1 -15.8
Rest of World FIT 7.2 -11.7 -5.4 -0.4 -9.0 -8.8
Rest of World Tour 5.3 -13.5 -8.9 -1.1 -10.4 -10.9 FIT = Free, independent traveller; VFR = visiting friends and relatives; Tour = tour group.
The right-hand half of Table 3 shows changes to in-country consumption, i.e. focusing on
tourism within New Zealand and excluding international travel to and from New Zealand. The
most significant price increase is observed for domestic leisure tourism. This is largely driven
by petrol and diesel prices for transport. The two international market segments that see
significantly higher prices within New Zealand are American and Australian FIT holiday
tourists. These market segments are also characterised by considerable fuel cost shares (5.5%
for the Australian and 3.1% for the American segment, respectively). In contrast, the Japanese
FIT holiday segment has a fuel cost share of only 1.1%, and the in-country price increase is
just 0.5%. A number of segments (e.g. South Korea) observe real price reductions as a result
of general equilibrium effects; in some cases, despite unfavourable changes in the real
exchange rate.
In-country consumption decreases significantly for all market segments, including domestic
tourists. This is less a result of increased prices, but of flow-on effects from reduced demand
for New Zealand tourism as discussed earlier in relation to ‘total consumption’. Reduced
demand is driven to a large extend by higher international airfares and lower real incomes.
However, the quantity changes for in-country consumption are somewhat smaller than those
for overall tourism consumption. This difference is greatest for tour group visitors from the
USA, for whom total consumption falls 11.5% while in-country consumption falls only by
8.2%. This can be explained by substitution at the individual and, more importantly, the
aggregate market segment level between international air travel and in-country assumption.
20
For example, the fewer tourists who arrive may have a longer average length of stay. They
might also consume a greater quantity or higher quality of products during their stay. It might
be that higher prices for tourism overall will discourage price-conscious tourists, but not more
affluent and high-spending tourists.
Changes in the value of in-country consumption are generally relatively similar to changes in
quantity. This means that from a tourist perspective, expenditure for in-country products and
services is relatively unaffected. For some markets, value actually decreases more than
quantity, for example for Chinese tour group visitors (-13.8% compared with -12.7%). The
value of domestic tourism increases by 7.0%, mainly due to an increase in the overall price
level for domestic tourism driven primarily by higher prices of petroleum products..
4.4 Sensitivity analysis
To test the importance of a range of key variables and assumptions, sensitivity analyses have
been carried out. More specifically, four sensitivity analyses have been performed, halving in
turn:
1. Income elasticity of demand for all inbound international tourism markets
2. Price elasticity of demand for all inbound international tourism markets
3. Elasticity of substitution between international air travel to/from New Zealand and in-
country tourism consumption for all inbound international tourism markets
4. Elasticity of substitution between domestic leisure tourism and outbound international
air travel (as a proxy for outbound international tourism) for New Zealand residents.

21
Compared with the ‘central’ scenario of quantity changes in demand (second column, Table
4), following a 100% increase in global oil prices and using the assumptions as detailed in the
methodology, reductions in the elasticities of income and price have the greatest effects
(columns 3 and 4 in Table 4, respectively). For example, halving income elasticities (from 2
to 1) for the Korean market means that the reduction in total tourism consumption (i.e.
quantity change in international air travel and on-the ground) is lessened (from -15.1% to -
8.4%). This highlights that the degree to which tourism is a ‘luxury good’ (i.e. income-
sensitive) has great bearings on the reductions in tourism demand for New Zealand. It also
shows the importance of income changes (here in all cases, reductions) in different origin
countries under high oil price scenarios.
Price elasticities are also important; in some cases even more important than income
elasticities. For example, reducing the price elasticity for the British holiday segments lessens
the reduction in tourism consumption substantially (from -17.1.0% to -11.5%). For the
Australian segments, changes in income and price elasticities have approximately equal
effects, whereas for the Japanese segments, the income effect dominates the own-price effect.
Changes in the elasticity of substitution between international air travel and on-the-ground
tourism products have very minor effects. This is to be expected, given the strong
complementarities between them for New Zealand. We also find that the aggregate tourism
demand is insensitive to changes in the elasticity of substitution between domestic leisure
travel and outbound international travel of New Zealanders, even though this elasticity
significantly affects the response of the domestic leisure market (Table 4, row 1).

22
Table 4 Sensitivity analysis for total consumption (% change in quantities for each case)
Central Low
income
Low price Low air-
OTG
Low domestic
– outbound
air*
Domestic leisure tourism* 0.7 0.8 0.8 0.6 -1.0
Australia FIT Holiday -10.0 -7.5 -7.3 -10.4 -10.0
Australia FIT Other -8.4 -5.8 -6.7 -8.6 -8.4
Australia FIT VFR -8.8 -6.3 -6.9 -9.0 -8.8
Australia Tour -6.9 -4.4 -5.9 -7.0 -6.8
UK Holiday -17.1 -13.9 -11.5 -17.9 -17.2
UK VFR and Other -15.1 -11.8 -10.0 -16.4 -15.1
Germany all tourists -12.0 -8.8 -8.7 -12.9 -12.0
USA FIT Holiday -7.5 -5.3 -5.1 -8.6 -7.4
USA FIT VFR and Other -7.9 -5.8 -5.6 -8.8 -7.9
USA Tour -8.2 -6.1 -4.8 -10.0 -8.2
Japan FIT Holiday -6.7 -4.3 -5.2 -7.3 -6.7
Japan FIT VFR and Other -6.1 -3.7 -5.3 -6.5 -6.1
Japan Tour -7.5 -5.2 -5.4 -8.5 -7.5
China FIT -9.7 -5.6 -8.5 -10.4 -9.7
China Tour -12.7 -8.7 -9.3 -14.2 -12.7
South Korea All -15.1 -8.4 -13.3 -16.2 -15.1
Rest of World FIT -9.0 -5.6 -6.8 -10.4 -9.0
Rest of World Tour -10.4 -7.0 -7.2 -12.1 -10.4 FIT = Free, independent traveller; VFR = visiting friends and relatives; Tour = tour group
*Domestic leisure tourism values pertain to domestic tourism only, not to total tourism consumption of New
Zealand residents.
5. Discussion
This research examined the effects of a long-run 100% increase in global oil prices resulting
from decreased global oil supply on the New Zealand economy, focussing particularly on
tourism. New Zealand itself is a net oil importer, even though it currently produces about
55,0006 barrels per day (about a third of its own consumption). Approximately two thirds of
electricity are generated from hydro, with additional renewable contributions from geothermal
and wind (Ministry of Economic Development, 2009). While New Zealand’s energy portfolio
may provide some buffering against the direct consequences of global oil supply shocks, the
6 Ministry of Economic Development figures http://www.med.govt.nz/upload/37172/A-oil-tables-1.xls

23
economy is also exposed to indirect impacts, such as higher import costs and decreased
demand for exports . This is particularly the case for international tourism, where our results
suggest that they key factors are changes in economic conditions in tourists’ home countries
and/or in the cost of international air travel.
The macroeconomic effects for New Zealand identified in this present research are consistent
with findings in other countries, where higher oil prices led to reductions in economic activity
(Naccache, 2010). An IEA (2004), for example, showed that OECD countries were vulnerable
to oil price increases despite the reduction in the degree of oil dependency in their economies
over time. For New Zealand, we modelled that a doubling of world oil prices would lead to a
0.9% decrease in GDP and a 1.7% decrease in real gross national disposable income
(RGNDI7). While these might sound relatively small, a comparison with the recent recession
highlights the potential seriousness of such reductions; notably, if such impacts are realised
rapidly and/or in the context of an otherwise weak economy. In New Zealand, the year 2009
saw a reduction in GDP by 1.6% and a contraction of RGNDI of 1.0%. Unemployment rose
to 7.3% by the start of 2010, the highest rate since 1999 (Statistics New Zealand, 2009).
Tourism is likely to be more adversely affected than the wider New Zealand economy by high
oil prices, with tourism exports falling 9.0% in real value. International visitors spent a total
of NZ$9.313 billion in New Zealand in 2009 (Statistics New Zealand, 2010b). Thus, a
reduction of 9.0% would currently mean a loss of export revenue of NZ$959 million. The
Ministry of Tourism (2010) estimated that the global recession led to a decrease in tourist
7 RGNDI takes into account changes in the terms of trades (imports versus exports), as well as real gains from
net investment and transfer of income with the rest of the world. As such it measures the “volumes of goods and
services that New Zealand residents have command over” (Statistics New Zealand, 2010a: 9).

24
expenditure by 2.2% ($136 million) in 2009 compared with the previous year. Long-term
doubling of oil prices could increase such losses substantially unless accompanied by strong
growth in international tourism demand. The analysis highlighted the potential compensatory
role played by domestic tourism in such a scenario. Due to a shift away from outbound
international towards domestic travel, the accommodation sector (which is central to tourism
supply) was slightly less affected than tourism as a whole. As a whole, the accommodation
sector is also buffered by a shift away from oil-intensive products (particularly air and rental
vehicle transport) towards accommodation and other less oil-intensive products. However,
this implies that accommodation and other tourism businesses located in less accessible
destinations may be particularly badly affected.
Tourism is currently New Zealand’s second largest export earner (after dairy) and therefore an
important pillar of the economy. However, the results show that tourism is relatively more
affected by high oil prices than most other economic sectors in New Zealand. There are two
main reasons for this. One is that tourism is a discretionary activity (our model used an
income elasticity of 2) and at times of lower incomes consumers are likely to reduce travel or
substitute to destinations closer to home (Nicolau, 2008). The inverse trend has recently been
demonstrated by Lim et al. (2008), who observed that as incomes increase for the Japanese
market, outbound tourism shifts from short haul to longer haul destinations. The other reason
is that international travel (especially long haul) is dependent on aviation, which in turn relies
on high inputs of fossil fuels. Fuel costs as a percentage of an airline’s operating cost are in
the order of 30% for long haul flights and around 17% for short haul flights (Ringbeck et al.,
2009). Compared with energy inputs of between 5-10% as proportion of revenue in other,
land-based tourism sectors these are relatively high (Becken & Carboni, 2008). The findings
presented here, therefore suggest that tourism-dependent countries might be relatively more

25
vulnerable to oil price increases than those relying on other (diversified) portfolios; however
more research in other destinations would be required to ascertain this assumption.
Impacts of oil prices are likely to be unevenly distributed across countries (Jiménez-
Rodríguez (2008). The income and exchange rate effects in our simulations suggest that
different countries of origin as well as destinations have differing degrees of vulnerability.
There are a wide range of reasons for differential vulnerability (Gupta, 2008), including, for
example, the ratio of domestic oil production to oil imports. In Gupta’s analysis Australia and
the United States were least vulnerable, whereas the Philippines, Korea, India and China were
the most vulnerable. New Zealand was classified as medium vulnerable. Negative income
effects in major countries of origin are the greatest concern, as these not only influence travel
propensity in general (e.g. Munoz & Amaral, 2000), but also moderate choice of holiday and
travel distance (Fleischer & Rivlin, 2008).
In line with this literature, our analysis suggests that of the countries considered, Korea and
China would suffer the greatest negative income impact in response to higher oil prices. Both
are important markets for New Zealand, ranking fourth and sixth of all international markets.
At the same time, these markets displayed the highest tourism growth rates following the
recession, hence presenting important future opportunities for New Zealand tourism. Close
monitoring of these markets in the light of increasing oil prices might prove beneficial. On the
other hand, the USA, Japan and Australia face the least notable income effects. Together these
three markets currently comprise 52.4% of all international arrivals (Ministry of Tourism,
2010). The sensitivity analysis highlighted the importance of income elasticity across all
market segments. Reducing elasticity values from two to leads to substantially reduced
negative effects for New Zealand tourism in response to higher oil prices. Different effects

26
were also found for exchange rate, where tourists from the USA and China face the greatest
relative losses due to unfavourable exchange rates. Exchange rates are important factors in
tourists’ decision making. A recent analysis of tourism demand for New Zealand illustrated
that exchange rate fluctuations have been more pronounced than inflation-based increases in
the tourism price index (Schiff & Becken, 2011). Again, the sensitivity analysis of price
(which incorporates exchange rate effects) highlights the importance of this factor for New
Zealand tourism.
Clearly, changes to New Zealand tourism are not uniform across markets. Apart from
different impacts on incomes and exchange rate, tourists from different origin countries are
also characterised by different consumption patterns (Becken et al., 2008) and price
sensitivities (Schiff & Becken, 2011). For example, the segment of Australian holiday tourists
who travel free and independently is characterised by a large consumption of transport
services and less consumption in the areas of retail, restaurants and activities. In contrast,
these latter categories are very important for Chinese tour group visitors, who in turn spend
relatively less on transport and accommodation whilst in New Zealand (see Figure 1). Such
differences in consumption behaviour result in differentiated effects of price increases,
depending largely on the oil-intensity of the demanded products. In addition to in-country
consumption, the relative importance of the price of airfares as part of the total tourism
consumption plays an important role. So, while the Australian FIT holiday tourists face the
highest price increase within New Zealand, the remain relatively less affected due to smaller
increases in international airfares (e.g. relative to tourists from the United Kingdom). Most of
the Asian markets (apart from Japan) are also characterised by substantial decreases in
tourism quantity and value, both for total and in-country consumption.

27
Domestic tourism is a very important component of New Zealand tourism. It generated
expenditure of NZ$ 12.424 billion in 2009 – more than that of international tourists. Domestic
tourism partly compensates for losses in international tourism, because New Zealanders’
propensity to travel overseas reduces with higher oil prices. However, domestic tourism
expenditure is also heavily dominated by transport. The three largest items of domestic
expenditure are on automotive fuels ($1.9 billion), air transport ($1.8 billion) and other
transport ($1.5 billion). In contrast, domestic tourists spent only $789 million on
accommodation in 2009 (Statistics New Zealand, 2010b). As a result, the price of the
domestic tourism consumption bundle increases substantially (6.3%), although quantity
increases slightly (0.7%) due to substitution away from outbound international travel, causing
an increase in overall domestic tourism expenditure of 7.0% under the scenario of a doubling
of oil price.
The findings of this study have important management implications. First, it is important to
understand a destination’s overall vulnerability to higher oil prices, both in general and
specifically in relation to its tourism sector. Second, differences in vulnerability of different
market segments might influence investment decisions for marketing campaigns. For
example, in the case of New Zealand, marketing in Australia and the USA might prove more
viable in the long term than marketing efforts in the United Kingdom or some Asian
countries. Facilitating smoother travel between New Zealand and Australia (both for
Australian tourists and for those who visit both countries) might also be a useful strategy to
maintain visitation. It is important to note, however, that oil prices and changes in tourist
behaviour are only one factor that might influence such decisions. However, in terms of
exposure to oil prices, the current analysis may provide additional impetus for the New
Zealand Government and industry to invest into alternative energy sources and non-fossil fuel
28
based transport systems. While international air travel remains a challenge, reduced
dependency on oil within New Zealand would reduce vulnerability substantially. It would
also have beneficial effects on the price of tourism for New Zealanders holidaying at home.
The price of oil might also be a consideration in product development at the business level.
6. Conclusion
This research showed that global oil scarcity leading to high oil prices has not only general
negative macroeconomic impacts on net oil-importing countries, but strong negative impacts
on international tourism, especially in long-haul markets. Oil is a finite resource, and while
the debates about the peaking of its global production and the availability of alternative liquid
energy sources are on-going, there is little doubt that oil prices are likely to rise over the
medium term future. International tourism is a discretionary and at the same time oil-intensive
activity and therefore more vulnerable than many other economic activities. For long-distance
destinations, in particular, this means that careful analyses of future markets are warranted.
Such analysis should consider income effects in source countries, exchange rate changes,
price sensitivities and different consumption behaviours. Other factors, such as ethical
concerns and carbon footprints, are also increasingly important for some markets. It should
also be noted that many of the factors driving global oil prices may also influence tourism
impacts: for example, rising oil prices may reflect in part rising incomes in China and many
other developing countries, which are likely to positively affect tourism demand for New
Zealand and other destinations.
The two-stage CGE modelling approach presented in this paper proved useful to understand
better the economic implications of higher oil prices at a number of levels, including
differentiated responses by 18 different market segments to New Zealand. The main

29
limitation of this approach is its inability to account for substitution effects involving
competing international tourism destinations. Developing partial or general equilibrium
models that to account for international destination choices is empirically challenging.
However, such models could have a wide range of application in research on international
passenger transport and international tourism.
30
7. References
Becken, S. & Simmons, D. (2002). Understanding energy consumption patterns of tourist
attractions and activities in New Zealand. Tourism Management, 23 (4), 343-354.
Becken, S. (2007). Tourists' Perception of International Air Travel's Impact on the Global
Climate and Potential Climate Change Policies. Journal of Sustainable Tourism, 15(4),
351-368.
Becken, S. (2008). Indicators for managing tourism in the face of peak oil. Tourism
Management, 29, 695-705.
Becken, S. & Carboni, A. (2008). Managing Energy Use in Tourism Businesses – Survey
Results. LEaP Report 4. Lincoln University. Available
http://www.leap.ac.nz/site/section.asp?bid=24&SectionID=1038
Becken, S., Carboni, A., Vuletich, S. & Schiff, A. (2008). Analysis of tourist consumption,
expenditure and prices for key market international tourism segments. Report No 7.
Available http://www.leap.ac.nz/site/section.asp?bid=24&SectionID=1038
Becken, S. & Schiff, A. (2010). Distance Models for New Zealand International Tourists and
the Role of Transport Prices. Journal of Travel Research. Available online.
Becken, S., Ngyen, M. & Schiff, A. (2010). Developing an Economic Framework for Tourism
and Oil. LEaP Report 12. Available
http://www.leap.ac.nz/site/section.asp?bid=24&SectionID=1038
Bentley, R. W. (2002). Global oil & gas depletion: an overview. Viewpoint. Energy Policy,
30, 189-205.

31
Berrittella, M., Bigano, A., Roson, R., Tol, R.S.J., 2006. A general equilibrium analysis of
climate change impacts on tourism. Tourism Management, 27, 913-924.
Blake, A., 2000. The Economic Effects of Tourism in Spain. Christel deHaan Tourism and
Travel Research Institute (TTRI), Nottingham, UK.
Blake, A., Sinclair, T. & Sugiyarto, G. (2003). Tourism and EU accession in Malta and
Cyprus, Tourism modelling and competitiveness: implications for policy and strategic
planning. Paphos, Cyprus.
Blanchard, O. & J. Gali (2007). The macroeconomic effects of oil price shocks: Why are the
2000s so different from the 1970s? NBER Working Paper 13368.
Böhringer, C. & Rutherford, T.F. (2009). Integrated assessment of energy policies:
Decomposing top-down and bottom-up. Journal of Economic Dynamics and Control,
33, 1648-1661.
Bonham, C., Gangnes, B. & Zhou, T. (2009). Modelling tourism: A fully identified VECM
approach. International Journal of Forecasting, 25, 531 – 549.
Campbell, C. J. & Laherrère, J. H. (1998). The end of cheap oil. Scientific American, March,
60-65.
Ciscar, J.C., Russ, P., Parousos, L. & Stroblos, N. (2004). Vulnerability of the EU Economy to
Oil Shocks: a General Equilibrium Analysis with the GEM-E3 Model. Institute for
Prospective Technological Studies (IPTS) and National Technical University of Athens
(NTUA), Athens, Greece.
32
Davis, B. & Mangan, J. (1992). Family Expenditure on Hotels and Holiday. Annals of
Tourism Research, 19, 691-69.
Dritsakis, N. (2004). Cointegration analysis of German and British tourism demand for
Greece. Tourism Management, 25, 111 – 119.
Fleischer, A. & Rivlin, J. (2008). More or Better?: Quantity and Quality Issues in Tourism
Consumption. Journal of Travel Research, 47(3), 285-294.
Gillen, A. (2004). Air travel demand elasticities: concepts, issues and measurements.
Department of Finance Canada.
Greene, D. L., Hopson, J. L. & Li, J. (2006). Have we run out of oil, yet? Oil peaking analysis
from an optimist’s perspective. Energy Policy, 34, 515-531.
Gupta, E. (2008). Oil vulnerability index of oil-importing countries. Energy Policy, 36, 1195-
1211.
Halligan, L. (2008). A new era of cheap oil is just wishful thinking. Telegraph.
http://www.telegraph.co.uk/finance/comment/liamhalligan/3363148/A-new-era-of-
cheap-oil-is-just-wishful-thinking.html
Hirsch, R.L. (2008). Mitigation of maximum world oil production: Shortage scenarios.
Energy Policy, 36, 881-889.
Horridge, J.M. & Ferreira-Filho, J.B. (2003). Linking GTAP to a Single-country CGE Model,
6th Annual Conference on Global Economic Analysis, 12-14 June, Den Haag, The
Netherlands.

33
IATA (2008). Traffic Slowdown Continues – Asia Leads August Decline. Press Release.
September 2008. Available www.iata.org/pressroom/pr/2008-09-30-01.html
International Energy Agency (2004). Analysis of the impact of high oil prices on the global
economy. Available www.iea.org/papers/2004/High_Oil_Prices.pdf
International Energy Agency (2009). World Energy Outlook 2009.
http://www.iea.org/index_info.asp?id=854
International Monetary Fund (2006). World Economic Outlook: Globalisation and Inflation.
Available www.imf.org/external/pubs/ft/weo/2006/01/pdf/c2.pdf
Jiménez-Rodríguez, R. (2008). The impact of oil price shocks: Evidence from the industries
of six OECD countries. Energy Economics, 30, 3095-3108.
Jones, D., Leiby, P. & Paik, I. (2004). Oil price shocks and the macroeconomy: what has been
learned since 1996. The Energy Journal, 25, 1-32.
Lennox, J., 2010. Modelling the impacts of high oil prices on tourism with the New Zealand
Tourism General Equilibrium Model. Lincoln University, Lincoln, New Zealand
Lennox, J. & van Nieuwkoop, R. (2010). Output-based allocations and revenue recycling:
implications for the New Zealand Emissions Trading Scheme, Energy Policy (in press)
Lennox, J. & Schiff, A. (2008). Oil Price and Tourism in a Computable General Equilibrium
Framework. Full Paper at Recreating Tourism, New Zealand Tourism and Hospitality
Research Conference, Hanmer Springs, New Zealand.
Lim, C., Min, J.C.H. & McAleer, M. (2008). Modelling income effects on long and short haul
international travel from Japan. Tourism Management, 29(6), 1099-1109.

34
Madden, P.J. & Thapa, J.R. (2000). The Contribution of Tourism to the New South Wales
Economy: A Multi-regional General Equilibrium Analysis. Centre for Regional
Economic Analysis, University of Tasmania Hobart, Australia.
Ministry of Economic Development (2009). Energy Data File. Available at
www.med.govt.nz
Ministry of Tourism (2009). International Visitor Arrivals 2008. Available at
www.tourismresearch.govt.nz
Ministry of Tourism (2010). Leading Tourism Indicators 2009. Available at
www.tourismresearch.govt.nz
Munoz, T. & T. Amaral (2000). An econometric model for international tourism flows to
Spain. Applied Economics, 7, 525 – 529.
Naccache, T. (2010). Slow oil shocks and the weakening of the oil price-macroeconomy
relationship. Energy Policy, 38 (5), 2340-2345.
Nicolau, J. L. (2008). Characterizing Tourist Sensitivity to Distance. Journal of Travel
Research, 47, 43-52.
Njegovan, N. (2005). A Leading Indicator Approach to Predicting Short-Term Shifts in
Demand for Business Travel by Air to and From the UK. Journal of Forecasting, 24,
421-432.
Njegovan, N. (2006). Elasticities of demand for leisure air travel: a system modelling
approach. Journal of Air Transport Management, 12, 33-39.

35
Nygren, E., Aleklett, K. & Höök, M. (2009). Aviation fuel and future oil production
scenarios. Energy Policy, 37, 4003-4010.
Peersman, G. & I. Robays (2009). The economic consequences of oil shocks – A cross-
country analysis. Available www.wlu.ca/viessmann/rba09/Peersman.pdf
Ringbeck, J., Gautam, A. & Pietsch, T. (2009). Endangered Growth: How the Price of Oil
Challenges International Travel & Tourism Growth. CHAPTER 1.2. The Travel &
Tourism Competitiveness Report 2009. Managing in a Time of Turbulence. World
Economic Forum, Geneva, Switzerland.
http://www.weforum.org/pdf/TTCR09/TTCR09_FullReport.pdf
Schiff, A. & Becken, S. (2011). Demand Elasticities for Tourism in New Zealand. Tourism
Management, 32, 564-575.
Schubert, S.F., Turnovsky, S.J. (2011). The impact of oil prices on an oil-importing
developing economy. Journal of Development Economics, 94(1), 18-29.
Sinclair, M.T., Blake, A. & Gooroochurn, N. (2005). Modeling Tourism Impacts on Small
Island Economies: Evidence from Cyprus, Malta, and Mauritius. IRFD World Forum
on Small Island Developing States. International Research Foundation for
Development, Inc. , University of Mauritius, Reduit, Mauritius.
Small, J. & Sweetman, C. (2009). New Zealand Tourist Arrivals. Covec Research Report.
Available at http://www.lincoln.ac.nz/Research-Centres/LEaP/Climate-Change-Peak-
Oil--Society/Projects/Tourism--Oil/

36
Statistics New Zealand (2009). Household Labour Force Survey Dec 2009. Media Release
“Unemployment rate rises to 7.3 percent”, 4 Feb 2010, Stats NZ.
Statistics New Zealand (2010a). Gross Domestic Product: December 2009 quarter. Available
http://www.stats.govt.nz/browse_for_stats/economic_indicators/GDP/GrossDomesticPr
oduct_HOTPDec09qtr.aspx
Statistics New Zealand (2010b). Tourism Satellite Account 2009. Available
http://www.stats.govt.nz/browse_for_stats/industry_sectors/Tourism/tourism-satellite-
account-2009.aspx
UK Energy Research Centre (2009). Global Oil Depletion. An assessment of the evidence for
a near-term peak in global oil production. London.
United Nations Statistics Division (2007). UN Comtrade. Available
http://comtrade.un.org/db/mr/daCommodities.aspx
Waters, J. (2010). Global downturn cushioned peak oil impact. ABC News.
http://www.abc.net.au/news/stories/2010/04/27/2884100.htm
Yeoman, I., Lennon, J., Blake, A., Galt, M., Greenwood, C. & McMahon-Beattie, U. (2007).
Oil depletion: What does this mean for Scottish tourism? Tourism Management, 28,
1354-1365.