implication networks from large gene-expression datasets
DESCRIPTION
Debashis Sahoo PhD Candidate, Electrical Engineering, Stanford University Joint work with David Dill, Andrew Gentles, Rob Tibshirani, Sylvia Plevritis. Implication Networks from Large Gene-expression Datasets. Integrative Cancer Biology Program, Stanford University. Motivation. - PowerPoint PPT PresentationTRANSCRIPT
ICBP, Stanford University 1
Implication Networks from Large Gene-expression Datasets
Debashis SahooPhD Candidate, Electrical Engineering, Stanford UniversityJoint work with David Dill, Andrew Gentles, Rob Tibshirani, Sylvia Plevritis
Integrative Cancer Biology Program, Stanford University
ICBP, Stanford University 2
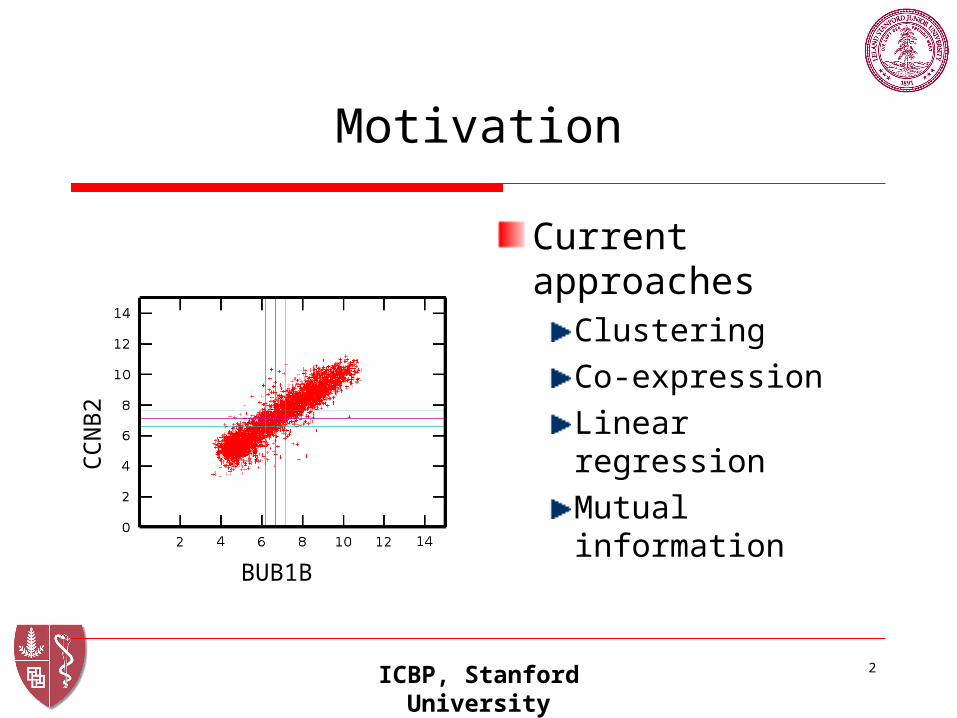
Motivation
Current approachesClustering Co-expressionLinear regressionMutual information
BUB1B
CC
NB
2
ICBP, Stanford University 3
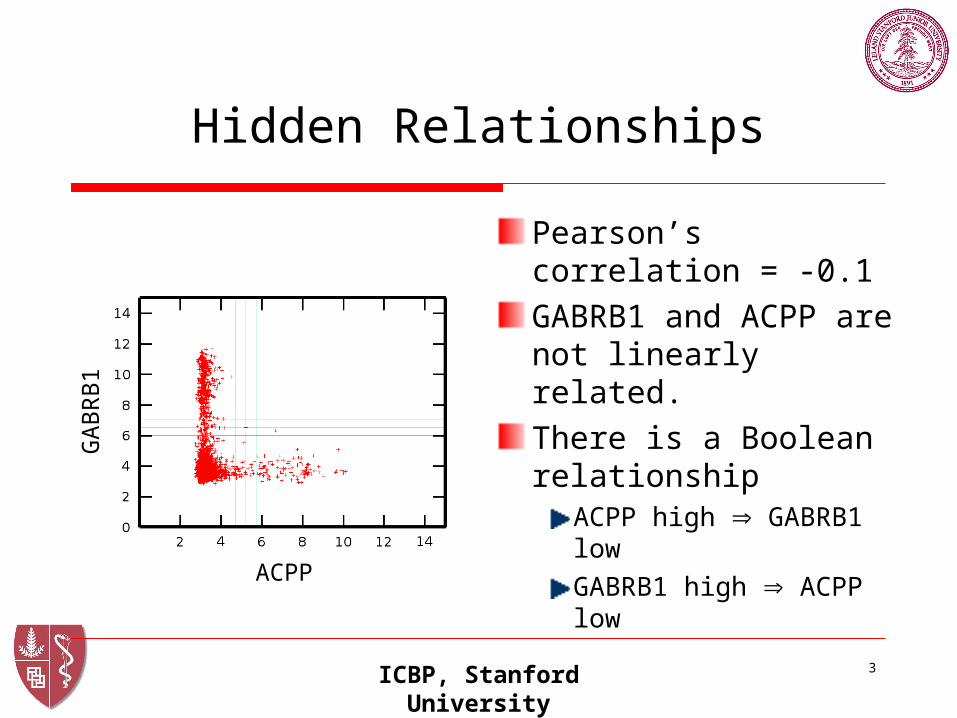
Hidden Relationships
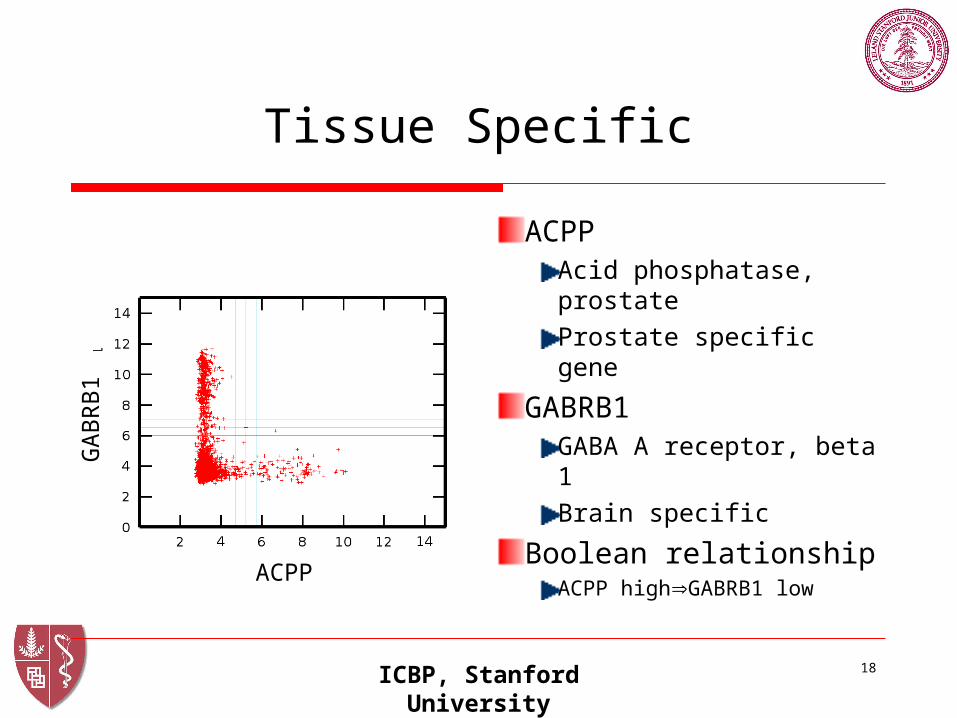
Pearson’s correlation = -0.1GABRB1 and ACPP are not linearly related.There is a Boolean relationship
ACPP high GABRB1 lowGABRB1 high ACPP low
ACPP
GA
BR
B1
ICBP, Stanford University 4
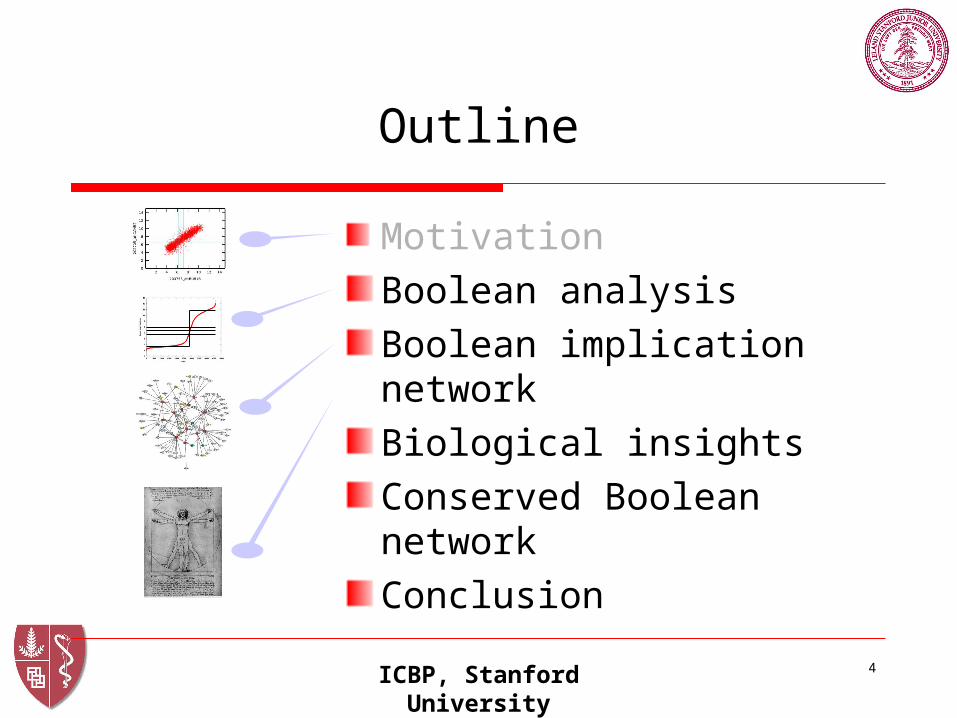
Outline
MotivationBoolean analysisBoolean implication networkBiological insightsConserved Boolean networkConclusion
ICBP, Stanford University 5
Outline
MotivationBoolean analysisBoolean implication networkBiological insightsConserved Boolean networkConclusion
ICBP, Stanford University 6
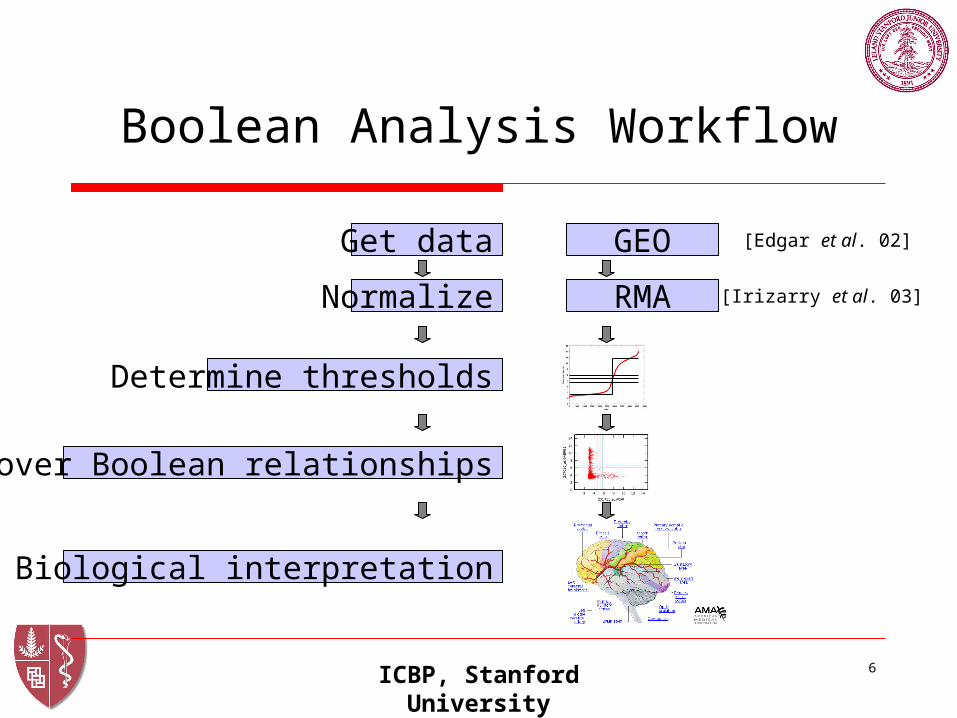
Boolean Analysis Workflow
Get data
Normalize
Determine thresholds
Discover Boolean relationships
Biological interpretation
GEO
RMA
[Edgar et al. 02]
[Irizarry et al. 03]
ICBP, Stanford University 7
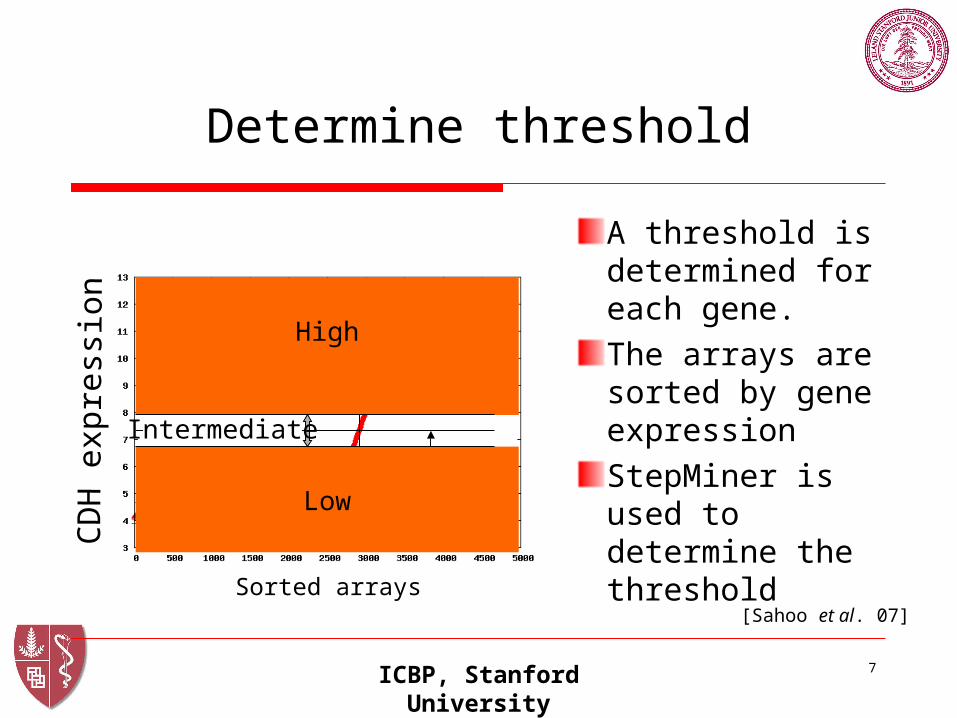
Determine threshold
A threshold is determined for each gene.The arrays are sorted by gene expressionStepMiner is used to determine the threshold
Sorted arrays
CD
H e
xpre
ssio
n
[Sahoo et al. 07]
Threshold
High
Low
Intermediate
ICBP, Stanford University 8
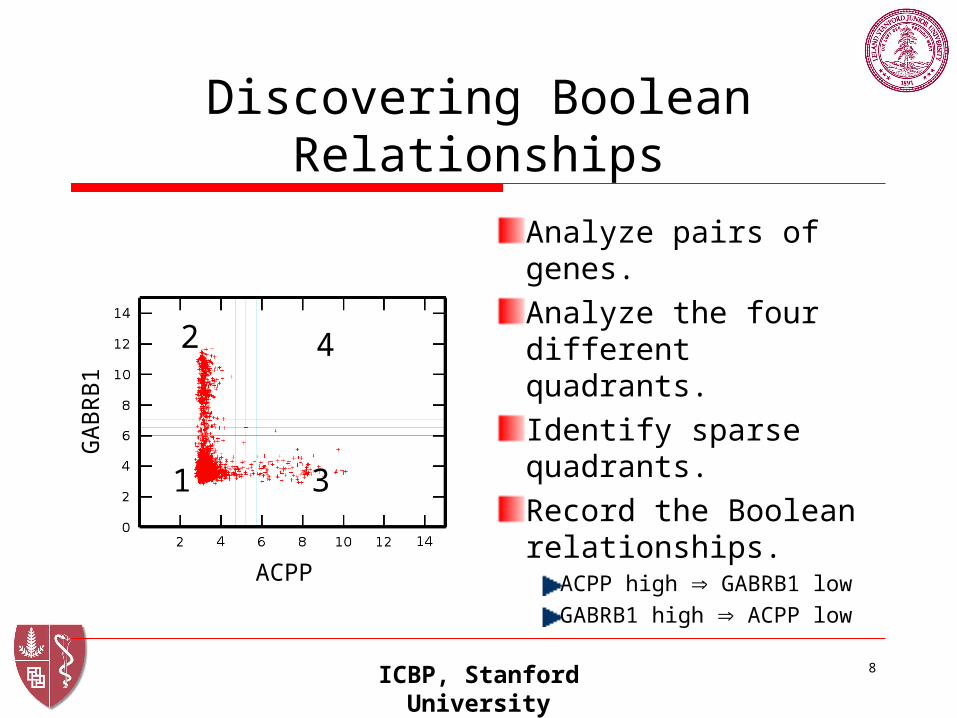
Discovering Boolean Relationships
Analyze pairs of genes.Analyze the four different quadrants.Identify sparse quadrants.Record the Boolean relationships.
ACPP high GABRB1 lowGABRB1 high ACPP low
1
2 4
3
ACPP
GA
BR
B1
ICBP, Stanford University 9
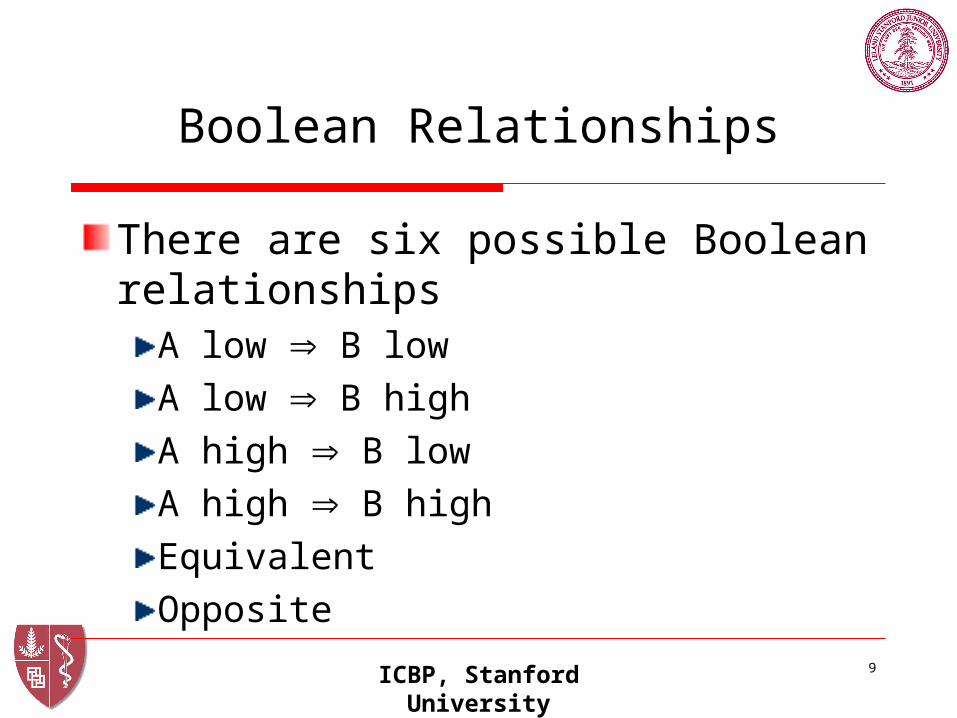
Boolean Relationships
There are six possible Boolean relationshipsA low B lowA low B highA high B lowA high B highEquivalentOpposite
ICBP, Stanford University 10
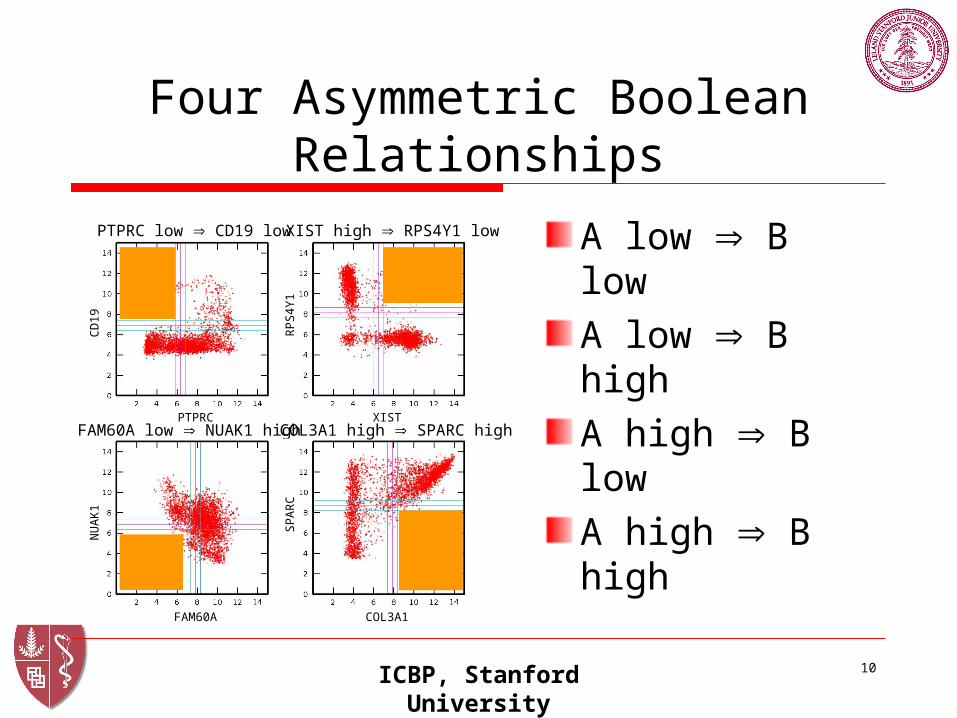
Four Asymmetric Boolean Relationships
A low B lowA low B highA high B lowA high B high
PTPRC low CD19 low XIST high RPS4Y1 low
COL3A1 high SPARC highFAM60A low NUAK1 highPTPRC XIST
FAM60A COL3A1
NU
AK
1
SP
AR
C
CD
19
RP
S4Y
1
ICBP, Stanford University 11
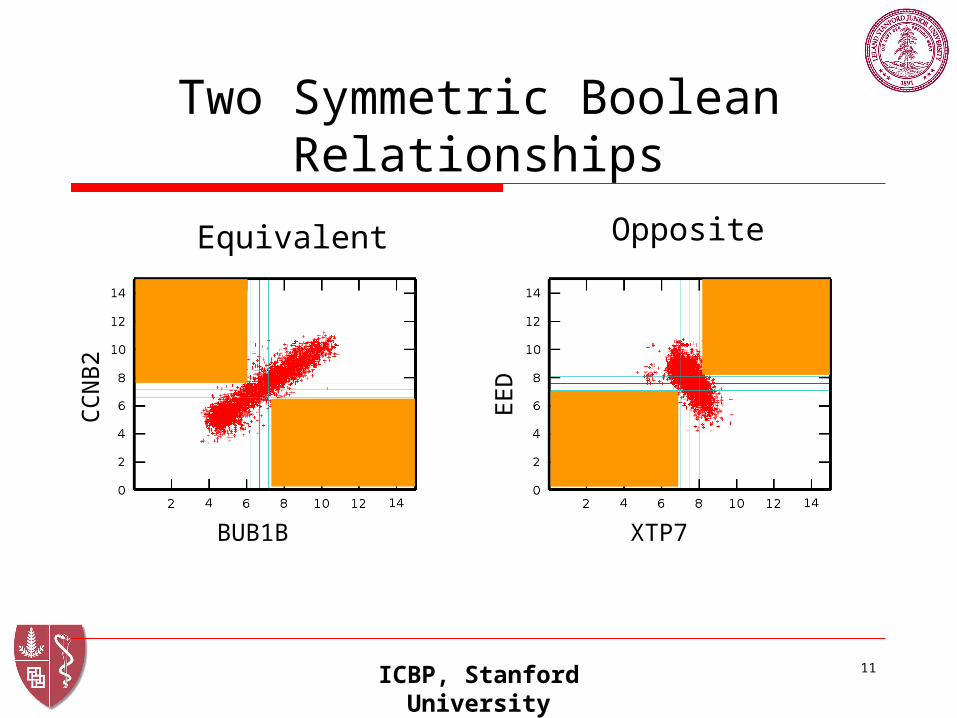
Two Symmetric Boolean Relationships
BUB1B
CC
NB
2
XTP7E
ED
Equivalent Opposite
ICBP, Stanford University 12
Outline
MotivationBoolean analysisBoolean implication networkBiological insightsConserved Boolean networkConclusion
ICBP, Stanford University 13
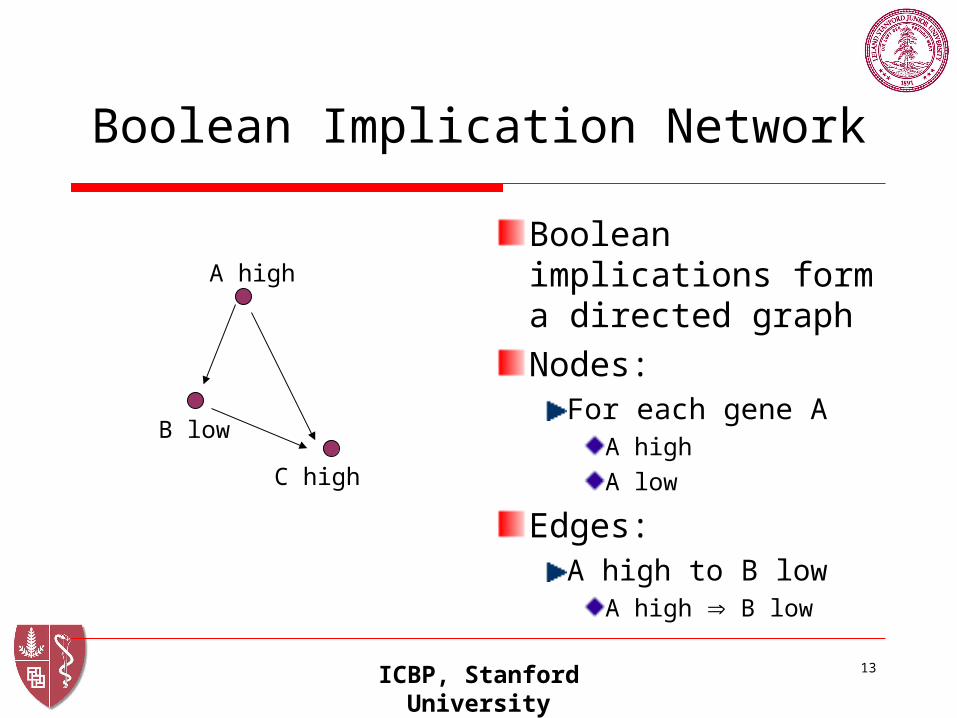
Boolean Implication Network
Boolean implications form a directed graphNodes:
For each gene AA highA low
Edges:A high to B low
A high B low
A high
B low
C high
ICBP, Stanford University 14
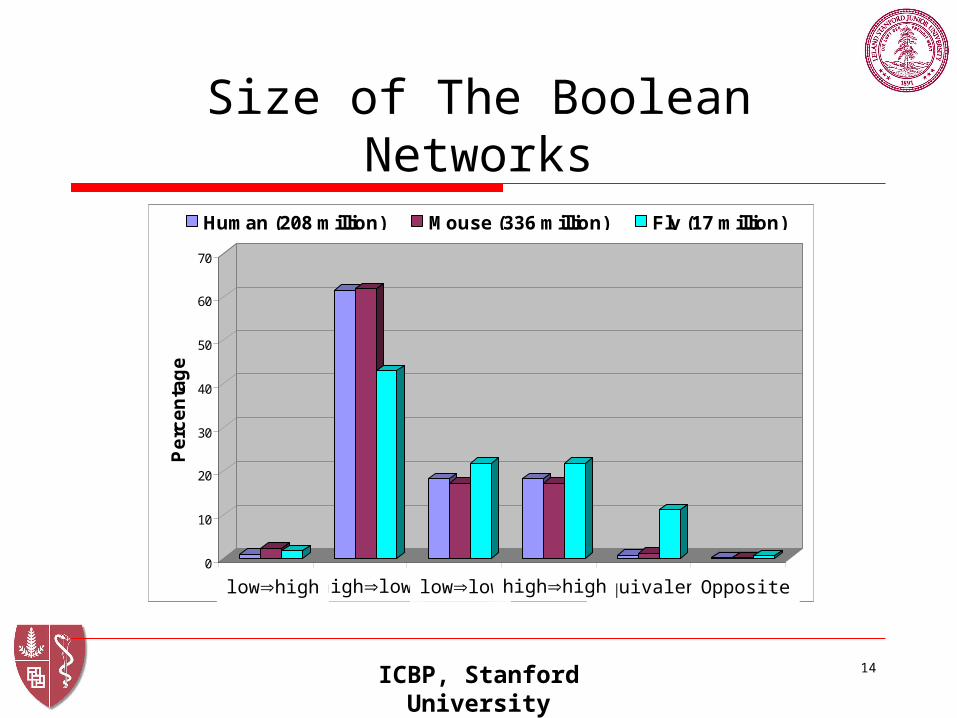
Size of The Boolean Networks
0
10
20
30
40
50
60
70
Pe
rce
nta
ge
lo=>hi hi=>lo lo=>lo hi=>hi Equivalent Opposite
Human (208 million) Mouse (336 million) Fly (17 million)
highlow lowlowlowhigh Equivalenthighhigh Opposite
ICBP, Stanford University 15
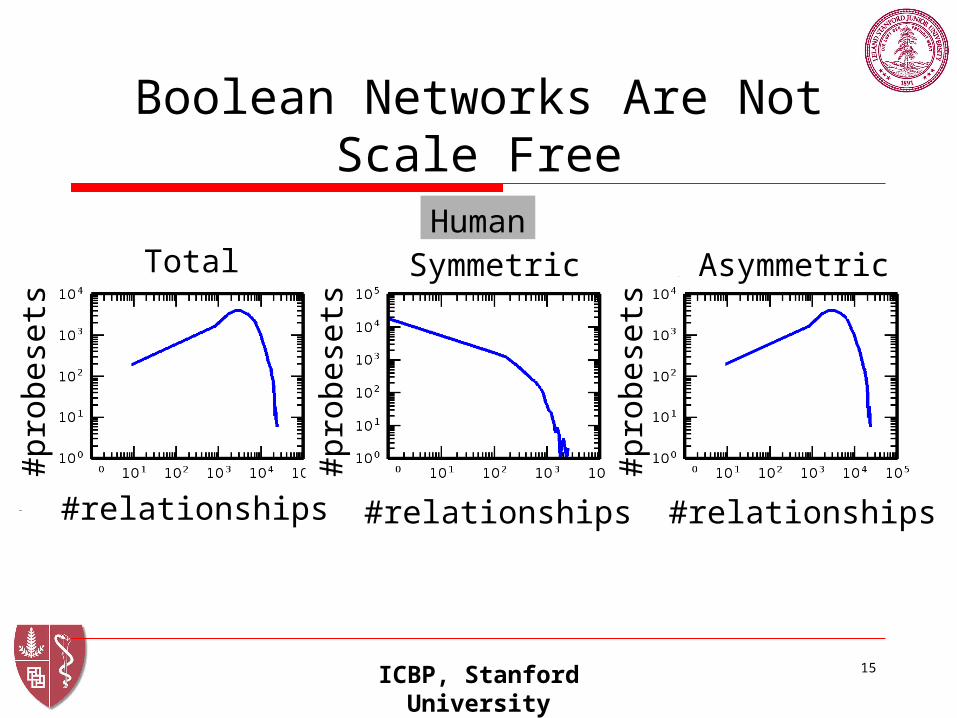
Boolean Networks Are Not Scale FreeHuman
#relationships #relationships #relationships
#pro
bese
ts
#pro
bese
ts
#pro
bese
ts
Total Symmetric Asymmetric
ICBP, Stanford University 16
Outline
MotivationBoolean analysisBoolean implication networkBiological insightsConserved Boolean networkConclusion
ICBP, Stanford University 17
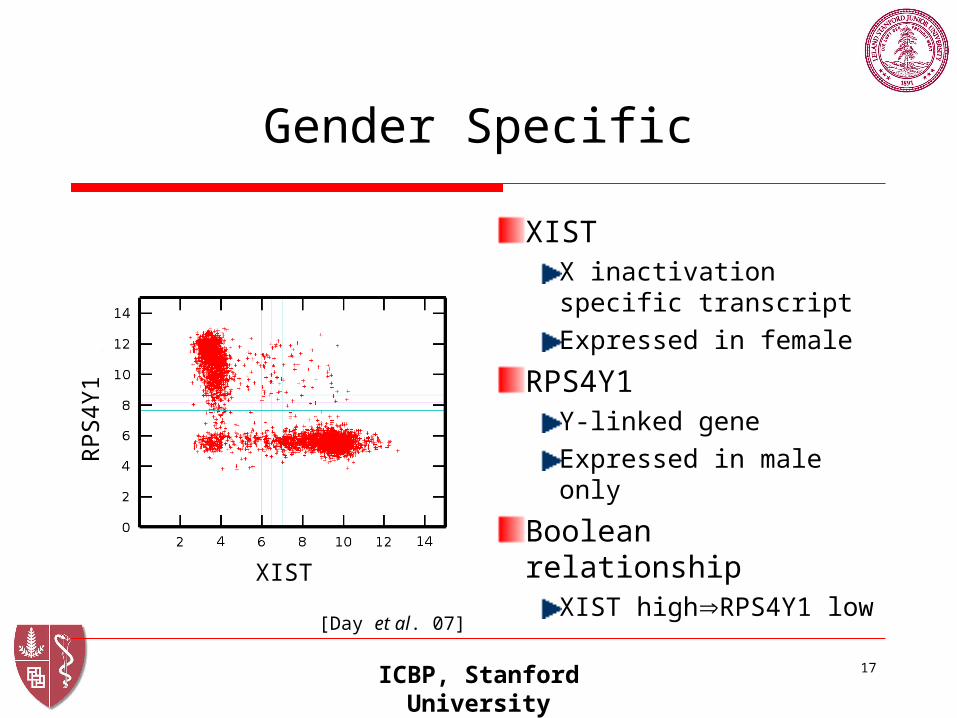
Gender Specific
XIST X inactivation specific transcriptExpressed in female
RPS4Y1Y-linked geneExpressed in male only
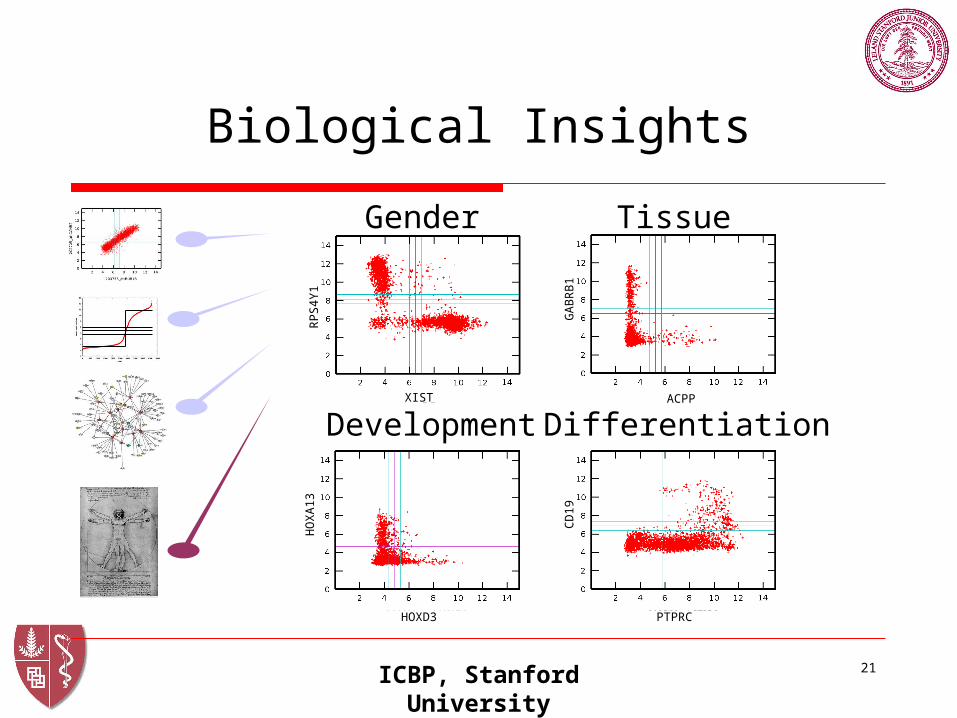
Boolean relationshipXIST highRPS4Y1 low
XIST
RP
S4Y
1
[Day et al. 07]
ICBP, Stanford University 18
Tissue Specific
ACPPAcid phosphatase, prostateProstate specific gene
GABRB1GABA A receptor, beta 1Brain specific
Boolean relationshipACPP highGABRB1 low
ACPP
GA
BR
B1
ICBP, Stanford University 19
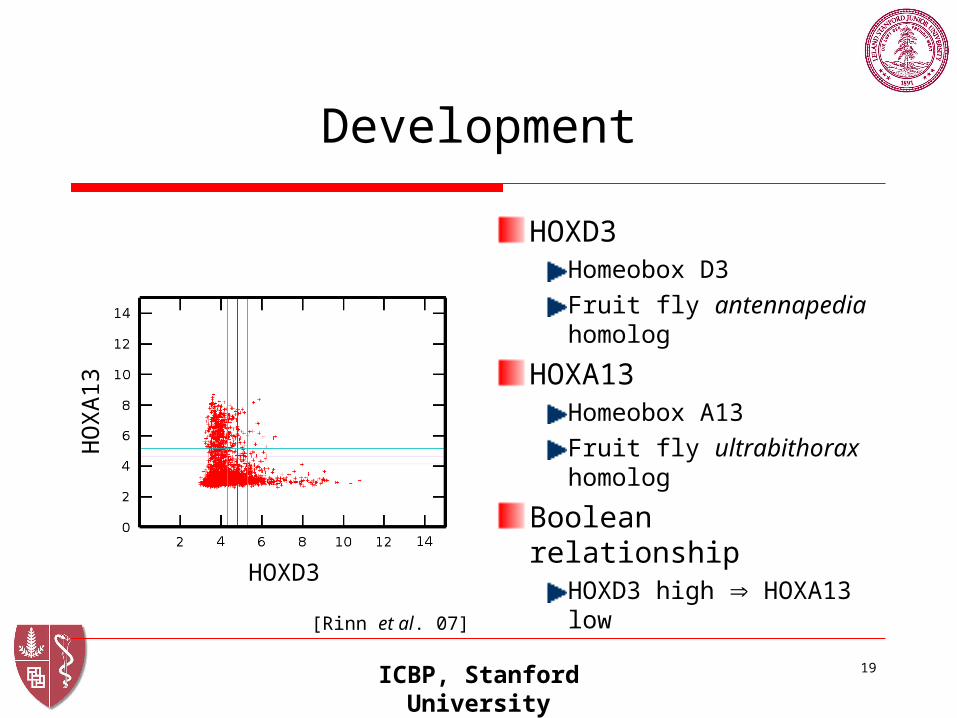
Development
HOXD3Homeobox D3Fruit fly antennapedia homolog
HOXA13Homeobox A13Fruit fly ultrabithorax homolog
Boolean relationshipHOXD3 high HOXA13 low
HOXD3
HO
XA
13
[Rinn et al. 07]
ICBP, Stanford University 20
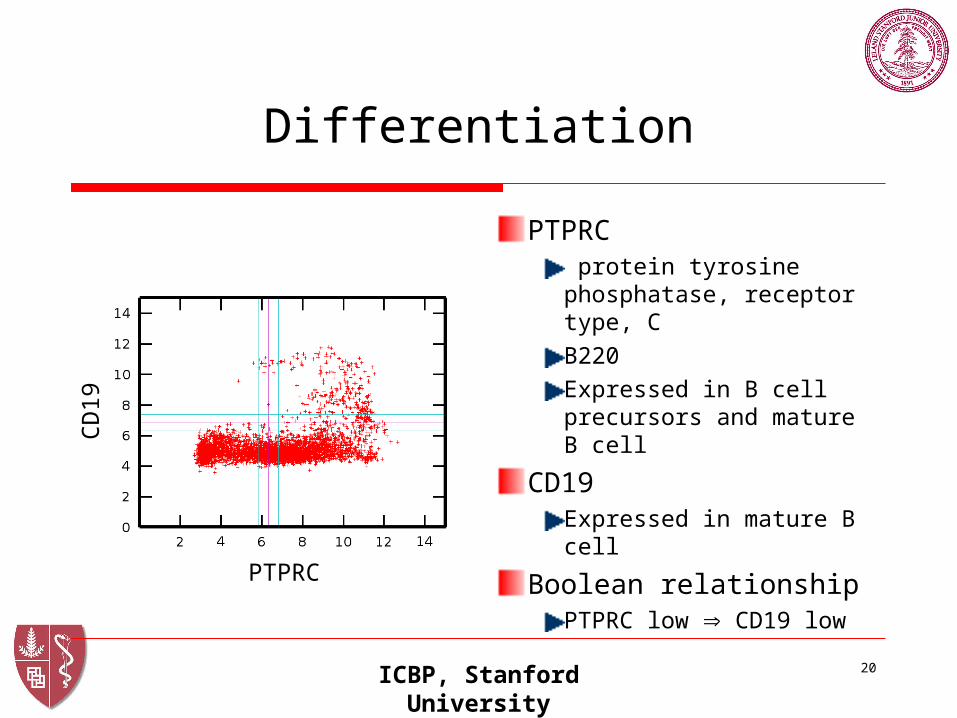
Differentiation
PTPRC protein tyrosine phosphatase, receptor type, CB220Expressed in B cell precursors and mature B cell
CD19Expressed in mature B cell
Boolean relationshipPTPRC low CD19 lowPTPRC
CD
19
ICBP, Stanford University 21
Biological Insights
Gender Tissue
Development DifferentiationXIST ACPP
HOXD3 PTPRC
HO
XA
13
CD
19
RP
S4Y
1
GA
BR
B1
ICBP, Stanford University 22
Outline
MotivationBoolean analysisBoolean implication networkBiological insightsConserved Boolean networkConclusion
ICBP, Stanford University 23
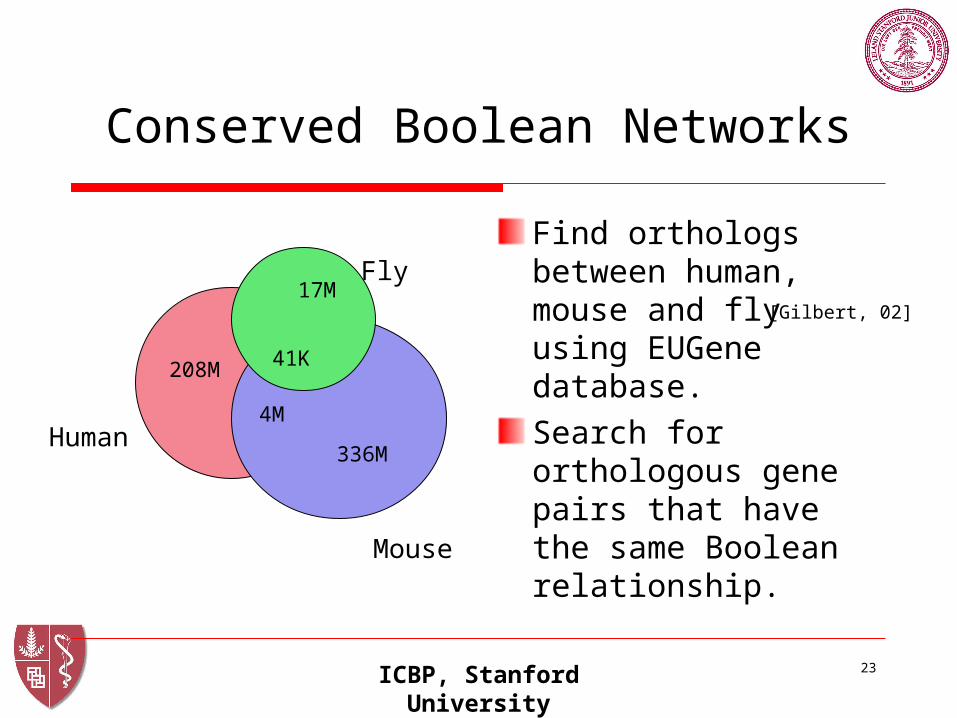
Conserved Boolean Networks
Find orthologs between human, mouse and fly using EUGene database.Search for orthologous gene pairs that have the same Boolean relationship.
[Gilbert, 02]
Human
208M
Mouse
336M
Fly17M
4M
41K
ICBP, Stanford University 24
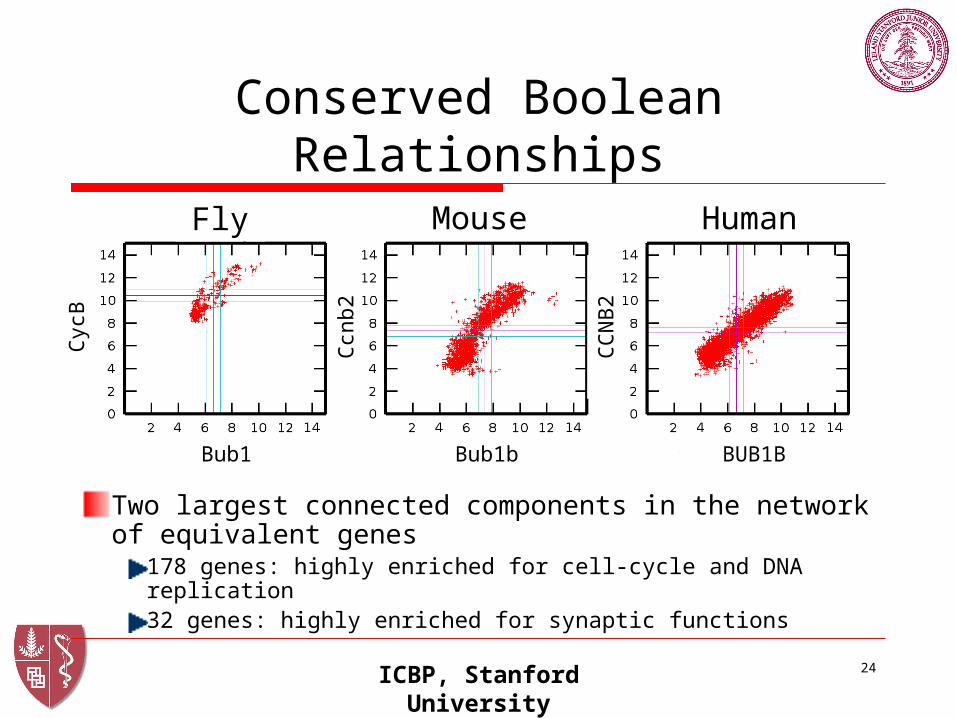
Conserved Boolean Relationships
Two largest connected components in the network of equivalent genes
178 genes: highly enriched for cell-cycle and DNA replication32 genes: highly enriched for synaptic functions
Bub1
Cyc
B
Ccn
b2
CC
NB
2
Bub1b BUB1B
Fly Mouse Human
ICBP, Stanford University 25
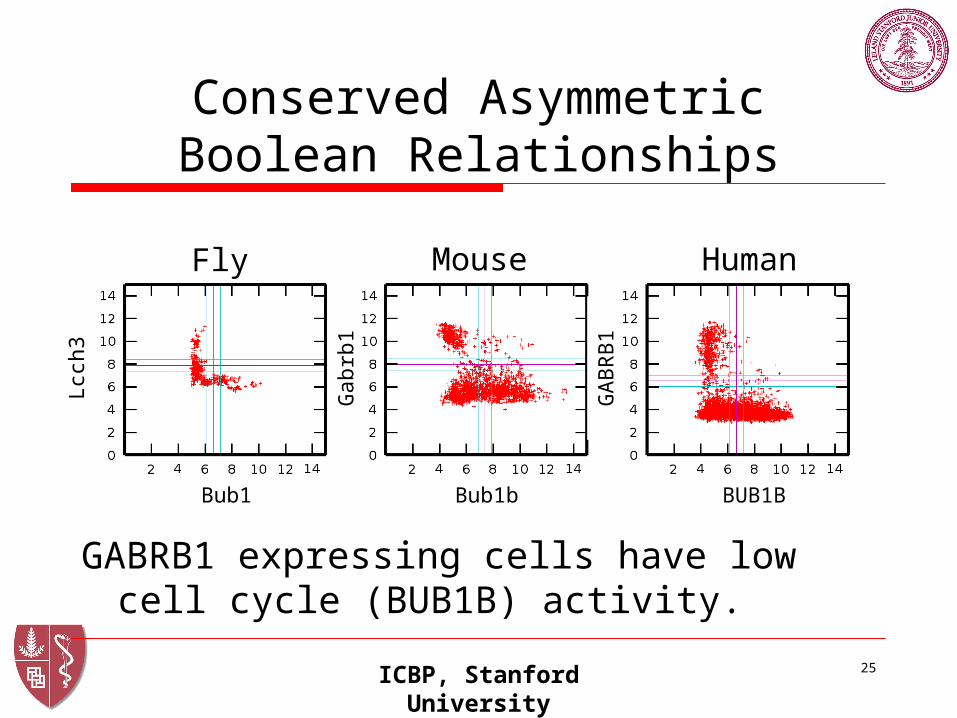
Conserved Asymmetric Boolean Relationships
GABRB1 expressing cells have low cell cycle (BUB1B) activity.
Bub1
Lcc
h3
Gab
rb1
GA
BR
B1
Bub1b BUB1B
Fly Mouse Human
ICBP, Stanford University 26
Outline
MotivationBoolean analysisBoolean implication networkBiological insightsConserved Boolean networkConclusion
ICBP, Stanford University 27
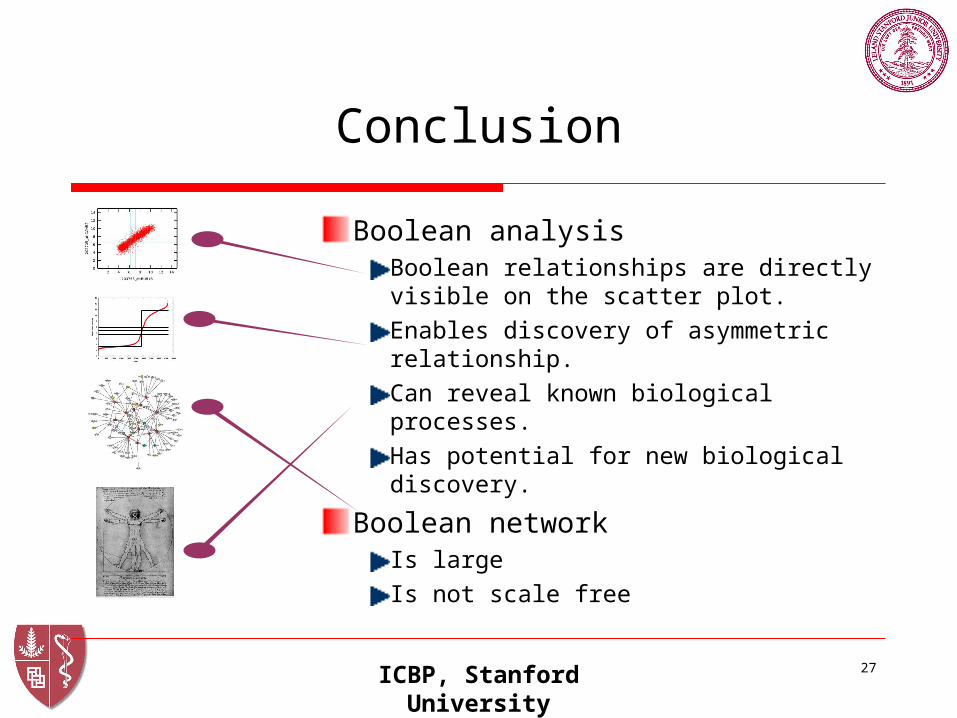
Conclusion
Boolean analysisBoolean relationships are directly visible on the scatter plot.Enables discovery of asymmetric relationship.Can reveal known biological processes.Has potential for new biological discovery.
Boolean networkIs largeIs not scale free
ICBP, Stanford University 28
Acknowledgements
The Felsher Lab:Natalie WuCathy ShachafDean Felsher
Funding: ICBP Program (NIH grant: 5U56CA112973-02)
Leonore A HerzenbergJames Brooks Joe LipsickGavin SherlockHoward ChangStuart Kim
ICBP, Stanford University 29
The END
ICBP, Stanford University 30
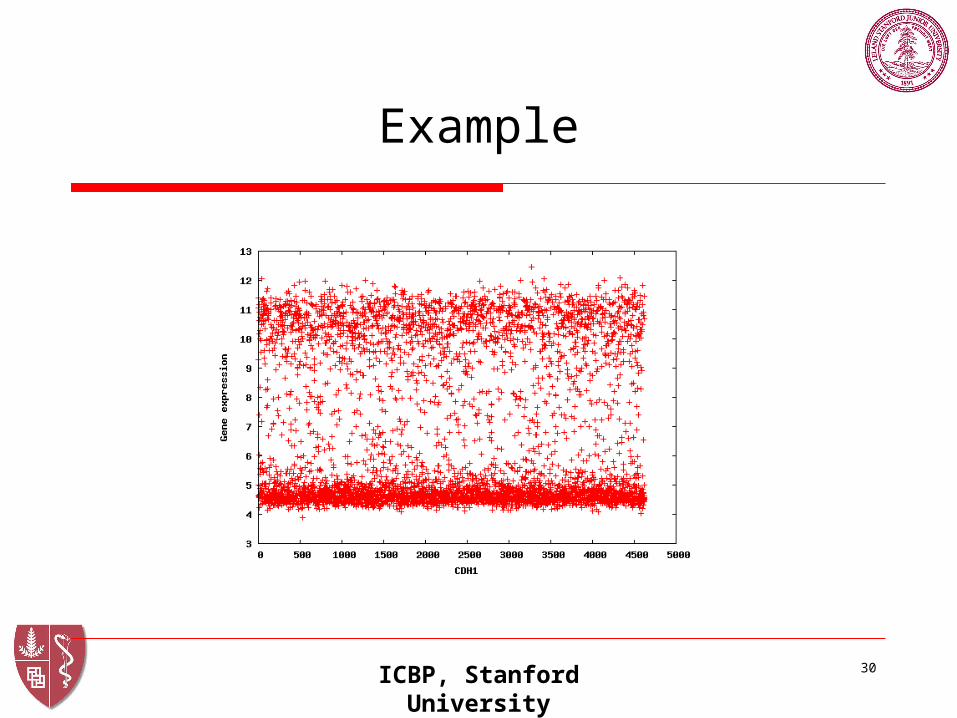
Example
ICBP, Stanford University 31
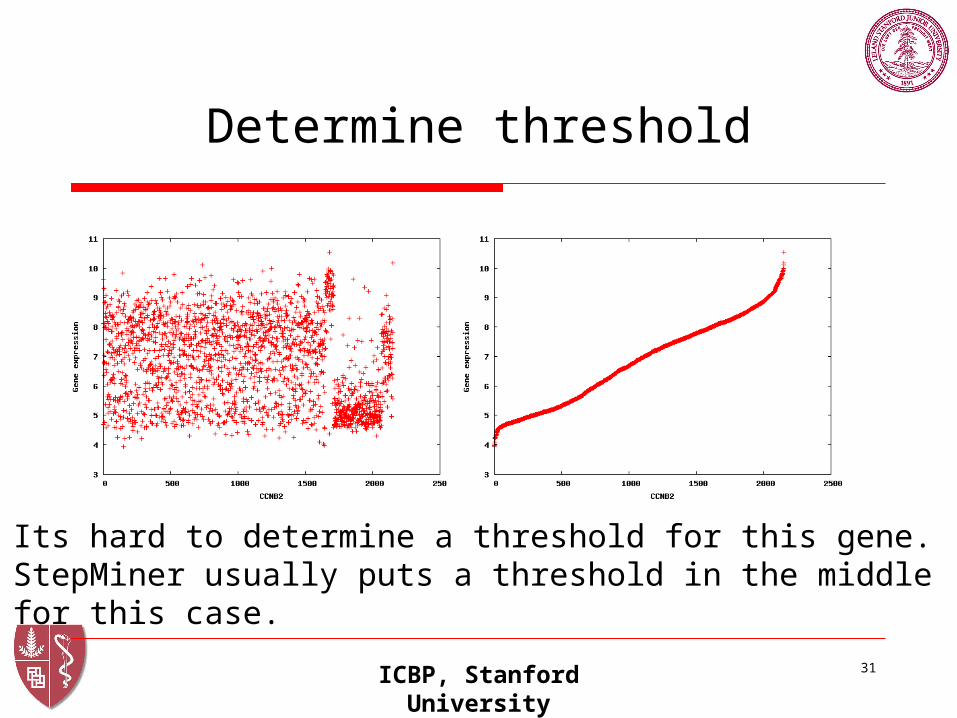
Determine threshold
Its hard to determine a threshold for this gene.StepMiner usually puts a threshold in the middle for this case.
ICBP, Stanford University 32
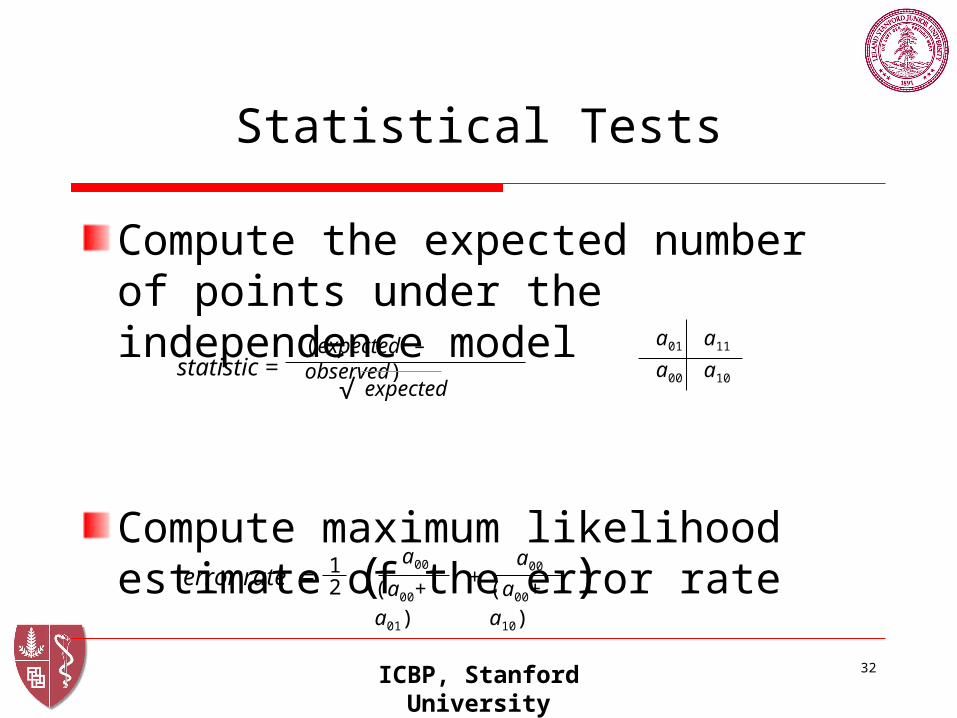
Statistical Tests
Compute the expected number of points under the independence model
Compute maximum likelihood estimate of the error rate
statistic =(expected – observed)
expected√
a00
(a00+ a01)
a00
(a00+ a10)+( )1
2error rate =
a00
a01 a11
a10