implementing virtual design and construction (vdc) … · implementing virtual design and...
TRANSCRIPT
Implementing Virtual Design and Construction (VDC) in Veidekke – Using Simple Metrics to Improve the Design Management Process.
Industry Papers 1379
IMPLEMENTING VIRTUAL DESIGN AND CONSTRUCTION (VDC) IN VEIDEKKE – USING SIMPLE METRICS TO IMPROVE THE DESIGN
MANAGEMENT PROCESS. Vegard Knotten1 and Fredrik Svalestuen 2
ABSTRACT The productivity in the AEC industry in Norway has had a decline since the 80´íes and Veidekke has sought out new approaches to deal with the issue. One of the approaches has been to work with Stanford University and CIFE to improve efficiency of the design phase, by using Virtual Design and Construction (VDC).
Through a certificate course in VDC the participants got an introduction to the use of VDC and in the following year implemented VDC in their projects. Metrics is a key part of VDC, and by using simple metrics the participants discovered how to increase the efficiency of the design phase and how to improve the control of the design phase, including changing the processes that did not work well.
The aim of this paper is to present some of the course participants' experiences in implementing VDC in their projects and to show how simple metrics can document their efforts.
The following main findings were reported:
• The time spent with quantity take off (QTO) can be reduced dramatically.
• The PPC (Per cent Planned Complete) can be increased by using the 6 prerequisites of a healthy design process to determine the root cause of uncompleted tasks.
KEYWORDS VDC, Metrics, Design management, Constraint analysis, Improvement
INTRODUCTION Virtual Design and Construction (VDC) are defined by (Kunz and Fischer 2009)as: “The use of integrated multi-disciplinary performance model and design-construction projects to support explicit and public business objectives”
1 PhD Candidate/ Design manager, NTNU/ Veidekke Entreprenør AS. P.O.Box 506 Skøyen, N0214
Oslo Norway, Phone +47 21055000, [email protected] 2 PhD Candidate/ Design manager, NTNU/ Veidekke Entreprenør AS. P.O.Box 506 Skøyen, N0214
Oslo Norway, Phone +47 21055000, [email protected]
1380 Proceedings IGLC-22, June 2014 | Oslo, Norway
This is further defined as ” The VDC project model emphasizes those aspects of the project that can be designed and managed, i.e., the product (typically a building or plant), the organization that will define, design, construct and operate it, and the process that the organization teams will follow” (Kunz and Fischer 2009)
So by using computer models of the project, integrated with the right organization and processes there is a big potential to increase the value of the project. (Khanzoode, Fischer et al. 2008)
Since the 1980-ies there has been a significant reduction of productivity in the AEC industry in Norway. By a comparison at productivity has fallen with 20% since year 2000, while other industries have gained productivity by 30%. (Source SSB -Statistics Norway). An internal survey in Veidekke from 2004 shows that one of the main reason for stop and delays in the production, is due to wrong or missing production material from the designers.
As a mean to improve the productivity and the quality of the work, Veidekke started collaboration with Center for Integrated Facility Engineering (CIFE) and Strategic Projects Solutions SPS at Stanford University.
CIFE/SPS has developed a VDC certificate program that teaches professionals within Architecture, Engineering, Construction (AEC) and Facility Management (FM) how to use VDC effectively and obtain high value for their projects and businesses.
The VDC certificate program consists of 3 different elements: 1. VDC introduction – a 5 day introduction course 2. VDC application – a 6-month period where the participants use their VDC
knowledge in their organizations. This includes monthly reports and conference calls to discuss progress and issues with CIFE and the other participants.
3. VDC Integration Experience – a 2 day session to discuss what have been learned and how to implement VDC in their organization.
In March 2010 CIFE and SPS visited Veidekke in Stockholm and conducted the first VDC introduction Course for Veidekke. A new course was held in Sweden in 2012, and in January 2013 a course was held in Trondheim. This paper presents some of the results from the VDC implementation phase after the last course.
METHODS This paper is based on studying the course participants’ reports and discussing the findings with the participants at the conference calls.
REPORTS AND RESULTS FROM THE VDC IMPLEMENTATION PHASE The reports were submitted monthly and presented at a telephone conference. Since the course participants were new to the methods of VDC, it usually took some reports before they got useful metrics. All participants were employees of Veidekke, but they came from different field offices and had different positions in projects. There were design managers, project managers, foremen, and BIM engineers. Their position and current work situation set the framework for their VDC efforts.

Implementing Virtual Design and Construction (VDC) in Veidekke – Using Simple Metrics to Improve the Design Management Process.
Industry Papers 1381
METRICS An important part of VDC is to collect metrics in order to evaluate the status of the agreed processes in the projects.
(Drucker 2008) argues for the term controls meaning measurement and information. “Controls deal with facts, that is with the events of the past” He also argues that “control deals with expectations, that is the future”. In order to control the result of a process you need controls (metrics) to let you know how your process is doing.
The metrics presented in this paper are only a few of the metrics presented by the participants. The ones presented here are chosen because they demonstrate either an improvement from the way work is conducted today or they present a tool to change the way work is conducted today.
The metrics collected and shown here are referred to as simple metrics, since they are not difficult or time consuming to collect, yet they give valuable information about the processes.
The following metrics are presented in this paper:
• Comparison of time spent in Quantity Take Off (QTO) when using BIM vs. drawings and counting.
• Counting how many times the BIM can be used to review alternative solutions.
• Comparison of QTO from BIM vs spent materials.
• Per cent Planned Completed (PPC) of planned tasks in ICE session, action plans (between meetings), and drawings deliverance.
• Evaluation of ICE Sessions
THE USE OF BUILDING INFORMATION MODEL (BIM) Since VDC is primarily oriented around the use of models, a Building Information Model (BIM) is essential. In this case, we define BIM as more than just a 3D model. BIM is a 3D model that enables the use of Quantity Take Off (QTO), 4D simulations and collision control. In our experience to achieve a good BIM, the key issue is to get a good file structure and a product breakdown structure (PBS) that concurs with the actual physical assembly of the project.
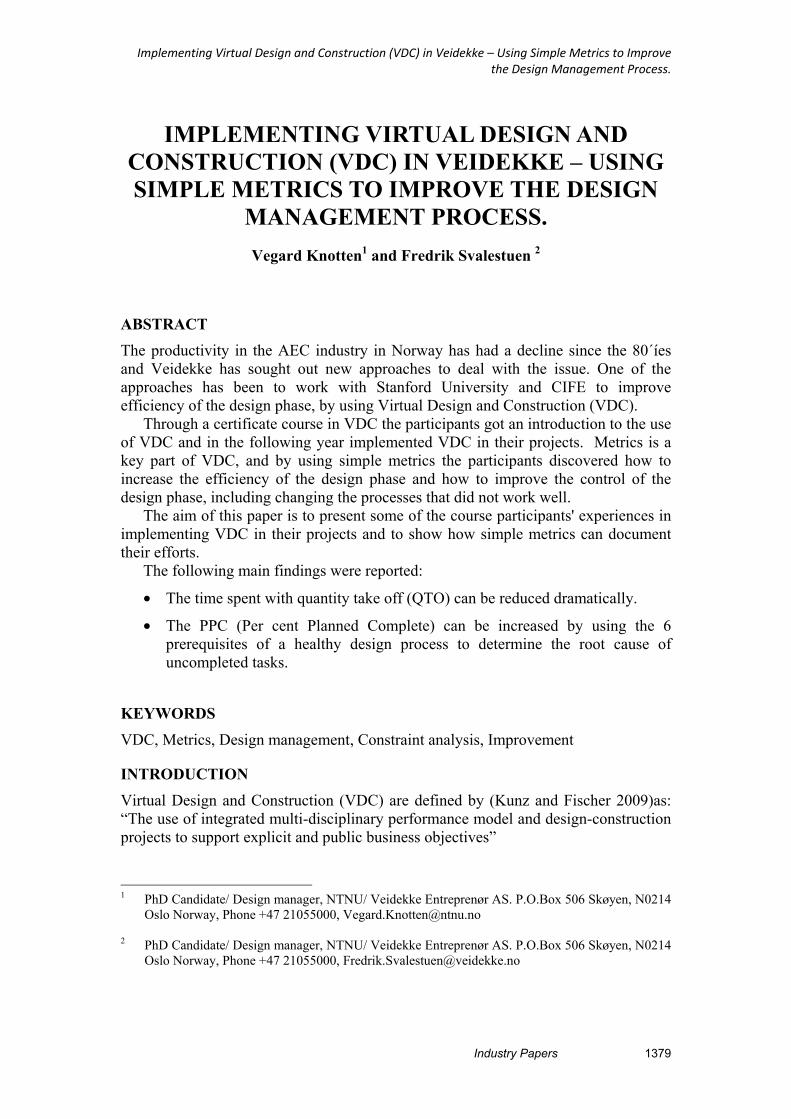
Figure 1 shows a metric of time spent with Quantity Take Off (QTO) in a tender phase of a project. The goal was to determine the amount of material to be able to give a most accurate price. The participant used two different approaches, in order to get the answers (Berg 2013). One has been preformed off the BIM using an automated QTO, and the other have been done by 2D drawings and a CAD program. This approach is done in two different tender projects. This metrics shows approximately a 45% reduction of time spent. In this case it is also interesting to view the hours reduced, since experience from Ole Morten Kvam (2013), revealed that as little as 5-10 hours spent at remodelling a BIM, can give an huge advantage in visualization and transparency for a tender team.
1382
In abestmodpha
of deasi
2 Proceedi
a tender or dt design. Ddel increase
ase it is impoFigure 2 sh
decking (slaier to keep a
ings IGLC-22,
Figure 1: E
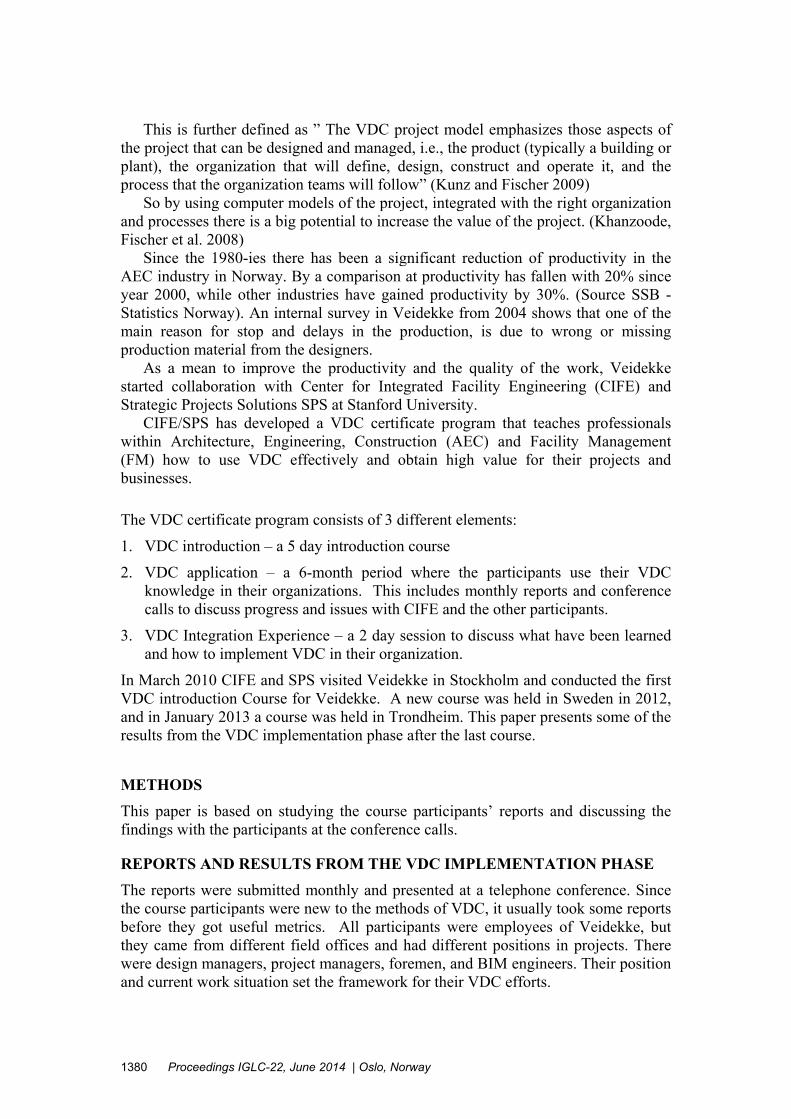
Figure 2: Tdesign phas
During this ees the transortant to ke
hows a timeabs) by usinan updated
0
5
10
15
20
25
30
35
June 2014 |
Efficiency o
Time used fose it is impoexplorative sparency ofep an updat reduction o
ng BIM vs. cost estimat
Tender 1 Tend
Oslo, Norway
of Quantity
or Quantity ortant to exp
phase the f the solutited cost estiof 63% at thmanual QT
ation through
Tender 2 ers
Effiency on Q
y
Take Off (B
Take Off (Fplore multipuse of BIMion for the imation of the QTO of
TO. This vahout the pro
QTO
Hours sp
Hours spQTO
Berg 2013)
Fluør 2013)ple solutionsM is an effe
design teahe project. windows a
ast time reduoject.
1
pent with 3-D QTO
pent with traditional
) s to achieveective tool. am. During
and 93% of duction mak
e the The this
area kes it
Implementing Virtual Design and Construction (VDC) in Veidekke – Using Simple Metrics to Improve the Design Management Process.
Industry Papers 1383
The time saved by using BIM in QTO will vary depending on how good the BIM is and the scope of the QTO.
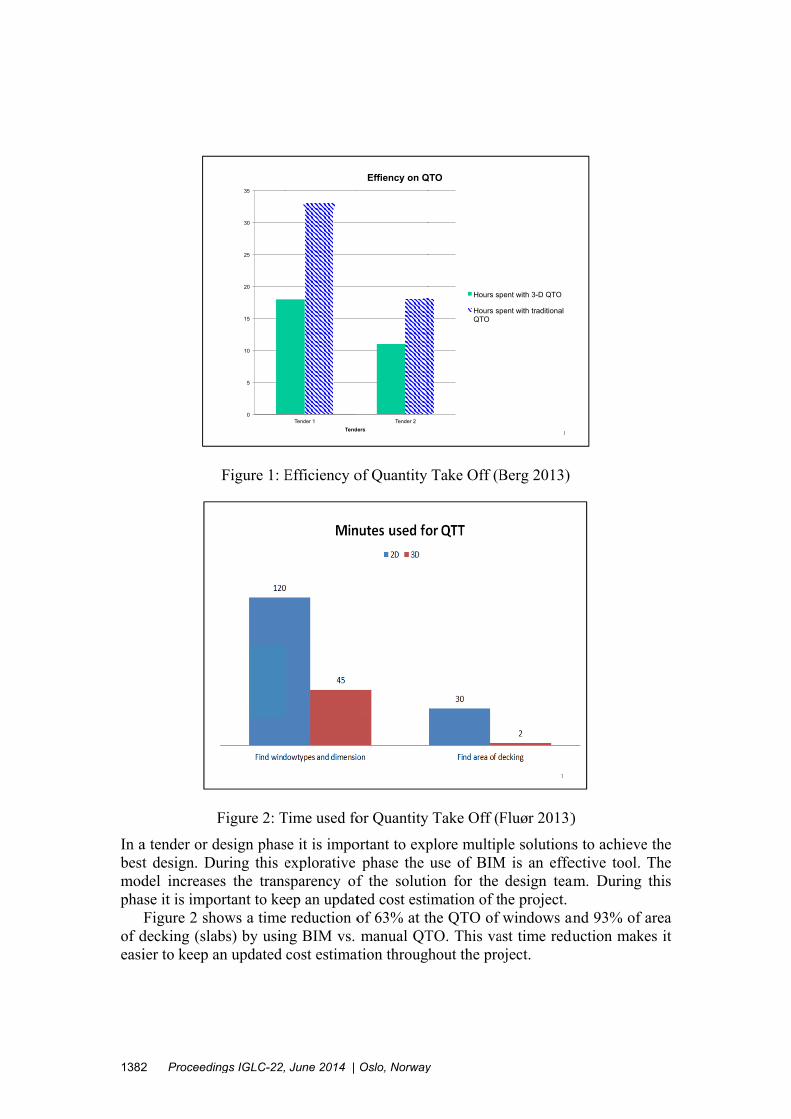
Figure 3 shows a metric comparing number of alternatives explored by using the BIM. Each alternative will bring the design team closer to an optimum design.
Figure 3: Number of alternatives investigated by using BIM (Borgen 2014) The main goal of a QTO is to get the right amount of materials in order to make an accurate purchase or work planning. At a residential project, the foreman used the BIM QTO as a framework for his orders of drywall material (Braa 2014). Since the detail of the model was not 100% adjusted to the building of the apartments, he used his experience to make correcting factors to the result of the QTO, and then ordered the materials using the corrected QTO. Figure 4 shows variations of the ordered materials vs. the spent materials. As this metric shows there were some variations at used drywall material vs. the ordered material. Even though the largest discrepancy is 9,6 % between ordered vs. used, the metric is a success, since it enables the foreman to adjust his correcting factors, and to get a more accurate order the next time.
Center for Integrated Facility Engineering
How m any alternat ives are invest igated w ith the BI M m odel in the tender w ork
1
0 1 2 3 4 5 6 7
Number of alternatives
Number of alternatives

1384 Proceedings IGLC-22, June 2014 | Oslo, Norway
Figure 4: Quantity take-off from model vs. spent amount. (Braa 2013)
INTEGRATED CONCURRENT ENGINEERING (ICE) SESSIONS Integrated Concurrent Engineering (ICE) was developed by NASA’s Jet Propulsion Laboratory in the mid 90’ies. (Mark, G.) A design group called Team-X created an improved speed and quality of space mission planning, by creating environment of extreme collaboration. Similar setups made for AEC industries are referred to as ICE. Key success factors are good preplanning, clear agenda and objectives, productive environment (Kunz & Fischer 2009).
Being able to complete the task of a meeting is important in order to secure decisions and progress. Figure 5 shows measurements of completed issues in an ICE session. The first 3 sessions were conducted without a pre-set specific goal and without the agenda sent out in advance. The last 4 sessions was done with an agenda and a goal for the ICE issued in advance.
Parquet
15mm
+15mm sub
layer
Ceiling Sill
wall (m)
Ceiling
Stud (m)
Ceiling
Board1+0 (m2)
Drywall - 100mm Sill (m)
Drywall - 100mm Stud (pcs)
Drywall - 100mm 1+1 Wall boar
d (m2)
Drywall - 68
mm Sill (m)
Drywall - 68
mm Stud (pcs)
Drywall - 68
mm 1+0 Wall boar
d (m2)
Add-on
Wall 36m
m bathroom cabin
Sill (m)
Add-on
Wall 36m
m bathroom cabin Stud (pcs)
Add-on
Wall 36m
m bathroom cabin 1+0 Wall boar
d
Drywall - 68mm Sill (m)
Drywall - 68m
m Stud (pcs)
Drywall - 68m
m 1+1 Wall boar
d (m2)
Outer
wall 200 / 5mm insula on (m2)
Outer
wall Wall boar
d 1+0 (M2)
Serie1 0,82 -6,33 3,02 -7,18 1,77 6,79 0,77 9,13 2,64 -1,25 4,19 4,19 4,19 -3,22 2,88 -1,34 -1,53 1,46
-10,00 %
-5,00 %
0,00 %
5,00 %
10,00 %
Ord
erd
vs. S
pent
am
ount
Count from the model vs spent ammount: average on all
apartments in Block B

Implementing Virtual Design and Construction (VDC) in Veidekke – Using Simple Metrics to Improve the Design Management Process.
Industry Papers 1385
Figure 5: ICE meeting efficiency (Berg 2013) The first sessions (blue bars in figure 5) had an average of 72% completion while the 4 last sessions (red-striped bars in figure 5) had an average of 94%. This clearly show the fact that a) preplanning is a success factor and b) with metric you can see what is broken / not working optimal and try to fix it.
Another way to try to determine the success of a meeting or an ICE session is to do measurements of the participants’ perception of the meeting or the session. Content participants are more likely to engage and tribute to the process than those who feel it is a waste of time. Figure 6 shows measurements done by the ICE session’s participants after each session. Each participant stated how content they were with the ICE session form a scale of 1 to 7, where 7 is extremely content and, 1 is very discontent. The measurement “Value for money“ refers directly to if they experienced the session as a productive use of their time. This metric helps the ICE session leader to reflect on how to organize and arrange the next session.

1386 Proceedings IGLC-22, June 2014 | Oslo, Norway
Figure 6: Success in ICE sessions (Haugen 2013)
PROCESS MANAGEMENT In the design process the deliveries are decisions, solutions, clarifications or drawings. Each of these deliveries can be vital to the progress of the design process, and thus need a special attention. Measuring the Per cent Planned Completed (PPC) will give a good indication whether or not the process is on track. If the process fails to be on track, it is important to sort out the reason for a failing design process.
Figure 7 shows the measurement of how many drawings that were completed within agreed time. The measurement does not say anything about the numbers of drawings or the effect the delays had on the production. What the measurement is telling is that something in the process is not working and that this is not a “one time” error.
It is important to try to find the root cause of the delays in the production. This is shown in figure 8, representing the last week deliveries. The root cause was divided in the 6 prerequisite for design (Bølviken et al 2010). As figure 8 indicates, the main reason for the delays where lack of information, i.e. not enough information to complete the drawings. However according to the design manager, in the design meeting 2 weeks prior to completion none claimed the lack of information to complete their work.
Center for Integrated Facility Engineering
Success in I CE ( evaluated by part icipants)
0
1
2
3
4
5
6
7
ICE 1 ICE 2 ICE 4 ICE 5 ICE 6
Achieved outcome Agenda "Value for money" Overall impression

Im
Simthe
mplementing
F
Figure 8
milar measurdesign pha
Virtual Design
Figure 7: PP
8: Reasons f
rements arese of a proj
[Insert
n and Constru
PC of drawi
for latency i
e presented iect. The me
t metri
uction (VDC) in
ing deliveri
in drawing
in figure 9, easurement
c graph
n Veidekke – Uth
Indus
ies (Olsen-N
deliveries (
showing thwas how m
h here]
Using Simple Mhe Design Man
stry Papers
Nauen 2013
Olsen-Naue
he PPC of anmany of the
]
Metrics to Impnagement Pro
3)
en 2013)
n action plapromised t
1
prove ocess.
1387
an in tasks

1388 Proceedings IGLC-22, June 2014 | Oslo, Norway
were completed at the agreed time. This was then divided to show the status of members in the project.
From the metric it is easy to see which member of the design team does not deliver, and also the reason for the latency is displayed.
Figure 9: PPC of an action plan in the design phase (Duaas 2013) Both Olsen-Nauen (2013), and Duaas (2013) displayed the metrics to their design teams and registered a change in performance and root cause in their teams.
CONCLUSIONS The use of simple metrics in the design process is not a new tool, but it is an effective one to show the status of the process. As the examples given in this paper show, it is not difficult or time consuming to set up these metrics. They give a good description of what needs more attention, and where there can be made good investments.
This paper presents a collection of the course participants' experiences in implementing VDC in their work, and the benefits they experienced by using VDC.
The following main findings were reported:
• By using BIM the time spent in quantity take off (QTO) can be reduced by more than 90% when measuring areas of decking (slabs).
PPC Actionplan in the design phase
1

Implementing Virtual Design and Construction (VDC) in Veidekke – Using Simple Metrics to Improve the Design Management Process.
Industry Papers 1389
• BIM eases the possibility to explore different solutions in design and tender work.
• By using ICE and together with metrics the efficiency of the design team increases.
• Together with metrics and process management the PPC (Per cent Planned Complete) of the process can be increased. This works best when the metrics are transparent to the design teams.
In addition to improving the participants’ own projects and work, their experiences are important for the management in evaluating the results of implementing VDC in Veidekke.
REFERENCES Berg, R. (2013), VDC desember 2013_runarberg, Report VDC certificate program Bølviken,T. Gullbrekken, B and Nyseth, K. (2010) Collaborativ Design Management,
IGLC 2010. Borgen, K. (2014) Use of VDC to Achive more cost efficient and buildable projects
report December, Report VDC certificate program Braa, R. (2013), Horneberg B2 implementation of VDC Nov.2013runebraa, Report
VDC certificate program Drucker, P. F. (2008). Management. New York, Collins. Duaas, S. (2013), Sjetnan nedre blokk implementation of VDC report 5_sd, Report
VDC certificate program Fluør, T. (2013), Secret Garden Report 4 – Monthly Report –VDC Certificate
Program, Thomas Fluør – Veidekke Agder, Report VDC certificate program Haugen, M. (2013), VDC Certificate Program Report 5 Marianne Haugen, Report
VDC certificate program Khanzoode, A., M. Fischer and D. Reed (2008). "Challenges and benefits of
implementing virtual design and construction technologies for coordination of mechanical, electrical, and plumbing systems on a large healthcare project." ITcon Vol. 13, Special Issue Case studies of BIM use, pg. 324-342, http://www.itcon.org/2008/22.
Kunz, J. and M. Fischer (2009). "Virtual Design and Construction: Themes, Case Studies and Implementation Suggestions." CIFE Working Paper #097 Version 10: October 2009, Stanford University.
Kvam, O.M. ( 2013), CIFE-SPS VDC CP Program Veidekke Norway- Ole Morten Kvam – Oktober. Report VDC certificate program
Mark, G. Extreme Collaboration, Communications of the ACM. Vol 45(6), pp.89-93 Olsen-Nauen, S. (2013), CIFE-SPS VDC CP Signe Olsen-Nauen report 5 november,
Report VDC certificate program