implementing thermal feedback control of a...
TRANSCRIPT
Implementing Thermal Feedback Control of aHelium-Neon Laser for Frequency Stabilization
Intel Science Talent Search
PhysicsNovember 2008
Yuanchi Zhao
Ward Melville High SchoolEast Setauket, NY 11733
and
Laser Teaching CenterStony Brook UniversityStony Brook, NY 11794

Zhao, Yuanchi
1 Introduction
Measurement is an essential aspect of the physical sciences and the development of measure-
ment tools with ever increasing precision drives progress in both science and technology. In
applications that range from detecting gravitational waves to guiding motorists with GPS
units, stabilized lasers that provide exact time and length standards have played an essential
role in this progress in metrology.
Lasers can be stabilized in two essentially different ways. Externally stabilized lasers are
locked to some outside constant frequency reference such as an atomic transition by com-
paring the two frequencies directly or through a Fabry-Perot interferometer [1]. Internally
stabilized lasers utilize the atoms within the laser as the frequency reference. In either case,
the frequency locking process requires an electronic feedback system which monitors some
property of the laser or its interaction with the external reference and then adjusts the laser
as needed to maintain a constant frequency.
In the present work, an electronically stabilized helium neon (He-Ne) laser was con-
structed and tested, and measurements were made that will hopefully help guide future
improvements in stability. While the technique employed has been reported before [2, 3, 4]
and various commercial stabilized laser systems are available based on these principles, the
available literature provides few details on the dynamics of the laser stabilization system
[3, 4, 5]. The laser stabilization was based on two-mode polarization stabilization, an ap-
proach to stabilization first proposed by Balhorn et al. [2]. The purpose was to create a
stabilized laser system independent of previous work and investigate the properties of the
system as a whole. The basis for stabilization was a thin-film heater attached to the laser that
controls the laser tube’s cavity length. The implemented analog feedback circuit is based
on proportional, integral, derivative control and is constructed of inexpensive integrated
circuits.
Stabilization was achieved with this circuit and stability has been measured for long
periods of time. A new method of analyzing frequency stability through the use of the
1
Zhao, Yuanchi
periodic fluctuations in mode intensity as the laser cavity warms and expands was developed
and the frequency stability of this laser system was estimated through this method.
Properties of the laser and laser system were investigated, including the characteristic
oscillations in intensity and frequency due to laser cavity expansion with the goal being to
understand the system’s properties in order to be able to enhance stabilization. A study
was performed of the response of the laser output to oscillation in heater power without
the feedback circuit engaged and it was found surprisingly that despite increasing the pe-
riod of heater oscillations, the phase shift of the laser response remained nearly constant,
demonstrating a growing time interval between the two phases.
2 Background
2.1 Gas Lasers
The internal-mirror He-Ne laser is a tube filled with gaseous helium and neon atoms and
enclosed by two highly reflective mirrors and produces coherent light of wavelength λ = 632.8
nm [6]. The mirrors form a resonant cavity whose length L determines the exact frequencies
(wavelengths) of the emitted light through the condition that only exact integer multiples of
a half-wavelength can resonate [4]. Thus the allowed mode wavelengths λ and frequencies ν
are defined by the following equivalent equations, where n is a large integer of the order of
a million.
L = nλ
2(1)
ν = nc
2L(2)
It follows that the difference in frequency ∆ν, between successive resonant modes is:
∆ν = νn+1 − νn =c
2L(3)
2

Zhao, Yuanchi
In the absence of some sort of stabilizing circuit the frequency range produced by a He-Ne
laser is determined by the Doppler frequency shifts caused by the motion of the neon atoms
in the hot plasma [7]. The intrinsic width of any one mode is set by quantum mechanical
effects and is much smaller. The Doppler-broadened laser gain as a function of frequency
can be represented by a Gaussian function [7]:
g(ω) =
(4ln2
π∆ω2d
) 12
exp
[−(4ln2)
(ω − ω0
∆ωd
)2]
(4)
where ω0 is the center frequency and ∆ωd is the full width at half maximum (FWHM). The
latter depends on the masses and temperatures of the atoms involved and is around 1500
MHz for a He-Ne laser [2].
Figure 1: The Doppler-broadened gain curve of our He-Ne laser. Two modes (tall red lines) areabove threshold and are amplified, while other modes (shorter red lines) produce no output. Thepolarization of the modes is either horizontal (H) or vertical (V), as discussed in the text. Themode spacing c/2L = 1060 MHz corresponds to the cavity length L of the laser employed, 14.1 cm.
A key property of He-Ne and similar gas lasers, especially those with relatively short
tubes that only fit two or three modes at once inside the gain curve, is that adjacent modes
are polarized orthogonally (perpendicular to each other) as a result of mode competition
[6]. Our short laser supports at most two modes at once, and the orthogonal polarization of
these provides a very convenient way to determine their relative intensity, and hence their
3

Zhao, Yuanchi
relative position on the gain curve [2].
2.2 Mode Sweeping
From Equation 2 it can be seen that the output frequencies of the laser depend upon the laser
cavity length. Upon switching on the laser, its cavity will steadily lengthen due to thermal
expansion. For each particular mode this expansion results in a continuous downward change
of frequency that will cause it to “sweep” across the gain curve [6].
Even after the laser reaches thermal equilibrium, changes in ambient temperature will
affect its cavity length and hence the frequencies of the modes. Without stabilization, the
frequency of a resonant mode can be any value allowed by the threshold width of the gain
curve (Figure 1).
The orthogonal polarization property of the modes mentioned above allows only the H
(or V) modes to be selected with a polarizer. If the laser is short enough to normally allow
only at most two modes, the removal of one of these with the polarizer causes dramatic
repetitive fluctuations of the light intensity, from zero to some maximum value and back
again.
Figure 2 shows the light intensity output from our short-tube He-Ne laser measured over
a period of nine and half minutes as it warmed up. The polarizer placed in front of the
laser was oriented so as to fully pass one set of modes and fully block the modes orthogonal
to these. The changes in light intensity due to mode sweeping are apparent. As the laser
warms up and approaches an equilibrium temeperature, the rate of cavity length increase
diminishes and thus so does the speed of the mode sweeping.
As the laser comes closer to thermal equilibrium, the cavity expansion slows and so does
the mode sweeping. It is cumbersome however, to wait such a long time for a laser to come
to thermal equilibrium and the slightest of changes to environmental condition may disrupt
the stabilization and set the modes in motion again. Thus, a stabilization system is essential
for keeping laser output at a constant frequency.
4

Zhao, Yuanchi
Figure 2: The blue line is a measure of light intensity from a He-Ne laser of one polarization; theorthogonal polarization is blocked by a polarizer
2.3 PID Control and Operational Amplifier Circuits
Feedback circuits monitor the output of the system and then feed adjustments into the circuit
that bring the output closer to the desired value. The process to be controlled produces an
error signal which is the difference between the output value and the desired value. This
error signal is then processed into an output signal that is sent back into the process to match
its output to the desired value [8]. A widely implemented feedback system is proportional,
integral, derivative control (PID), which is used extensively in industry [9].
The three elements of PID control respond differently to the error signal [10]. The pro-
portional component produces a response proportional to the magnitude of the error signal
and is responsible for reducing much of the error signal. The final output of a proportional-
only system results in an steady-state error, a constant difference between the desired value
and the actual output, because the proportional component needs some error signal to func-
tion [11]. The integral component accumulate the error signal over time and removes the
steady-state error. The derivative component produces a signal proportional to the rate of
change in the error signal which increases system responsiveness [10].
5

Zhao, Yuanchi
PID control is commonly modeled in industry as [8]
R(t) = Kp
(e(t) +
1
Ki
∫e(τ)dτ +Kd
de(t)
dt
)(5)
where Kp, Ki, and Kd are the constants of proportional, integral, and derivative output
respectively. R(t) is the output of the system and e(t) is the error signal. In this model, the
proportional gain, or the value of the proportional output given an error signal, affects the
signal sent to the integral and derivative parts of the circuit. Optimizing the gain values for
proportional, integral, and derivative values may be done manually or with tuning methods
such as the Ziergler-Nichols method developed in 1942 [8].
Operational amplifiers are flexible amplifiers with a variety of applications. Op-amps
are versatile, capable of performing a large variety of analog tasks including forming a PID
control circuit [12]. The circuit constructed for this project is composed primarily of op-amps
which, depending on their placement within a circuit, can subtract, add, invert, amplify,
differentiate, integrate, and filter signals.
3 System Configuration
Balhorn et al [2] proposed the stabilization of a two-mode He-Ne laser through monitoring
individually the two polarized modes in 1972. In this project, stabilization is based upon the
same principle of using the orthogonal polarization properties of the two modes to separate
them in order to individually monitor their intensity signals.
Figure 3 is the functional diagram for the laser stabilization system. The laser is a Siemens
LGR 7655 1.11 mW He-Ne laser originally manufactured for use in bar-code scanners. Its
cavity length is 14.1 cm, which results in a mode spacing of 1060 MHz (from Equation 3).
This mode spacing allows at most two modes to resonate at any one time because of the
1,500 MHz width of the gain curve. Of the two mirrors in a laser, one a high reflectance
mirror while the other is the output coupler mirror that also has high reflectance but allows
6

Zhao, Yuanchi
Figure 3: Feedback Heater Control Circuit
1% of the light to pass through the mirror [13]. The back high reflectance mirror has more
than 99.95% reflectance but because it is not perfect, some light also passes out the rear end
of the laser tube. This modes of this light are the same as that of the front output but is
weaker in power. In this project, the waste beam was advantageously used as the signal for
the feedback system so that actual output was available for various applications. Behind the
laser, the waste beam is sent through a polarizing beam splitter, which can send light of one
linear polarization in one direction and light of the orthogonal polarization the other way.
The laser has been rotated so that its axes of polarization are horizontal and vertical.
The two modes produced by the laser are separated by a polarizing beam splitter. The two
separated beams then reach photodiodes that convert light into photocurrents. These two
photocurrents are converted into voltage and then the difference between the two voltages is
taken to generate the error signal. This error signal goes through the proportional, integral,
and derivative componnents of the circuit which process the error signal and create a signal
voltage. The signal voltage affects the heater power and therefore control ths length of
7

Zhao, Yuanchi
the laser cavity. The front output of the beam goes to a Thorlabs DET-110 photodetector
for intensity monitoring. When the laser is first turned on, the heater is kept on to allow
the laser to quickly warm up. Warmup to stabilization time is around 10 minutes and the
outside temperature of the glass tube rises to 70 C from a room temperature of around
20 C. The laser when stabilized operates at 70 C temperature because while increasing
laser tube length involves increasing heater power, decreasing laser tube length depends on
cooling effects.
The laser and photodiodes are enclosed in a box that dampens the effects environmental
changes have on the laser. The box is not completely sealed from the outside environment
in order to dissapate heat buildup which may lower the cooling response of the system.
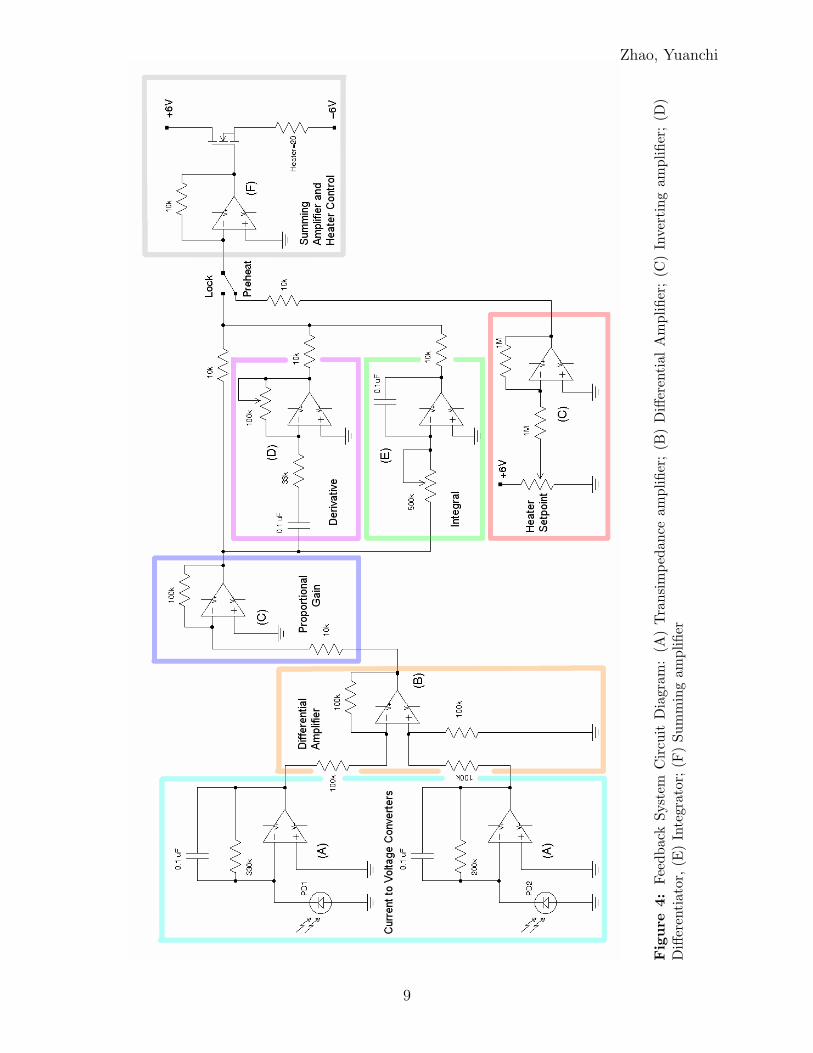
Figure 4 is the completed feedback control circuit diagram used in this work, designed on
the basis on proportional, integral, and derivative control. All op-amps run on a dual power
supply of +/- 6V. The op-amps used are two Texas Instruments LM324N quad op-amps and
a Fairchild Semiconductor 741CN single op-amp. The functional blocks in the circuit are
highlighted.
The two photodiodes are labeled PD1 and PD2; each monitors a single polarization
output from the laser. The photocurrents from the photodiodes are converted into voltages
by op-amps setup as transimpedance amps. These voltages are fed into a differentiator which
takes the difference between the two signals; this is the error signal. The gain values on the
transimpedance amplifiers are determined by the resistor value in between the output and
the inverting input on the op-amps. The resistor values, 330kΩ and 200kΩ, are unequal
because the beam splitter at the rear of the laser is imperfect and allows more light through
one direction than the other.
8
Zhao, Yuanchi
Fig
ure
4:Fe
edba
ckSy
stem
Cir
cuit
Dia
gram
:(A
)T
rans
impe
danc
eam
plifi
er;
(B)
Diff
eren
tial
Am
plifi
er;
(C)
Inve
rtin
gam
plifi
er;
(D)
Diff
eren
tiat
or,
(E)
Inte
grat
or;
(F)
Sum
min
gam
plifi
er
9
Zhao, Yuanchi
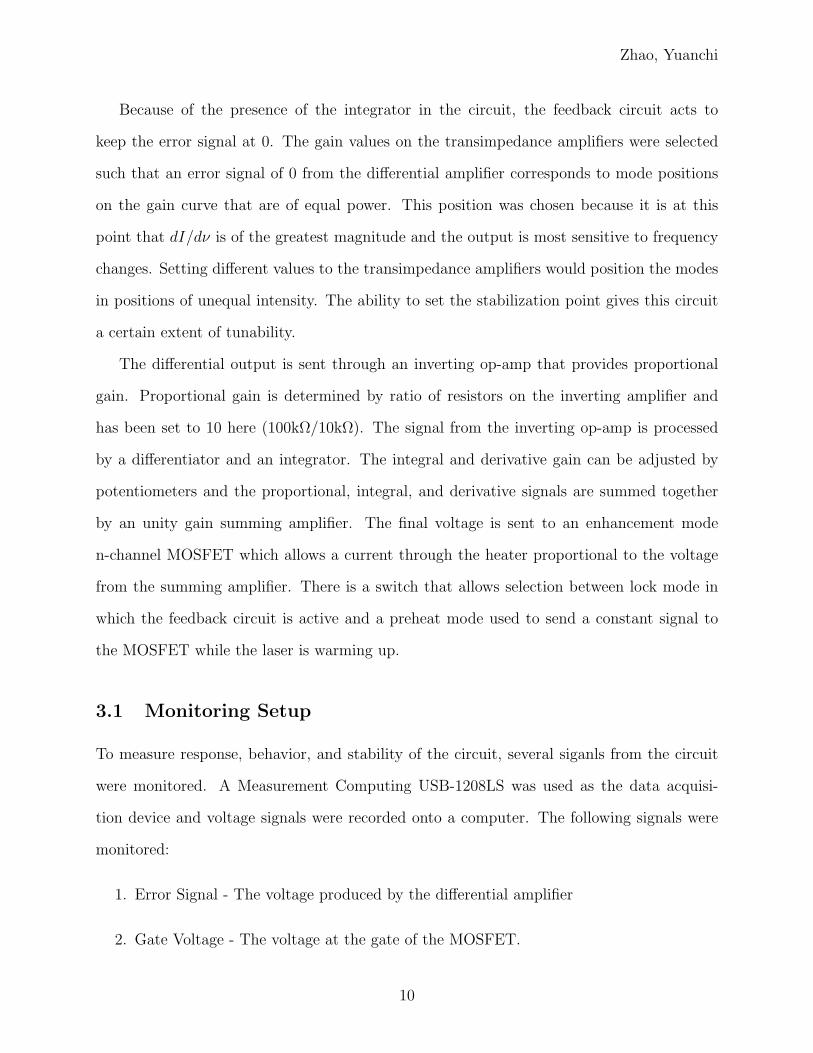
Because of the presence of the integrator in the circuit, the feedback circuit acts to
keep the error signal at 0. The gain values on the transimpedance amplifiers were selected
such that an error signal of 0 from the differential amplifier corresponds to mode positions
on the gain curve that are of equal power. This position was chosen because it is at this
point that dI/dν is of the greatest magnitude and the output is most sensitive to frequency
changes. Setting different values to the transimpedance amplifiers would position the modes
in positions of unequal intensity. The ability to set the stabilization point gives this circuit
a certain extent of tunability.
The differential output is sent through an inverting op-amp that provides proportional
gain. Proportional gain is determined by ratio of resistors on the inverting amplifier and
has been set to 10 here (100kΩ/10kΩ). The signal from the inverting op-amp is processed
by a differentiator and an integrator. The integral and derivative gain can be adjusted by
potentiometers and the proportional, integral, and derivative signals are summed together
by an unity gain summing amplifier. The final voltage is sent to an enhancement mode
n-channel MOSFET which allows a current through the heater proportional to the voltage
from the summing amplifier. There is a switch that allows selection between lock mode in
which the feedback circuit is active and a preheat mode used to send a constant signal to
the MOSFET while the laser is warming up.
3.1 Monitoring Setup
To measure response, behavior, and stability of the circuit, several siganls from the circuit
were monitored. A Measurement Computing USB-1208LS was used as the data acquisi-
tion device and voltage signals were recorded onto a computer. The following signals were
monitored:
1. Error Signal - The voltage produced by the differential amplifier
2. Gate Voltage - The voltage at the gate of the MOSFET.
10
Zhao, Yuanchi
3. Thorlabs DET-110 Photodetector - Laser output light intensity
The gate voltage corresponds to the amount of current flowing through the heater. To
monitor light intensity from the laser, a Thorlabs DET-110 photodetector was used. The
output of the laser travels through a polarizer before hitting the photodetector; this allows
the photodetector monitor the intensity of only modes of one polarization from the laser
and enables the monitoring of fluctuations in power of the laser modes as their frequencies
change. A 10kΩ resistor was attached across the photodetector output in order to convert
the photocurrent into voltage.
3.2 Basis for Stabilization
Using a polarizing beam splitter to separate the two modes inside a dual mode laser, it is
possible to send separate signals to two monitoring photodiodes, which record light inten-
sity. Any modes that resonate within the laser cavity move synchronously as cavity length
changes. As one mode increases in intensity, the other mode will decrease. A feedback
system monitoring the difference between the two light levels will respond appropriately
to maintain the desired positions of the modes. In the method of dual-mode polarization
thermal stabilization, any change in mode frequency produces an error signal in the circuit.
For example, if the cavity expands slightly, the mode wavelengths increase and the mode
frequencies decrease. One mode increases in intensity as it moves to a position with higher
gain as the other decreases in intensity. This generates an error signal and the circuit will
respond by decreasing the heater power and allowing the cavity to shrink again.
11
Zhao, Yuanchi
4 Stabilization Results
4.1 System Stability
Without laser stabilization, monitoring one polarization through a polarizer produces char-
acteristic oscillations in laser intensity as shown in Figure 2. To operate the stabilized laser,
the laser is turned on and the switch on the circuit is set to preheat. After the laser has
reached a high enough temperature for stabilization, the switch is flipped from preheat to
lock. The error signal produced by circuit now either lowers or increases heater power in
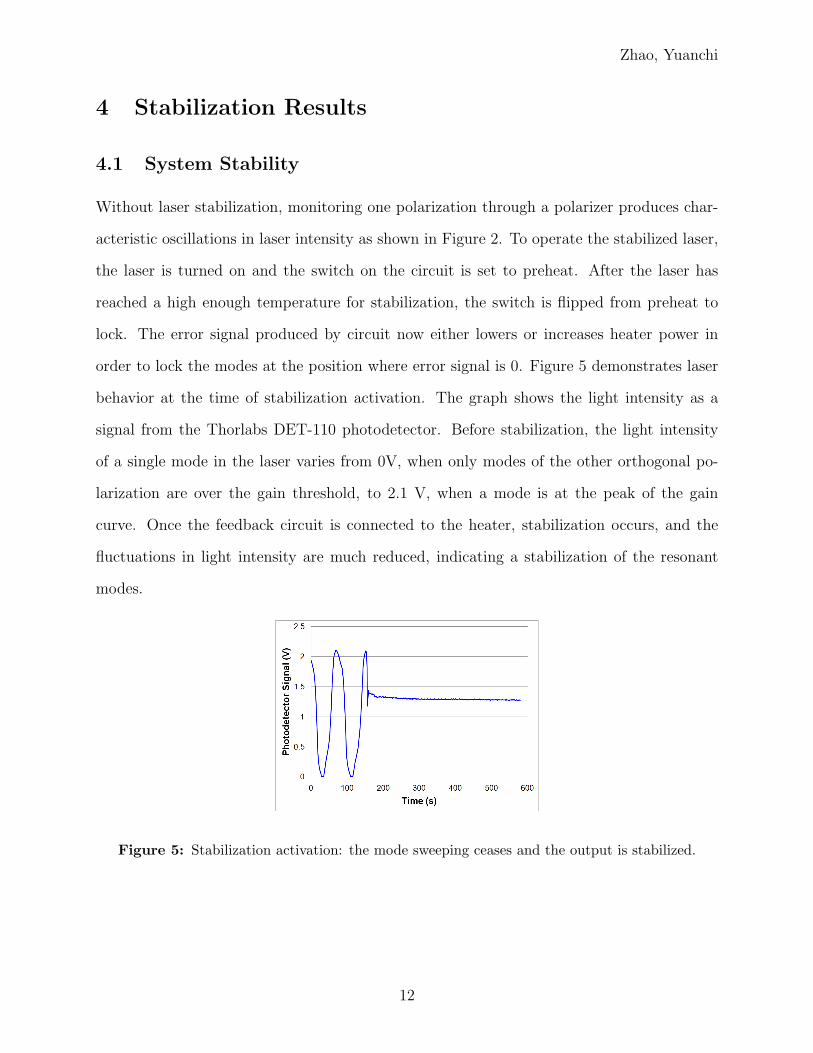
order to lock the modes at the position where error signal is 0. Figure 5 demonstrates laser
behavior at the time of stabilization activation. The graph shows the light intensity as a
signal from the Thorlabs DET-110 photodetector. Before stabilization, the light intensity
of a single mode in the laser varies from 0V, when only modes of the other orthogonal po-
larization are over the gain threshold, to 2.1 V, when a mode is at the peak of the gain
curve. Once the feedback circuit is connected to the heater, stabilization occurs, and the
fluctuations in light intensity are much reduced, indicating a stabilization of the resonant
modes.
Figure 5: Stabilization activation: the mode sweeping ceases and the output is stabilized.
12

Zhao, Yuanchi
Figure 6: A section of the mode sweeping curve from Figure 2
4.2 Estimating Laser Frequency Stability
Wavelength and frequency measurements can be performed in several ways. Stahlberg et al
[4] compared a single-mode stabilized laser to a two-mode stabilized laser by sending both
outputs to a fast photodiode. The heterodyning of the frequencies produced a measurable
beat frequency which can be used to compute a relative stability for both lasers. Often, spe-
cialized equipment such as stabilized Fabry-Perot cavities are needed to check laser stability
[1]. There is, however, a different method of measuring frequency stability that does not
need any equipment other than the existing monitoring hardware and software.
Previously, we have demonstrated the periodic changes in light intensity when only modes
of one polarization orientation are monitored. In that measurement, there is an interval in
which the time interval between each mode peak in light intensity is the same (16.5 seconds)
(Figure 6). This constant time interval indicates that during this time, the laser cavity
expanded at a constant rate which also implies that the rate of change in frequency for each
mode was also a constant rate during this time. Each maximum in this section of the graph
represents a single mode passing through the top of the gain curve. Because only a single
13

Zhao, Yuanchi
mode is monitored and adjacent modes are blocked by the polarizer, when the photodetector
signal is at a minimum, another mode of the orthogonal polarization passes through the top
of the gain curve. Thus each peak and each minimum represents a single mode passing
through the peak of the gain curve.
Given these conditions, there is relationship between light intensity and frequency and it
is possible to replace the time scale on the x-axis in the current mode-sweeping measurement
with a frequency scale. The basis for this is that each peak represents an instance when every
other mode is at the center frequency of the gain curve. From the length of the laser cavity
(14.1 cm), it is known that the spacing between two successive modes is 1060 MHz and
thus each peak, being two modes apart, is 2120 MHz apart. Given the distance between
two peaks is 2120 MHz apart and the time between two peaks is 16.5 seconds, ∆ν/∆t, is
128.5 MHz/s. In order to relate change in intensity to change in time, the slope of the mode
sweeping graph at around the measured stability values for the laser is needed. From the
gain curve in Figure 6, an average value for ∆I/∆t (I is the intensity signal in volts) around
the intensity the laser was stabilized at was found to be 0.5687 V/s. Given those two values,
it is possible to use the following relationship: (∆ν/∆t) ·(∆t/∆I) = (∆ν/∆I). The resulting
value of 226 MHz/V is the relationship between light intensity and frequency and is valid
for intensity ranges close to section on the mode sweeping curve that has the steepest slope.
Multiplying ∆ν/∆I by the range of a stabilized laser’s output provides an estimate of the
frequency stability of a laser.
4.3 System Stability
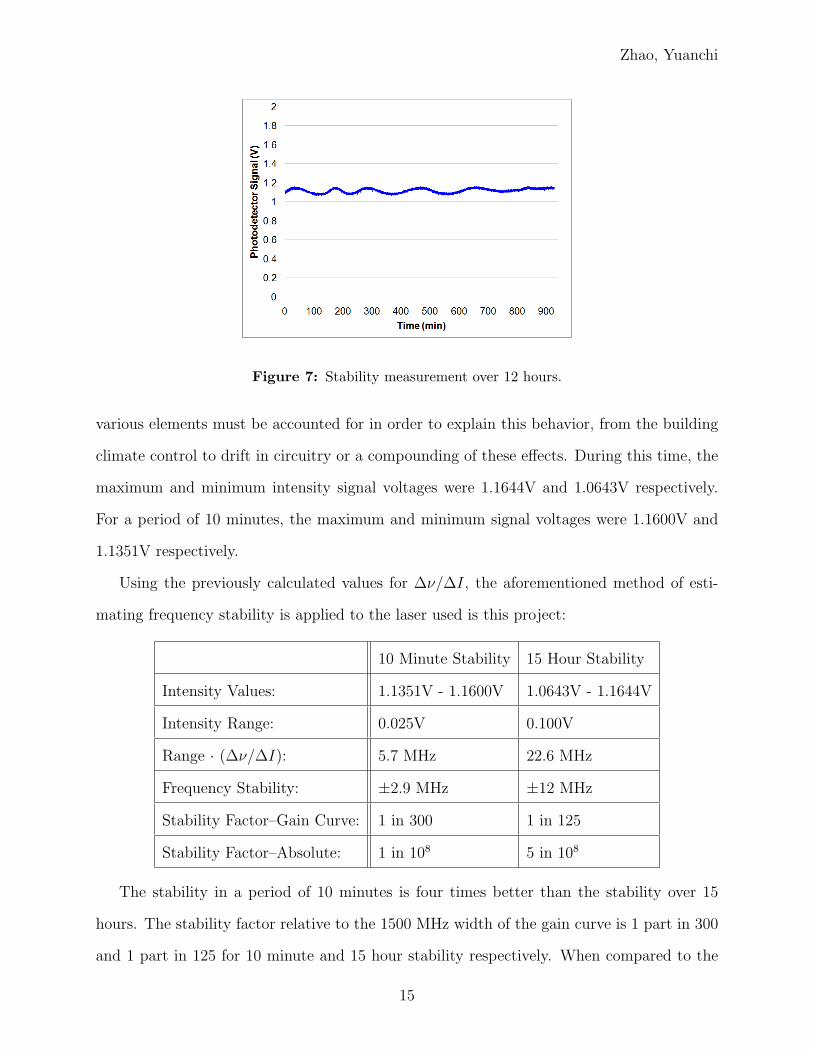
The stability of the laser system has been measured for periods up through 15 hours. Figure 7
is a graph of the stabilized laser intensity for a period of 927 minutes or 15.5 hours. There was
an oscillation in the stabilized laser output during this stability measurement whose cause
remains unknown. The cyclical change in intensity expands the range of values the laser
is stabilized at, negatively affecting stabilization. When dealing with precise frequencies,
14
Zhao, Yuanchi
Figure 7: Stability measurement over 12 hours.
various elements must be accounted for in order to explain this behavior, from the building
climate control to drift in circuitry or a compounding of these effects. During this time, the
maximum and minimum intensity signal voltages were 1.1644V and 1.0643V respectively.
For a period of 10 minutes, the maximum and minimum signal voltages were 1.1600V and
1.1351V respectively.
Using the previously calculated values for ∆ν/∆I, the aforementioned method of esti-
mating frequency stability is applied to the laser used is this project:
10 Minute Stability 15 Hour Stability
Intensity Values: 1.1351V - 1.1600V 1.0643V - 1.1644V
Intensity Range: 0.025V 0.100V
Range · (∆ν/∆I): 5.7 MHz 22.6 MHz
Frequency Stability: ±2.9 MHz ±12 MHz
Stability Factor–Gain Curve: 1 in 300 1 in 125
Stability Factor–Absolute: 1 in 108 5 in 108
The stability in a period of 10 minutes is four times better than the stability over 15
hours. The stability factor relative to the 1500 MHz width of the gain curve is 1 part in 300
and 1 part in 125 for 10 minute and 15 hour stability respectively. When compared to the
15
Zhao, Yuanchi
actual frequency of the He-Ne laser, stability one part in 108 and 5 parts in 108 for 10 minute
and 15 hour stability respectively. Because intensity fluctuations may result from changes
in laser output with change in laser operating frequency, these figures represent an estimate
of the maximum extent of stabilization.
5 System Response Without Feedback
5.1 Open-loop Setup
Essential to optimizing a feedback system is analyzing the behavior of the system without
feedback. To this end, measurements of the behavior of the laser under open loop control,
in which the feedback circuit was inactive, were performed.
To evaluate the system response, a Hewlett-Packard 8116A function generator was con-
nected to the gate on the MOSFET in the heater control. The function generator was set to
output a sine wave voltage signal at an amplitude of 0.450 volts. In these measurements, the
feedback circuit was disconnected and only provided a way to measure the error siganl. The
function generator instead was connected to the circuit with a switch that either blocked or
allowed its output into the circuit.
Varying the heater power around thermal equilibrium affects the cavity length and there-
fore the output of the laser but because of the time to cool or heat the laser tube, a phase
difference was expected between the gate voltage and the laser output. Niebauer et al. [5]
mention that the time for a heat pulse to travel through the glass tubing.
It was predicted that reducing the frequency of gate voltage oscillation would give more
time for the system to respond and therefore the reduce phase shift between the gate voltage
signal and the laser output.
16

Zhao, Yuanchi
Figure 8: The red line is the voltage on the gate and the blue line is the light intensity signalfrom the photodetector.
17

Zhao, Yuanchi
5.2 Laser Behavior
Figure 8 shows the data and that behavior was more complex than predicted. The gate
voltage and photodetector signal have been subtracted so that their center point is about
0 of the y-axis in order so that the relationship between the two can be clearly seen. From
periods of 6.67 seconds (150 mHz) to periods of 200 seconds (5.00 mHz), the phase shift of
the heater response remained a relatively constant π/2. Reducing the frequency of heater
power oscillation only appears to slightly reduce the phase shift but overall the relationship
remains unchanged. It can be said that decreasing the function generator frequency actually
increased the absolute time delay between heater change and laser output change. Note that
with decreasing frequencies, the periods of heating and cooling for the laser system increases
and so the laser cavity length also experiences a greater expansion and contraction oscillation
that results in an increasing amplitude of intensity oscillation.
6 Conclusions and Continuing Work
A circuit based on PID control was designed and built for helium-neon laser frequency
stabilization. Stabilization of one part in 108 was achieved. A quick and convenient way
to estimate laser frequency stability was developed and used. Measurements wtihout the
feedback circuit active were taken to characterize the system and the observed nearly constant
phase shift despite increased period of heater oscillation demonstrates the complexity of the
system.
The behavior of the system as a whole will continue to be characterized in order to better
understand and explain the open-loop behavior results. Data will continue to be collected
in this area in order to discuss with Niebauer et al. the exact effect of heating on the laser
system. The long term measurements of laser stability showed an oscillation in laser output
that increased the range of values the laser was stabilized at. Additional studies must be
performed in order to find the root causes of this behavior and reduce this oscillation.
18

Zhao, Yuanchi
References
[1] W.Z. Zhao, J.E. Simsarian, L.A. Orozco, G.D. Sprouse, “A computer-based digital
feedback control of frequency drift of multiple lasers” Rev. Sci. Instrum. 69, 3737 (1998).
[2] R. Balhorn, H. Kunzmann, F. Lebowsky, “Frequency Stabilization of Internal-Mirror
Helium-Neon Lasers,” Appl. Opt. 11, 742 (1972).
[3] F. Stanek, R.G. Tobin, C.L. Foiles, “Stabilization of a multimode He-Ne laser: A vivid
demonstration of thermal feedback,” Am. J. Phys. 61, 932 (1993).
[4] B. Stahlberg, P. Jungner, T. Fellman, “A very simple stabilized single-mode He-Ne laser
for student laboratories and wave meters,” Am. J. Phys. 58, 878 (1990).
[5] T.M. Niebauer, J.E. Faller, H.H. Godwin, J.L. Hall, R.L. Barger, “Frequency stability
measurements on polarization-stabilized He-Ne lasers,” Appl. Opt. 27, 1285 (1988)
[6] G.A. Woolsey, M.Y. Sulaiman, M. Mokhsin, “Correlation of changes in laser tube tem-
perature, cavity length, and beam polarization for an internal-mirror helium-neon laser,”
Am. J. Phys. 50, 936 (1982).
[7] A. Siegman, Lasers. Mill Valley, CA: University Science Books, 1986.
[8] G. Gandolfi, A. Sabatini, M. Rossolini, “PID feedback controller used a tactical asset
allocation technique: The G.A.M. model,” Physica A 383, 71 (2007).
[9] W.K. Ho, Y. Hong, A. Hansson, H. Hjalmarsson, J.W. Deng, “Relay auto-tuning of
PID controllers using iterative feedback tuning,” Automatica 39, 149 (2003).
[10] D.R. Westenskow, “Fundamentals of feedback control: PID, fuzzy logic, and neural
networks,” J. Clinical Anesthesia 9, 33S (1997).
[11] C.D.H. Williams, “Feedback and Temperature Control,” University of Exeter, Novem-
ber 2008. http://newton.ex.ac.uk/teaching/CDHW/Feedback/.
[12] R. Mancini, Op Amps For Everyone. Texas Instruments, 2002.
[13] S. Goldwasser, Sam’s Laser FAQ, November 2008.
http://www.repairfaq.org/sam/lasersam.htm.
19