implementing school malaria surveys in kenya: towards a national surveillance...
TRANSCRIPT

RESEARCH Open Access
Implementing school malaria surveys in Kenya:towards a national surveillance systemCaroline W Gitonga1*, Peris N Karanja1, Jimmy Kihara2,3, Mariam Mwanje2, Elizabeth Juma4, Robert W Snow1,5,Abdisalan M Noor1,5, Simon Brooker1,6*
Abstract
Objective: To design and implement surveys of malaria infection and coverage of malaria control interventionsamong school children in Kenya in order to contribute towards a nationwide assessment of malaria.
Methods: The country was stratified into distinct malaria transmission zones based on a malaria risk map and480 schools were visited between October 2008 and March 2010. Surveys were conducted in two phases: an initialopportunistic phase whereby schools were selected for other research purposes; and a second phase wherebyschools were purposively selected to provide adequate spatial representation across the country. Consent forparticipation was based on passive, opt-out consent rather than written, opt-in consent because of the routine,low-risk nature of the survey. All children were diagnosed for Plasmodium infection using rapid diagnostic tests,assessed for anaemia and were interviewed about mosquito net usage, recent history of illness, and socio-economic and household indicators. Children’s responses were entered electronically in the school and datatransmitted nightly to Nairobi using a mobile phone modem connection. RDT positive results were corrected bymicroscopy and all results were adjusted for clustering using random effect regression modelling.
Results: 49,975 children in 480 schools were sampled, at an estimated cost of US$ 1,116 per school. The overallprevalence of malaria and anaemia was 4.3% and 14.1%, respectively, and 19.0% of children reported using aninsecticide-treated net (ITN). The prevalence of infection showed marked variation across the country, withprevalence being highest in Western and Nyanza provinces, and lowest in Central, North Eastern and Easternprovinces. Nationally, 2.3% of schools had reported ITN use >60%, and low reported ITN use was a particularproblem in Western and Nyanza provinces. Few schools reported having malaria health education materials orongoing malaria control activities.
Conclusion: School malaria surveys provide a rapid, cheap and sustainable approach to malaria surveillance whichcan complement household surveys, and in Kenya, show that large areas of the country do not merit any directschool-based control, but school-based interventions, coupled with strengthened community-based strategies, arewarranted in western and coastal Kenya. The results also provide detailed baseline data to inform evaluation ofschool-based malaria control in Kenya.
BackgroundThe epidemiology of malaria in sub-Saharan Africa (SSA)is in transition, with funding agencies dedicating substan-tial resources in tackling malaria and national govern-ments making great efforts in increasing access tomalaria control interventions. It is essential that this
transition is accurately monitored in order to evaluatethe impact of interventions but also to allow for bettertargeting of interventions. A number of studies provideevidence of declining malaria-related mortality and mor-bidity [1-6], but there is, surprisingly, little evidence ofthe impact of control on malaria transmission. This ismost commonly measured on the basis of the parasiterate (PR), since it is readily measured in the field and pro-vides reliable information on other measures of malariatransmission, including the entomological inoculationrate and basic reproductive number [7]. Consequently,
* Correspondence: [email protected]; [email protected] Public Health & Epidemiology Group, Kenya Medical ResearchInstitute-Wellcome Trust Research Programme, Nairobi, KenyaFull list of author information is available at the end of the article
Gitonga et al. Malaria Journal 2010, 9:306http://www.malariajournal.com/content/9/1/306
© 2010 Gitonga et al; licensee BioMed Central Ltd. This is an Open Access article distributed under the terms of the Creative CommonsAttribution License (http://creativecommons.org/licenses/by/2.0), which permits unrestricted use, distribution, and reproduction inany medium, provided the original work is properly cited.

estimates of PR form the best evidence base for planning,implementing and evaluating control, with PR amongchildren aged two to 10 years providing a standard mea-sure of PR [8]. To date, malaria monitoring and evalua-tion of interventions in malaria endemic countries inSSA has been mainly based on periodic national house-hold surveys, including malaria indicator survey [9] aswell as malaria modules of demographic health surveys[10] and multiple indicator cluster surveys [11], whereyoung children and pregnant women form the samplepopulation. The principal advantages of such householdsurveys are that they adequately capture the underlyingvariation in the sampled population and the flexibility ofdata collection instruments which can accommodate anumber of questions on a variety of topics. However,household surveys are expensive, time consuming andlabour intensive, and generally only undertaken every 3-5years and therefore not ideal for routine monitoring atlocal levels. Furthermore, estimates of Plasmodium infec-tion collected among young children and pregnant maynot be optimal due to the modifying presence of mater-nal antibodies and sequestered parasites [12]. A cheaperand rapid complementary approach to household surveyswould be to use the existing school system for school-based malariometric surveys [12].Historically, such school surveys were routinely con-
ducted as part of malaria surveillance in Africa [12] andtoday, school surveys for helminth infections are anessential component of the design and evaluation of hel-minth control [13,14]. Learning from these historic andcontemporary experiences, this paper reports the studydesign and main findings of a series of large-scale schoolmalaria surveys in Kenya, with a view to informingfuture nationwide school-based surveillance. Particularguidance is provided on the consent for participation,field logistics and implementation of the survey andreflection is made on the ethical, practical and methodo-logical issues encountered in conducting malaria surveysin schools.
MethodsThe Kenyan contextThe epidemiology of malaria in Kenya has been chan-ging with reported reductions in malaria associated hos-pital admissions and mortality in children under the ageof five years [15-17]. These changes have been, in part,attributed to the increase in coverage and access tomalaria control interventions, such as insecticide-treatednets (ITNs), artemisinin-based combination therapy(ACT) and indoor residual spraying (IRS) [18]. In aneffort to scale up ITN coverage, Kenya has adopted sev-eral ITN distribution strategies over the years, includingsocial marketing, subsidized nets through the maternaland child clinics, and mass campaigns [18,19]. Other
malaria control efforts include the change of the treat-ment policy in 2004 and implemented in 2006 to adoptthe more efficacious ACT as well as IRS in the epidemicprone districts.In 2009, the Government of Kenya launched its
National Malaria Strategy (NMS), 2009-2017. This iden-tified the need to tailor malaria control interventions tothe local diversity of malaria risk, target specific popula-tion sub-groups to achieve effective and sustainable con-trol, and strengthen the surveillance, monitoring andevaluation systems [20]. One approach to target popula-tion sub-groups includes the control of malaria inschools under a Malaria-free Schools Initiative. Theseplans for school-based malaria control build on recentsuccess in delivering deworming through schools inKenya. Implementation of the national programme wasguided by school surveys of helminth infection whichshowed that mass treatment was only warranted inselected regions of the country [21] thereby increasingthe efficiency of the programme. Before appropriatesuites of malaria intervention can be planned efficientlyfor the Malaria-free schools initiative, equivalent dataare required concerning the prevalence and distributionof malaria, anaemia, and intervention coverage acrossthe country.The Kenya NMS also included the proposal to under-
take school malaria surveys to monitor trends of malariatransmission in the context of increasing interventioncoverage. Such school surveys have a historical prece-dent in Kenya, dating back to the 1950 s, when the Divi-sion of Vector Borne Diseases (DVBD) was establishedand school surveys of malaria, helminths and otherparasites were one of its core activities. Routine schoolsurvey stopped in the 1980 s due to financial constraintsand deteriorating school enrolment rates [22].The renewed potential for school malaria surveys
builds on the increased funding for malaria surveillancebut also recent improvements in primary school enrol-ment in Kenya. There are a total of 19,177 governmentprimary schools, the majority (98.5%) of which are dayschools with pupils living at home. Primary education inKenya begins at the age of 6 or 7 years old after comple-tion of a year of nursery school and includes eight yearsof schooling. The Kenyan school year runs from Januaryto December. In the 1980 s and 1990 s, there was agrowth of privately owned schools while the governmentschools deteriorated. In 2003, the Government of Kenyare-introduced free primary education, resulting in amarked increase in school enrolment. However, parentsmust pay fees for uniforms and other items and somepoorer children still do not attend primary school. Theoverall net enrolment rate (NER: ratio of children of offi-cial school age who are enrolled in school to the popula-tion of the corresponding official school age.) in Kenya
Gitonga et al. Malaria Journal 2010, 9:306http://www.malariajournal.com/content/9/1/306
Page 2 of 13

was 91.6% in 2007, but this ranged from 27.5% in NorthEastern Province to 97.8% in Nyanza Province [23].
Sample design and study populationThe surveys were conducted in two principal phases(see Figures 1 and 2), based on the availability ofresources at the time and intended purposes of eachphase. The first phase was opportunistic in terms ofmalaria surveillance and included 65 schools sampled inthree contiguous districts (the 1999 districts of Kwale,Kilifi and Malindi) along the Kenyan Coast, September-October 2008, as part of baseline surveys aimed atinforming the implementation of the national schooldeworming programme (Figure 2). These surveys soughtto define the prevalence of Plasmodium infection in agiven district based on 95% confidence limits, 80%power, and a design effect of 2. Based on these assump-tions, a minimum sample size of 16 schools per districtwas calculated as necessary to estimate prevalence of5%, with 1% precision. An additional 54 schools weresampled as part of an evaluation of school net distribu-tion programmes along the Tana River (Figure 2). Thesesurveys meant that all districts in Coast Province, exceptLamu District, were included in the first phase of thesurvey.Based on these initial surveys, the second phase
sought to create a nationwide sample of schools toallow for adequate spatial representation of malariaacross the country, rather than provide precise estima-tion of prevalence at national and sub-national levels.Schools were selected from all remaining districts acrossthe country with the exception of semi-arid districts in
northern and southern Rift Valley Province (Figure 2).The sampling frame for this selection was the nationalschools census undertaken by the Ministry of Education(MoE) in 2008 of primary, secondary, public and privateschools nationwide (MoE, 2008). For the purposes ofthe present survey, only public, mixed primary schoolswere selected as the universe of sampling, totalling19,177. From this universe, approximately five schoolsin each of 70 district boundaries used during the 1999census were selected. The selection of schools in eachdistrict was not weighted by population or fully randomsince schools were selected to provide adequate spatialspread of school locations, a requirement of geostatisti-cal modelling of risk across space and time [24]. Finally,two over-sampling adjustments were undertaken:schools were over-sampled, disproportionate to districtweighted school distributions, in the sparsely populatedareas of North Eastern Province to increase the powerof spatial interpolation of risk in these areas; and sec-ond, schools were purposively over-sampled schools inCentral Kisii, Gucha and Rachuonyo districts whereindoor residual spraying programmes were rolled out in2008 to investigate impacts with time in these areas.A total of 361 schools were surveyed in the secondphase during the second and third term of the 2009-2010 school year (June-November, 2009) and the firstterm (January-March, 2010) (Figure 2). The final sampleincluded 480 schools sampled for malaria infection pre-valence between September 2008 and March 2010.Taking into account a combination of sample preci-
sion, logistics and costs, it was decided that a randomlyselected sample of 100 children (plus 10 reserves) per
Figure 1 Flow chart showing the two principle phases of the school malaria surveys, including timelines, rapid diagnostic test typeand other indication data collected.
Gitonga et al. Malaria Journal 2010, 9:306http://www.malariajournal.com/content/9/1/306
Page 3 of 13
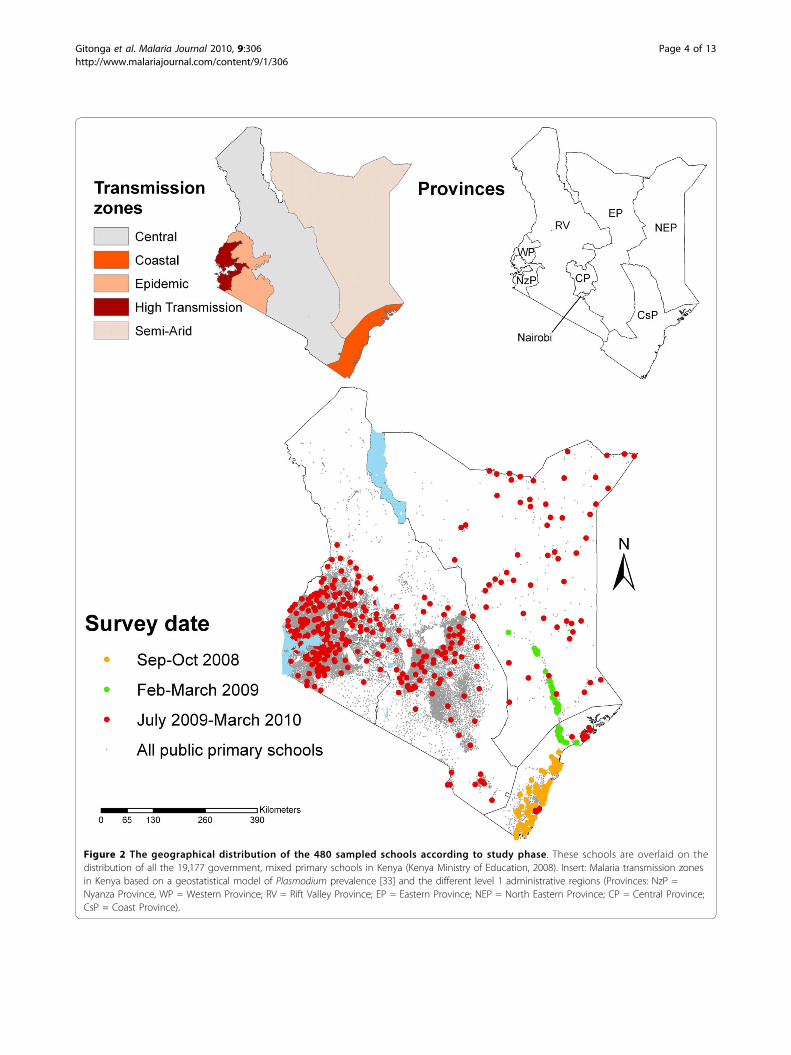
Figure 2 The geographical distribution of the 480 sampled schools according to study phase. These schools are overlaid on thedistribution of all the 19,177 government, mixed primary schools in Kenya (Kenya Ministry of Education, 2008). Insert: Malaria transmission zonesin Kenya based on a geostatistical model of Plasmodium prevalence [33] and the different level 1 administrative regions (Provinces: NzP =Nyanza Province, WP = Western Province; RV = Rift Valley Province; EP = Eastern Province; NEP = North Eastern Province; CP = Central Province;CsP = Coast Province).
Gitonga et al. Malaria Journal 2010, 9:306http://www.malariajournal.com/content/9/1/306
Page 4 of 13

school would be optimal as this was the number of chil-dren, which could practically be sampled in a single day.In each school, 11 boys and 11 girls were selected fromeach of classes 2-6 using computer generated randomtable numbers. If there were insufficient pupils in theseclasses, additional pupils were sampled from class 1.Some of the schools visited were small, and this meantthat in these schools all children were selected toachieve the target sample size and fewer than 110 chil-dren were present and, therefore, examined.
Team composition and logisticsMobile survey teams consisted of a team leader, threelaboratory technicians and three interviewers. Techni-cians were typically from the Division of Vector Borneand Neglected Tropical Diseases (DVBNTD) of Ministryof Public Health and Sanitation, holding diplomas orfirst degrees and who had extensive experience of con-ducting school surveys. Interviewers were either fromthe Ministry of Public Health and Sanitation or Ministryof Education, who had previous survey experience. Eachteam was supervised from an experienced researcherfrom the Kenyan Medical Research Institute (KEMRI) orKEMRI-Wellcome Trust Research Programme. Theseteams were accompanied by an education officer fromthe district education office who helped teams locateschools.All team members underwent training in all survey
procedures and received a field manual outlining thesurvey purpose and methods (see Additional file 1).Data collection occurred during the course of a schoolterm, with each team travelling in a single vehicle withsupplies necessary for a single term. An exception washeat sensitive supplies, such as malaria rapid diagnostictests (RDTs) and haemoglobin microcuvettes, whichwere sent to teams on a weekly or fortnightly basis.Teams sent back blood slides and filter papers to Nair-obi weekly in appropriate storage.
Community sensitizationThis took place at national, provincial and district levelsbefore visiting the schools, using a cascade approach. Atthe national levels, the study was approved by the Divi-sion of Malaria Control, Ministry of Public Health andSanitation and the Director of Basic Education, Ministryof Education. Supporting letters from these ministrieswere sent to provincial health and education officers,detailing the purpose of the survey, survey timetable andprocedures. Upon arriving in a province, meetings wereheld with the Provincial Medical Officers and the Pro-vincial Directors of Education. These offices providedfurther letters of support to relevant district authoritiesand in each district, meetings were held with relevantdistrict health and education officials.
Surveys proceduresSelected children were asked to provide a finger-prickblood sample, which was used to assess Plasmodiuminfection in the peripheral blood and haemoglobin con-centration. Children had both a RDT, which gave anon-the-spot diagnosis, and provided thick and thinblood films for microscopy. The RDT used differedaccording to survey phase (see Figure 1 and Table 1).The majority of children were tested with either a Para-Check-Pf device or a ParaCheck-Pf dipstick [25], thesetests are able to detect P. falciparum. During theSeptember-October 2008 surveys on the coast, the RDTused was OptiMAL-IT [26] able to detect P. falciparumand other, non-falciparum plasmodia species. For sur-veys conducted in January-March 2010, the main RDTused was CareStart Malaria Pf/Pv Combo [27] whichcan detect both P. falciparum and P. vivax. Prior to use,RDTs were stored at room temperature and transported
Table 1 The number of schools and number of schoolchildren by study phase, malaria transmission zone, agegroup, sex, malaria rapid diagnostic test (RDT) used,included in school malaria surveys in Kenya, 2008-2010
Schools N children (%)
Study phase
Sept-Oct 2008 65 6,884 (13.8)
Feb-March 2009 54 5,694 (11.4)
June 2009-March 2010 361 37,397 (74.8)
Malaria transmission zone
High transmission lakeside 80 8,186 (16.4)
Western highland epidemic 100 10,819 (21.7)
Coast moderate risk 95 10,172 (20.4)
Central low risk 110 11,275 (22.6)
North eastern semi arid 95 9,523 (19.1)
Age group
5-9 years 12,338 (24.7)
10-15 years 33,650 (67.3)
>15 years 3,763 (7.5)
Missing1 224 (0.5)
Sex
Male 25,656 (51.3)
Female 24,217 (48.5)
Missing1 102 (0.2)
RDT test
CareStart Malaria Pf/Pv Combo 96 9,064 (18.2)
OptiMAL-IT 71 7,801 (15.6)
ParaCheck device 246 26,326 (52.8)
ParaCheck dipstick 67 6,700 (13.4)1Data was not recorded.
Gitonga et al. Malaria Journal 2010, 9:306http://www.malariajournal.com/content/9/1/306
Page 5 of 13

to the school in a cooler box and the desiccant in theRDTs was inspected for colour changes before use, andthe RDT discarded if the colour had changed. Childrenwith positive RDTs and documented fever were pro-vided with artemether-lumefantrine (Coartem, Novartis,artemether 20 mg/lumefantrine 120 mg) according tonational guidelines.In all 480 schools, thick and thin blood smears were
also prepared for each child. Slides were labelled and air-dried horizontally in a carrying case in the field, andstained with 3% Giemsa for 45 minutes at the nearesthealth facility when the teams returned from the school.Due supply difficulties in securing Hemocue curvettes forall schools, haemoglobin concentration was assessed in399 schools and estimated to an accuracy of 1 g/L usinga portable haemoglobinometer (Hemocue Ltd, Angel-hölm, Sweden). Children identified as severely anaemic(haemoglobin levels <70 g/L) were referred to the nearesthealth facility for treatment according to national guide-lines. Transportation costs were provided and an agree-ment was reached with facilities to waive drug costs.A questionnaire was administered to pupils to obtain
data on mosquito net ownership and use and when trea-ted, recent travel history, recent history of illness, keysocio-economic variables such as household construc-tion, education level of the child’s guardian and owner-ship of household items such as mobile phones. Anadditional questionnaire was administered to the headteacher to collect information on ongoing school healthactivities, including malaria control, as well as informa-tion, education and communication (IEC) material onmalaria. The pupil and school questionnaire data will beused in future analyses. The geographical location ofeach school was determined using a Garmin eTrex glo-bal positioning system [28].
Expert microscopyBlood smears of all RDT-positive children, where avail-able, and an equivalent number of randomly selectedblood slides from RDT-negative children were examinedby expert microscopy either at the KEMRI-WellcomeTrust laboratory in Kilifi or the KEMRI laboratory inNairobi. Parasite densities were determined from thickblood smears by counting the number of asexual para-sites per 200 white blood cells (or per 500 if the countwas less than 10 parasites/200 white cells), assuming awhite blood cell count of 8,000/μl. A smear was consid-ered negative after reviewing 100 high-powered fields.Thin blood smears were reviewed for species identifica-tion. Two independent microscopists read the slides,with a third microscopist resolving discrepant results(see Additional file 2 for microscopy results flowchart).Of the 6,655 slides examined, the overall sensitivity andspecificity of the RDTs was 96.1% (95% CI: 95.2-96.9)
and 61.6% (95% CI: 60.2-63.0). Diagnostic performancewas similar for three types, but very poor for CareStart:94.9% sensitivity and 77.4% specificity for OptiMal;96.2% sensitivity and 68.7% specificity for Paracheckdevice; 96.3% sensitivity and 76.0% specificity for Para-check dipstick; and 100% sensitivity and 2.0% specificityfor CareStart. In light of the poor performance ofCareStart, we only present slide-corrected RDT results.A more detailed investigation of the reliability of RDTsin the context of school-based malaria surveillance isthe subject of future work.
Electronic data captureChildren’s responses were entered electronically in theschool on either ASUS Eee PC 1005P or Acer AspireOne d250 netbook computers using a customizedMicrosoft Access database, which included in-builtchecks to prevent some errors altogether and immedi-ately prompting for resolution of other errors. Compu-ters were powered by batteries, backed up by solarpanels or small diesel generators. At the end of eachday, interview data were combined with parasitologicaldata and transmitted nightly to Nairobi using a mobilephone modem connection. In some parts of northernKenya, delays of 1-2 days were experienced in transmit-ting the data due to poor network coverage.
Data analysisData were analyzed using STATA version 11.0 (STATACorporation, College Station, TX, USA). The locationsof schools were linked with survey data and mappedusing Arc GIS 9.2 (ESRI, Redlands, CA, USA).Anaemia was defined as a haemoglobin concentration
<130 g/L for male children above 15 years, <120 g/L forchildren aged 12-14 years and female children above15 years, <115 g/L for children aged 5-11 years and<110 g/L for children aged less than five years, withadjustment made for altitude of the school [29]. Severeanaemia was defined as a haemoglobin level <70 g/L.Results were adjusted for clustering at the school-level
using random effects regression modelling [30]. Specifi-cally, national- and province-level estimates of Plasmo-dium infection and corresponding 95% binomialconfidence intervals (CI) were estimated using a zeroinflated Poisson (ZIP) model to account for the excess ofschools with zero prevalence. The ZIP model wasfavoured over a standard Poisson model on the basis ofthe Vuong test [31]. The ZIP model was used for all theprovincial level estimates of Plasmodium infection exceptfor Nairobi and Rift Valley provinces where a standardPoisson model was used. National and Province-levelestimates of anaemia and net use were estimated usinggeneralized linear and latent mixed models (GLLAMM)adjusted for clustering at the school level.
Gitonga et al. Malaria Journal 2010, 9:306http://www.malariajournal.com/content/9/1/306
Page 6 of 13
The overall financial cost of the survey was estimatedfrom the project accounting system, with costs dividedinto staff, transport, operating costs and consumables.
Ethical considerationsThe study protocol received ethical approval from theKenya Medical Research Institute and National EthicsReview Committee (numbers 1407 and 1596). Addi-tional approval was provided by the Permanent Secre-tary’s office of the Ministry of Education (MoE) and theDivision of Malaria Control, Ministry of Public Healthand Sanitation. All national, provincial and district-levelhealth and education authorities were briefed about thesurvey purpose and selected schools. Official letters ofsupport were prepared by Provincial MoE officers.Head teachers were briefed about the survey and were
provided with an information sheet detailing the surveyprocedures and asking for their permission to have theirschool involved in the survey. The head teachers werealso asked to inform the students, parents and the schoolcommittee members about the survey and obtain theirapproval for the study. Parents/guardians who did notwant their children to participate in the study were freeto refuse participation. If a parent or guardian chose notto allow their children to participate in the survey, thechild’s name was removed from the school rolls. On thesurvey day, the survey team leader informed all childrenin the school about the sampling and survey procedures,making it clear to their participation was voluntary andthat they may opt out of the testing at any time if theychoose to. After randomly sampling the students fromthe classrooms, individual assent was also obtained fromthe children before samples were collected. Very few chil-dren refused to participate in the survey and thereforereplacement sampling was not required. Individual writ-ten parental consent was not sought since the survey wasconducted under the auspices of the Division of MalariaControl, Ministry of Public Health and Sanitation, whichhas the legal mandate to conduct routine malaria surveil-lance, and because only routine diagnostic procedureswere undertaken.
ResultsSurvey processThe surveys were carried out in two main phases (Figure 2and Table 1): first, two independent surveys, September2008 to March 2009; and second, a purposively selectedsample of 361 schools, June 2009 to February 2010. Up tofive separate teams were in the field at any one time,including up to 24 laboratory technicians. These wereeither recruited locally in each province from the Ministryof Public Health and Sanitation’s Division of Vector Borneand Neglected Tropical Diseases, or recruited in Nairobifrom KEMRI’s Eastern and Southern Africa Centre of
International Parasite Control (KEMRI/ESACIPAC). Themajority technicians had prior experience of carrying outschool surveys. Mobile telephone coverage was availablethroughout most of Kenya, enabling sending of data toNairobi on a daily basis.The average cost of surveying one school was esti-
mated to be US$ 1,116. The largest cost component wasstaff (32.0%), following by transport (26.9%). Operatingcosts included laboratory consumables, courier servicesand hiring of mini-laptop computers and accounted for24.7% of total costs. Other costs included slide reading(7.2%) and administration costs (9.2%).
Characteristics of study participantsA total of 49,975 children in 480 schools across Kenyawere included in the survey. Table 1 presents the char-acteristics of the study children and their schools. Ineach school, an average of 103 (range 23 - 115) childrenwas selected, with an equivalent number of boys andgirls sampled (51.3% boys). The median age was 11years (inter-quartile range: 10-13 years) and most chil-dren (67.3%) were in the 10 to 15 age group. The major-ity (74.8%) of schools were surveyed during the secondphase of the surveys, June 2009-March 2010. Data onmalaria infection and ITN use were collected in allschools, whereas haemoglobin concentration wasassessed in 399 schools.
Malaria infectionThe overall prevalence of infection, based on slide-corrected RDT positivity, was 4.3 (95% CI, 3.3 - 5.2).The vast majority (96.8%) of these infections were P. fal-ciparum, with the remainder being either P. ovale (0.1%)or P. malariae (0.6%) or mixed infections (2.6%); noP. vivax was detected. Prevalence was significantlyhigher in children aged 5-9 and 10-14 years old (4.4%)than children older than 15 years (2.8%, p < 0.0001), butdid not significantly differ between males and females(4.3% vs. 4.2%, p = 0.53). The prevalence of malariainfection by province is shown in Table 2 and the geo-graphical distribution of malaria is shown in Figure 3a.Prevalence varied markedly by school (0 - 70.9%) and byprovince, being highest in Western Province (21.6%,95% CI: 14.6 - 28.7%) and lowest in Central and NorthEastern provinces, where no child was found to beinfected in any school (Table 2). Prevalence was <5% inall other provinces, except Nyanza Province (9.3%, 95%CI: 6.8 - 11.9%). Eleven (2.3%) schools had a parasiteprevalence ≥40% and all of these were located aroundLake Victoria (Figure 3a).
AnaemiaThe overall prevalence of anaemia was 14.1% (95% CI:13.0-15.3%) and the mean haemoglobin concentration
Gitonga et al. Malaria Journal 2010, 9:306http://www.malariajournal.com/content/9/1/306
Page 7 of 13
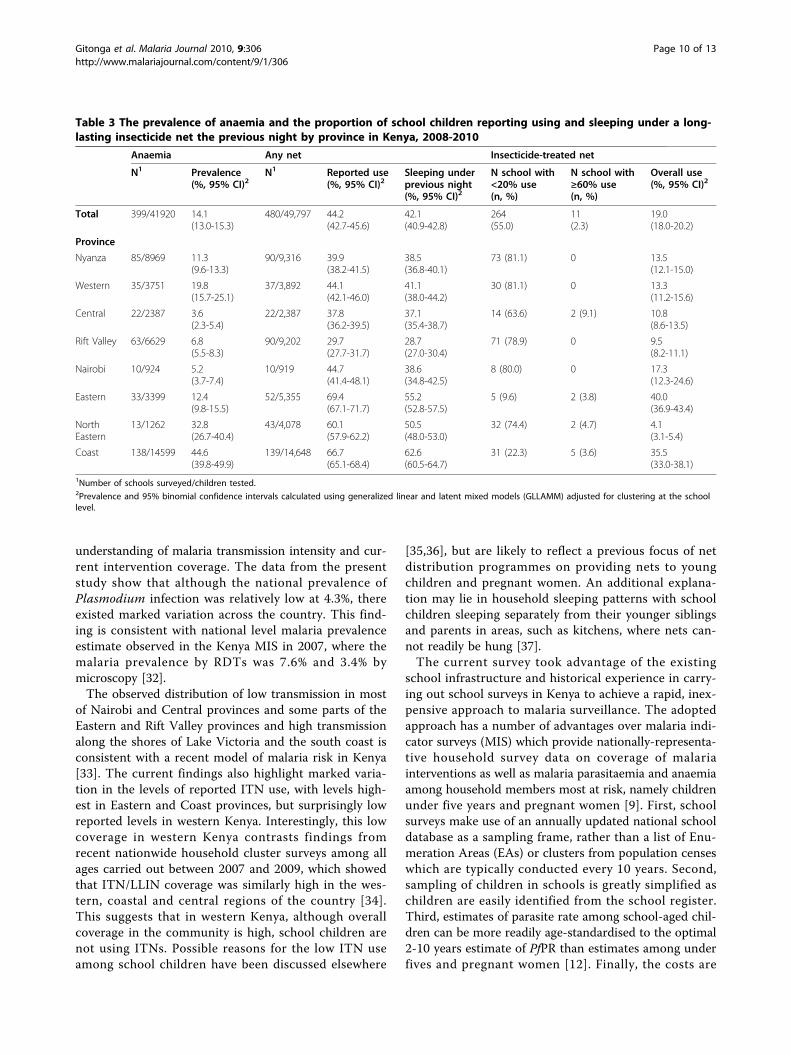
was 128.8 g/L (95% CI: 127.9-129.7 g/L). Anaemia wasmore common among children aged 15 years and above(38.6%, 95% CI: 33.1-44.9%) than 10-14 years (14.9%,95% CI: 12.6-17.5%) and 5-9 year olds (14.0%, 95% CI:14.1-18.1%). There was no difference in prevalence ofanaemia among males and females (13.3% (95% CI:12.1-14.7) vs 13.3 (95%CI: 12.0-14.8)). Anaemia variedmarkedly by school (0-75%, figure 3b) and was morecommon in Coast Province and least common in Cen-tral Province (Table 3).
Reported ITN useOverall, 44.2% (95% CI: 42.7-45.6%) of children reportedhaving a bed net and 42.1% (95% CI: 40.9-42.8%)reported sleeping under a net the previous night. How-ever, of the children asked about sleeping under an ITN,less than a quarter (19.0%, 95% CI: 18.0-20.2%) reportedsleeping under an ITN while 6.4% did not knowwhether their nets were ITNs or not. The majority(70.9%, 95% CI: 68.6-73.2%) of nets, non-ITNs or ITNs,were reportedly obtained from the health facilities.Reported use of ITNs varied markedly across the coun-try (Figure 3c), and was <20% in the majority (55.0%) ofschools, especially in Nyanza and Western Provinces;disappointedly, only eleven schools had reported ITNuse >60% (Table 3). In terms of household net owner-ship, 80.3% of children reported having at least one bednet in their household while 77.1% reported more thanone net in their households. Nyanza Province had thehighest number of children reporting having at least onenet in their household (88.9%) while Central Provincehad the lowest (57.1%).
Fever and absenteeismOverall, 13.5% of children reported a fever on the day ofthe survey, but of the children that had their axillarytemperature measured only 733 (2.4%) children had atemperature >37.5°C. Of these febrile children, only 55(7.5%) children had a malaria infection. Of the childrenasked about their absenteeism history (n = 37,288),26.9% of children reported being absent from schooldue to illness for at least one day in the last two weeks,with the commonest cause of illness being headache(56.7%), whilst 17.0% reported malaria as the cause forabsenteeism.
Malaria control activitiesA comprehensive school level questionnaire was admi-nistered in 344 schools, predominantly in Western, Cen-tral, Rift Valley and Nyanza provinces during the secondphase of the survey. Of these schools, only 59 (17.2%)reported having had any malaria control activities, suchas indoor residual spraying of the school buildings anddraining of stagnant water, in the last 12 months andthe majority (21) of these schools were located in themalaria high transmission zone. Only, seven schools hadmalaria IEC materials in at least 1 classroom, 8 had IECmaterials in the head teacher’s office while 17 schoolshad IEC booklets in the school library.
DiscussionReliable, contemporary data are essential prerequisitesfor the planning and implementation of effective malariacontrol. Each national programme needs to be tailoredto its specific national context, based on a cartographic
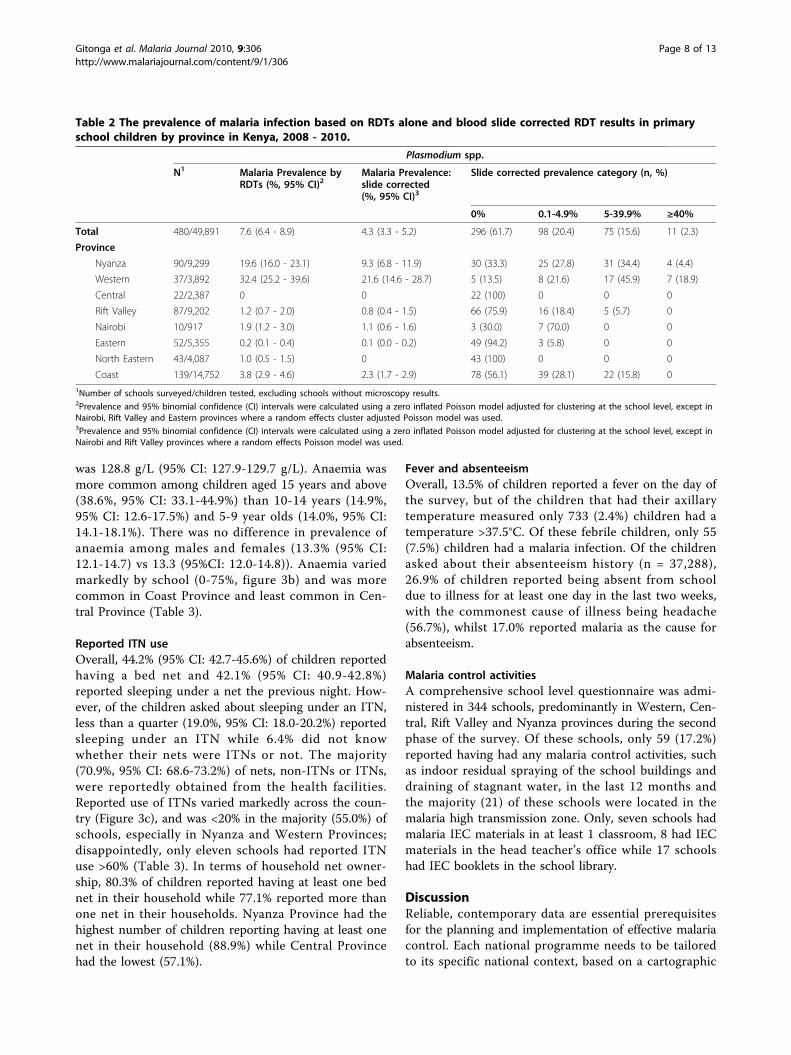
Table 2 The prevalence of malaria infection based on RDTs alone and blood slide corrected RDT results in primaryschool children by province in Kenya, 2008 - 2010.
Plasmodium spp.
N1 Malaria Prevalence byRDTs (%, 95% CI)2
Malaria Prevalence:slide corrected(%, 95% CI)3
Slide corrected prevalence category (n, %)
0% 0.1-4.9% 5-39.9% ≥40%
Total 480/49,891 7.6 (6.4 - 8.9) 4.3 (3.3 - 5.2) 296 (61.7) 98 (20.4) 75 (15.6) 11 (2.3)
Province
Nyanza 90/9,299 19.6 (16.0 - 23.1) 9.3 (6.8 - 11.9) 30 (33.3) 25 (27.8) 31 (34.4) 4 (4.4)
Western 37/3,892 32.4 (25.2 - 39.6) 21.6 (14.6 - 28.7) 5 (13.5) 8 (21.6) 17 (45.9) 7 (18.9)
Central 22/2,387 0 0 22 (100) 0 0 0
Rift Valley 87/9,202 1.2 (0.7 - 2.0) 0.8 (0.4 - 1.5) 66 (75.9) 16 (18.4) 5 (5.7) 0
Nairobi 10/917 1.9 (1.2 - 3.0) 1.1 (0.6 - 1.6) 3 (30.0) 7 (70.0) 0 0
Eastern 52/5,355 0.2 (0.1 - 0.4) 0.1 (0.0 - 0.2) 49 (94.2) 3 (5.8) 0 0
North Eastern 43/4,087 1.0 (0.5 - 1.5) 0 43 (100) 0 0 0
Coast 139/14,752 3.8 (2.9 - 4.6) 2.3 (1.7 - 2.9) 78 (56.1) 39 (28.1) 22 (15.8) 01Number of schools surveyed/children tested, excluding schools without microscopy results.2Prevalence and 95% binomial confidence (CI) intervals were calculated using a zero inflated Poisson model adjusted for clustering at the school level, except inNairobi, Rift Valley and Eastern provinces where a random effects cluster adjusted Poisson model was used.3Prevalence and 95% binomial confidence (CI) intervals were calculated using a zero inflated Poisson model adjusted for clustering at the school level, except inNairobi and Rift Valley provinces where a random effects Poisson model was used.
Gitonga et al. Malaria Journal 2010, 9:306http://www.malariajournal.com/content/9/1/306
Page 8 of 13
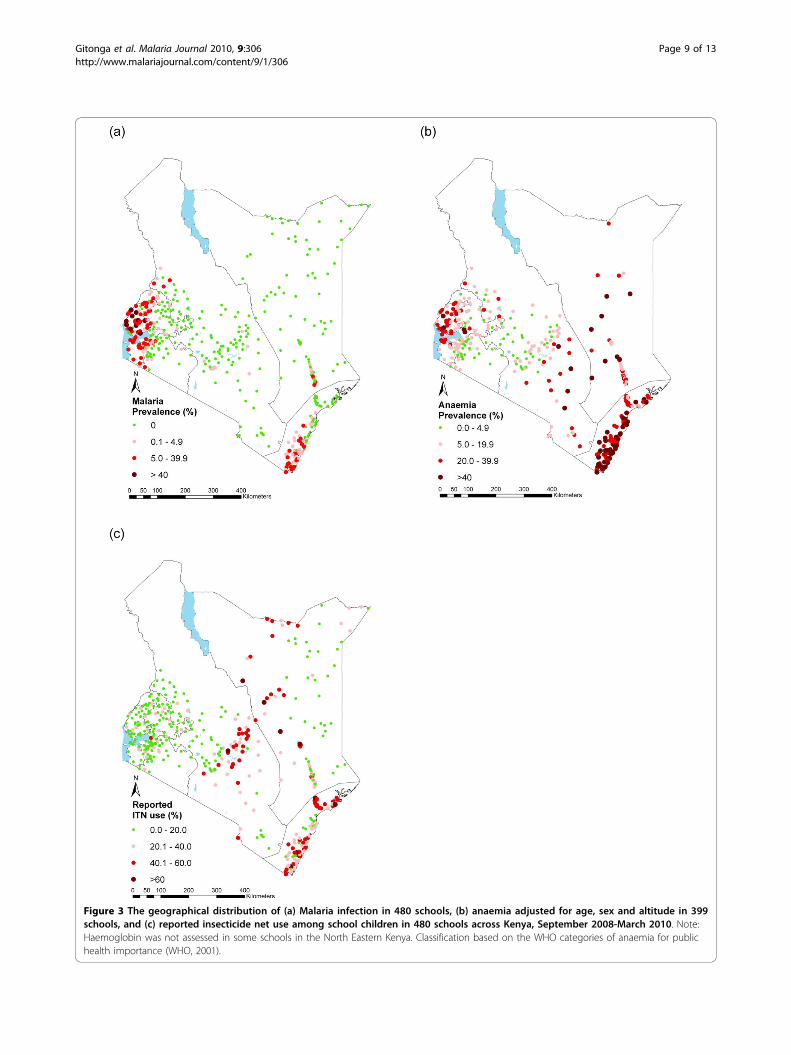
Figure 3 The geographical distribution of (a) Malaria infection in 480 schools, (b) anaemia adjusted for age, sex and altitude in 399schools, and (c) reported insecticide net use among school children in 480 schools across Kenya, September 2008-March 2010. Note:Haemoglobin was not assessed in some schools in the North Eastern Kenya. Classification based on the WHO categories of anaemia for publichealth importance (WHO, 2001).
Gitonga et al. Malaria Journal 2010, 9:306http://www.malariajournal.com/content/9/1/306
Page 9 of 13
understanding of malaria transmission intensity and cur-rent intervention coverage. The data from the presentstudy show that although the national prevalence ofPlasmodium infection was relatively low at 4.3%, thereexisted marked variation across the country. This find-ing is consistent with national level malaria prevalenceestimate observed in the Kenya MIS in 2007, where themalaria prevalence by RDTs was 7.6% and 3.4% bymicroscopy [32].The observed distribution of low transmission in most
of Nairobi and Central provinces and some parts of theEastern and Rift Valley provinces and high transmissionalong the shores of Lake Victoria and the south coast isconsistent with a recent model of malaria risk in Kenya[33]. The current findings also highlight marked varia-tion in the levels of reported ITN use, with levels high-est in Eastern and Coast provinces, but surprisingly lowreported levels in western Kenya. Interestingly, this lowcoverage in western Kenya contrasts findings fromrecent nationwide household cluster surveys among allages carried out between 2007 and 2009, which showedthat ITN/LLIN coverage was similarly high in the wes-tern, coastal and central regions of the country [34].This suggests that in western Kenya, although overallcoverage in the community is high, school children arenot using ITNs. Possible reasons for the low ITN useamong school children have been discussed elsewhere
[35,36], but are likely to reflect a previous focus of netdistribution programmes on providing nets to youngchildren and pregnant women. An additional explana-tion may lie in household sleeping patterns with schoolchildren sleeping separately from their younger siblingsand parents in areas, such as kitchens, where nets can-not readily be hung [37].The current survey took advantage of the existing
school infrastructure and historical experience in carry-ing out school surveys in Kenya to achieve a rapid, inex-pensive approach to malaria surveillance. The adoptedapproach has a number of advantages over malaria indi-cator surveys (MIS) which provide nationally-representa-tive household survey data on coverage of malariainterventions as well as malaria parasitaemia and anaemiaamong household members most at risk, namely childrenunder five years and pregnant women [9]. First, schoolsurveys make use of an annually updated national schooldatabase as a sampling frame, rather than a list of Enu-meration Areas (EAs) or clusters from population censeswhich are typically conducted every 10 years. Second,sampling of children in schools is greatly simplified aschildren are easily identified from the school register.Third, estimates of parasite rate among school-aged chil-dren can be more readily age-standardised to the optimal2-10 years estimate of PfPR than estimates among underfives and pregnant women [12]. Finally, the costs are
Table 3 The prevalence of anaemia and the proportion of school children reporting using and sleeping under a long-lasting insecticide net the previous night by province in Kenya, 2008-2010
Anaemia Any net Insecticide-treated net
N1 Prevalence(%, 95% CI)2
N1 Reported use(%, 95% CI)2
Sleeping underprevious night(%, 95% CI)2
N school with<20% use(n, %)
N school with≥60% use(n, %)
Overall use(%, 95% CI)2
Total 399/41920 14.1(13.0-15.3)
480/49,797 44.2(42.7-45.6)
42.1(40.9-42.8)
264(55.0)
11(2.3)
19.0(18.0-20.2)
Province
Nyanza 85/8969 11.3(9.6-13.3)
90/9,316 39.9(38.2-41.5)
38.5(36.8-40.1)
73 (81.1) 0 13.5(12.1-15.0)
Western 35/3751 19.8(15.7-25.1)
37/3,892 44.1(42.1-46.0)
41.1(38.0-44.2)
30 (81.1) 0 13.3(11.2-15.6)
Central 22/2387 3.6(2.3-5.4)
22/2,387 37.8(36.2-39.5)
37.1(35.4-38.7)
14 (63.6) 2 (9.1) 10.8(8.6-13.5)
Rift Valley 63/6629 6.8(5.5-8.3)
90/9,202 29.7(27.7-31.7)
28.7(27.0-30.4)
71 (78.9) 0 9.5(8.2-11.1)
Nairobi 10/924 5.2(3.7-7.4)
10/919 44.7(41.4-48.1)
38.6(34.8-42.5)
8 (80.0) 0 17.3(12.3-24.6)
Eastern 33/3399 12.4(9.8-15.5)
52/5,355 69.4(67.1-71.7)
55.2(52.8-57.5)
5 (9.6) 2 (3.8) 40.0(36.9-43.4)
NorthEastern
13/1262 32.8(26.7-40.4)
43/4,078 60.1(57.9-62.2)
50.5(48.0-53.0)
32 (74.4) 2 (4.7) 4.1(3.1-5.4)
Coast 138/14599 44.6(39.8-49.9)
139/14,648 66.7(65.1-68.4)
62.6(60.5-64.7)
31 (22.3) 5 (3.6) 35.5(33.0-38.1)
1Number of schools surveyed/children tested.2Prevalence and 95% binomial confidence intervals calculated using generalized linear and latent mixed models (GLLAMM) adjusted for clustering at the schoollevel.
Gitonga et al. Malaria Journal 2010, 9:306http://www.malariajournal.com/content/9/1/306
Page 10 of 13
greatly reduced: the average cost of surveying one schoolwas estimated to be US$ 1,116. These costs compares toan estimated cost of US$ 3,299 cluster sampled in theKenya 2007 MIS (Division of Malaria Control, Nairobi,Kenya. Personal communication); however, these esti-mates represent only financial costs and a detailed eco-nomic cost analysis of alternative survey approaches isclearly warranted.School malaria surveys are not without their limitations,
however (for a review see [12]), and a number are high-lighted here. First, the representativeness of school surveyswill depend on the level of school enrolment. In Kenya,net enrolment rates are lowest in North Eastern Province(27.5%), Nairobi (44.9%) and Coast Province (71.8%) and,therefore, school surveys may not provide a truly represen-tative picture of malaria among school-aged children inthese provinces. In the remaining provinces, however, netenrolment rates exceed 90%, increasing the representative-ness of school surveys. A further way in which school sur-veys may be unrepresentative is that children found to beabsent on the day of the survey, and therefore notincluded in the sample population, may be absent due toillness, including malaria. In the current surveys, 26.9% ofchildren reported being absent for at least a day in the twoweeks preceding the survey. Due to logistical constraints,no effort was made to follow-up absent children, thusintroducing potential selection bias. This may be a particu-lar problem in areas of low malaria transmission, whereinfection generally leads to clinical disease; whereas inhigh transmission areas, the majority of infections will beasymptomatic with many of infected children present inschool. This issue of potential sampling bias and how itvaries according to malaria endemicity deserves furtherinvestigation. However, if school surveys underestimatetrue prevalence of infection in the wider community by aconsistent amount, which can be calibrated, schools maystill provide a promising platform for malaria surveillance.A further drawback of school surveys is that they can-
not provide complete information on household owner-ship of insecticide-treated mosquito nets and their useby children under five years of age and pregnantwomen, or on the use of the intermittent preventivetreatment during pregnancy and the type and timing oftreatment of fever in children under five years of age.However, a study in Uganda found that reports byschoolchildren on household net ownership provide arapid method to collect reliable coverage data at thecommunity level [38].There are also several practical features of the present
survey worth highlighting. First, the survey used moderntechnology to achieve a more cost efficient approach todata collection. In particular, data captured wereachieved using netbook computers with customized dataentry screens. Electronic data capture systems, mainly
based on the use of personal digital assistants (PDAs),are shown to be acceptable and reduce data entry errorsconsiderably [39-42]. Experience in the use of laptops ornetbook computers is more limited, but a recent studycomparing PDAs and laptops for data capture found theuse of laptops was associated with fewer typing errorsand missing data [43]. Further use of laptops or netbookcomputers for data capture in settings where tables canbe found, such as schools and health centres, is stronglyencouraged.Second, consent for the survey was based on a passive,
opt-out method of parental permission. This approach isconsidered to be an ethical and practical way of inform-ing participants in low-risk studies and interventions[44], and has been used in a number of school-basedstudies, including studies in the United Kingdom,United States and India [45-48]. Such consent proce-dures, when compared to the opt-in methods of seekingparental consent, reduce the time needed to seekconsent and maximize participation therefore avoidingsignificant sampling bias and under-reporting.Third, malaria parasitaemia was ascertained using a two-
stage approach of malaria RDTs and blood slides. Impor-tantly, this approach enabled appropriate treatment ofclinical malaria in schools on the day of the survey, butalso allowed assessment of the reliability of RDTs at a laterstage. A drawback of using RDTs is that they can result infalse positives, especially those RDTs that detect the histi-dine-rich protein-2 (HRP-2) antigen [49-51], leading to anoverestimation of infection prevalence [52]. Such overesti-mation of prevalence using RDTs may lead to misclassifi-cation of schools in low and moderately high prevalence,however the effect of such systematic misclassification onresource allocation for malaria control remains unclearand will be the subject of further work. Encouraginglyhowever the observed sensitivity of RDT in the presentstudy exceeded 90% and are consistent with findings of arecent WHO-FIND evaluation [50].In conclusion, the current study describes recent
experiences of school malaria surveys in Kenya and high-lights the potential of school surveys as a complementaryapproach for malaria surveillance to MIS. The adoptedsurvey approaches evolved over time and important prac-tical lessons were learnt which can inform the conduct offuture school malaria surveys. Notwithstanding, thereremain several issues requiring further investigation,including the representativeness of schools, the reliabilityof school children’s reports of ITN ownership and use,the reliability of RDTs among school children. It is hopethat addressing these issues will provide clearer directionon the role, in Kenya and elsewhere, of schools in anintegrated national malaria surveillance system, whichalso includes household surveys and health facilityreporting.
Gitonga et al. Malaria Journal 2010, 9:306http://www.malariajournal.com/content/9/1/306
Page 11 of 13

Additional material
Additional file 1: Field manual for school malaria surveys, Kenya.The field manual developed for the national school malaria survey andused the field teams.
Additional file 2: Microscopy results flowchart. A flow chart showingthe numbers of slides examined and the microscopy results, includingdiscrepant results, in the school malaria surveys in Kenya, 2008-2010.
AcknowledgementsWe are grateful to all the teachers, children and parents who participated inthis survey and without whom there would be no data to inform nationalmalaria control strategies in Kenya. We are also indebted to the manyfacilitators and members of the survey teams who diligently completed thedifficult task of surveying thousands of school children across the countrywithin such a short period of time. We also acknowledge the support providedby the Ministry of Public Health & Sanitation, Division of Malaria Control andMinistry of Education, especially Margaret Ndanyi of the National School Healthand Feeding Programme. We would also like to thank Naomi Muinga, JohnSenga, Bob Ogada and his team, Rose Ayela and Lucy Muhunyo for logisticalsupport, Tansy Edwards for statistical advice, and Ken Awuondo of KEMRI-WT atKilifi and Charles Mwandawiro and Sammy Njenga of ESACIPAC, KEMRI forlaboratory and technical support. We also acknowledge Dr. Akpaka Kalu of theWHO Kenya Country Office for his invaluable support during this project. Thispaper is published with the permission of the director of KEMRI.This work was principally funded by the Division of Malaria Control, Ministryof Public Health and Sanitation through a grant from the Department forInternational Development (DfID) through the WHO Kenya Country Officeand the Wellcome Trust UK as part of fellowship support to AM Noor(#081829), S Brooker (#81673) and RW Snow (#079080). C Gitonga issupported by a Commonwealth Scholarship from the DfID. Supplementarysupport for surveys in Nyanza and Coast provinces was provided by Pfizer’sMobilize Against Malaria and the World Bank, through the NorwegianEducation Trust Fund, the multi-donor Education Programme DevelopmentFund (EPDF) and the Spanish Impact Evaluation Fund, respectively. Theauthors also acknowledge the support of KEMRI.
Author details1Malaria Public Health & Epidemiology Group, Kenya Medical ResearchInstitute-Wellcome Trust Research Programme, Nairobi, Kenya. 2Division ofVector Borne and Neglected Tropical Diseases, Ministry of Public Health &Sanitation, Nairobi, Kenya. 3Eastern and Southern Africa Centre ofInternational Parasite Control, Kenya Medical Research Institute, Nairobi,Kenya. 4Division of Malaria Control, Ministry of Public Health & Sanitation,Nairobi, Kenya. 5Centre for Tropical Medicine, Nuffield Department of ClinicalMedicine, University of Oxford, CCVTM, Oxford, UK. 6Faculty of Infectious andTropical Diseases, London School of Hygiene and Tropical Medicine, UK.
Authors’ contributionsCWG participated in the data collection, analysis and developed the draftmanuscript. PNK, JK and MM were responsible for fieldwork supervision andcontributed to the final manuscript. EJ, RWS and AN were responsible forthe study design, interpretation and scientific guidance. SB was responsiblefor the overall project management, study design, scientific guidance andwriting of the manuscript. All authors read and approved the finalmanuscript.
Competing interestsThe authors declare that they have no competing interests.
Received: 28 May 2010 Accepted: 30 October 2010Published: 30 October 2010
References1. O’Meara WP, Bejon P, Mwangi TW, Okiro EA, Peshu N, Snow RW,
Newton CR, Marsh K: Effect of a fall in malaria transmission on morbidityand mortality in Kilifi, Kenya. Lancet 2008, 372(9649):1555-1562.
2. Sievers AC, Lewey J, Musafiri P, Franke MF, Bucyibaruta BJ, Stulac SN,Rich ML, Karema C, Daily JP: Reduced paediatric hospitalizations formalaria and febrile illness patterns following implementation ofcommunity-based malaria control programme in rural Rwanda. Malar J2008, 7:167.
3. Barnes KI, Chanda P, Ab Barnabas G: Impact of the large-scale deploymentof artemether/lumefantrine on the malaria disease burden in Africa:case studies of South Africa, Zambia and Ethiopia. Malar J 2009, 8(Suppl1):S8.
4. Ceesay SJ, Casals-Pascual C, Erskine J, Anya SE, Duah NO, Fulford AJ,Sesay SS, Abubakar I, Dunyo S, Sey O, et al: Changes in malaria indicesbetween 1999 and 2007 in The Gambia: a retrospective analysis. Lancet2008, 372(9649):1545-1554.
5. Noor AM, Mutheu JJ, Tatem AJ, Hay SI, Snow RW: Insecticide-treated netcoverage in Africa: mapping progress in 2000-07. Lancet 2009,373(9657):58-67.
6. Fegan GW, Noor AM, Akhwale WS, Cousens S, Snow RW: Effect ofexpanded insecticide-treated bednet coverage on child survival in ruralKenya: a longitudinal study. Lancet 2007, 370(9592):1035-1039.
7. Hay SI, Smith DL, Snow RW: Measuring malaria endemicity from intenseto interrupted transmission. Lancet Infect Dis 2008, 8(6):369-378.
8. Smith DL, Guerra CA, Snow RW, Hay SI: Standardizing estimates of thePlasmodium falciparum parasite rate. Malar J 2007, 6:131.
9. Malaria Indicator Survey. [http://www.rbm.who.int/mechanisms/merg.html].10. Demographic health survey. [http://www.measuredhs.com/aboutsurveys/
dhs/start.cfm].11. Multiple Indicator Cluster Survey. [http://www.childinfo.org/mics.html].12. Brooker S, Kolaczinski JH, Gitonga CW, Noor AM, Snow RW: The use of
schools for malaria surveillance and programme evaluation in Africa.Malar J 2009, 8:231.
13. Brooker S, Whawell S, Kabatereine NB, Fenwick A, Anderson RM: Evaluatingthe epidemiological impact of national control programmes forhelminths. Trends in Parasitology 2004, 20(11):537-545.
14. Gyorkos TW: Monitoring and evaluation of large scale helminth controlprogrammes. Acta Tropica 2003, 86(2-3):275-282.
15. Okiro EA, Alegana VA, Noor AM, Mutheu JJ, Juma E, Snow RW: Malariapaediatric hospitalization between 1999 and 2008 across Kenya. BMCMed 2009, 7:75.
16. Okiro EA, Hay SI, Gikandi PW, Sharif SK, Noor AM, Peshu N, Marsh K,Snow RW: The decline in paediatric malaria admissions on the coast ofKenya. Malar J 2007, 6:151.
17. Snow R, Okiro E, Noor A, Munguti K, Tetteh G, Juma E: The coverage andimpact of malaria intervention in Kenya 2007-2009. Division of MalariaControl, Ministry of Public Health and Sanitation; 2009.
18. The coverage and impact of malaria intervention in Kenya 2007-2009.Submitted to the U.S. Agency for International Development by theStrengthening Pharmaceutical Systems (SPS) Program. Arlington, VA:Management Sciences for Health. [http://www.map.ox.ac.uk/PDF/DOMC_ME_report_2007-09_281109.pdf].
19. Noor AM, Amin AA, Akhwale WS, Snow RW: Increasing coverage anddecreasing inequity in insecticide-treated bed net use among ruralKenyan children. PLoS Med 2007, 4(8):e255.
20. Government of Kenya. Ministry of Public Health and Sanitation:National Malaria Strategy. 2009-2017. Nairobi: Division of MalariaControl; 2009.
21. Brooker S, Kabatereine NB, Smith JL, Mupfasoni D, Mwanje MT,Ndayishimiye O, Lwambo NJ, Mbotha D, Karanja P, Mwandawiro C, et al: Anupdated atlas of human helminth infections: the example of East Africa.Int J Health Geogr 2009, 8:42.
22. Omwami EM, Omwami RK: Public investment and the goal of providinguniversal access to primary education by 2015 in Kenya. InternationalJournal of Educational Development 2010, 30(3):243-253.
23. Kenya Ministry of Education Science and Technology: Education statisticalbooklet. Nairobi Government Printer; 2007.
24. Diggle P, Lophaven S: Bayesian Geostatistical Design. Scandinavian Journalof Statistics 2006, 33(1):53-64.
25. Orchid Biomedical systems. [http://www.tulipgroup.com/Orchid_New/product_range.htm#].
26. DiaMed. [http://www.diamed.com/product_detail.aspx?id=805&navvis=yes].27. AccessBio. [http://www.accessbio.net/].28. Garmin. [http://www.garmin.com/garmin/cms/site/us].
Gitonga et al. Malaria Journal 2010, 9:306http://www.malariajournal.com/content/9/1/306
Page 12 of 13
29. Iron deficiency anaemia: assessment, prevention and control. A guidefor programme managers. [http://whqlibdoc.who.int/hq/2001/WHO_NHD_01.3.pdf].
30. Rabe-Hesketh S, Skrondal A: Multilevel and Longitudinal Modeling UsingStata. Stata Press: College Station, Texas;, 2 2008.
31. Vuong QH: Likelihood Ratio Tests for Model Selection and Non-NestedHypotheses. Econometrica 1989, 57(2):307-333.
32. Kenya Malaria Indicator Survey 2007. [http://www.malariasurveys.org/documents/KMIS_2007_Consolidated_Apr09-1.pdf].
33. Noor AM, Gething PW, Alegana VA, Patil AP, Hay SI, Muchiri E, Juma E,Snow RW: The risks of malaria infection in Kenya in 2009. BMC Infect Dis2009, 9:180.
34. Noor AM, Alegana VA, Patil AP, Snow RW: Predicting the unmet need forbiologically targeted coverage of insecticide-treated nets in Kenya. Am JTrop Med Hyg 2010, 83(4):854-860.
35. Pullan RL, Bukirwa H, Staedke SG, Snow RW, Brooker S: Plasmodiuminfection and its risk factors in eastern Uganda. Malaria Journal 2010, 9:2.
36. Noor AM, Kirui VC, Brooker SJ, Snow RW: The use of insecticide treatednets by age: implications for universal coverage in Africa. BMC PublicHealth 2009, 9:369.
37. Iwashita H, Dida G, Futami K, Sonye G, Kaneko S, Horio M, Kawada H,Maekawa Y, Aoki Y, Minakawa N: Sleeping arrangement and housestructure affect bed net use in villages along Lake Victoria. Malar J 2010,9:176.
38. Ndyomugyenyi R, Kroeger A: Using schoolchildren’s reports of bed netuse monitored by schoolteachers as a proxy of community coverage inmalaria endemic areas of Uganda. Trop Med Int Health 2007,12(2):230-237.
39. Lane SJ, Heddle NM, Arnold E, Walker I: A review of randomizedcontrolled trials comparing the effectiveness of hand held computerswith paper methods for data collection. BMC Med Inform Decis Mak 2006,6:23.
40. Seebregts CJ, Zwarenstein M, Mathews C, Fairall L, Flisher AJ, Seebregts C,Mukoma W, Klepp KI: Handheld computers for survey and trial datacollection in resource-poor settings: development and evaluation ofPDACT, a Palm Pilot interviewing system. Int J Med Inform 2009,78(11):721-731.
41. Shirima K, Mukasa O, Schellenberg JA, Manzi F, John D, Mushi A, Mrisho M,Tanner M, Mshinda H, Schellenberg D: The use of personal digitalassistants for data entry at the point of collection in a large householdsurvey in southern Tanzania. Emerg Themes Epidemiol 2007, 4:5.
42. Yu P, de Courten M, Pan E, Galea G, Pryor J: The development andevaluation of a PDA-based method for public health surveillance datacollection in developing countries. Int J Med Inform 2009, 78(8):532-542.
43. Haller G, Haller DM, Courvoisier DS, Lovis C: Handheld vs. laptopcomputers for electronic data collection in clinical research: a crossoverrandomized trial. J Am Med Inform Assoc 2009, 16(5):651-659.
44. Ellickson PL, Hawes JA: An assessment of active versus passive methodsfor obtaining parental consent. Eval Rev 1989, 13(1):45-55.
45. Eble A, Mann V, Bhakta P, Lakshminarayana R, Frost C, Elbourne D, Boone P:The STRIPES trial–support to rural India’s public education system. Trials2010, 11:10.
46. Moore L, Moore GF, Tapper K, Lynch R, Desousa C, Hale J, Roberts C,Murphy S: Free breakfasts in schools: design and conduct of a clusterrandomised controlled trial of the Primary School Free BreakfastInitiative in Wales [ISRCTN18336527]. BMC Public Health 2007, 7:258.
47. Peterson AV, Mann SL, Kealey KA, Marek PM: Experimental Design andMethods for School-Based Randomized Trials: Experience from theHutchinson Smoking Prevention Project (HSPP). Controlled Clinical Trials2000, 21(2):144-165.
48. Starkey F, Moore L, Campbell R, Sidaway M, Bloor M: Rationale, design andconduct of a comprehensive evaluation of a school-based peer-led anti-smoking intervention in the UK: the ASSIST cluster randomised trial[ISRCTN55572965]. BMC Public Health 2005, 5:43.
49. Swarthout TD, Counihan H, Senga RK, van den Broek I: Paracheck-Pfaccuracy and recently treated Plasmodium falciparum infections: is therea risk of over-diagnosis? Malar J 2007, 6:58.
50. Malaria rapid diagnostic test perfomance. Results of WHO producttesting of malaria RDTs: Round 1. (2008). [http://apps.who.int/tdr/news-events/news/pdf/executive-summary-malaria-RDTs.pdf].
51. Neumann CG, Bwibo NO, Siekmann JH, McLean ED, Browdy B,Drorbaugh N: Comparison of blood smear microscopy to a rapiddiagnostic test for in-vitro testing for P. falciparum malaria in Kenyanschool children. East Afr Med J 2008, 85(11):544-549.
52. Keating J, Miller JM, Bennett A, Moonga HB, Eisele TP: Plasmodiumfalciparum parasite infection prevalence from a household survey inZambia using microscopy and a rapid diagnostic test: implications formonitoring and evaluation. Acta Trop 2009, 112(3):277-282.
doi:10.1186/1475-2875-9-306Cite this article as: Gitonga et al.: Implementing school malaria surveysin Kenya: towards a national surveillance system. Malaria Journal 20109:306.
Submit your next manuscript to BioMed Centraland take full advantage of:
• Convenient online submission
• Thorough peer review
• No space constraints or color figure charges
• Immediate publication on acceptance
• Inclusion in PubMed, CAS, Scopus and Google Scholar
• Research which is freely available for redistribution
Submit your manuscript at www.biomedcentral.com/submit
Gitonga et al. Malaria Journal 2010, 9:306http://www.malariajournal.com/content/9/1/306
Page 13 of 13