implementing atkinson in scotland sandy stewart office of chief economic adviser 31 january 2006
TRANSCRIPT

Implementing Atkinson in Scotland
Sandy Stewart
Office of Chief Economic Adviser
31 January 2006

History
Interim Report – July 2004 Final Report – January 2005 Implementation Strategy for Scotland – April 05 Action Plans – updated quarterly Working teams set up in Scottish Executive. Established strong links with ONS.

Working Groups in Scotland
GDP Health Education Social Protection Public Order and Safety

Relevance
FEDS – emphasis on productivity Spending Review – emphasis on VFM Gershon – Efficient Government UK National Accounts – move to output Scottish GDP – Quality Improvements Allsopp – Drive to improve regional economic
statistics

Actions
Supply data to ONS for UK National Accounts. Replicate productivity analysis for Scotland. Ensure UK assumptions make sense for
Scotland. Consider inclusion in Scottish GDP system. Consider policy relevance to improve our
understanding.

Definitions
Value Added = Outputs – Inputs Real Value Added = Real Outputs – Real
Inputs Productivity = Real Outputs/Real Inputs Efficiency = positive change in Output/Input
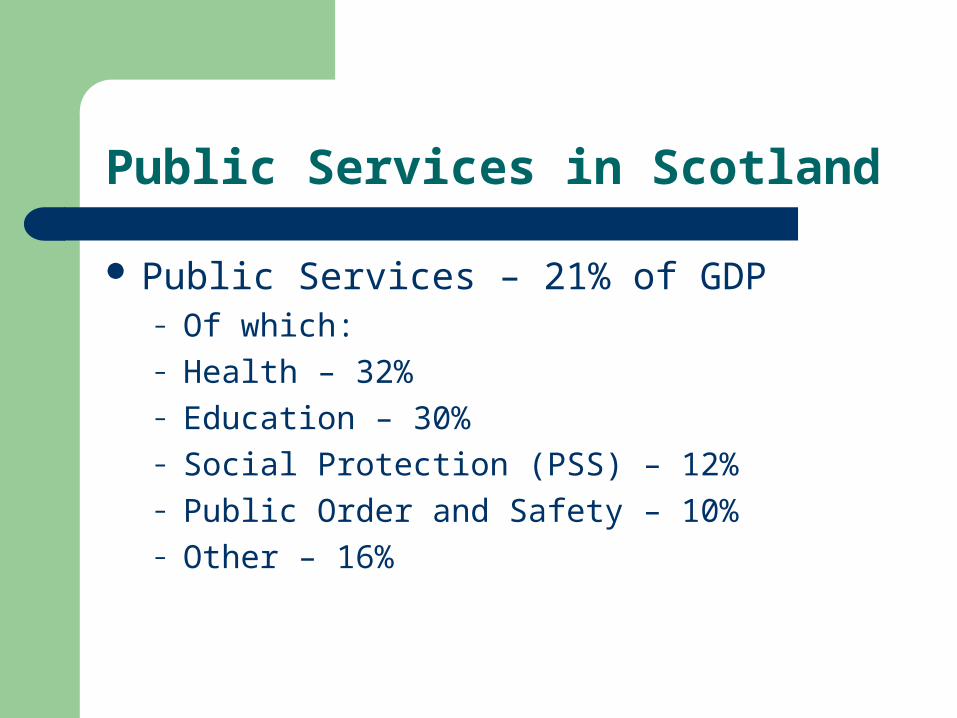
Public Services in Scotland
Public Services – 21% of GDP– Of which:– Health – 32%– Education – 30%– Social Protection (PSS) – 12%– Public Order and Safety – 10%– Other – 16%

Health
GDP – number of employees (proxy input measure)
Inputs – consider all input costs Outputs - cost-weighted activity index Considering value-weighted activity index Quality – adjustments – health improvement,
York/NIESR study

Education
GDP – Number of teachers (inputs) Move to pupil numbers adjusted by attendance Quality adjustments – based on attainment Considering adjusting output to real earnings
growth Issues – extra curricular activities

Inputs to the Education System
0
20
40
60
80
100
120
140
1999 2000 2001 2002 2003
Year
Deflated Inputs Non-Deflated Inputs

Output Index for Education Using Different Quality Measures
80
85
90
95
100
105
110
1999 2000 2001 2002 2003 2004
Year
Standard Grades Standard Grades Adjusted by Real Earnings
Combined Threshold Combined Threshold Adjusted by Real Earnings

Implied Productivity Index for Education Using Different Quality Measures
84
86
88
90
92
94
96
98
100
102
1999 2000 2001 2002 2003
Year
Standard Grades Standard Grades Adjusted by Real Earnings
Combined Threshold Combined Threshold Adjusted by Real Earnings

Emerging findings - Output
Looked at different quality measures Prefer combined threshold rather than
standard grades Need to justify increasing output by real
earnings growth

Emerging findings – Implied Productivity
All output measures produce a fall in Implied Productivity due to:– Substantial growth in Inputs to Education (e.g.
53,000 teachers commitment– Fall in pupil numbers limits output growth despite
steady increase in quality.

Social Protection
GDP – staff numbers (input proxy) Move to cost-weighted treatment. Financial data a problem due to complexities in
service provision. Policy issues – Free Personal Care, Direct
Payments, Supporting People.

Public Order and Safety
GDP – employment based Cost-weighted activity indices for outputs Quality adjustments – recidivism, benefits of
alternatives to custodial sentencing Costs of crime prevention Home Office modelling work

Scottish Issues
Costs not uniform – providing services costly in rural and remote places.
Demography Political differences Divergence


