implementing an electronic watt-hour meter with the ... · slaa203b 4 implementing an electronic...
TRANSCRIPT

Application ReportSLAA203B - June 2005
1
Implementing An Electronic Watt-Hour Meter With TheMSP430FE42x Devices
Stefan Schauer MSP430
ABSTRACT
This report shows how to implement an electronic watt-hour meter with the MSP430FE42xdevices. It contains some guidelines and recommendations for the usage of theMSP430FE42x and shows a reference board including software demos.
Contents
1 Introduction 3 . . . . . . . . . . . . . . . . . . . . . . . . . . . . . . . . . . . . . . . . . . . . . . . . . . . . . . . . . . . . . . . . . . . . . . . .
2 Hardware 3 . . . . . . . . . . . . . . . . . . . . . . . . . . . . . . . . . . . . . . . . . . . . . . . . . . . . . . . . . . . . . . . . . . . . . . . . . . . 2.1 Getting Started with the Reference Board 3 . . . . . . . . . . . . . . . . . . . . . . . . . . . . . . . . . . . . . . . . . . . 2.2 Shunt as Current Sensor 4 . . . . . . . . . . . . . . . . . . . . . . . . . . . . . . . . . . . . . . . . . . . . . . . . . . . . . . . . . 2.3 CT as Current Sensor 5 . . . . . . . . . . . . . . . . . . . . . . . . . . . . . . . . . . . . . . . . . . . . . . . . . . . . . . . . . . . . 2.4 CT and Shunt as Current Sensor for Tamper Detection 6 . . . . . . . . . . . . . . . . . . . . . . . . . . . . . . . 2.5 CT for the US 1-Phase 3-Wire E-Meter Solution 7 . . . . . . . . . . . . . . . . . . . . . . . . . . . . . . . . . . . . . 2.6 Voltage Input Connections 7 . . . . . . . . . . . . . . . . . . . . . . . . . . . . . . . . . . . . . . . . . . . . . . . . . . . . . . . . 2.7 Current Input Connections 7 . . . . . . . . . . . . . . . . . . . . . . . . . . . . . . . . . . . . . . . . . . . . . . . . . . . . . . . . 2.8 Anti-Aliasing Filter 8 . . . . . . . . . . . . . . . . . . . . . . . . . . . . . . . . . . . . . . . . . . . . . . . . . . . . . . . . . . . . . . . 2.9 Unused ADC Inputs 8 . . . . . . . . . . . . . . . . . . . . . . . . . . . . . . . . . . . . . . . . . . . . . . . . . . . . . . . . . . . . . .
3 Calculation of the ESP430CE1 Meter Constants 8 . . . . . . . . . . . . . . . . . . . . . . . . . . . . . . . . . . . . . . . 3.1 Voltage Ratio 8 . . . . . . . . . . . . . . . . . . . . . . . . . . . . . . . . . . . . . . . . . . . . . . . . . . . . . . . . . . . . . . . . . . . 3.2 Current Ratio for Shunt 8 . . . . . . . . . . . . . . . . . . . . . . . . . . . . . . . . . . . . . . . . . . . . . . . . . . . . . . . . . . . 3.3 Current Ratio for Current Transformer 8 . . . . . . . . . . . . . . . . . . . . . . . . . . . . . . . . . . . . . . . . . . . . . . 3.4 Interrupt Level for Energy 8 . . . . . . . . . . . . . . . . . . . . . . . . . . . . . . . . . . . . . . . . . . . . . . . . . . . . . . . . .
4 Meter Calibration 9 . . . . . . . . . . . . . . . . . . . . . . . . . . . . . . . . . . . . . . . . . . . . . . . . . . . . . . . . . . . . . . . . . . . 4.1 Calibration With Continuous Measurement 10 . . . . . . . . . . . . . . . . . . . . . . . . . . . . . . . . . . . . . . . . .
4.1.1 Formulas 10 . . . . . . . . . . . . . . . . . . . . . . . . . . . . . . . . . . . . . . . . . . . . . . . . . . . . . . . . . . . . . . . 4.1.2 Calibration Example 11 . . . . . . . . . . . . . . . . . . . . . . . . . . . . . . . . . . . . . . . . . . . . . . . . . . . . . .
4.2 Calibration With a Host Computer 12 . . . . . . . . . . . . . . . . . . . . . . . . . . . . . . . . . . . . . . . . . . . . . . . . 4.3 Self Calibration 13 . . . . . . . . . . . . . . . . . . . . . . . . . . . . . . . . . . . . . . . . . . . . . . . . . . . . . . . . . . . . . . . . .
5 Capacitor Power Supply 15 . . . . . . . . . . . . . . . . . . . . . . . . . . . . . . . . . . . . . . . . . . . . . . . . . . . . . . . . . . . . 5.1 Power Line Voltage On/Off Detection 15 . . . . . . . . . . . . . . . . . . . . . . . . . . . . . . . . . . . . . . . . . . . . . .
6 Layout Recommendations 16 . . . . . . . . . . . . . . . . . . . . . . . . . . . . . . . . . . . . . . . . . . . . . . . . . . . . . . . . . . 6.1 Grounding 16 . . . . . . . . . . . . . . . . . . . . . . . . . . . . . . . . . . . . . . . . . . . . . . . . . . . . . . . . . . . . . . . . . . . . . 6.2 EMI Sensitivity 17 . . . . . . . . . . . . . . . . . . . . . . . . . . . . . . . . . . . . . . . . . . . . . . . . . . . . . . . . . . . . . . . . .
7 Demo Software 18 . . . . . . . . . . . . . . . . . . . . . . . . . . . . . . . . . . . . . . . . . . . . . . . . . . . . . . . . . . . . . . . . . . . . 7.1 Analog Front-End Initialization 18 . . . . . . . . . . . . . . . . . . . . . . . . . . . . . . . . . . . . . . . . . . . . . . . . . . . .
Trademarks are the property of their respective owners.

SLAA203B
2 Implementing An Electronic Watt-Hour Meter With The MSP430FE42x Devices
7.2 E-Meter Initialization 18 . . . . . . . . . . . . . . . . . . . . . . . . . . . . . . . . . . . . . . . . . . . . . . . . . . . . . . . . . . . . 7.3 Demo 1 Software 18 . . . . . . . . . . . . . . . . . . . . . . . . . . . . . . . . . . . . . . . . . . . . . . . . . . . . . . . . . . . . . . . 7.4 Energy Pulse Generation 19 . . . . . . . . . . . . . . . . . . . . . . . . . . . . . . . . . . . . . . . . . . . . . . . . . . . . . . . .
7.4.1 Direct Output With Interrupt Level 19 . . . . . . . . . . . . . . . . . . . . . . . . . . . . . . . . . . . . . . . . . . 7.4.2 Timer_A Output 19 . . . . . . . . . . . . . . . . . . . . . . . . . . . . . . . . . . . . . . . . . . . . . . . . . . . . . . . . . .
7.5 Temperature Compensation for CT Phase Shift 20 . . . . . . . . . . . . . . . . . . . . . . . . . . . . . . . . . . . . . 7.6 Controls 20 . . . . . . . . . . . . . . . . . . . . . . . . . . . . . . . . . . . . . . . . . . . . . . . . . . . . . . . . . . . . . . . . . . . . . . .
7.6.1 Parameter.h file 20 . . . . . . . . . . . . . . . . . . . . . . . . . . . . . . . . . . . . . . . . . . . . . . . . . . . . . . . . . . 7.6.2 Using FE427_Settings.xls 21 . . . . . . . . . . . . . . . . . . . . . . . . . . . . . . . . . . . . . . . . . . . . . . . . .
7.7 Demo 2 21 . . . . . . . . . . . . . . . . . . . . . . . . . . . . . . . . . . . . . . . . . . . . . . . . . . . . . . . . . . . . . . . . . . . . . . . 7.7.1 UART Communication 22 . . . . . . . . . . . . . . . . . . . . . . . . . . . . . . . . . . . . . . . . . . . . . . . . . . . . 7.7.2 Calibration 23 . . . . . . . . . . . . . . . . . . . . . . . . . . . . . . . . . . . . . . . . . . . . . . . . . . . . . . . . . . . . . .
8 References 24 . . . . . . . . . . . . . . . . . . . . . . . . . . . . . . . . . . . . . . . . . . . . . . . . . . . . . . . . . . . . . . . . . . . . . . . .
Appendix A Reference Board Schematic and Layout 25 . . . . . . . . . . . . . . . . . . . . . . . . . . . . . . . . . . . .
Appendix B Frequently Asked Questions 32 . . . . . . . . . . . . . . . . . . . . . . . . . . . . . . . . . . . . . . . . . . . . . . .
List of Figures
1 Block Diagram for the Connection of a Shunt for Single Phase, 2-Wire 4 . . . . . . . . . . . . . . . . . . . . . . . .
1 Block Diagram for the Connection of a Shunt for Single Phase, 2-Wire 4 . . . . . . . . . . . . . . . . . . . . . . . .
2 Block Diagram for the Connection of a CT for Single Phase, 2-Wire 5 . . . . . . . . . . . . . . . . . . . . . . . . . .
3 Block Diagram for the Connection of a Shunt and CT With Tamper Detection for Single Phase, 2-Wire 6 . . . . . . . . . . . . . . . . . . . . . . . . . . . . . . . . . . . . . . . . . . . . . . . . . . . . . . . . . . . . . . . . . . . . . .
4 Block Diagram for the ANSI 1-Phase 3-Wire E–Meter Solution 7 . . . . . . . . . . . . . . . . . . . . . . . . . . . . . . .
5 MSP430 Electronic Electricity Meter With External Terminals 9 . . . . . . . . . . . . . . . . . . . . . . . . . . . . . . . .
6 Electricity Meter Calibration With a Host Computer 13 . . . . . . . . . . . . . . . . . . . . . . . . . . . . . . . . . . . . . . . .
7 Self-Calibration for Electricity Meters 14 . . . . . . . . . . . . . . . . . . . . . . . . . . . . . . . . . . . . . . . . . . . . . . . . . . . .
8 Capacitor Supply 15 . . . . . . . . . . . . . . . . . . . . . . . . . . . . . . . . . . . . . . . . . . . . . . . . . . . . . . . . . . . . . . . . . . . . . .
9. Power Detection 15 . . . . . . . . . . . . . . . . . . . . . . . . . . . . . . . . . . . . . . . . . . . . . . . . . . . . . . . . . . . . . . . . . . . . . .
10 Analog-to-Digital Converter Grounding 16 . . . . . . . . . . . . . . . . . . . . . . . . . . . . . . . . . . . . . . . . . . . . . . . . . .
11 Routing that is Sensitive to External EMIT 17 . . . . . . . . . . . . . . . . . . . . . . . . . . . . . . . . . . . . . . . . . . . . . . .
12 Routing for Minimum EMI Sensitivity 17 . . . . . . . . . . . . . . . . . . . . . . . . . . . . . . . . . . . . . . . . . . . . . . . . . . .
13 Software Flow 19 . . . . . . . . . . . . . . . . . . . . . . . . . . . . . . . . . . . . . . . . . . . . . . . . . . . . . . . . . . . . . . . . . . . . . . .
A–1 Components on the Reference Board 25 . . . . . . . . . . . . . . . . . . . . . . . . . . . . . . . . . . . . . . . . . . . . . . . . .
A–2 Schematics 26 . . . . . . . . . . . . . . . . . . . . . . . . . . . . . . . . . . . . . . . . . . . . . . . . . . . . . . . . . . . . . . . . . . . . . . . .
A–3 Components on Top Side 29 . . . . . . . . . . . . . . . . . . . . . . . . . . . . . . . . . . . . . . . . . . . . . . . . . . . . . . . . . . . .
A–4 Components on Bottom Side 29 . . . . . . . . . . . . . . . . . . . . . . . . . . . . . . . . . . . . . . . . . . . . . . . . . . . . . . . . .
List of Tables
A–1 Bill of Materials 30 . . . . . . . . . . . . . . . . . . . . . . . . . . . . . . . . . . . . . . . . . . . . . . . . . . . . . . . . . . . . . . . . . . . .

SLAA203B
3 Implementing An Electronic Watt-Hour Meter With The MSP430FE42x Devices
1 Introduction
This report shows a hardware reference design and software routines for implementing anelectronic electricity meter with the MSP430FE42x devices. It is intended to be used as asupplement to the ESP430CE1 user’s guide that describes the ESP430CE1 module.
The MSP430FE42x with the ESP430CE1 embedded signal processing for single-phase energymetering with integrated analog front-end and temperature sensor has been specificallydeveloped for energy metering applications. The ESP430CE1 does most of the work for theenergy measurement automatically without needing resources of the main CPU. This keeps themain CPU free for other tasks like communication. The ESP430CE1 offers wide flexibility forcurrent sensors, so that it is possible to use shunt, current transformers (including dc-tolerantCTs with high phase shift) or Rogowski coils without additional hardware. All parameters can beadjusted via software and the calibration parameters can be stored in the MSP430 flash memoryand passed to the ESP430CE1 during the system initialization.
2 Hardware
The reference board schematic and system block diagrams are shown below in Appendix A anddiscussed in the following sections. The reference board can be used with either currenttransformers or shunts and can be configured for a variety of configurations. The following blockdiagrams show the different sensor connections and configurations. A similar demo board isavailable for purchase from Softbaugh, part number DE427. Softbaugh can be contacted atwww.softbaugh.com.
See the schematic in Appendix A for the V1, I1, and I2 channel connections for the referenceboard.
2.1 Getting Started with the Reference Board
The following sections will describe how to connect the reference board with each sensor. Alsodescribed are any software changes required based on the requirements of the system and thesensor(s). A flow for download of the software to the MSP430FE427 and an initial calibrationfollows the setup.
1. Connect the Board:
Connect the line voltage to the voltage sensor input and connect the current sensor to thecurrent sensor input as shown in Appendix A. For initial testing an external supply can be usedto power the board in the case there is an issue with the line voltage connections. If using anexternal line-independent supply, connect a DC power supply (using Galvanic isolation) to theexternal power supply input as shown in Appendix A. The supply voltage should beapproximately 5V/10mA (current may be higher if additional external components areconnected). Set the power supply jumper for an external DC supply as shown in Appendix A.
2. Adjust meter settings using the provided Parameter Spreadsheet (FE427_Setting.xls)
The output header file will be created in the same directory as the spreadsheet.

SLAA203B
4 Implementing An Electronic Watt-Hour Meter With The MSP430FE42x Devices
2.2 Shunt as Current Sensor
LOAD
From Utility
MSP430FE427 Reference Board
UTXD0
Sx,COMx
V1–/Vref(O)Px.x
Vref(I)
URXD0
32,768 HzXIN
XOUT
R33
R03
ESP430CE1
IIN
VIN
V1+
I1+
I1–
I2+
I2–
RST
VSS
VCC
MSP430FE427
V1–
VREF
MAXCUM
ABCDE
kWhREACTEST kW
N L
Figure 1. Block Diagram for the Connection of a Shunt for Single Phase, 2-Wire
SLAA203B
5 Implementing An Electronic Watt-Hour Meter With The MSP430FE42x Devices
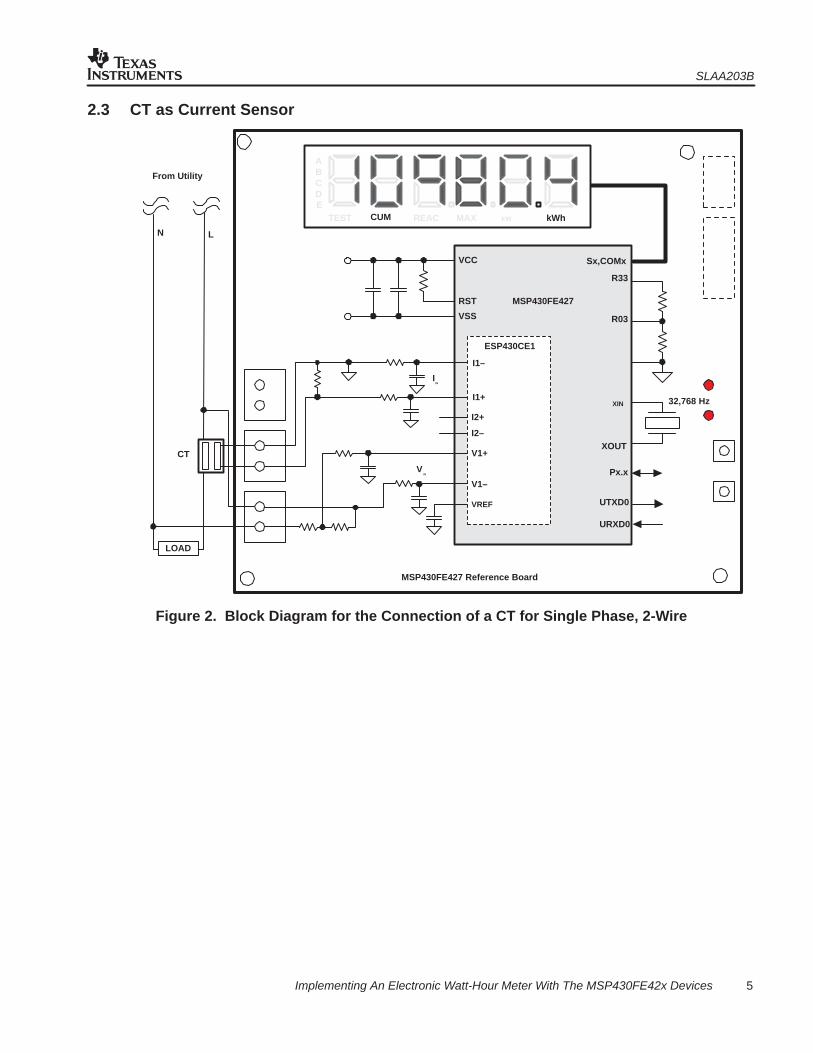
2.3 CT as Current Sensor
LOAD
From Utility
MSP430FE427 Reference Board
UTXD0
Sx,COMx
V1–/Vref(O)Px.x
Vref(I)
URXD0
32,768 HzXIN
XOUT
R33
R03
ESP430CE1
V1+
I1+
I1–
I2+
I2–
RST
VSS
VCC
MSP430FE427
V1–
VREF
MAXCUM
ABCDE
kWhREACTEST kW
CT
IIN
VIN
N L
Figure 2. Block Diagram for the Connection of a CT for Single Phase, 2-Wire

SLAA203B
6 Implementing An Electronic Watt-Hour Meter With The MSP430FE42x Devices
2.4 CT and Shunt as Current Sensor for Tamper Detection
LOAD
From Utility
NL
MSP430FE427 Reference Board
UTXD0
Sx,COMx
V1–/Vref(O)Px.x
Vref(I)
URXD0
32,768 HzXIN
XOUT
R33
R03
ESP430CE1
I1IN
VIN
V1+
I1+
I1–
I2+
I2–
RST
VSS
VCC
MSP430FE427
V1–
VREF
MAXCUM
ABCDE
kWhREACTEST kW
CTI2
IN
Figure 3. Block Diagram for the Connection of a Shunt and CT With Tamper Detection forSingle Phase, 2-Wire
SLAA203B
7 Implementing An Electronic Watt-Hour Meter With The MSP430FE42x Devices
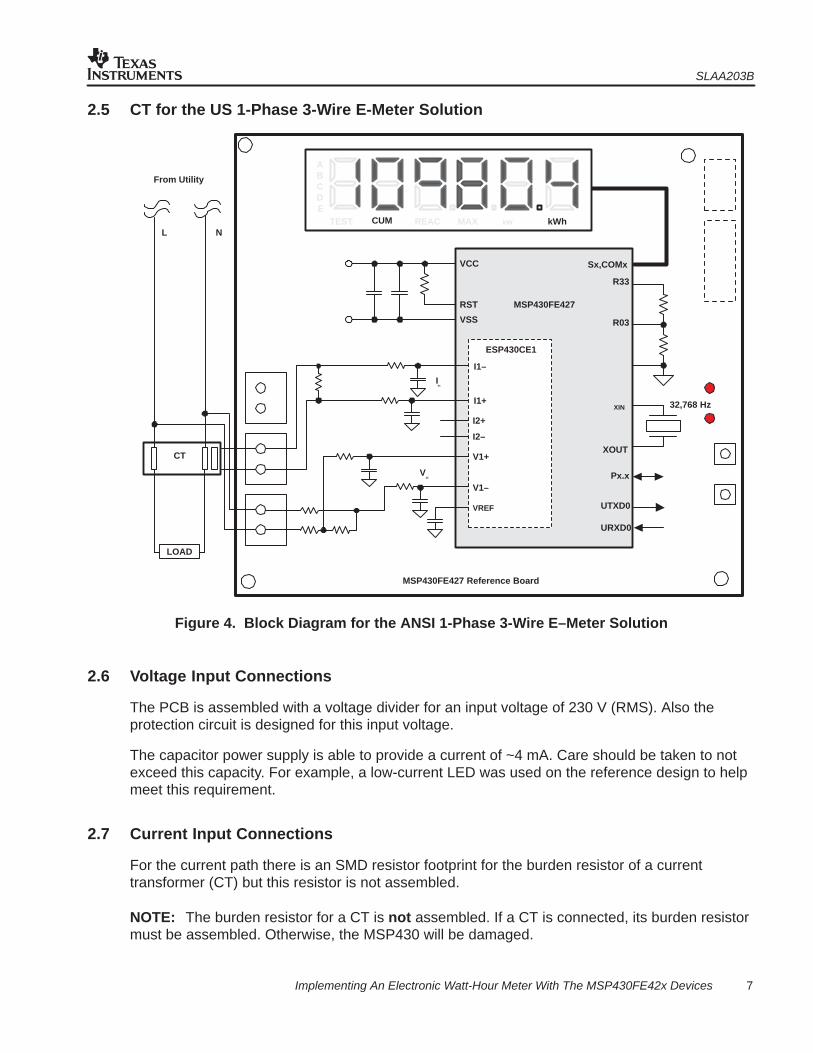
2.5 CT for the US 1-Phase 3-Wire E-Meter Solution
LOAD
From Utility
NL
MSP430FE427 Reference Board
UTXD0
Sx,COMx
V1–/Vref(O)Px.x
Vref(I)
URXD0
32,768 HzXIN
XOUT
R33
R03
ESP430CE1
IIN
VIN
V1+
I1+
I1–
I2+
I2–
RST
VSS
VCC
MSP430FE427
V1–
VREF
MAXCUM
ABCDE
kWhREACTEST kW
CT
Figure 4. Block Diagram for the ANSI 1-Phase 3-Wire E–Meter Solution
2.6 Voltage Input Connections
The PCB is assembled with a voltage divider for an input voltage of 230 V (RMS). Also theprotection circuit is designed for this input voltage.
The capacitor power supply is able to provide a current of ~4 mA. Care should be taken to notexceed this capacity. For example, a low-current LED was used on the reference design to helpmeet this requirement.
2.7 Current Input Connections
For the current path there is an SMD resistor footprint for the burden resistor of a currenttransformer (CT) but this resistor is not assembled.
NOTE: The burden resistor for a CT is not assembled. If a CT is connected, its burden resistormust be assembled. Otherwise, the MSP430 will be damaged.
SLAA203B
8 Implementing An Electronic Watt-Hour Meter With The MSP430FE42x Devices
2.8 Anti-Aliasing Filter
The recommended anti-aliasing filter is a 1-kΩ resistor in series to the ADC input and a 33-nFcapacitor to the analog ground. To avoid external influences, it is recommended to have a filterin the positive and negative input channel of each used ADC input.
2.9 Unused ADC Inputs
Unused ADC inputs should be unconnected.
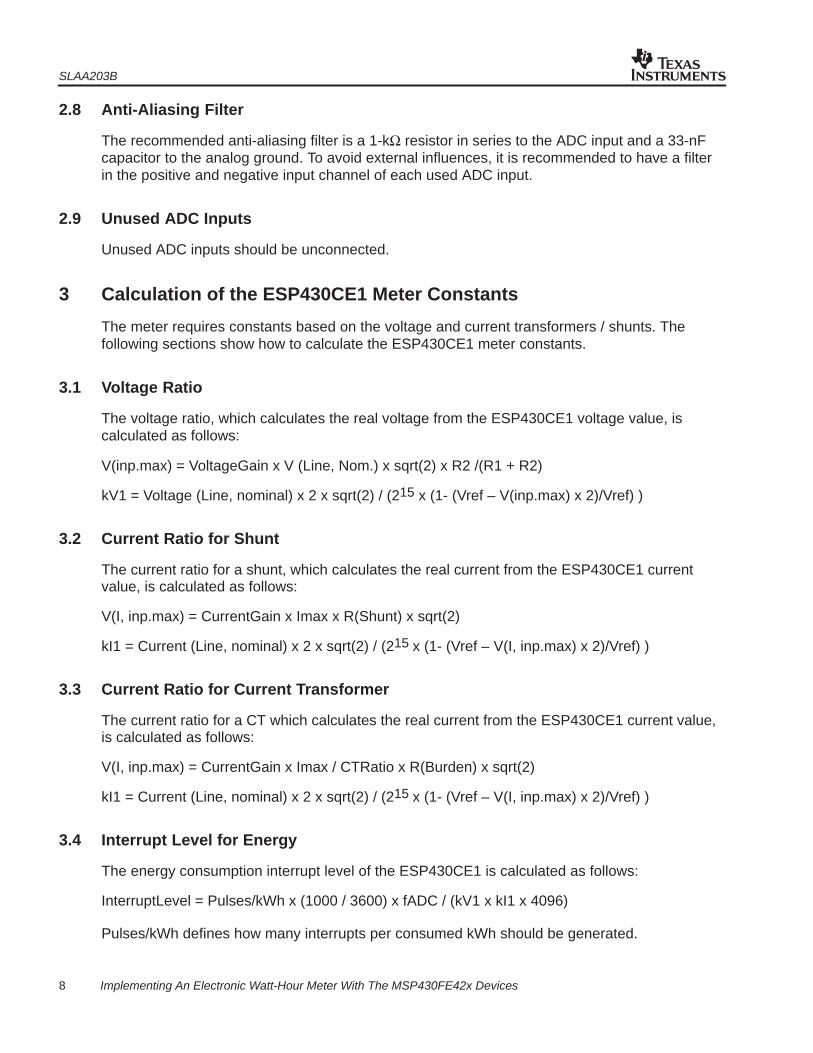
3 Calculation of the ESP430CE1 Meter Constants
The meter requires constants based on the voltage and current transformers / shunts. Thefollowing sections show how to calculate the ESP430CE1 meter constants.
3.1 Voltage Ratio
The voltage ratio, which calculates the real voltage from the ESP430CE1 voltage value, iscalculated as follows:
V(inp.max) = VoltageGain x V (Line, Nom.) x sqrt(2) x R2 /(R1 + R2)
kV1 = Voltage (Line, nominal) x 2 x sqrt(2) / (215 x (1- (Vref – V(inp.max) x 2)/Vref) )
3.2 Current Ratio for Shunt
The current ratio for a shunt, which calculates the real current from the ESP430CE1 currentvalue, is calculated as follows:
V(I, inp.max) = CurrentGain x Imax x R(Shunt) x sqrt(2)
kI1 = Current (Line, nominal) x 2 x sqrt(2) / (215 x (1- (Vref – V(I, inp.max) x 2)/Vref) )
3.3 Current Ratio for Current Transformer
The current ratio for a CT which calculates the real current from the ESP430CE1 current value,is calculated as follows:
V(I, inp.max) = CurrentGain x Imax / CTRatio x R(Burden) x sqrt(2)
kI1 = Current (Line, nominal) x 2 x sqrt(2) / (215 x (1- (Vref – V(I, inp.max) x 2)/Vref) )
3.4 Interrupt Level for Energy
The energy consumption interrupt level of the ESP430CE1 is calculated as follows:
InterruptLevel = Pulses/kWh x (1000 / 3600) x fADC / (kV1 x kI1 x 4096)
Pulses/kWh defines how many interrupts per consumed kWh should be generated.

SLAA203B
9 Implementing An Electronic Watt-Hour Meter With The MSP430FE42x Devices
4 Meter Calibration
Calibration of MSP430–based electricity meters with conventional calibration equipment usingthe same procedures as for Ferraris meters is possible, but not cost effective. The processingpower of the MSP430 allows other methods shown below.
A basis calibration could be initiated with the UART c0 command. The execution of thiscommand requires the input values which are defined in the parameter.h file:
– calVoltage
– calCurrent
– calPhi
– calCosPhi
– calFreq
The phase shift calibration between voltage and current should be done with an cos Phi of 0.5as at this point the error of the phase shift resulting from the sensors does generate much highererrors and therefore a higher accuracy could be reached with less effort.
For the calibration of electricity meters it is necessary to separate the voltage and current path ofthe meters. This allows the calibration with low energy losses and a defined value for thevoltage, current, and phase shift. Figure 5 shows the terminals of an electricity meter with thecalibrating terminal switch open for the calibration.
Interface
Error
KW kWh
Mains Load
MSP430FE42x
Calibration Terminal:Switch open: Calibration
Switch closed: Normal Use
Current Voltage
Live Live
Neutral Neutral
TransmitReceive
Ws Pulse
Figure 5. MSP430 Electronic Electricity Meter With External Terminals

SLAA203B
10 Implementing An Electronic Watt-Hour Meter With The MSP430FE42x Devices
4.1 Calibration With Continuous Measurement
The ESP430CE1 operation mode is set to electricity meter mode via the mailbox with theSetMode Command the CPU initializes the ESP430CE1 for normal measurement. The energyvalues written after each mains period to the value registers ActEnSPer1 (and ActEnSPer2 fortwo sensor systems) are converted by the CPU into a proportional, constant output frequencyhaving only the information of the mean value of the measured energy. The Timer_A of the CPUmay be used for the generation of an energy proportional output frequency.
The calibration sequence is:
• The CPU sets the flags Curr_I1, Curr_I2 in control register 0 according to the measurementmode of the ESP430CE1.
• The parameter registers are initialized for the load point to be measured. This is made viathe mailbox with the SET_PARAM Command.
• The ESP430CE1 mode is set to electricity meter mode via the mailbox with the mSet_Modecommand
• The first result in addresses ActEnSPer1 (and ActEnSPer2 if current path 2 is enabled) is notused, due to the unknown start point inside the mains period.
• The next results in addresses ActEnSPer1 (and ActEnSPer2 if current path 2 is enabled) arevalid and are used for calculations.
• The flag St_ZCld in status register 0 indicates, that with the next available samples (flagSt_NEVal is set) new results for the last mains period are available in addressesActEnSPer1 and ActEnSPer2.
• The CPU resets the flag St_NEVal with the Mailbox command mCLR_EVENT andprocesses the read results with the equations below.
• The last four steps are repeated if necessary (e.g. for a summing of the results of more thanone mains period).
The above steps are repeated for the second calibration point.
Calibration of two current sensors should be done independently. The meter should becalibrated for one of the current sensors, while the current through the other is zero. A secondcalibration should then be run for the second current sensor, while the current through the firstsensor is zero.
4.1.1 Formulas
Calibration is made for a single mains period (or during nper mains periods) with the two currentsI1HI and I1LO. The nominal energy results for the two calibration points are:
4096cos 1111
ADC
mains
perHIZHIcalc
f
f
nVICn ×××××= ϕ [steps2]
4096cos 1111
ADC
mains
perLOZLOcalc
f
f
nVICn ×××××= ϕ [steps2]
SLAA203B
11 Implementing An Electronic Watt-Hour Meter With The MSP430FE42x Devices
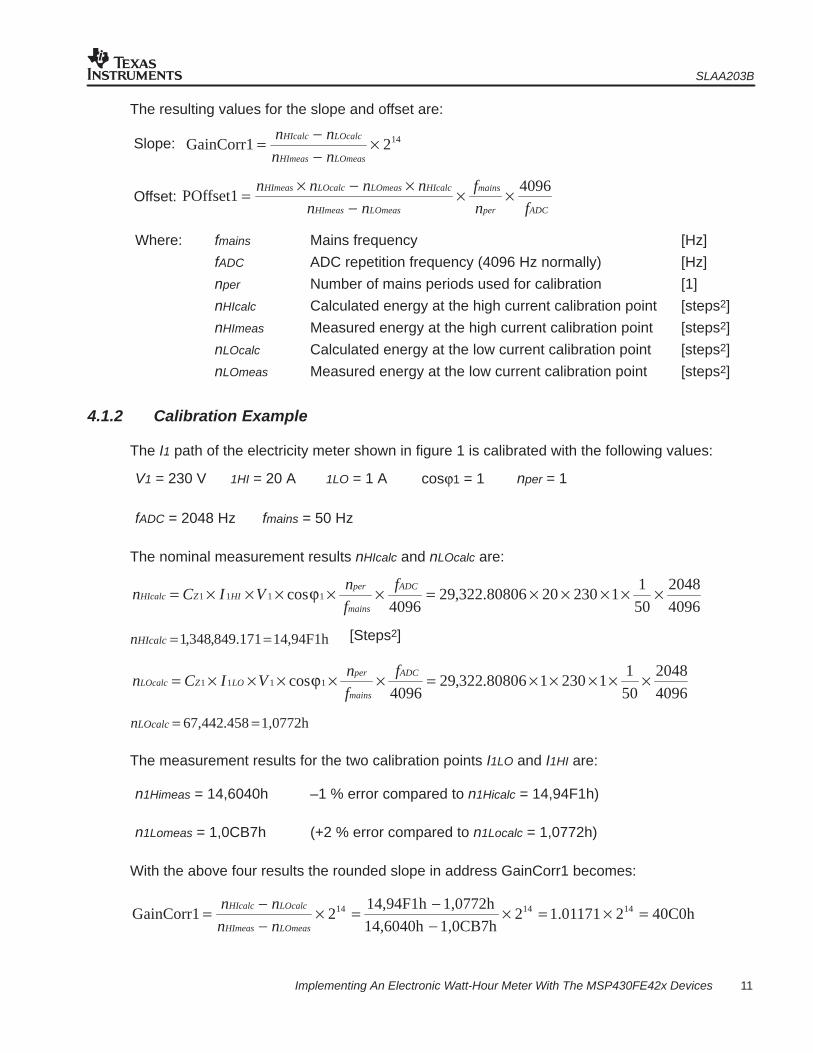
The resulting values for the slope and offset are:
142GainCorr1 ×−−=
LOmeasHImeas
LOcalcHIcalc
nn
nnSlope:
ADCper
mains
LOmeasHImeas
HIcalcLOmeasLOcalcHImeas
fn
f
nn
nnnn 4096POffset1 ××
−×−×=Offset:
Where: fmains Mains frequency [Hz]
fADC ADC repetition frequency (4096 Hz normally) [Hz]
nper Number of mains periods used for calibration [1]
nHIcalc Calculated energy at the high current calibration point [steps2]
nHImeas Measured energy at the high current calibration point [steps2]
nLOcalc Calculated energy at the low current calibration point [steps2]
nLOmeas Measured energy at the low current calibration point [steps2]
4.1.2 Calibration Example
The I1 path of the electricity meter shown in figure 1 is calibrated with the following values:
V1 = 230 V 1HI = 20 A 1LO = 1 A cosϕ1 = 1 nper = 1
fADC = 2048 Hz fmains = 50 Hz
The nominal measurement results nHIcalc and nLOcalc are:
4096
2048
50
112302080806.322,29
4096cos 1111 ×××××=×××××= ADC
mains
perHIZHIcalc
f
f
nVICn ϕ
,94F1h14171.849,348,1 ==HIcalcn [Steps2]
4096
2048
50
11230180806.322,29
4096cos 1111 ×××××=×××××= ADC
mains
perLOZLOcalc
f
f
nVICn ϕ
1,0772h458.442,67 ==LOcalcn
The measurement results for the two calibration points I1LO and I1HI are:
n1Himeas = 14,6040h –1 % error compared to n1Hicalc = 14,94F1h)
n1Lomeas = 1,0CB7h (+2 % error compared to n1Localc = 1,0772h)
With the above four results the rounded slope in address GainCorr1 becomes:
40C0h201171.121,0CB7h14,6040h
1,0772h14,94F1h2GainCorr1 141414 =×=×
−−=×
−−=
LOmeasHImeas
LOcalcHIcalc
nn
nn

SLAA203B
12 Implementing An Electronic Watt-Hour Meter With The MSP430FE42x Devices
The offset in addresses POffset1 and POffset1+2 becomes:
ADCper
mains
LOmeasHImeas
HIcalcLOmeasLOcalcHImeas
fn
f
nn
nnnn 4096POffset1 ××
−×−×=
B63FhFFFC,215,48904821
096450
1,0CB7h14,6040h
,94F1h411,0CB7h1,0772h14,6040hPOffset1 =−=
×××
−×−×=
NOTE: the calculated value for (POffset1) is the offset for each product NV1 × NI1, thus therelatively high value.
If the measured calibration points are corrected with the calculated slope and offset:
( )4096
POffset1)(2GainCorr1)( 14 ADC
mains
permeascorr
f
f
nnn ××+××= −
,951Ah41890,348,1096450
20481B63FhFFFC,240C0h,6040h14 14 ==
×××+××= −
HIcorrn
,0771h1441,67096450
20481B63FhFFFC,240C0h1,0CB7h 14 ==
×××+××= −
LOcorrn
The resulting error for both corrections is +3.1E–5 which is 31 ppm.
4.2 Calibration With a Host Computer
Figure 6 shows a possible calibration environment for electronic electricity meters. The hostcomputer is connected to the meters via the USART0 communication port running in SPI orUART mode. All necessary calibration calculations are made by the host; the MSP430 in eachmeter only stores the received correction values in its information memory or an externalEEPROM.
The host controls the calibration equipment containing a voltage generator, a current generatorand a phase shifter via the host interface. The host reads out the accumulated results of themultiplying of voltage and current ADC steps (or counts the Ws pulses of each electricity meter)and compares the equivalent energy with the energy equivalent to the reference pulses comingfrom a reference meter, which is part of the calibration equipment. The host calculates the metererror out of the energy amounts for (e.g., 100% Inom) or two load points (e.g., 100% Inom andImax). With these errors the slope and offset of the load characteristic can be calculatedindividually and sent to the MSP430s in each meter.

SLAA203B
13 Implementing An Electronic Watt-Hour Meter With The MSP430FE42x Devices
Reference Meter
I–Gen.
V–Gen.
j
Control
HostInterface
Reference
Meter 1 Meter 2 Meter nHost Computer
Calibration Equipment
Control
Ws Pulses
Transmit/Receive(UART or SPI)
n2n
Figure 6. Electricity Meter Calibration With a Host Computer
The formulas for the calculation of the calibration values are shown in the ESP430CE1 moduleuser’s guide.
4.3 Self Calibration
Another calibration method uses the processing capability of each MSP430 in each meter. Themain advantage of this calibration method is the simplicity: no wiring for the information transferis necessary (see Figure 7). The error correction equations – used by the electricity meter undertest – are the same ones as shown in the Calibration With Continuous Measurement section.
• The meters to be calibrated are put into the calibration mode via a hidden switch, the UART,a key or an input pulse, etc.
• The host switches on the calibration equipment and transmits a defined amount of energy –measured with the reference meter – to the electricity meters being calibrated.
• The electricity meters measure the transmitted energy and calculate the energy value WEM1for the 100% Inom current.
• After this transmission of energy the calibration equipment is switched off (I = 0, U = 0). Thisallows the electricity meters to calculate or measure the ADC offsets if necessary.
• The host switches on the calibration equipment again and transmits a defined amount ofenergy (e.g. 5% Inom, 100% Vnom, cosϕ = 1) to the electricity meters. After thistransmission of energy the calibration equipment is switched off (I = 0, V = 0).
• The electricity meters measure the transmitted energy and calculate the energy value WEM0for the 5% Inom current.
• With the two faulty energy values WEM1 and WEM0 found for the 100% and 5% Inomloading conditions the electricity meters calculate their individual offsets and slopes.

SLAA203B
14 Implementing An Electronic Watt-Hour Meter With The MSP430FE42x Devices
• A simple visual final test is possible after the calibration:
– The electricity meters reset their display to zero
– The calibration equipment transmits a precisely defined energy profile (differentpercentages of Inom, Vnom and two values of cosϕ) to the electricity meters.
– A visual check is made if the meters display the known amount of energy.
– The MSP430 indicates in the LCD if the calculated slopes and offsets are within worstcase limits.
EXAMPLE: the energy profile for the final check consists of
• 10,000 Ws (100% Inom, 100% Vnom, cosϕ = 1)
• 5,000 Ws (100% Inom, 100% Vnom, cosϕ = 0.5)
The calibrated electricity meters must display the number 15,900 Ws ± accuracy, otherwise thecalibration failed.
Reference Meter
I–Gen.
V–Gen.
j
Control
HostInterface
Reference
Meter 1 Meter 2 Meter nHost Computer
Calibration Equipment
Control
Figure 7. Self-Calibration for Electricity Meters

SLAA203B
15 Implementing An Electronic Watt-Hour Meter With The MSP430FE42x Devices
5 Capacitor Power Supply
Figure 8 shows a capacitor power supply for a single output voltage Vcc = +3 V. If the outputcurrent is not sufficient, an NPN output buffer may be used.
The design equations for the power supplies below are given in SLAA024, section 3.8.3.2Capacitor Power Supplies. This chapter also describes other kinds of power supplies with theirdesign equations.
VoltageReg.
~230 V 3 V / 4 mA
470 nF /~200 V
560R / 5W
4.1 V220 μF
Figure 8. Capacitor Supply
5.1 Power Line Voltage On/Off Detection
Because the ESP430CE1 voltage drop detection is combined with the line cycle counter, thevoltage drop detection of the ESP430CE1 does not function if the voltage drops to 0 V. To detectthis condition, the VRMS voltage can be observed in dedicated time intervals or an externalcircuit may be used to detect when the power line is off. If an external circuit is used, theESP430CE1 module can be switched off to conserve power.
Power line
Px.x
Figure 9. Power Detection

SLAA203B
16 Implementing An Electronic Watt-Hour Meter With The MSP430FE42x Devices
6 Layout Recommendations
6.1 Grounding
Good circuit-board layout is important for high resolution ADC systems. Following are somebasic layout guidelines.
1. Use of a separate analog and digital ground plane wherever possible:
2. Thick traces from the battery to the DVSS, AVSS, DVCC, and AVCC terminals.
3. The decoupling capacitor at the AVSS terminal is a star point for all analog groundconnections. The decoupling capacitor at the DVSS terminal is a star point for all digitalground connections.
4. The connections of the capacitor Cb are the star point of the complete system. This is dueto the low impedance of this capacitor.
5. The AVSS and DVSS terminals must be connected together externally.
6. The AVCC and DVCC terminals must be connected together externally.
7. Battery and storage capacitor Cb should be close together. Two capacitors are connectedacross the digital (Cd) and the analog (Ca) supply terminals.
8. The coil L could be used to keep disturbances introduced from the digital supply awayfrom the analog supply voltage. It is also possible to use a resistor for this. The coil bringsadditional advantage in filtering high frequency signals.
9. If a metal case is used around the printed circuit board containing the MSP430 then itshould be connected to the ground potential (0 V) of the board.
AVss
V1–
I1–
MSP430FE42x
+3 V
To other digital parts
DVssAVcc DVcc
0 VAGND
To other analog parts
L CdCa
Cb
Battery or Power Supply
To metallization of case
VREF(I)
100 nF
Ca = Cd = 100 nF
Cb > 10 F
V1+
I1+
33 nF 33 nF
RSensor
33 nF 33 nF
RSensor
1 kΩ
1 kΩ
1 kΩ
1 kΩ
Figure 10. Analog-to-Digital Converter Grounding
SLAA203B
17 Implementing An Electronic Watt-Hour Meter With The MSP430FE42x Devices
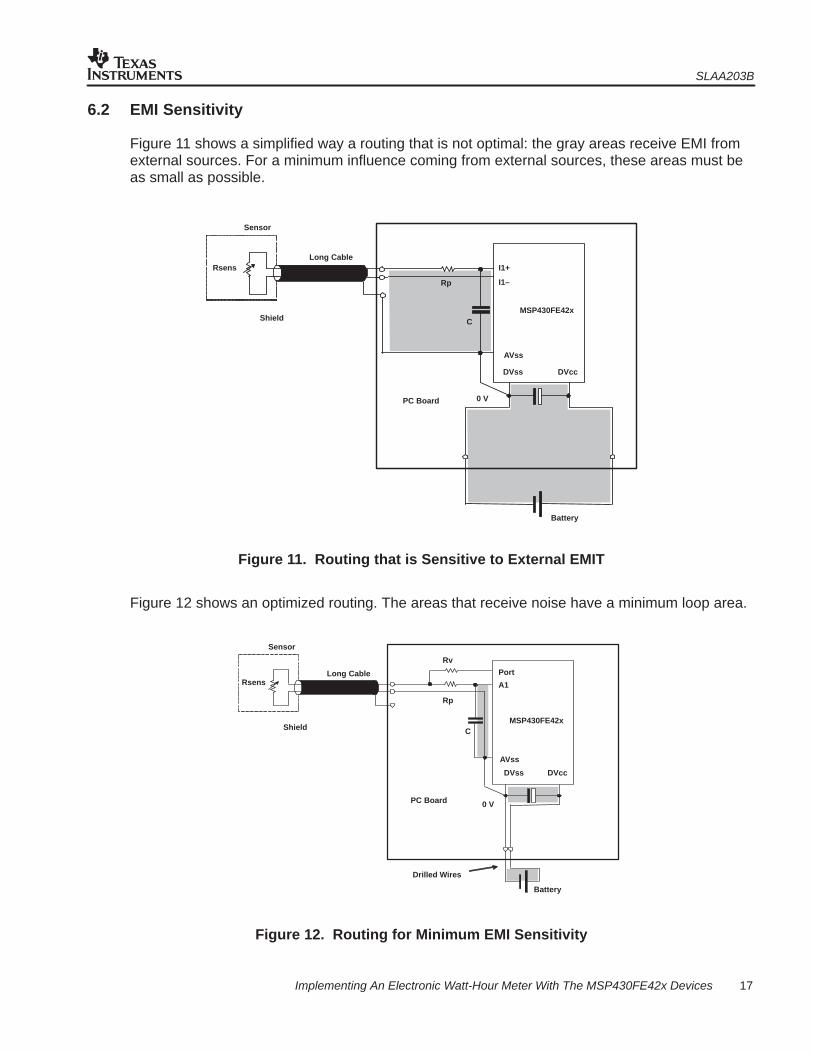
6.2 EMI Sensitivity
Figure 11 shows a simplified way a routing that is not optimal: the gray areas receive EMI fromexternal sources. For a minimum influence coming from external sources, these areas must beas small as possible.
DVss DVcc
AVss
I1+
MSP430FE42x
0 V
Rsens
Rp
C
Long Cable
Shield
PC Board
Battery
Sensor
I1–
Figure 11. Routing that is Sensitive to External EMIT
Figure 12 shows an optimized routing. The areas that receive noise have a minimum loop area.
DVss DVcc
AVss
Port
A1
MSP430FE42x
0 V
Rv
Rsens
Rp
C
Long Cable
Shield
PC Board
Battery
Sensor
Drilled Wires
Figure 12. Routing for Minimum EMI Sensitivity

SLAA203B
18 Implementing An Electronic Watt-Hour Meter With The MSP430FE42x Devices
7 Demo Software
7.1 Analog Front-End InitializationWhile the ESP430CE1 is off, the MSP430 CPU has access to the SD16 module. During thistime, the MSP430 CPU should do the initialization of the analog front-end. This consists ofsetting the gain, oversampling ration, and clock source for the SD16 as shown in the functioninit_analog_front_end in the emeter.c source file.
7.2 E-Meter InitializationThe ESP430CE1 must be configured before use. A configuration example is shown in thesubroutine init_esp_parameter in the source file emeter.c.
7.3 Demo 1 SoftwareDemo 1 is as a simple demo that initializes the ESP430CE1 for energy measurement andoutputs the data on the display. The LED is also pulsed. This demo can be use with IARKickstart development tool. The files and contents of the Demo 1 software are:
File Contents and Function
Main.c Control of system Initialization and call of the functions for the display update oncerequested in the interrupt service routines:Init FLL and System Clock, Init Basic Timer and Real time Clock, Init LCD, Initanalog front end, Init ESP430CE1 Parameters, Start Measurement
FET4xx_RTCwLCD.s43/.c Basic routines for LCD & Real Time Clock with Basic Timer ISR.
FET4xx_RTCwLCD_sb.s43/.C Basic routines for LCD and Real Time Clock with Basic Timer ISR for SoftBaughFE development board
Display.c High level routines for LCD
FLL.c Routines to setup FLL and clock system
PortFunc.c Interrupt service routine for Port1
TimerA.c Initialization routine and interrupt service routine for Timer_A. The Timer_A is usedto generate a pulse without flicker.
EMeter.c EMeter.c contains the initialization routine for the analog front end, theESP430CE1, and the interrupt service routine for the ESP430CE1.
FE427_Measure_v3.ewp/.eww Project Files for IAR Workbench Version 3
FE427_Measure.ewp/.eww Project Files for IAR Workbench Version 2
FE427_Measure.hzp/.hzs Project Files for Rowley CrossStudio
bin2bcd16.s43/.c Converts integer to BCD
bin2bcd32.s43/.c Converts long to BCD
LCDdec16.s43/.c Support to convert signed integer values for display to the LCD
LCDdecu16.s43/.c Support to convert unsigned integer values for display to the LCD
LCDdec32.s43/.c Support to convert signed long values for display to the LCD
LCDdecu32.s43/.c Support to convert unsigned long values for display to the LCD
emeter_toolkit.h DIsplay function support header file
device.h Device-specific information header file
esp_Parameter.h Meter parameter definitions for the ESP module (generated by FE427_Setting.xls)
Parameter.h Global parameter definitions
Subroutines.h Subroutine definitions
portfunc.c Port handling source file
unused_Int.s43 Unused ISR support source file

SLAA203B
19 Implementing An Electronic Watt-Hour Meter With The MSP430FE42x Devices
The Demo software flow is shown in Figure 13.
Init System
Init ESP
StartMeasurement
RTCInterrupt
Exit
ESP Interrupt
Dump Valuesinitiate additional
Calculations
Toggle Poweroutput LED
Background Foreground
Update Display
Check Port
Process UART
Exit
UART Interrupt
Add received Charto buffer
Switch CPU toactive Mode if
Frame received
Exit
Port Interrupt
Check Port Flags
Switch CPU toactive Mode
Exit
Update Clock
Switch CPU toactive Mode if
Display Update isrequested
Set CPU to LowPower Mode
Figure 13. Software Flow
7.4 Energy Pulse Generation
A pulse can be output to indicate a specific energy level. Two methods can be used for thegeneration of the energy pulse output signal.
7.4.1 Direct Output With Interrupt Level
The first method is the direct interrupt source of the ESP430 module with the Interrupt level setto a specific energy level. The implementation is simple, does not need any additional hardwareor software resources but, as the energy is the accumulation of a sine wave; this signal couldhave some jitter.
This method is active if the following are defined://#define TIMERA_PULSE_OUTPUT
7.4.2 Timer_A Output
The second method uses the Timer_A as a constant time basis to directly remove the jitter of theinterrupt level method. This method is sufficient for pulse frequencies up to ~30 Hz. Here, thefollowing setting could be used in the parameter.h file.
#define TimerAClock TASSEL_1 /* ACLK = 32kHz#define TACLOCK 32768ul#define CLOCKSPERPERIOD (TACLOCK/defSET_NOMFREQ)
This is active if the following is defined:
#define TIMERA_PULSE_OUTPUT
SLAA203B
20 Implementing An Electronic Watt-Hour Meter With The MSP430FE42x Devices
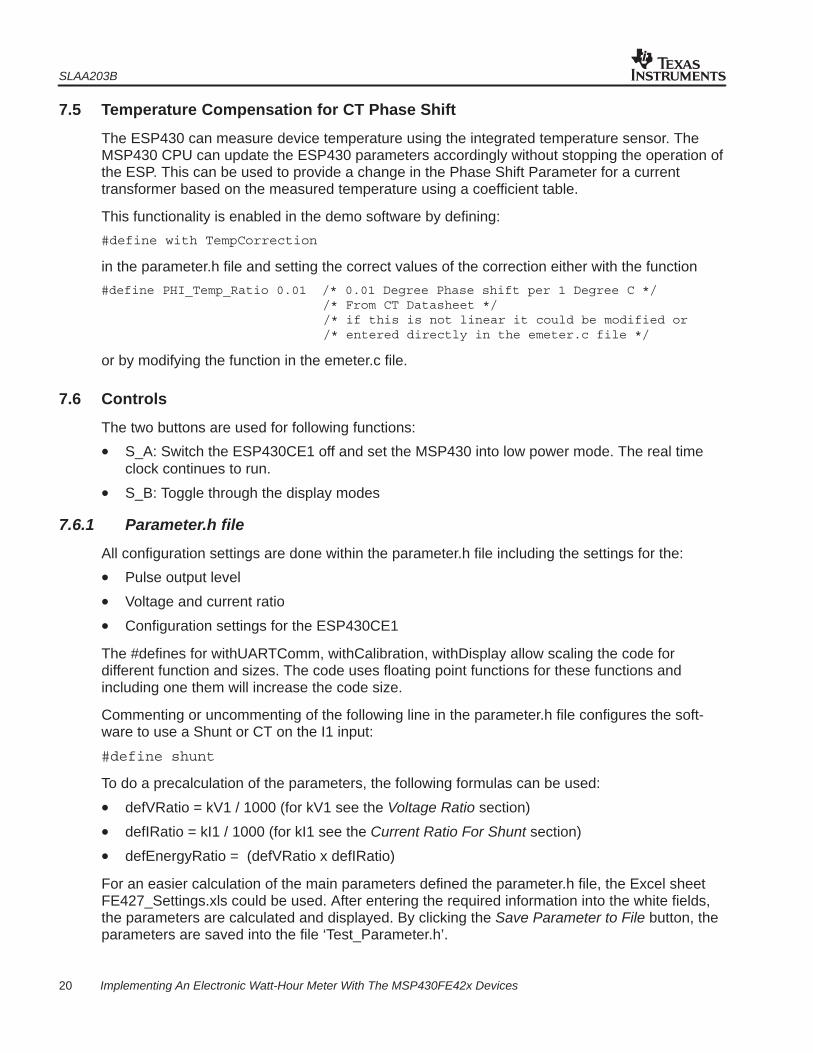
7.5 Temperature Compensation for CT Phase Shift
The ESP430 can measure device temperature using the integrated temperature sensor. TheMSP430 CPU can update the ESP430 parameters accordingly without stopping the operation ofthe ESP. This can be used to provide a change in the Phase Shift Parameter for a currenttransformer based on the measured temperature using a coefficient table.
This functionality is enabled in the demo software by defining:
#define with TempCorrection
in the parameter.h file and setting the correct values of the correction either with the function
#define PHI_Temp_Ratio 0.01 /* 0.01 Degree Phase shift per 1 Degree C */ /* From CT Datasheet */ /* if this is not linear it could be modified or /* entered directly in the emeter.c file */
or by modifying the function in the emeter.c file.
7.6 Controls
The two buttons are used for following functions:
• S_A: Switch the ESP430CE1 off and set the MSP430 into low power mode. The real timeclock continues to run.
• S_B: Toggle through the display modes
7.6.1 Parameter.h file
All configuration settings are done within the parameter.h file including the settings for the:
• Pulse output level
• Voltage and current ratio
• Configuration settings for the ESP430CE1
The #defines for withUARTComm, withCalibration, withDisplay allow scaling the code fordifferent function and sizes. The code uses floating point functions for these functions andincluding one them will increase the code size.
Commenting or uncommenting of the following line in the parameter.h file configures the soft-ware to use a Shunt or CT on the I1 input:
#define shunt
To do a precalculation of the parameters, the following formulas can be used:
• defVRatio = kV1 / 1000 (for kV1 see the Voltage Ratio section)
• defIRatio = kI1 / 1000 (for kI1 see the Current Ratio For Shunt section)
• defEnergyRatio = (defVRatio x defIRatio)
For an easier calculation of the main parameters defined the parameter.h file, the Excel sheetFE427_Settings.xls could be used. After entering the required information into the white fields,the parameters are calculated and displayed. By clicking the Save Parameter to File button, theparameters are saved into the file ‘Test_Parameter.h’.

SLAA203B
21 Implementing An Electronic Watt-Hour Meter With The MSP430FE42x Devices
This file with the calculated parameters will be included into the source. The following sectiondescribes the usage of the FE427_Settings.xls file.
See the Excel sheet which is included with the source code.
7.6.2 Using FE427_Settings.xls
Enter values into the white and blue cells as needed to meet application–specific requirementsfor the meter. Blue cells are drop down boxes and contain fixed selections while yellow cellsprovide information and intermediate calculation results. Green cells provide the calculatedparameters for use by the ESP430 based on the application–specific user inputs for the e–meterdesign.
Clicking the ’Save Parameters to File’ button saves the parameters in green cells to the file’ESP_Parameter.h’. This header file must be copied into the source file folder of the applicableMSP430FE42x demo project.
NOTE: If the Calculation values in the Hex columns are not updated in the spreadsheet, pleaseverify that the ”Analysis ToolPak” is installed and enabled under the Tools | Add–Ins... menu.
7.7 Demo 2
Demo 2 is setup as a complex application including UART communication and someauto-calibration routines that store the parameters back into the flash memory. For the energycalculation, the energy values reported from the ESP430CE1 are used instead of the interruptlevel function. The initialization of the ESP430CE1, the data output on the display, and the LEDusage is included as in the Demo 1. This demo is too large to be used with IAR Kickstart.
Demo 2 contains all the files in Demo 1 plus:
File Contents and Function
UART.c Interrupt handler for UART receive
Comms_UART.c UART communication routines:– Init UART– UART Send Functions– UART Receive Function: Process_UART (This routine processes a received UART Command).
SendData.c Conversion routines for the data which should be sent by the UART
Calibration.c Some simple calibration functions which could be used to do a basic calibration. These functionsare executed by commands sent via the UART.
flash_xxxx.c Files used to erase, write and replace information in the MSP430 flash memory space

SLAA203B
22 Implementing An Electronic Watt-Hour Meter With The MSP430FE42x Devices
7.7.1 UART Communication
The baud rate is 57600, 8N1. Each command should be terminated with a carriage return ‘CR’.
The ’h’ command displays the help list in the terminal window, as shown below.
MSP430FE427 Firmware Version: xxxx
UART Commands: SHxx: set hour SMxx: set minutes SSxx: set seconds SDxx: set day SOxx: set month SYxx: set year SIxx: set calibration current SVxx: set calibration voltage
Dx: Set Display mode 1: Off 2: Time 3: Date 4: Voltage (V) 5: Current (A) 6: Peak Voltage (V) 7: Peak Current (A) 8: Frequency (Hz) 9: CosPhi 10: Temp 11: Power (kW) 12: Energy (kWh)
Vx: Value of single measurement 1: Off 2: Time 3: Date 4: Voltage (V) 5: Current (A) 6: Peak Voltage (V) 7: Peak Current (A) 8: Frequency (Hz) 9: CosPhi 10: Temp 11: Power (kW) 12: Energy (kWh)
H : Show help test Tx: Set test dump mode Qx: Query dump R : Reset system Wxx: Write message to LCD display Mx: Execute calibration measurement over x*50 cycles I : Init
SLAA203B
23 Implementing An Electronic Watt-Hour Meter With The MSP430FE42x Devices
UART Commands continued:
C0: auto calibration of U / I / P / Phase Shift C1: calibration of Interrupt Level C2: calibration of Phase correction 1 C3: calibration of Phase correction 2 C4: calibration of V1 Offset C5: calibration of I1 Offset C6: calibration of I2 Offset C7: calibration of Gain correction 1 C8: calibration of Gain correction 2 C9: save settings to flash C10: calibration of V Ratio C11: calibration of I Ratio C12: calibration of Energy Ratio C13: calibration of Power1 offset C14: calibration of Power2 offset
+xxx: inc values for calibration –xxx: dec values for calibration
SLAA203B
24 Implementing An Electronic Watt-Hour Meter With The MSP430FE42x Devices
7.7.2 Calibration
A basic calibration can be done with the UART command ‘C0’.
The execution of this command requires the input values defined in the parameter.h file:
• calVoltage
• calCurrent
• calPhi
• calCosPhi
• calFreq
With the UART command ‘C9’ the calculated values are stored into the flash.
Calibration of Demo2 Software
The following steps detail a method for calibrating the meter implementation for the Demo2source code. This method makes a three-point calibration...
Step 1:– adjust the values in FE427_Settings.xls for the sensor used– generate the esp_Parameter.h source file and add to the Demo2 project folder– save, compile and download the software to the ’FE427
Step2:– attach the meter to an I/V generator adjusted to the calibration values defined inFE427_Settings.xls (e.g. 240 V / 10 A / 60° Phase Shift)
Step 3:– using the provided UART connection to a PC, open a serial communication terminal window(i.e. HyperTerminal) and validate proper operation. For example, using mode t8 – the terminalwindow should display the pre-calibration meter results– enter c0[ENTER] to perform an initial calibration (not required, adjusts displayed values only)
Step 4:– set first calibration point with 0° phase shift (.e.g. 240V / 10 A / 0° phase shift)– enter c7[ENTER] to adjust the channel 1 current gain for zero energy measurement error(correction is done with 0.1% of measured error, e.g. +5[ENTER] corrects an error of +0.5%)
Step 5:– set second calibration point, .e.g. 240V / 10 A / 60° phase shift– enter c2[ENTER] to adjust the channel 1 phase correction for zero energy measurement errorand for a measured cos phi of –0.5.(correction is done with the steps of the FE427 phaseCorr register, e.g. +5[ENTER])
Step 6: (optional 3rd calibration point)– adjust the I/V generator to a low current load, e.g 0.5 A and 0° phase shift– enter c13[ENTER] to adjust the power offset(correction is done with steps of the FE427 power offset register, e.g. +5[ENTER])use energy value of the FE427 displayed in the terminal with t5 mode:correction value = –( (CurrentEnergyValue * Error% ) / 4096)
Step 7:– enter c9[ENTER] to save the values to the info memory of the FE427
SLAA203B
25 Implementing An Electronic Watt-Hour Meter With The MSP430FE42x Devices
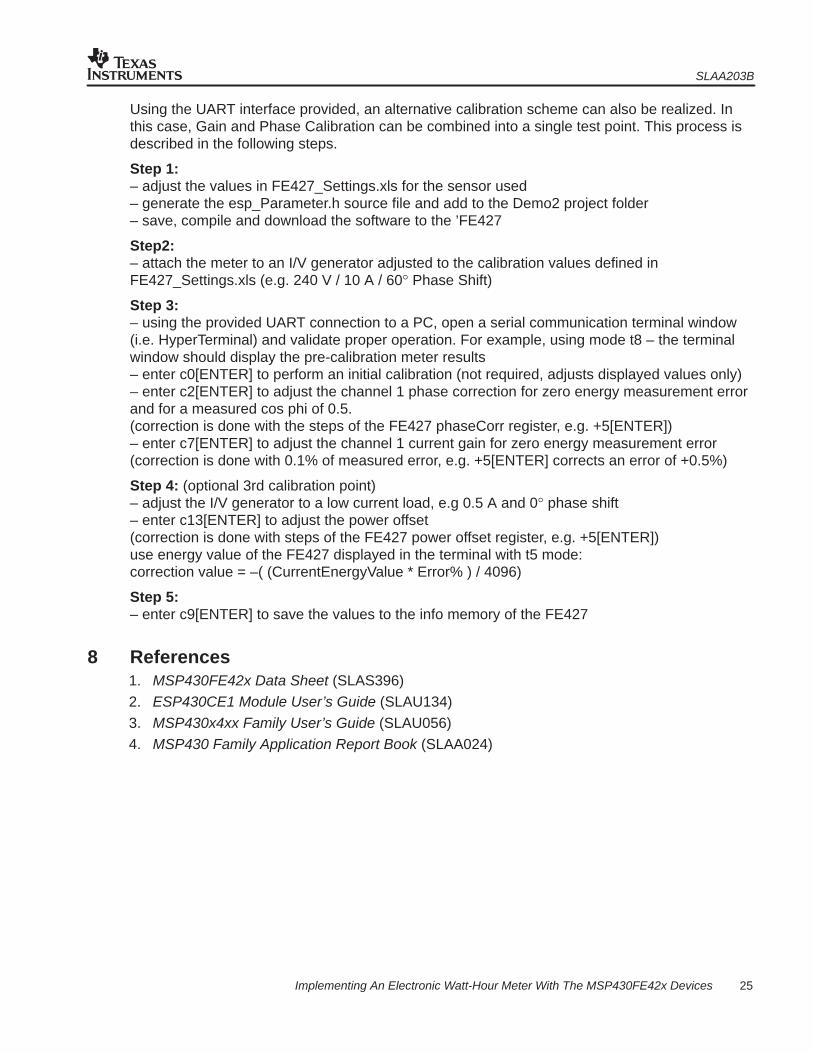
Using the UART interface provided, an alternative calibration scheme can also be realized. Inthis case, Gain and Phase Calibration can be combined into a single test point. This process isdescribed in the following steps.
Step 1:– adjust the values in FE427_Settings.xls for the sensor used– generate the esp_Parameter.h source file and add to the Demo2 project folder– save, compile and download the software to the ’FE427
Step2:– attach the meter to an I/V generator adjusted to the calibration values defined inFE427_Settings.xls (e.g. 240 V / 10 A / 60° Phase Shift)
Step 3:– using the provided UART connection to a PC, open a serial communication terminal window(i.e. HyperTerminal) and validate proper operation. For example, using mode t8 – the terminalwindow should display the pre-calibration meter results– enter c0[ENTER] to perform an initial calibration (not required, adjusts displayed values only)– enter c2[ENTER] to adjust the channel 1 phase correction for zero energy measurement errorand for a measured cos phi of 0.5.(correction is done with the steps of the FE427 phaseCorr register, e.g. +5[ENTER])– enter c7[ENTER] to adjust the channel 1 current gain for zero energy measurement error(correction is done with 0.1% of measured error, e.g. +5[ENTER] corrects an error of +0.5%)
Step 4: (optional 3rd calibration point)– adjust the I/V generator to a low current load, e.g 0.5 A and 0° phase shift– enter c13[ENTER] to adjust the power offset(correction is done with steps of the FE427 power offset register, e.g. +5[ENTER])use energy value of the FE427 displayed in the terminal with t5 mode:correction value = –( (CurrentEnergyValue * Error% ) / 4096)
Step 5:– enter c9[ENTER] to save the values to the info memory of the FE427
8 References1. MSP430FE42x Data Sheet (SLAS396)
2. ESP430CE1 Module User’s Guide (SLAU134)
3. MSP430x4xx Family User’s Guide (SLAU056)
4. MSP430 Family Application Report Book (SLAA024)

SLAA203B
26 Implementing an Electronic Watt-Hour Meter With the MSP430FE42x Devices
Appendix A Reference Board Schematic and Layout
Reset Button
Idle ModeButton
Power Supply:Left: externalRight : Power Line
Pulse output LEDConnector
JTAG / RS232Interface Connectors
+ | – + | – + | – V I1 I2
Input
External Power Supply:GNDVcc (~5V)
LCD assembledon back side
Toggle DisplayButton
Analog Input Circuit:
MSP430FE427Burden Resistors(Not assembled)
Jumper to connect neg.Input to GND
(Not assembled)
MSP430FE427
Figure A–1. Components on the Reference Board

SLAA203B
27 Implementing an Electronic Watt-Hour Meter With the MSP430FE42x Devices
Figure A–2. Schematics

SLAA203B
28 Implementing an Electronic Watt-Hour Meter With the MSP430FE42x Devices

SLAA203B
29 Implementing an Electronic Watt-Hour Meter With the MSP430FE42x Devices

SLAA203B
30 Implementing an Electronic Watt-Hour Meter With the MSP430FE42x Devices
Figure A–3. Components on Top Side
Figure A–4. Components on Bottom Side
SLAA203B
31 Implementing an Electronic Watt-Hour Meter With the MSP430FE42x Devices
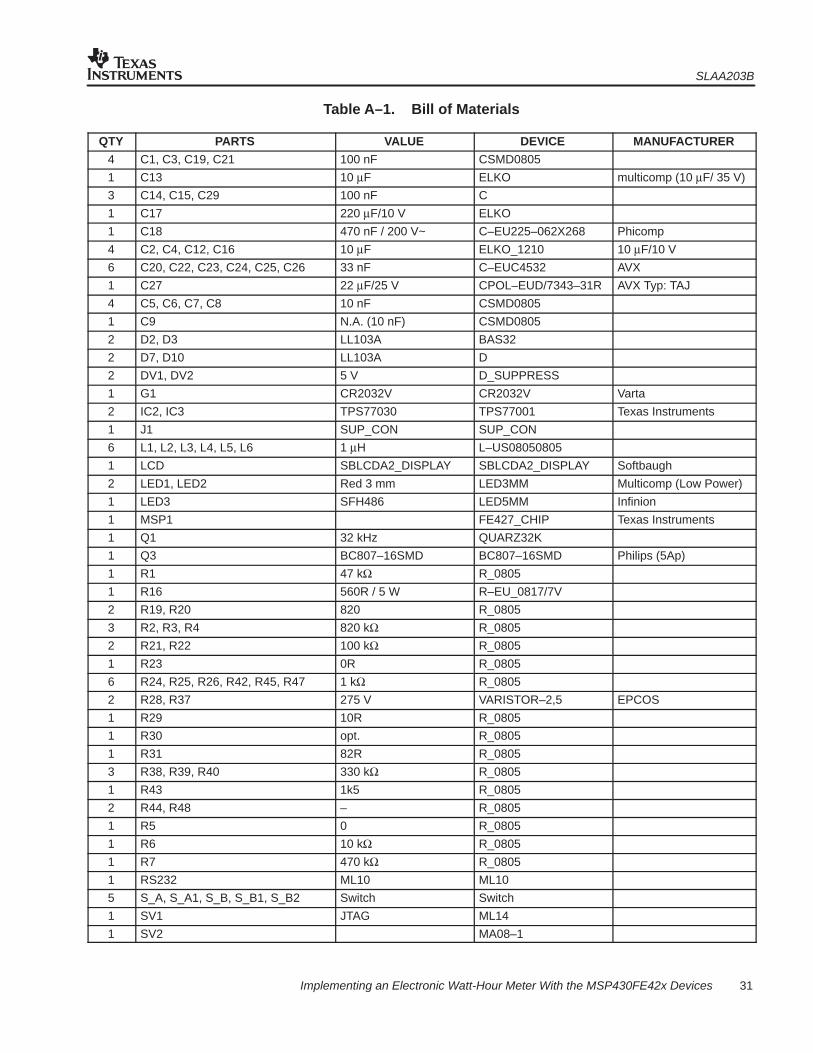
Table A–1. Bill of Materials
QTY PARTS VALUE DEVICE MANUFACTURER
4 C1, C3, C19, C21 100 nF CSMD0805
1 C13 10 μF ELKO multicomp (10 μF/ 35 V)
3 C14, C15, C29 100 nF C
1 C17 220 μF/10 V ELKO
1 C18 470 nF / 200 V~ C–EU225–062X268 Phicomp
4 C2, C4, C12, C16 10 μF ELKO_1210 10 μF/10 V
6 C20, C22, C23, C24, C25, C26 33 nF C–EUC4532 AVX
1 C27 22 μF/25 V CPOL–EUD/7343–31R AVX Typ: TAJ
4 C5, C6, C7, C8 10 nF CSMD0805
1 C9 N.A. (10 nF) CSMD0805
2 D2, D3 LL103A BAS32
2 D7, D10 LL103A D
2 DV1, DV2 5 V D_SUPPRESS
1 G1 CR2032V CR2032V Varta
2 IC2, IC3 TPS77030 TPS77001 Texas Instruments
1 J1 SUP_CON SUP_CON
6 L1, L2, L3, L4, L5, L6 1 μH L–US08050805
1 LCD SBLCDA2_DISPLAY SBLCDA2_DISPLAY Softbaugh
2 LED1, LED2 Red 3 mm LED3MM Multicomp (Low Power)
1 LED3 SFH486 LED5MM Infinion
1 MSP1 FE427_CHIP Texas Instruments
1 Q1 32 kHz QUARZ32K
1 Q3 BC807–16SMD BC807–16SMD Philips (5Ap)
1 R1 47 kΩ R_0805
1 R16 560R / 5 W R–EU_0817/7V
2 R19, R20 820 R_0805
3 R2, R3, R4 820 kΩ R_0805
2 R21, R22 100 kΩ R_0805
1 R23 0R R_0805
6 R24, R25, R26, R42, R45, R47 1 kΩ R_0805
2 R28, R37 275 V VARISTOR–2,5 EPCOS
1 R29 10R R_0805
1 R30 opt. R_0805
1 R31 82R R_0805
3 R38, R39, R40 330 kΩ R_0805
1 R43 1k5 R_0805
2 R44, R48 – R_0805
1 R5 0 R_0805
1 R6 10 kΩ R_0805
1 R7 470 kΩ R_0805
1 RS232 ML10 ML10
5 S_A, S_A1, S_B, S_B1, S_B2 Switch Switch
1 SV1 JTAG ML14
1 SV2 MA08–1

SLAA203B
32 Implementing an Electronic Watt-Hour Meter With the MSP430FE42x Devices
QTY MANUFACTURERDEVICEVALUEPARTS
1 SV3 VCC select MA03–1@2
3 TP1, TP2, TP3 JP1E Connector row
6 X1, X2, X3, X4, X5, X6 W236–1 W236–1 Wago 256
1 ZD1 (opt) 3.3 V D
1 ZD2 3.9 V D

SLAA203B
33 Implementing an Electronic Watt-Hour Meter With the MSP430FE42x Devices
Appendix B Frequently Asked Questions
1) Is it possible to implement temperature compensation with the ESP.
Yes, the ESP430 can measure ambient temperature with the integrated temperature sensor.Using this result, the MSP430 CPU can modify parameters in the ESP430 accordingly. This canalso be performed without stopping the ESP, on the fly. For example, to change the phase shiftparameter for a current transformer based on ambient temperature, a parameter lookup tablecan be applied to the ESP setup by the MSP430 CPU to improve the temperature dependenterror performance of the CT.
2) Reactive power appears to be inaccurate at low current loads.
The reactive power is calculated using the power triangle method using the active and apparentpower measured and therefore may have some variances at very low currents.
3) How is the reactive power measured?
The reactive power is not measured by the ESP, it is calculated using the active and apparentpower results. Because the discrete SD16 values are available to the MSP430 CPU, thereactive power can be calculated by doing a phase shift of the voltage or current by 90� withuser software. In this case it is also possible to apply filtering for harmonics which are required insome meters.
4) Energy pulses which are directly generated by the ESP430 interrupt level functionseems to exhibit jitter. Is the measurement unstable?
The ESP430 interrupt level flag is set as soon as the preset energy is accumulated in the buffer.With each SD16 conversion result a certain amount of energy is added to the internal buffer.Since this energy is based on a sin^2 function, sometimes a very small or very large amount canbe accumulated. Each time the value in the buffer exceeds the limit set by the interrupt level theflag is set and the interrupt service is requested.
5) When negative energy is measured by the meter, ILREACHED is not launching anevent message as it does when the meter measures positive energy. I believeILREACHED should be causing an interrupt and a message each time the amount ofnegative energy is accumulated by the meter, but it is not doing this. I’ve tried NEx bitsettings 00, 01, and 10 in the ESP_CTRL0 register without any success.
The ILREACHED function for energy mode does the processing in real-time. This means witheach value which comes from the SD16 converter the actual measured energy is added to the internal buffer and compared with the preset level. This is the reason why it only works withpositive active energy for the comparison.
However, the correct energies according to the NEx bits are always available in the energyreturn registers within the ESP430 module and can be accessed anytime by the CPU:#define ACTENERGY1_LO RET8 /* Active energy I1 Low Word */#define ACTENERGY1_HI RET9 /* Active energy I1 High Word */#define ACTENERGY2_LO RET10 /* Active energy I2 Low Word */#define ACTENERGY2_HI RET11 /* Active energy I2 High Word*/#define ACTENSPER1_LO RET16 /* Active energy I1 for last mains period LSW */#define ACTENSPER1_HI RET17 /* Active energy I1 for last mains period MSW */#define ACTENSPER2_LO RET18 /* Active energy I2 for last mains period LSW */#define ACTENSPER2_HI RET19 /* Active energy I2 for last mains period MSW */
SLAA203B
34 Implementing an Electronic Watt-Hour Meter With the MSP430FE42x Devices
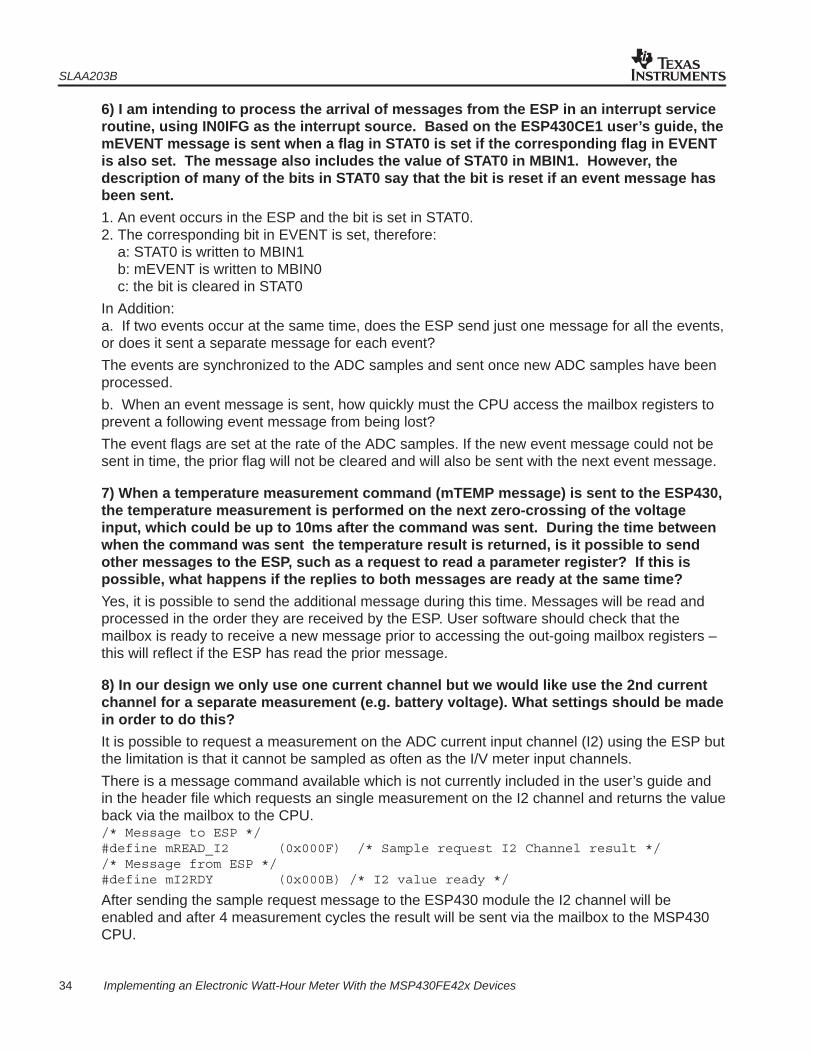
6) I am intending to process the arrival of messages from the ESP in an interrupt serviceroutine, using IN0IFG as the interrupt source. Based on the ESP430CE1 user’s guide, themEVENT message is sent when a flag in STAT0 is set if the corresponding flag in EVENTis also set. The message also includes the value of STAT0 in MBIN1. However, thedescription of many of the bits in STAT0 say that the bit is reset if an event message hasbeen sent.
1. An event occurs in the ESP and the bit is set in STAT0.2. The corresponding bit in EVENT is set, therefore: a: STAT0 is written to MBIN1 b: mEVENT is written to MBIN0 c: the bit is cleared in STAT0
In Addition:a. If two events occur at the same time, does the ESP send just one message for all the events,or does it sent a separate message for each event?
The events are synchronized to the ADC samples and sent once new ADC samples have beenprocessed.
b. When an event message is sent, how quickly must the CPU access the mailbox registers toprevent a following event message from being lost?
The event flags are set at the rate of the ADC samples. If the new event message could not besent in time, the prior flag will not be cleared and will also be sent with the next event message.
7) When a temperature measurement command (mTEMP message) is sent to the ESP430,the temperature measurement is performed on the next zero-crossing of the voltageinput, which could be up to 10ms after the command was sent. During the time betweenwhen the command was sent the temperature result is returned, is it possible to sendother messages to the ESP, such as a request to read a parameter register? If this ispossible, what happens if the replies to both messages are ready at the same time?
Yes, it is possible to send the additional message during this time. Messages will be read andprocessed in the order they are received by the ESP. User software should check that themailbox is ready to receive a new message prior to accessing the out-going mailbox registers –this will reflect if the ESP has read the prior message.
8) In our design we only use one current channel but we would like use the 2nd currentchannel for a separate measurement (e.g. battery voltage). What settings should be madein order to do this?
It is possible to request a measurement on the ADC current input channel (I2) using the ESP butthe limitation is that it cannot be sampled as often as the I/V meter input channels.
There is a message command available which is not currently included in the user’s guide andin the header file which requests an single measurement on the I2 channel and returns the valueback via the mailbox to the CPU./* Message to ESP */#define mREAD_I2 (0x000F) /* Sample request I2 Channel result *//* Message from ESP */#define mI2RDY (0x000B) /* I2 value ready */
After sending the sample request message to the ESP430 module the I2 channel will beenabled and after 4 measurement cycles the result will be sent via the mailbox to the MSP430CPU.

IMPORTANT NOTICE
Texas Instruments Incorporated and its subsidiaries (TI) reserve the right to make corrections, modifications,enhancements, improvements, and other changes to its products and services at any time and to discontinueany product or service without notice. Customers should obtain the latest relevant information before placingorders and should verify that such information is current and complete. All products are sold subject to TI’s termsand conditions of sale supplied at the time of order acknowledgment.
TI warrants performance of its hardware products to the specifications applicable at the time of sale inaccordance with TI’s standard warranty. Testing and other quality control techniques are used to the extent TIdeems necessary to support this warranty. Except where mandated by government requirements, testing of allparameters of each product is not necessarily performed.
TI assumes no liability for applications assistance or customer product design. Customers are responsible fortheir products and applications using TI components. To minimize the risks associated with customer productsand applications, customers should provide adequate design and operating safeguards.
TI does not warrant or represent that any license, either express or implied, is granted under any TI patent right,copyright, mask work right, or other TI intellectual property right relating to any combination, machine, or processin which TI products or services are used. Information published by TI regarding third-party products or servicesdoes not constitute a license from TI to use such products or services or a warranty or endorsement thereof.Use of such information may require a license from a third party under the patents or other intellectual propertyof the third party, or a license from TI under the patents or other intellectual property of TI.
Reproduction of information in TI data books or data sheets is permissible only if reproduction is withoutalteration and is accompanied by all associated warranties, conditions, limitations, and notices. Reproductionof this information with alteration is an unfair and deceptive business practice. TI is not responsible or liable forsuch altered documentation.
Resale of TI products or services with statements different from or beyond the parameters stated by TI for thatproduct or service voids all express and any implied warranties for the associated TI product or service andis an unfair and deceptive business practice. TI is not responsible or liable for any such statements.
Following are URLs where you can obtain information on other Texas Instruments products and applicationsolutions:
Products Applications
Amplifiers amplifier.ti.com Audio www.ti.com/audio
Data Converters dataconverter.ti.com Automotive www.ti.com/automotive
DSP dsp.ti.com Broadband www.ti.com/broadband
Interface interface.ti.com Digital Control www.ti.com/digitalcontrol
Logic logic.ti.com Military www.ti.com/military
Power Mgmt power.ti.com Optical Networking www.ti.com/opticalnetwork
Microcontrollers microcontroller.ti.com Security www.ti.com/security
Telephony www.ti.com/telephony
Video & Imaging www.ti.com/video
Wireless www.ti.com/wireless
Mailing Address: Texas Instruments
Post Office Box 655303 Dallas, Texas 75265
Copyright 2005, Texas Instruments Incorporated