implementing an electronic data interchange (edi) system
TRANSCRIPT
St. Cloud State UniversitytheRepository at St. Cloud StateCulminating Projects in Mechanical andManufacturing Engineering
Department of Mechanical and ManufacturingEngineering
3-2016
Implementing an Electronic Data Interchange(EDI) System in a Retail OrganizationMaham N. KhanSt. Cloud State University
Follow this and additional works at: https://repository.stcloudstate.edu/mme_etds
This Starred Paper is brought to you for free and open access by the Department of Mechanical and Manufacturing Engineering at theRepository at St.Cloud State. It has been accepted for inclusion in Culminating Projects in Mechanical and Manufacturing Engineering by an authorized administratorof theRepository at St. Cloud State. For more information, please contact [email protected].
Recommended CitationKhan, Maham N., "Implementing an Electronic Data Interchange (EDI) System in a Retail Organization" (2016). Culminating Projectsin Mechanical and Manufacturing Engineering. 27.https://repository.stcloudstate.edu/mme_etds/27

Implementing an Electronic Data Interchange (EDI) System in a Retail Organization
by
Maham Nisar Khan
A Starred Paper
Submitted to the Graduate Faculty
of
St. Cloud State University
in Partial Fulfillment of the Requirements
for the Degree
Master of Engineering Management
January, 2016
Starred Paper Committee: Ben Baliga, Chairperson
Hiral Shah Balasubramanian Kasi

2
ABSTRACT
This project has been implemented to replace a legacy EDI translator in a large retail
organization with a new EDI platform with enhanced functionality. The old system was
outdated, sluggish and could not fully comply with the industry EDI best practices. The legacy
system also had additional fail points for potential data loss, due to extensive customization. The
main goals of this project were to create a standardized EDI environment that would limit
manual intervention and labor costs, and provide better audit/monitoring capabilities for all EDI
communication.
Electronic Data Interchange (EDI) refers to the use of telecommunication technologies to
exchange data within and/or between organizations in a standardized format to promote data
security while maintaining data integrity. Customizations to the EDI communication and
translation system hampers data integrity as well as adding extraneous effort for the EDI
operations and infrastructure resources to provide support.

3
ACKNOWLEDGEMENTS
I would like to express my humble gratitude to my advisor Professor Dr. Ben Baliga who
has always been a tremendous mentor to me. I would also like to thank Professor Hiral Shah and
Professor Balsy Kasi for serving as my committee members and providing guidance and insights
throughout this process. I also want to thank you for letting my defense be an enjoyable moment,
and for your helpful feedback. I would also like to thank all my teachers who helped equip me
with the skills and knowledge required to complete this endeavor.

4
TABLE OF CONTENTS
Page
LIST OF TABLES ..........................................................................................................................6
LIST OF FIGURES ........................................................................................................................7
Chapter
I. INTRODUCTION ……………………………………………………………………………...8
Introduction ........................................................................................................................8
Problem Statement ...........................................................................................................9
Nature and Significance of the Problem ............................................................................9
Objective of the Project …………………………………………………………..……10
Project Questions and/or Hypotheses …………………………………………......…….10
Limitations of the Project .................................................................................................10
Definition of Terms ..........................................................................................................12
Summary ………………………….................................................................................14
II. BACKGROUND AND REVIEW OF LITERATURE ……………………………...……...15
Introduction .....................................................................................................................15
Background Related to the Problem ................................................................................15
Literature Related to the Problem ……….......................................................................17
Literature Related to the Methodology ……………………………………………….....19
Summary …………………………………………………………………………...…..25
III. METHODOLOGY ………………………………………………………………………….26
Introduction .......................................................................................................................26
Design of the Study ……………………………………………………………………...26

5
Chapter Page
Data Collection ……….....................................................................................................33
Data Analysis ………………………………………………………………………...….37
Budget ………………………………………………………………...............................38
Timeline ……………………………………………………………………..…………..40
Summary …………………………………………………………………..…………….42
IV. DATA PRESENTATION AND ANALYSIS …………………………………………..…..43
Introduction …………………………………………………………………………..….43
Data Presentation ………………………………………………………………………..43
Data Analysis ……………………………………………………………………...…….50
Summary ………………………………………………………………………..……….53
V. RESULTS, CONCLUSION, AND RECOMMENDATIONS ………………………………54
Introduction …………………………………………………………………………..….54
Results ……………………………………………………………………………...……54
Conclusion …………………………………………………………………………..…..56
Recommendations …………………………………………………………………….…57
REFERENCES .............................................................................................................................58
APPENDIX
A. EDI Definitions …………........................................................................................................59
B. User Satisfaction Survey Questionnaire ...................................................................................60

6
LIST OF TABLES Table Page 1. Project Budget Overview ……………………………..............................................................38 2. Project Budget-Expense Breakdown ........................................................................................38 3. Break Down of Project Work Effort …………………………………………………….……39 4. Project Timeline ……………………………………………………………………...……….40 5. Transaction Volumes from EDI System ………………………………………………...…....43 6. Transaction Counts from Internal Systems …………………………………………………...45 7. Daily “Stopped After Error” Process Counts………………………………………………….46
8. Historical Data Volumes ……………………………………………………………….……..47 9. Summary of Survey Results …………………………………………………………..………49 10. Summary of Document Audit ………………………………………………………..……...50 11. Survey Response Sheet ……………………………………………………………………...52

7
LIST OF FIGURES Figure Page 1. EDI System Architecture: “As Is” Diagram ………….............................................................16
2. EDI System Architecture: “To Be” Diagram ............................................................................17 3. Basic Steps of EDI ....................................................................................................................18 4. The Waterfall Methodology SDLC Model ..…………….........................................................21
5. RASCI Chart Template .............................................................................................................25 . 6. Business Requirements Document Template ...........................................................................28 7. BIC Mapping Designer ………….............................................................................................30
8. Defect Lifecycle ........................................................................................................................32 9. SEEBURGER B2B Portal ........................................................................................................33 10.1. Sample PDF Transactional Volume Report-Part 1 ……......................................................34
10.2. Sample PDF Transactional Volume Report-Part 2 ..............................................................35 11. B2B Portal Message Tracking Screen ....................................................................................36 12. Sample Query Search Results ………….................................................................................36
13. Sample Excel Extract of Query Results ..................................................................................36 14. Sample “Stopped After Error” Processes Report ....................................................................37 15. Error Volume Comparison (Before vs. After) ……………………………………...……….51

8
Chapter I
INTRODUCTION
Introduction
The primary intent of this project was to mitigate the current EDI system’s performance
inefficiencies and eliminate extensive customizations to the EDI infrastructure within a retail
organization by implementing a new contemporary E-Business platform / EDI translator. The
goal of this project was to increase system stability, reduce long-term development costs,
increase employee capacity without headcount and align with industry best practices. The project
implementation was structured to follow SDLC (software development life cycle) methodology,
over a course of multiple releases, in order to eventually migrate all EDI documents from the
older platform known as “Web Methods” to the new EDI platform called “Seeburger”.
EDI simplifies communication between organizations in all industries by replacing paper
documents with electronic versions and also standardizing the format and syntax. It is due to
these characteristics that since its inception, the use of EDI has become global.
The EDI documents in use by the company this project was undertaken at fall under two
file format types i.e. X12 and XML. The EDI standards that these document groupings adhere to
ASC X12 version 4030, 5010 and GS1 XML version 3.0. As part of the document migration, all
these documents were mapped for data translation within the system. Subsequently, all pre-
existing trading partnerships that the company has with other organizations were also transferred
to the new platform through a detailed process of data conversion.
The EDI communication between the organizations uses two different type of channels
i.e. AS2 and VAN and the primary difference between the two modes of communication is that

9
AS2 is direct node-to-node connection whereas VAN acts as a virtual mailbox that different
organizations can connect to send/receive EDI transmissions. As part of the project, these
connections were also impacted and were migrated to the new platforms to retain connectivity
and minimize vendor impact.
Problem Statement
The older EDI platform WebMethods was selected during a short-lived industry trend
away from EDI to XML. It lacked core functionality as a true EDI translator and required a large
degree of custom code (greater than 50%) to support EDI business growth needs and industry
best practices. This project was conceptualized 14 years later after a critical impasse was
reached, within the organization, with respect to stability and scalability.
Nature and Significance of the Problem
Having an outdated legacy EDI platform in place had overarching impact on the core
competencies of the organization’s supply chain and overall process efficiencies that affect
multiple systems that are part of the internal infrastructure. The gamut of EDI application
encompasses many different types of departments within the organization, such as transportation,
order management, logistics and billing. The current system posed limitations to a number of key
success factors for the organization such as transaction throughput limitations which inhibit
platform growth and create significant risks to daily operations, creating potential for system
failure. This creates customer, vendor and business impacts which are mitigated with the
migration to the new application which will be able to handle increased transaction volumes.
Due to the sub-par performance of the legacy system, there were connectivity issues (for
both AS2 and VAN connections) causing delays in data transmission and duplication of

10
documents. The project aimed to rectify this problem with the introduction of enhanced
monitoring capabilities as part of the base application.
Objective of the Project
The objective of this project was to overcome the shortcomings of the legacy EDI
platform by increasing time savings of daily EDI operations through improved transactional
(end-to-end) visibility and reprocessing capability, expediting the setup time for new trading
partner onboarding and generate cost savings for the organization by potentially reducing the
need for additional EDI support headcount.
Project Questions
After the project has been successfully completed, the following questions should be
sufficiently addressed:
I. What improvements did the new platform/application make to the core competencies
of the organization?
II. What mitigation measures were taken to minimize customer, vendor and business
impact, as part of the change management for the project?
III. What business analysis tools/techniques can be incorporated in the various stages of
the Software Development Lifecycle (SDLC) methodology?
Limitations of the Project
Even though the new EDI platform has provided improved efficiencies in day to day EDI
operations such as enhanced document search functionality, and improved integration with
internal systems for faster data transmission and better monitoring capabilities, certain
limitations were identified over the course of the project.

11
The most significant hurdle in terms of project implementation was the extremely tight
timeline that the project team had to operate within. Since the project was being executed within
a retail organization, the holiday season (Oct-Nov) in the fiscal year is a technology freeze period
i.e. no large IT or technology related endeavors are undertaken during this period in an effort to
avoid any potential downtime for critical systems. Any system downtime during this time period
can have severe monetary impact for the organization in terms of lost sales and delays in order
fulfillment. Due to this constraint, the project that was initially forecasted to be completed over
the course of a year was crunched down to a period of 8 months. This hard limit on project
completion time impacted the time allocated for the testing phase of the project and reduced the
buffer in place to resolve any defects that surfaced as part of the testing and deployment phases.
The other substantial limitation surfaced in the form of budget restraints. Due to the
increased urgency in terms of deployment dates, the number of man hours required per project
resource escalated. This in term caused delays due to the need of getting additional funding and
budget approvals to complete the project on target.
Also, the vendor impact as part of the project implementation eventually exceeded the
initial forecasts. Due to the standardization of the EDI documents in an effort to preserve the data
integrity of a “true” EDI translator and removal of the customizations, built in over the course of
a decade, there were changes that need to be made at the end of the vendors the organization
communicates with through EDI. These changes were communicated to the vendors prior to
deployment but many vendors did not respond back in time or failed to comply in the requested
time frame. Subsequently, there was an increase in the number of vendor-related data issues

12
arising in the post-deployment period. These unprecedented issues cause further delays in the
system stabilization period.
Definition of Terms
Electronic Data Interchange (EDI): Electronic Data Interchange or EDI is a form of
electronic commerce, which refers to the communication between trading partners for the
purpose of exchanging business information/documents. EDI utilizes telecom channels to allow
organizations to send/receive data in computer-to-computer transmissions, independent of any
entities internal application systems.
E-business: E-Business or electronic business refers to the application of IT and
communication technologies (e.g. the internet) to support business activities and processes. In
the context of this project, E-business refers to the business unit within the organization that
provides support and governs electronic communication channels with external partners for run-
the-business activities.
Trading Partner: A trading partner is any company or entity that routinely conducts
business with another company or entity.
Middleware: Middleware refers to any software components that connect two
applications at an enterprise level. Middleware is incorporate in the system architecture to
support large complex and multi-distributed business applications that are part of an
organization’s infrastructure.
ASC X12 standards: ASC X12 standards were developed by the American National
Standards Institute (ANSI) in an effort to standardize the data formats and syntax used for

13
organizations for EDI communication. There are several versions of these standards have
applications in various types of industries and organizations e.g. version 4030 and 5010.
GS1: GS1 is an independent non-profit organization, similar to ANSI, which develops
and maintains standards for supply and demand chain communications between organizations.
AS2: AS2 or Applicability Standard 2 refers to a specification for EDI communication
between two entities that occurs directly between the two parties. The intent of using AS2
connections is to ensure that proper security standards are in place for the data transmissions
between both parties.
EDI Data element: An EDI transaction document consists of EDI segments, which are
further comprised of data elements containing the transactional information.
EDI Envelope: An EDI transmission consists of single or multiple transactions enveloped
by header, trailer and other control segments which primarily identify the sender and receiver for
the transmission and the type of documents being sent.
Value-added Network (VAN): Value added network or VAN is a hosted service that acts
like a virtual mailbox for EDI communications between trading partners. Instead of direct
communication, as in the case of AS2, VANs allow companies the flexibility to communicate
with multiple trading partners concurrently without having to make specific security protocol
changes at either end. The use of a VAN for EDI communication is a paid service, incurring
additional costs as more partners are added.
Vendor managed inventory (VMI): Vendor managed inventory refers to inventory of
products that is managed and maintained (i.e. production selection, inventory threshold levels
etc.) by the supplier versus the actual distributer/retailer.

14
Data conversion: Data conversion is the process via which the trading partnerships
already in place for the old EDI platform are migrated to the new platform, with contingencies
built in to ensure data integrity and completeness.
Document mapping: Document mapping is the process of mapping the data elements of
an EDI document from one file format to another. Document maps dictate how the data is
populated/transformed as it is translated from the source format to the target file format. E.g. EDI
X12 file format to an XML file.
Implementation guide: The document that outlines how a business uses a particular EDI
document and how its respective trading partners need to structure their EDI documents for
communication between the two entities is called an implementation guide. It also includes EDI
mapping specification based on the standard being used by the organization.
Summary
This chapter outlined the need and intent for this project as well as a detailed analysis of
the problem statement, the nature and significance of the problem to assess its full impact and
how it is remedied through the successful implementation of the project objectives. The project
questions stated in this chapter will be addressed towards the completion of the project with an
in-depth analysis of how well the primary goals of the project were accomplished. The
definitions of terms that are recurrently used in this report allow for a better understanding of the
project.

15
Chapter II
BACKGROUND AND REVIEW OF LITERATURE
Introduction
This chapter will provide a detailed background and literature to further elaborate on the
initial problem statement in order to provide better cognizance of the project goals and objectives
stated earlier. This is followed by literature regarding the methodology best suited for the
implementation of this project.
Background Related to the Problem
The company that this project was executed at is a global retailer of electronic goods as
well as manufacturer of small electronic appliances. For an organization of this stature, it is
critical that all systems supporting the supply chain and communication channels with trading
partners are optimized to capacity. The scope of this project encompasses all critical functional
areas within the organization such as logistics, transportation, e-commerce, order management,
vendor managed inventory as well as accounts and billing.
EDI documents have cross-functional applications within and outside of the organization.
Data received from trading partners in transmitted further downstream to internal systems to
facilitate business processes and activities ranging from placing orders, routing and receiving
shipments, all the way to invoicing and processing sales/inventory data. Within this
infrastructure there are multiple layers of middleware, which creates additional breakpoints in
the entire network with potential to cause data loss or delays in data transmission.
The current platform is intended to be decommissioned after the completion of the
project and in the course of the transition the entire infrastructure supporting this platform has

16
been transformed to be more simple and streamlined as shown by the before and after network
diagrams. Figure 1 illustrates the complexity of the network infrastructure in the “as is” state.
Figure 1
EDI System Architecture: “As Is” Diagram
Figure 2 demonstrates how the system architecture was simplified with the implementation of
this project to improve the performance of the EDI platform in the “to be” state.
VAN
Trading Partners
Legacy EDI system
EDI Database
Front End Trading Partner Screens
Queue ManagerIn-‐House
Middleware Application
Merchandizing System
Transportation Management
System
Invoice Matching System
Archive Database
Front End Archive Screens
Network Attached Storage (NAS)
Order Management
System

17
Figure 2
EDI System Architecture: “To Be” Diagram
Literature Related to the Problem
Benefits of EDI: Electronic Data Interchange (EDI) revolutionized business
communication by replacing paper documents and standardizing the communication format,
effectively making EDI independent of all internal application systems within individual
organizations. EDI facilitates faster communication between organizations and promotes the
economy of electronic commerce (GXS, 2008).
One of the fundamental advantages of EDI over paper document transactions is the
increase in efficiency due to the reduction in time required for manual preparation and
transmission of paper documents versus electronic documents. EDI communication is also more
VAN
Trading Partners
New EDI Platform
DBFile Storage
Network Attached Storage (NAS)
In-‐House Middleware Application
Merchandizing System
Transportation Management System
Invoice Matching System
File Archive
Network Attached Storage (NAS)
Order Management
System

18
secure and accurate in terms of data integrity. Figure 3 provides a high level overview of the
EDI communication process and components in the ecosystem.
Figure 3
Basic steps of EDI
Other benefits of using EDI can be summarized as follows (Hill, 1993):
(a) Reduction in labor costs: Non-EDI systems require manual work for the preparation
of documents. These overheads are significantly reduced with the introduction of EDI.
(b) Reduction in errors: The fewer the number of touch points within the data
communication channel the lesser the occurrence of potential human errors which cause vendor
and customer impact.
(c) Scalability: Because of the faster transmission and processing times, and increased
reliability of communication for EDI documents, the volume of transactions that can handled
concurrently can be increased exponentially versus a non-EDI organization.

19
EDI Translator: EDI translators are software applications that convert elements of a user-
defined file to an EDI standard format file (e.g. ANSI ASC X12 or EDIFACT) or vice versa for
inbound/outbound EDI transmissions (Copeland & Hwang, 1997).
Literature Related to the Methodology
Software Development Life Cycle (SDLC): Software Development Life Cycle is an all-
inclusive working model that defines the sequence of phases and activities that will or should
take place during the entire software development process (Öztürk, 2013). There can be several
variations to this model based on the activities involved, number of iterations and schedule for
product delivery (piece-wise or as a whole). A generic SDLC model consists of the following
activities/stages (Tayntor, 2003).
(a) Project initiation: At this stage, the scope and stakeholders of the project are
identified and articulated in the form of a project charter, which then is finalized and
signed off on.
(b) System analysis: In this phase the current state of the system and existing work flows
are analyzed for gaps and to identify the requirements that will be geared towards
achieving the desired/future state.
(c) System design: After the requirements have been crafted and communicated to the
development arm of the project team, the design specifications are drawn up to correlate
to each defined requirement.
(d) Construction: After the blueprint for design of the new system/software has been laid
out, the actual construction/development/coding for the product would commence.

20
(e) Testing and quality assurance: After the software construction has been completed,
the testing and quality assurance phase begins, to ensure system functionality and
adherence to pre-set quality standards (industry as well as organization specific).
(f) Implementation: When the production and testing activities are complete, the new
system is now ready to enter the implementation phase whereby the
system/software/product is delivered to the end client/business.
Types of SDLC models: As mentioned earlier, there are several variations of the SDLC
model which dictate the project management methodology that will be used to manage an IT
software development endeavor. The selection of the appropriate model is critical because it is
used to communicate a universal understanding of the steps that will be needed to execute the
project, provide a set of milestones to quantitatively measure the project progress, define roles
and responsibilities and deal with uncertainty (Öztürk, 2013). Some of the different models
frequently used are waterfall, prototyping, agile, IID (Iterative and Incremental Development)
and spiral SDLCs (Öztürk, 2013).
Waterfall SDLC methodology: The waterfall model, also known as the linear-sequential
model, each phase of the cycle needs to be completed before the next phase can commence,
without concurrence between the distinct phases (Öztürk, 2013). This linearity follows the
principle that the output of one phase becomes the input of the next phase and so forth. Figure 4
provides the linear order of the project phases included in the waterfall SDLC model.

21
Figure 4
The Waterfall methodology SDLC model
The application of the waterfall model is most effective where the requirements are well
articulated and properly documented, the scope of the project and the product definition is stable
versus dynamic, and resources with sufficient knowledge of the existing systems and technical
expertise are available.
The advantages of the waterfall model include the fact it is easy to understand and
communicate, the milestones are clearly defined, project phases are completed one at a time,
ease of management and, the process and deliverables are well-documented. It is not suitable for

22
longer on-going projects which are complex and object-oriented because a working software is
not available until towards the end of the entire project.
Business Analysis: With respect to IT software delivery projects, business analysis comes
into play from the very inception of the project charter. When the project scope has been defined,
it is important to develop and implement a strategy that details out all the activities that would be
required to close the gap between the current and future states of the system or deliver the
required product (Cadle & Paul, 2010). Business analysis is used to identify the tactics that align
the project deliverables to the organizational goals and strategy as well as provide support for the
implementation of these tactics (Cadle, 2010)
There are several tools and techniques that can be employed to conduct effective business
analysis:
I. Joint Application Requirements (JAR)/Scoping sessions: Joint Application
Requirements gathering or Joint Application Development (JAD) is a systematic
technique that is used to gather requirements from the project stakeholders in a
collaborative manner through iterative team discussions. Effective JAR sessions
are highly structured and interactive in order to provide opportunity for
clarification of raw high-level requirements and obtain precise detailed
requirements; Effective requirement gathering is completed while providing a
safety net against scoop creep and project derailment (Brennan, 2009). During
these workshops, stakeholders get together to analyze the business systems and
state, and identify solutions to the situation identified as part of the project scope.
23
The attendance of these sessions has to be a diverse mix of business, technology,
subject matter experts and facilitators (usually business analysts) to represent all
aspects of the project and keep the workshop agenda on schedule. It is also
important that decision makers be present at these sessions to ensure that
requirements are documented and finalized concurrently. The business
requirements gathered need to be identified as functional, non-functional,
technology and transition requirements.
II. Activity Diagrams: Activity diagrams can be created using UML (unified
modeling language) as a visual aid to illustrate the flow of activities within a
system. Once the functional requirements for the new system have been identified
and defined, activity diagrams are a helpful tool to capture the dynamic behavior
of the system and help in the construction of a final executable system.
III. Use Cases/ Use Case Diagrams/User stories: Use cases are represented in UML
using use case diagrams which help illustrate a black box view of the system
(Gomaa & Olimpiew, 2005). It is the external view of the system as seen from the
end user to help assess the ease of use of the system. Use case walkthroughs can
help answer critical questions such as ‘will the new system provide all the
existing functionality of the current system while providing additional
capabilities?’ ‘Would the enhanced new functions be user friendly?’ ‘Is the
system intuitive enough?’ If gaps are identified, requirements can be revisited and
improved upon.

24
IV. Requirements Tracking Matrix: After requirements have been signed off upon,
design phase has been completed and development has begun, the support role of
business analysis becomes integral. A requirements tracking matrix is a tool that
is used to ensure that all the functional, non-functional and technical requirements
are continuously being addressed throughout each stage of SDLC through
interactive analysis.
RASCI Chart: RASCI chart (Hightower, 2008) for a project refers to a matrix that defines
who the resources that fulfill the following roles (figure 5 provides an example of a RASCI
chart):
I. “Responsible”: This role identifies the resource who is responsible for completing a
project task.
II. “Approve”: This role identifies the owner of a project task who needs to provide
approvals.
III. “Support”: This role identifies resources that don’t directly own the task execution
but provide support.
IV. “Consult”: This role identifies subject matter experts (SME) or other resources that
act in a consulting role for the project/task.
V. “Inform”: This role identifies project stakeholders that are not required for approvals
but still need to be informed regarding the project plan/task updates.

25
Figure 5
RASCI Chart Template
User Acceptance Testing: User Acceptance Testing or UAT is the final phase in the
application testing cycle of the project in which real world end users of the application execute
test scenarios based on their use cases and validate that the final product meets the business
requirements that were defined at the beginning of the project.
Regression Testing: Regression testing refers to all testing activities that are executed to
ensure that the system still has all functionality that existed prior to the changes made as part of
the project. End-Users leverage regression testing tools to validate that no additional defects arise
in the system usability.
Summary
This chapter provided a detailed background of the project problem and extended
literature to deliver a deeper understanding of the subjects related to this project. Following this
was a discussion regarding the various elements of the methodology used for the execution of
this project. The next chapter will provide further inside into the project methodology and details
specific to the project tools, timeline and budget.
Project M
anager
Change M
anager
Busin
ess A
nalyst
Board of Directors
Service
Manager
Legal Adviso
r
Task 1 R ATask 2 R S CTask 3 R I ITask 4 R CTask 5 R A S

26
Chapter III
METHODOLOGY
Introduction
This chapter provides details regarding the project methodology and the design of study
that was employed to execute this project and collect data for analysis at the completion of the
project. Also discussed are the project timeline, budget and constraints that dictated the
progression of the project. The goal of this project was to improve the overall efficiency of EDI
operations and framework within a large retail organization by replacing an outdated legacy EDI
platform with a new EDI platform with enhanced core functionality.
Design of the Study
The design of study for this project was a combination of a qualitative and quantitative
approach. The data collected in the execution of this project was then analyzed through an
objective qualitative analysis. The structure of the project methodology and design are outlined
as follows:
Pilot Phase: As part of the process to obtain desired funding and budget for the project,
the first step for the project team was to execute a successful pilot test to illustrate the actual
benefits that would be gained with the implementation of the project in its full capacity. Two
EDI documents were selected as part of the pilot i.e. EDI 846 and EDI 852.
I. EDI 846 is an inbound document used by vendors (part of the vendor managed
inventory) for communicating Suggested Inventory Returns to the retail stores.
II. EDI 852 is an outbound document that provides Sales and Inventory information
to the vendors.

27
The pilot involved creating the maps for these documents that would translate these
documents to/from internal systems that are part of the infrastructure. After the map development
was completed, the documents were migrated to the new platform, tested successfully and then
finally activated to go live on the new platform.
Requirements gathering/Scoping: Once the project received the necessary funding to
move forward, scoping sessions were scheduled with all the stakeholders of the project. Since the
project impact extended to multiple business and functional units within the organizations, the
list of stakeholders was extensive and input from every team was mandatory. The list of business
units impacted as part of the scope of this project is as follows:
I. Transportation
II. Accounts Processing
III. Order Management
IV. Core/ Supplier Direct
V. Independent Sellers marketplace
VI. Mobile
Over the course of next few weeks requirements gathering workshops were conducted
with each of the business units, focusing on EDI documents in use by each of the teams. E.g. the
transportation team utilizes EDI 204, 214, 240, 990, 753 and 754 (see appendix A for EDI
document glossary). Figure 6 provides an example of the business requirements document
(BRD) template used in this project.

28
Business Requirements
ID Requirement Description Direction Business Area Priority
Impacted Systems
BR1 General Requirements (existing functionality) Transport
Transport System
1.1
The system shall detect technical EDI validation errors and raise alerts to E-business support and IT support teams
BR2 General Requirements (new)
2.1
The transmission time to/from the trading partner for the document shall be reduced to near real time
BR3 EDI 204 (Load Tender) Outbound
3.1
The system shall provide auditing capability for exceptions to verify the number of documents passed/failed through the system All High TMS
Figure 6
Business Requirements Document Template
After the requirements for each document type were documented as part of a business
requirements document, the BRD was then circulated to the approving parties identified as per
the RASCI chart.
The solution architect then created a functional requirements document (FRD) that was
used as a framework for any infrastructure/ system architecture changes required to meet the
business requirements for the project.

29
Functional Design Specifications: Based on the approved BRD and FRD, functional
design specifications were created for all the EDI documents which defined all functional
changes required in the impacted systems to facilitate the changes required in the business
processes going forward. This task required collaboration with the system development and
infrastructure support resources.
Development Phase: The next stage of the project was finish all the development
activities required to support the new platform and the migration of the EDI documents and
trading partner setups to the new system.
I. Document Mapping: Inbound and outbound documents need to be mapped
within the new system to translate then from EDI standard formats (e.g. X12,
GS1 XML, EDIFACT) to the in-house document formats (e.g. CSV, Flat File,
XML) and vice versa. This is a critical activity since the EDI data essentially
becomes useless or unreadable if there are defects in the mapping. The
document maps define which data elements are written to which XML tags or
line positions in a flat file for incoming EDI documents from the vendor. If
these elements are not mapped correctly, the data integrity is severely affected
and there’s vendor, business as well as possibly customer impact. The tool
used to create the document maps for this project is called BIC Mapping
Designer. The coding for a document maps is similar to writing code in Java
Script and uses similar functions and calls. Figure 7 shows a view of the BIC
mapping designer software used in the project.

30
Figure 7
BIC Mapping Designer
II. Data Conversion: All the existing trading partnerships and respective contact
details and settings for the vendors were also migrated to the new EDI
platform as part of the data conversion process. The partnerships were
grouped together based on the business unit they pertain to and what type of
EDI connection they use to communicate with the host company. There are
two type of communication channels used for EDI i.e. VAN and AS2. AS2
partners need to comply with the security protocols and standards set forth by
both partners in order to communicate successfully with each other. The VAN
is a paid service used by both parties as an intermediary pick/drop location for
documents. It is a virtual mailbox service that needs to be set up with the
correct mail slots to connect to all partners. The mail slot settings were also

31
migrated to the new platform as part of the data conversion and system
preparation efforts.
III. Software development: This set of activities incorporated all development
activities that were required to allow the new platform to connect to all
upstream and downstream system and ensure proper flow of data through the
pipeline. During this phase, auditing and monitoring capabilities were also
built into the base application to provide better visibility of the data flow
within the organization and to external partners.
Testing Phase: There were multiple stages within the testing phase of the project which
are detailed as follows:
I. Unit Testing/Debugging: After the document maps had been created and
deployed in the lower test environments, these maps were unit tested for any
high level defects related to map functionality. Defects identified in this
staged were debugged and rectified by the developers before promoting the
maps to the Production- Like (PL)f Test environment.
II. Application Product Testing (APT): During this stage, the core functionalities
of the new EDI platform were testing and validated by the testing team. Any
defects identified were resolved prior to moving to the next stage of testing.
III. Integrated Product Testing (IPT): After the APT was successfully completed
and all outstanding defects closed, the integrated product testing was executed
which validated the connections and functionality of the new platform after all
the links to the downstream/upstream systems and middleware were activated.

32
This stage validates data flow and data integrity as the files pass through the
various hops within the network infrastructure.
IV. User Acceptance and Regression testing: In the final stage of testing, the
system functionality was validated by the business users by executing test
scenarios based on everyday use cases for run-the-business, operations and
support activities. Figure 8 illustrates the lifecycle followed for the defect
resolution as part of the testing phase.
Figure 8
Defect Lifecycle
Deployment/Go-Live Phase: The final phase of the project was the actual deployment.
All the EDI documents were grouped into multiple releases so as to minimize the vendor and
customer impact and curtail any potential high level production issues that could arise post
deployment. This period included constant monitoring activities and break fixes for issues
identified during the stabilization period.
Defect lifecycle
Test
Tea
mB
usin
ess
Use
rsP
roje
ct
Team
Dev
Tea
m
User Acceptance TestingIdentify defects during UAT
Consolidate defect list
Log defects in defects
repository
Hand-off defects to Dev team
Prioritize defects
Hand off to Test team
Analyze defect and provide fix
Retest respective
test scnearios
Defect resolved
?
SIR closed
Yes
Return to Dev team
to fix
No

33
Data Collection
Data collection activities and tools facilitate the process of evaluating the success of any
project against pre-defined performance metrics and ascertain that all the project objectives have
been adequately fulfilled. For this project, the data collection involved gathering transaction
volumes from the EDI database as well as the SQL database for internal systems, based on
document types and the business/functional units in the company they relate to.
The qualitative data collection tools employed were feedback surveys (see Appendix B)
conducted with the various business units to gauge their satisfaction level with the performance
of the EDI framework in the organization with the new platform in place versus in the old world.
Transaction/document volumes were collected from the EDI system using the Message
Tracking Portal known as the SEEBURGER B2B Portal. Figure 9 shows a sample of pictorial
view of the transaction volumes obtained from the B2B portal.
Figure 9
SEEBURGER B2B Portal

34
The transaction volumes for specific data/time ranges and message types were obtained
by defining these parameters on the Statistics screen in the B2B portal. These volume statistics
were then imported via a CSV file as well as PDF file for record as shown in figure 10.1 and
10.2.
Figure 10.1
Sample PDF Transactional Volume Report- Part 1

35
Figure 10.2
Sample PDF Transactional Volume Report- part 2
In order to get more detailed view of the document volumes break down by message and
partner types, the Message Tracking screen in the B2B portal was used. This screen (see figure
11) can be used to run queries of the data from the EDI database to get detailed counts of
documents processing through the system. The queries are run using different search parameters
including data content specific values e.g. Purchase Order number, Invoice number, Type of
document, process state (failed/successful). The query results generated (e.g. figure 12) were
then exported from the Portal in a CVS format to an excel spreadsheet as shown in figure 13.

36
Figure 11
B2B Portal Message Tracking Screen
Figure 12
Sample Query Search Results
Figure 13
Sample Excel Extract of Query Results

37
The next phase of data collection was to get the daily counts for the “stopped after error”
processes from the EDI system through a user interface known as BIS Front End, as displayed in
figure 14. “Stopped after error” processes refer to documents (inbound + outbound) that have
erred out in the system and not transmitted further upstream or downstream. There can be a
multitude of reasons where processes get stuck in the error queue ranging from syntax errors
causing conversion failure, partner lookup errors caused by the system not being able to find
trading partnership the document is associated with and communication errors caused by a
failure in the communication pipeline.
Figure 14
Sample “Stopped After Error” Processes Report
Data Analysis
The data collected was then analyzed by conducting an audit of the transaction/document
volumes processed through the new EDI system versus the documents following through to the
upstream/downstream systems that constitute the functionality of various business process flows.
For example, when a customer places an order through the retail website, a purchase
order is created in the order management system which conveys that feed to the internal
merchandizing system/database and also sends the order XML file to the EDI translator. The
EDI system then converts the XML to an X12 standardized format to transmit to the respective
vendor/supplier. Within this network there are multiple middleware hops which creates potential
38
for data loss. The transaction volume audit analysis provides validation that all documents have
been received/sent and processing successfully and the data flow is not interrupted. The accuracy
of the audit count is an important performance metric for this project.
The second part of the data analysis was a trend analysis of the daily “stopped after error”
process volumes to assess the system performance during the period of stabilization as well as
compare the system performance to that of the legacy system using historical data.
The final step in the data analysis for this project involved quantifying the results
obtained from the business user satisfaction/feedback surveys to obtain a holistic view of the
success of the overall project from the internal customers’ perspective.
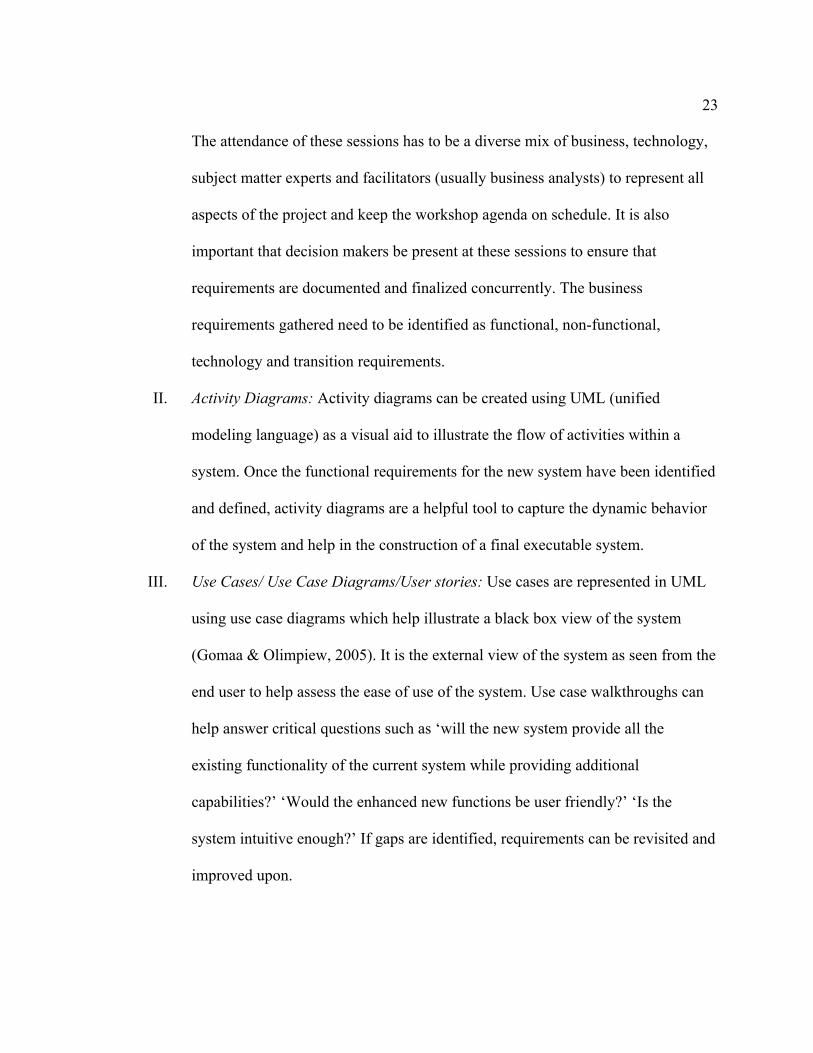
Budget
Table 1, 2 and 3 provide the details of the project budget and breakdown by expense type
and work effort.
Table 1
Project Budget Overview
Capital Expense Total Cost
Labor Fees $3,183,517 $425,455 $3,608,972
Travel Expenses $0 $70,134 $70,134
Total Budget $3,183,517 $495,589 $3,679,105
Table 2
Project Budget-Expense Breakdown
Expense Breakdown
Scoping $153,635

39
Table 3
Break Down of Project Work Effort
Breakout of Application Work Effort for Project
Phase Hours $ %
Program Management 4,164 $ 360,897 10%
Scoping 8,328 $ 721,794 20%
Design/Build 14,574 $ 1,263,140 35%
Test 12,492 $ 1,082,691 30%
Deploy 1,249 $ 108,269 3%
Post-deployment support 833 $ 72,179 2%
TOTAL 41,641 $ 3,608,972 100%
Post Deployment
Support / Delivery Oversight
$60,980
Change Management $137,421
Data Conversion $33,935
Decommission $21,152
Training $18,332
Travel Expenses $ 70,134
Total Expense $ 495,589
40
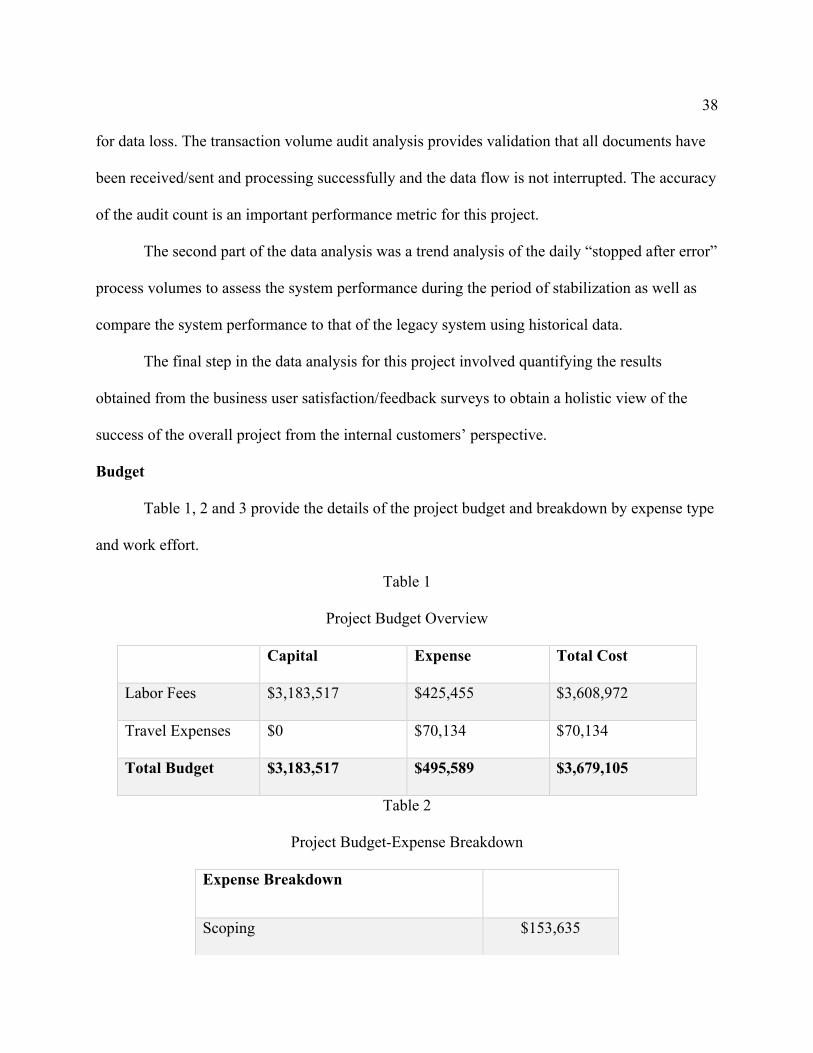
Timeline
The proposed timeline for this project, including project deliverables, milestones and
tasks is defined as follows in table 4.
Table 4
Project Timeline
Task Name Duration Start Finish
EDI Platform Transformation Program 193 days Tue 3/10/15 Thu 10/29/15
SYSTEM PILOT 64 days Tue 3/10/15 Fri 6/5/15
PHASE 1 128 days Mon 3/9/15 Wed 9/2/15
Scoping EDI Documents (using Deliverables Tracker) 40 days Mon 3/9/15 Fri 5/1/15
System Architecture 43 days Wed 3/18/15 Fri 5/15/15 SEEBURGER Gap Build 47 days Mon 3/9/15 Tue 5/12/15 EDI 852 & EDI 846 Delivery 65 days Thu 4/2/15 Wed 7/1/15 DESIGN Phase 30 days Thu 4/2/15 Wed 5/13/15 BUILD Phase 32 days Thu 5/14/15 Fri 6/26/15 TEST Phase 30 days Tue 6/9/15 Mon 7/20/15 Test Planning 5 days Thu 7/16/15 Wed 7/22/15 Create Test Approach / Test Plan - AN05 5 days Thu 7/9/15 Wed 7/15/15
Test Approach Review 5 days Thu 7/16/15 Wed 7/22/15 Test Approach Sign-off 2 days Mon 7/20/15 Tue 7/21/15 Application Product Test 5 days Thu 7/23/15 Wed 7/29/15 Perform APT 5 days Thu 7/23/15 Wed 7/29/15 Apptalk 5 days Thu 7/23/15 Wed 7/29/15 RMS 5 days Thu 7/23/15 Wed 7/29/15 SEEBURGER - EDI 846 and EDI 852 5 days Thu 7/23/15 Wed 7/29/15
Integrated Product Test 15 days Thu 7/23/15 Wed 8/12/15 Smoke Testing 5 days Thu 7/23/15 Wed 7/29/15 Execute IPT Pass 1 5 days Thu 7/30/15 Wed 8/5/15 Execute IPT Pass 2 5 days Thu 8/6/15 Wed 8/12/15 User Acceptance Testing - Day in the Life (DILO) scenarios 34 days Fri 7/10/15 Wed 8/26/15

41
Complete UAT Test Plan 2 days Fri 7/10/15 Mon 7/13/15 Determine test scenarios by Document 10 days Tue 7/14/15 Mon 7/27/15
Confirm testers by Document 5 days Thu 7/23/15 Wed 7/29/15 Schedule room/s for testing 2 days Thu 7/23/15 Fri 7/24/15 Provide list of computers & user ID's for testing 5 days Thu 7/23/15 Wed 7/29/15
Prepare testing schedule & assign test cases & timing 10 days Thu 7/30/15 Wed 8/12/15
Business test kick-off (to include any UAT training needs) 1 day Mon 8/3/15 Mon 8/3/15
Conduct User Acceptance Testing 5 days Tue 8/4/15 Mon 8/10/15 Monitor UAT completion & defect resolution 5 days Fri 8/7/15 Thu 8/13/15
Business Signoff 10 days Thu 8/13/15 Wed 8/26/15 DEPLOY Phase 50 days Thu 8/27/15 Wed 11/4/15 Business Readiness 15 days Thu 8/27/15 Wed 9/16/15 Service Introduction 5 days Thu 8/27/15 Wed 9/2/15 Prepare Hypercare Support Plan 5 days Thu 8/27/15 Wed 9/2/15 Define Hypercare Business Metrics 5 days Thu 8/27/15 Wed 9/2/15
Go-Live Readiness Checklist 5 days Thu 8/27/15 Wed 9/2/15 Develop Go Live Readiness Checklist 5 days Thu 8/27/15 Wed 9/2/15
Review Business Readiness Checklist with Business Leadership 5 days Thu 8/27/15 Wed 9/2/15
Go-Live Readiness Sessions 15 days Thu 8/27/15 Wed 9/16/15 Define the session objectives and content (e.g. cutover activities, timing, etc.) 10 days Thu 8/27/15 Wed 9/9/15
Define impacted groups and level of impact 10 days Thu 8/27/15 Wed 9/9/15
Conduct Go-Live Readiness Sessions 5 days Tue 9/8/15 Mon 9/14/15
IT Deployment 10 days Thu 8/27/15 Wed 9/9/15 Pre-Deployment 10 days Thu 8/27/15 Wed 9/9/15 AS2 Partner Connection Setup Thu 8/27/15 Deployment Plan review 10 days Thu 8/27/15 Wed 9/9/15 RMS 10 days Thu 8/27/15 Wed 9/9/15 SEEBURGER 10 days Thu 8/27/15 Wed 9/9/15 Apptalk 10 days Thu 8/27/15 Wed 9/9/15

42
Infrastructure 10 days Thu 8/27/15 Wed 9/9/15 e-Business 10 days Thu 8/27/15 Wed 9/9/15 GO/NO-GO Decision 0 days Fri 9/11/15 Fri 9/11/15 Deployment 5 days Mon 9/14/15 Fri 9/18/15 RMS Deployment 5 days Mon 9/14/15 Fri 9/18/15 SEEBURGER Deployment 5 days Mon 9/14/15 Fri 9/18/15 Apptalk Deployment 5 days Mon 9/14/15 Fri 9/18/15 Infrastructure Deployment 5 days Mon 9/14/15 Fri 9/18/15 MILESTONE: GO-LIVE 0 days Mon 9/21/15 Mon 9/21/15 Post-Deployment 30 days Mon 9/21/15 Fri 10/30/15 Business Activities 30 days Mon 9/21/15 Fri 10/30/15 Post Deployment Activities 20 days Mon 9/28/15 Fri 10/23/15 Daily Status Meetings 20 days Mon 9/28/15 Fri 10/23/15 Gather Lessons Learned to incorporate into future deployments 5 days Fri 10/23/15 Thu 10/29/15
Draft Capstone final project Report 12 days Fri 10/30/15 Mon 11/16/15 Capstone project Dense 0 days Fri 01/01/16 Fri 01/01/16
Summary
This chapter described what data was collected as part of this project and what tools were
used in this project to do so as well as the data analysis techniques, both qualitative and
quantitative, that were employed in this project to get answer for the project questions raised in
the beginning of this report. To gain a better idea of the project structure, also provided in this
chapter were details regarding the proposed project timeline (including deliverables and
milestones) and the project budget breakdown.

43
Chapter IV
DATA PRESENTATION AND ANALYSIS
Introduction
This chapter will cover the structured presentation of the data collected as part of this
project followed by the application of data analysis tools and techniques to help answer the
project questions and compile the results and recommendations that will be delineated in the next
chapter.
Data Presentation
After the successful deployment of the new platform and the completion of the project,
data was collected regarding transaction and document volumes, per document type. This was
done with a weekly frequency under the stabilization period.
Table 5
Transaction Volumes from EDI System
Transaction Counts from SEEBURGER/EDI Database
Message/Doc Type
Week 1
Week 2
Week 3
Week 4
Week 5
Week 6
Week 7
Week 8
EDI 204 1162 3883 3474 4737 3267 3937 3493 4028 EDI 990 1177 692 1046 3296 1452 2094 3837 1950 EDI 210 3199 3122 2044 1477 3564 3320 1372 2940 EDI 212 49 4599 393 2507 6449 4014 733 5069 EDI 214 6694 2052 2527 2707 4883 741 4440 2475 EDI 240 3761 3898 4250 553 3081 3525 1123 1292 EDI 753 1973 1239 1936 1749 3706 2072 6664 3406 EDI 754 1253 5109 3184 5920 5325 3236 617 6528 EDI 812 1458 4675 4150 760 5956 1450 6349 2375 EDI 846 250 1803 3847 5818 6021 1912 6070 909
EDI 850 Core 1415 6669 1310 3319 5390 1300 1962 5698 GS1 Order 2914 2303 5104 2988 6284 5499 2300 3896

44
XML EDI 850
Mobile 2914 4506 2201 1674 6678 204 1692 3998 EDI 855 5878 1717 5918 5511 2004 4513 1287 5746 EDI 852 4239 4820 3420 4776 6248 3567 1918 2711
EDI 856 Core 3210 5283 4974 2103 2323 136 1778 4256 GS1Despatch
XML 4125 3074 1098 2548 4066 3021 4225 6258 EDI 856
Mobile 6998 4652 724 6276 4966 1333 2859 1553 EDI 860 246 987 2310 3526 738 1265 6095 1218 EDI 861 2310 1414 3901 4730 3303 824 3807 595 EDI 865 6756 2282 1150 1022 6454 3238 6929 6548 EDI 870 299 3534 84 4266 587 2747 5915 6700 EDI 810 3124 1654 2588 3369 3096 1408 3545 2050
Table 5 provides the document volumes for each type of EDI document per week for 8
weeks (the duration for which the data was collected). Note that the weekly volume counts are
not cumulative from the preceding week but only represent the total volume of documents
processed during the respective week.
For the same time periods, transaction volumes were also pulled from the internal
upstream/downstream systems within the organization (see table 6) to validate that there was no
loss of data between the various integration hops within the network. The volumes highlighted in
yellow are lower than the EDI system volumes and the volumes highlighted in red are greater.

45
Table 6
Transaction Counts from Internal Systems
Transaction Counts from Internal Downstream/Upstream Systems
Doc Type Dir
Source/Destination System WK 1
WK 2
WK 3
WK 4
WK 5
WK 6
WK 7
WK 8
EDI 204
Out TMS 1162 3883 3474 4737 3267 3937 3493 4028
EDI 990 In TMS 1177 692 1046 3296 1452 2094 3830 1950 EDI 210 In TMS 3180 3122 2044 1477 3564 3320 1372 2940 EDI 212 In TMS 49 4599 393 2507 6449 4014 733 5069 EDI 214 In TMS 6694 2052 2527 2707 4883 741 4440 2475 EDI 240 In TMS 3761 3898 4250 553 3081 3525 1123 1292 EDI 753 In TMS 1973 1239 1936 1749 3706 2072 6664 3406 EDI 754
Out TMS 1253 5109 3184 5920 5325 3236 617 6528
EDI 812 In OMS 1458 4675 4150 760 5956 1450 6349 2375 EDI 846
Out
Merch. System 286 1803 3847 5818 6021 1912 6070 909
EDI 850
Core
Out OMS
1415 6669 1310 3325 5390 1300 1962 5698 GS1
Order XML
Out OMS
2914 2303 5104 2988 6284 5499 2300 3896 EDI 850
Mobile
Out OMS
3010 4506 2201 1674 6678 204 1692 3998 EDI 855 In OMS 5878 1717 5918 5511 2004 4513 1287 5746 EDI 852
Out
Merch. System 4239 4820 3420 4776 6248 3567 1918 2711

46
EDI 856
Core In OMS
3210 5283 4974 1998 2323 136 1778 4256 GS1Despatch XML
In OMS 4125 3074 1098 2548 4066 3021 4225 6258
EDI 856
Mobile In OMS
6998 4652 724 6276 4966 1333 2859 1553 EDI 860
Out OMS 246 987 2310 3526 738 1265 6095 1218
EDI 861
Out
Merch. System 2310 1414 3901 4730 3303 824 3807 595
EDI 865 In OMS 6756 2282 1150 1022 6454 3238 6929 6548 EDI 870
Out OMS 305 3534 90 4266 587 2747 6859 6700
EDI 810 In
Invoice Matchin
g System 3100 1654 2588 3369 3096 1408 3545 2050
The second set of data that was collected from the EDI database was the counts for daily
“stopped after error” processes for a 30 day period as shown in table 6.
Table 7
Daily “Stopped After Error” Process Counts
"Stopped After Error" Processes- Daily Count
Date No. of Processes
9/21/2015 58 9/22/2015 18 9/23/2015 69 9/24/2015 23 9/25/2015 36 9/26/2015 38 9/27/2015 69

47
9/28/2015 48 9/29/2015 74 9/30/2015 51 10/1/2015 42 10/2/2015 95 10/3/2015 12 10/4/2015 52 10/5/2015 127 10/6/2015 96 10/7/2015 80 10/8/2015 114 10/9/2015 99
10/10/2015 69 10/11/2015 146 10/12/2015 46 10/13/2015 28 10/14/2015 141 10/15/2015 43 10/16/2015 22 10/17/2015 49 10/18/2015 63 10/19/2015 113 10/20/2015 17
To perform error processes trend analysis, historical data was also pulled from the older system
for a period of 30 days prior to deployment as shown in table 7.
Table 8
Historical Data Volumes
Error Processes from WebMethods-Daily Count
Date No. of Processes 8/21/2015 158 8/22/2015 54 8/23/2015 199

48
8/24/2015 156 8/25/2015 112 8/26/2015 105 8/27/2015 65 8/28/2015 172 8/29/2015 94 8/30/2015 155 8/31/2015 198 9/1/2015 134 9/2/2015 121 9/3/2015 169 9/4/2015 88 9/5/2015 90 9/6/2015 100 9/7/2015 108 9/8/2015 129 9/9/2015 136
9/10/2015 55 9/11/2015 174 9/12/2015 198 9/13/2015 199 9/14/2015 200 9/15/2015 123 9/16/2015 153 9/17/2015 135 9/18/2015 96 9/19/2015 104
The Feedback survey was circulated to participants of the all impacted business units 3
weeks post deployment. Participants were asked to rate 5 statements regarding the project
performance on a 5 tiered scale ranging from strongly agree to strongly disagree. The statements
presented in the survey are given below:
I. "The new EDI platform has improved the processing time for transactions"

49
II. "I have noticed a significant reduction in no. of errors/ missing documents
since the deployment of the new EDI platform"
III. "The changes made to the business process as part of this project were easy to
adapt to"
IV. "I prefer how the EDI processes and related systems functioned prior to this
project"
V. "All the relevant project business requirements for my business unit have been
fulfilled by this project"
Table 8 provides the total number of responses received were 15 and the summary of responses:
Table 9
Summary of Survey Results
Business Unit Response Date
Q1 Q2 Q3 Q4 Q5
Core/Supplier Direct
10/15/2015 Strongly Agree
Strongly Agree
Strongly Agree
Disagree Agree
Transportation 10/15/2015 Agree Agree Strongly Agree
Neutral Agree
Transportation 10/15/2015 Strongly Agree
Agree Disagree Strongly Disagree
Disagree
Core/Supplier Direct
10/15/2015 Agree Agree Agree Disagree Neutral
Core/Supplier Direct
10/15/2015 Disagree Disagree Disagree Agree Strongly Disagree
Mobile 10/15/2015 Agree Neutral Agree Strongly Disagree
Neutral
Transportation 10/16/2015 Strongly Agree
Agree Strongly Agree
Disagree Neutral
Mobile 10/16/2015 Agree Agree Agree Neutral Agree Accounts Processing
10/16/2015 Agree Agree Strongly Agree
Neutral Agree
Marketplace 10/16/2015 Neutral Neutral Neutral Agree Disagree Order Management
10/16/2015 Disagree Disagree Disagree Neutral Strongly Disagree

50
Mobile 10/16/2015 Agree Agree Agree Disagree Agree Order Management
10/16/2015 Strongly Agree
Agree Agree Disagree Agree
Transportation 10/16/2015 Strongly Agree
Strongly Agree
Strongly Agree
Strongly Disagree
Strongly Agree
Accounts Processing
10/16/2015 Agree Agree Agree Disagree Agree
Accounts Processing
10/16/2015 Agree Neutral Agree Strongly Disagree
Strongly Agree
Core/Supplier Direct
10/17/2015 Neutral Neutral Neutral Disagree Agree
Order Management
10/17/2015 Agree Agree Agree Disagree Agree
Data Analysis
Document Audit/Data Flow validation: The volume data that was obtained during the
data collection from the EDI database was then compared to the volumes obtained from the other
systems that the EDI platform flows data to and from. Table 9 summarizes the discrepancies
identified.
Table 10
Summary of Document Audit
Doc Type
Doc Direction
No. of documents
processed by SEEBURGER
No. of documents
sent/received by internal system %Discrepancy
Week 1
EDI 210 Inbound 3199 3180 -0.6% EDI 846 Outbound 250 286 14.4% EDI 850 Mobile Outbound 3000 3010 0.3% EDI 870 Outbound 299 305 2.0% EDI 810 Inbound 3124 3100 -0.8%
Week 3 EDI 870 Outbound 84 90 7.1% Week 4
EDI 850 Core Outbound 3319 3325 0.2%

51
EDI 856 Core Inbound 2103 1998 -5.0%
Week 7
EDI 990 Inbound 3837 3830 -0.2% EDI 870 Outbound 6700 6859 2.4%
Based on the data analysis, the following observations can be made:
I. Out of 23 total document types, volume discrepancies were found for 8
documents i.e. 65% of the documents had no issues in data flow.
II. Only 1 document type i.e. EDI 870 showed multiple occurrences of discrepancy.
The average discrepancy for EDI 870 over the entire period of observation 4%.
III. The largest discrepancy in volumes was found for a single document i.e. EDI 846
and only within a single week time period.
Error Trend Analysis/Comparison: The daily error counts over a course of a month were
compared to the previous month’s daily error counts in the old EDI environment to measure
changes in the system performance as shown in figure 15.
Figure 15
Error Volume Comparison (Before vs. After)
0 500
8/2
8/2
8/2
8/2
8/2
8/3
9/2
9/4
9/6
9/8
9/1
9/1
9/1
9/1
9/1
Error Process Trend Analysis for Old EDI Pla?orm
-‐250
250
9/2
9/2
9/2
9/2
9/2
10/
10/
10/
10/
10/
10/
10/
10/
10/
10/
Error Process Trend Analysis for New EDI Pla?orm

52
Comparison of the error volumes over the same length of time prior to and post
deployment of the new system shows that the overall error volume for EDI documents was
significantly lower in the latter case.
User Satisfaction Analysis: The responses received through the post-deployed user
feedback survey regarding the system performance can be summarized as follows in table 10:
Table 11
Survey Response Sheet
"The new EDI platform has improved the processing time for transactions"
"I have noticed a significant reduction in no. of errors/ missing documents since the deployment of the new EDI platform"
"The changes made to the business process as part of this project were easy to adapt to"
"I prefer how the EDI processes and related systems functioned prior to this project"
"All the relevant project business requirements for my business unit have been fulfilled by this project"
Strongly Agree 28% 11% 28% 0% 11% Agree 50% 56% 44% 11% 50% Neutral 11% 22% 11% 22% 17% Disagree 11% 11% 17% 44% 11% Strongly Disagree 0% 0% 0% 22% 11%
Based on the analysis of the survey responses the following observations can be made:
I. 78% of the respondents either agree or strongly agree that the new EDI platform
has improved document processing times.

53
II. 67% of the respondents either agree or strongly agree that the number of
document errors has gone down since deployment of the new system.
III. 72% of the respondents either agree or strongly agree that the business process
changes made as part of the project were easily adaptable.
IV. 66% of the respondents either disagree or strongly disagree with the premise that
the old system was better.
V. 61% of the respondents either agree or strongly agree that their business
requirements were met as part of the project.
Summary
This chapter provided details regarding what data was collected as part of the project
design and what tools/techniques were employed to analyze this data. The next chapter will
discuss the results that were compiled as an outcome of the data analysis as well as lessons
learned and recommendations for similar projects in the future.

54
Chapter V
RESULTS, CONCLUSION, AND RECOMMENDATIONS
Introduction
This chapter outlines the results obtained at the conclusion of this project, after the data
collection and data analysis was completed. The report concludes with a discussion of
recommendations based on lessons learned as part of the project execution.
Results
The overall methodology selected and employed for the completion of this project was
based on the Waterfall model of the Software Development Lifecycle Cycle (SDLC). The
traditional waterfall model functions on the principle that each preceding phase of the project
needs to be completed before the next phase can be started. For example, requirements gathering
and analysis activities need to be concluded before the functional specifications can be drafted
and until these two stages have been completed, the design phase cannot be started.
This project utilized a hybrid approach to the waterfall model by breaking down the
testing and deployment stages into multiple releases so as to mitigate the impact of any high
severity post-deployment production issues.
Following is a summary of the results obtained from the study of this project:
I. The audit of the document volumes shows that the majority of the EDI document
types remained unaffected by data loss issues. The discrepancies that were
identified were traced back to middleware issues and documents that had gotten
stuck in the message queues between systems due to queue manager downtimes.
The new EDI system was not responsible for any data loss or missing
transactions.

55
II. The reduction in the overall number of system errors observed per day, validates
that the performance of the overall EDI environment and communications
improved with the implementation of the new EDI platform.
III. Based on responses obtained through the feedback survey, the overall consensus
was that the majority of the stakeholders were satisfied with the system
performance and changes that were brought about as part of this project.
The project questions that were stated at the initiation of this project can now be
answered as follows:
I. What improvements did the new platform/application make to the core
competencies of the organization?
The core competencies of a retail organization are largely dependent on the
supply chain model functioning within the company, and all factors that
impact the efficacy and throughput of the supply and delivery channels. EDI
plays a significant role in supporting these functions within an organization.
Therefore, the process improvements such as faster transaction time, support
for a larger volume of transaction throughput and improved data integrity,
achieved as a result of this project, can therefore be directly correlated to the
improvement of the company’s inherent core competencies.
II. What mitigation measures were taken to minimize customer, vendor and
business impact, as part of the change management for the project?
The hybrid model of the waterfall methodology that was used to execute this
project served to mitigate the customer, vendor and business impacts by

56
reducing the number of EDI documents going live in a single deployment
release. The decision to piecemeal the deployment diminished the potential
for any catastrophic production defects that would have derailed the entire
project and cost the company millions of dollars in lost sales and revenue.
III. What business analysis tools/techniques can be incorporated in the various
stages of the Software Development Lifecycle (SDLC) methodology?
Business analysis refers to the research and techniques used to understand and
articulate business needs as well as determine feasible solutions to fulfil said
needs. It remained a critical component of the entire life cycle of the project
because all project deliverables, including process documentation and design
specifications, can be traced back to the initial business requirements obtained
through the in-depth analysis of the business systems and processes. During
the scoping phase, the analysis tool employed was Joint Application
Requirements (JAR) sessions along with Use Case diagrams and processing
modeling to illustrate the as-is and to-be states of the business processes. Even
after the design and development phases have been concluded, business
analysis again comes into play to ensure that all the requirements defined in
the scope of the project were met, via testing and validation activities.
Conclusion
In conclusion, the objectives that were stated at the inception of this project served as
guiding principles for the course of the entire endeavor. Based on the results of the project study,
it can be deduced that the problems inherent with the old EDI platform and infrastructure were

57
mitigated through the successful implementation of the new EDI platform, with minimal impact
to vendors, customers and business units within the organization.
Recommendations
Replacing a legacy system for a field of operation as critical as EDI communications is a
monumental task. This is especially true when the old system is highly customized and deeply
entrenched in multiple functional units within the organization. Based on the results obtained
from the project, following is a list of recommendations to further improve the execution of
similar projects in the future:
I. The audit of documents/data flowing between multiple middleware and
internal application systems should be automated to provide better
monitoring capabilities. This should be a proactive rather than a reactive
activity to ensure proper flow and integrity of the data.
II. Instead of just breaking down the deployment stage into multiple releases,
the use of Agile methodology to delineate the project tasks for all the
releases would provide the flexibility for revisiting and improving upon
any design deficiencies as well as conducting more rigorous unit and
application testing.
III. When the scope of the project encompasses all functional areas of the
organization, it is critical to keep all the stakeholders in the loop and
maintain effective communication regarding the all changes with the
impacted vendors as well.

58
REFERENCES
Brennan, K. (2009). A guide to the Business analysis body of knowledge (BABOK
guide) (Version 2.0 ed.). Toronto: International Institute of Business Analysis.
Cadle, J., & Paul, D. (2010). Business analysis techniques 72 essential tools for success. London:
British Computer Society.
Cadle, J. (2010). Business analysis. Swindon: British Informatics Society
Copeland, K., & Hwang, C. (1997). Electronic Data Interchange: Concepts and Effects. INET
Conference Proceedings. Retrieved from
https://www.isoc.org/inet97/proceedings/C5/C5_1.HTM
Gomaa, H., & Olimpiew, E. (2005). The Role of Use Cases in Requirements and Analysis
Modeling. Fairfax: George Mason University.
GXS Inc. (2008) An Introduction to Electronic Data Interchange [White paper]. Retrieved from
http://www.edibasics.co.uk/wp-content/uploads/WP_EDI_Primer_GXS.pdf
Hightower, R. (2008). Internal controls policies and procedures. John Wiley & Sons. p. 83.
Hill, Ned C., & Swenson, M. (1993) "Bergen Brunswig: An Update on an Industry EDI
Leader." EDI FORUM: The Journal of Electronic Commerce 6, no. 2 p. 60-63.
Öztürk, V. (2013). Selection of appropriate software development life cycle using fuzzy
logic. Journal Of Intelligent & Fuzzy Systems, 25(3), p. 797-810.
Tayntor, C. (2003). Six Sigma software development. Boca Raton: Auerbach Publications.

59
APPENDIX A
EDI DEFINITIONS
EDI Document Type Definition
204 Load tender
210 Carrier Freight details and invoice
212 Trailer manifest
214 Carrier shipment status message
240 Small package status
753 Request for routing instructions
754 Routing instructions
812 Credit/Debit Adjustment
846 Inventory inquiry/advice- suggested returns
850 Purchase order
855 VMI Reverse Purchase order/Vendor initiated purchase order
852 Sales and inventory data
856 Shipment notice/manifest
860 Order cancellation request
861 Receiving Advice
865 VMI Reverse Purchase order change/Vendor initiated purchase order change
870 Order cancellation
990 Response to load tender
997 Functional acknowledgment
810 Vendor invoice

60
APPENDIX B
CUSTOMER SATISFACTION SURVEY QUESTIONNAIRE
User Satisfaction Survey
"The new EDI platform has improved the processing time for transactions"
o Strongly Agree
o Agree
o Neutral
o Disagree
o Strongly Disagree
"I have noticed a significant reduction in no. of errors/ missing documents since the deployment of the new EDI platform"
o Strongly Agree
o Agree
o Neutral
o Disagree
o Strongly Disagree
"The changes made to the business process as part of this project were easy to adapt to"
o Strongly Agree
o Agree
o Neutral
o Disagree
o Strongly Disagree
"I prefer how the EDI processes and related systems functioned prior to this project"
o Strongly Agree
o Agree
o Neutral

61
o Disagree
o Strongly Disagree
"All the relevant project business requirements for my business unit have been fulfilled by this project"
o Strongly Agree
o Agree
o Neutral
o Disagree
o Strongly Disagree
Google Forms
Submit