implementing a data mining solution to customer
TRANSCRIPT

International Journal of Database Theory and Application
Vol. 5, No. 3, September, 2012
73
Implementing A Data Mining Solution To Customer Segmentation
For Decayable Products – A Case Study For A Textile Firm
Vahid Golmah and Golsa Mirhashemi
Department of Computer Engineering, Islamic Azad University, Neyshabur Branch,
Neyshabu, 6621901, Iran
[email protected], [email protected]
Abstract
In this paper is developed a model to cluster customers who need to production change
continuously. Mere mathematical models to cluster customers lead to ignoring the
environment factors in model. Therefore, for Adjusting model to reality, we should use
environment factors in model building. The proposed model is flexible against changes of
environment and it causes to resulted model can use for clustering the customers of decay
able productions. Proposed model perform on customer's information of a textile firm.
Key words: Customer segmentation, RFM model, Fuzzy Analytical Network process
(FANP), Self organization Map (SOM)
1. Introduction
E-business is a new business model that transforms key business processes between
customers, suppliers, employees, business patterns, provoking radical changes in the way in
which businesses operate [1]. For most firms, becoming an e-business is an evolutionary
journey from initial to final stages. This kind of transformation may involve adopting new
technologies, redesigning business processes and restructuring management. To reduce the
turbulence caused by change and enable firms to transform themselves into e-business,
change must be supported by a critical mass of stakeholders, including employees, patterns
and especially, customers [2]. From the perspective of niche marketing, all customers are not
equal (they have different lifetime value or purchase behaviors). Therefore, Managers should
carefully analysis customer behavior to better discriminate and more effectively allocate
resources to the most profitable group of customers through the cycle of customer
identification, customer attraction, customer retention, and customer development. However,
instead of targeting all customers equally or providing the same incentive offers to all
customers, enterprises can select only those customers who meet certain profitability criteria
based on their individual needs or purchasing behaviors [3]. In this regard, Customer
relationship management (CRM) is an important business approach to manage the customer's
relationship (Marketing, Sales, Services, and Support). The Concept of customer lifetime
value (CLV) or customer loyalty in CRM is the present value of all future profits generated
from a customer and it is important for helping decision-makers target markets more clearly
in fiercely competitive environments[4]. Several studies have done to calculate of CLV and
use it [4-6]. Generally, Recency, Frequency, and Monetary (RFM) analysis have been used to
measure the CLV [7-9].
This study uses sales transaction data of a textile manufacturing as the basis for work of
knowledge discovery in database (KDD). It applies group decision-making to regard
environmental effects on model by weighting RFM variables and data mining to segment
customers. RFM weighting is performed using the analytical network process (ANP), which

International Journal of Database Theory and Application
Vol. 5, No. 3, September, 2012
74
allows measurement of dependency among RFM variables. At the same time, the AHP
method is used in order to determine the RFM weights of the dependency or independency
and their effects on customer analysis. A comparative presentation of the results follows. Self
organization map (SOM) was then employed to group customers based on their weighted
RFM value.
The remainder of this paper is organized as follows. Section 2 deals with the previous
studies on customer analysis. The underlying methodology of the proposed approach, the
hybrid method of FANP and SOM, is briefly introduced in Section 3. The proposed approach
is explained and illustrated with a case study in Section 4. The paper ends with conclusions in
Section 5.
2. Background
This section will survey past research concerning customer relationship management
(CRM), SOM methodology, RFM model, and Fuzzy logic.
2.1. Customer Relationship Management (CRM)
CRM is defined as the managing of customer relationships on an organizational level
through understanding, anticipating and managing of customer needs, based on knowledge
gained of the customer, to increase organizational effectiveness and efficiency and thereby
increasing profitability. Using the CRM strategies and tactics now serve as one of the major
driving forces behind many companies' efforts to create superior value for their customers and
generate a long-term revenue stream for themselves [10].
Growing of information technology (IT) in business, collection and storage of data about
customers has become easier and less expensive, so databases in modern enterprises are now
often massive. These massive databases often contain a wealth of important data that
traditional methods of analysis fail to transform into relevant knowledge. Specifically,
meaningful knowledge is often hidden and unexpected, and hypothesis driven methods, such
as on-line analytical processing (OLAP) and most statistical methods, will generally fail to
uncover such knowledge. Data mining tools could help organizations for extracting
previously unknown and potentially useful knowledge and patterns from customer data within
CRM framework [11].
2.2. Self Organization Map (SOM) Methodology
[4] Liu, H., Yu, L., "Toward integrating feature selection algorithms for classification and
clustering", IEEE Transactions on knowledge and data engineering, Vol. pp. 491-502, 2005.
Within the context of CRM, data mining can be seen as a business driven process aimed at
the discovery and consistent use of profitable knowledge from organizational data. Data
mining could help business in CRM as: (1) improve business efficiency in the least budget.
(2) Utilize database marketing to maintain customer relationship. (3) Increase customer
loyalty and customer value contribution, decrease customer loss rate. (4) Learn customer need
to develop strategy. (5) Evaluate the effectiveness of advertisement and promotion. (6)
Control competitive advantages and improve brand orientation. (7) Respond to the
expectation of customer and strengthen service quality [12]. The generative aspect of data
mining consists of the building of a model from data [13]. There are various data modeling to
extract and indentify useful information and knowledge from large customer databases[9, 14-
16]: Association, Classification, Clustering, Forecasting, Regression, Sequence discovery,
and visualization. Choice of data mining models should be based on the data characteristics
and business requirements [17]. The most common learning model in data mining is

International Journal of Database Theory and Application
Vol. 5, No. 3, September, 2012
75
clustering. It segments a heterogeneous population into a number of more homogenous
clusters to filter, classify, and extract patterns from database records. There are numerous
machine learning techniques available for classification model. Self Organization map (SOM)
is one of the well-known algorithms for clustering.
Self-organizing map (SOM) are unsupervised networks able to learn both the distribution
(as competitive layers do) and the topology of the input vectors on which they are trained.
Consequently, excellent clustering results are obtained. In addition, an easy evaluation of the
result is possible through the graphical representation on map whose different labels
(customers or vectors identifiers) can be grouped by visual inspection. Applying some index
functions, it is possible to obtain an optimum clustering, but some “supervision” is necessary
to filter the results of the maps (i.e., the operator selects the maximum number of
clusters)[18]. In this study, SOM methodology is applied to cluster customers based on
weighted RFM variables.
2.3. RFM Model
Customer retention rate or customer loyalty has important role to improve customer
relations with organization in the area of sales, management, and customer services.
According to Feinberg and Kadam, profits increase by 25-80% when customer retention rates
increase by five points [19]. Elements of customer retention include one-to-one marketing,
loyalty programs and complaints management [17]. The concept called Customer Lifetime
Value (CLV) is used to measure the customer loyalty in CRM. CLV is the present value of all
future profits generated from a customer [16] and help decision makers to target markets
more clearly. Several authors have proposed different models to calculate CLV and applying
it [20-22]. Generally, CLV is evaluated by RFM technique for each customer or cluster. This
study use RFM terms as follows [23]:
• Recency (R): period since the last purchase.
• Frequency (F): the total number of purchases during a specific period.
• Monetary (M): Monetary value spent during one specific period.
One common approach to RFM analysis is what is known as hard [24]. Hard coding RFM
is a matter of assigning a weight to each of the variables Recency, Frequency, and Monetary
value, then calculating CLV by equation (1) for each customer or cluster in the database
(1)
Where , and the relative importance of the RFM variables [8]. Assigning weight
to RFM variables has had lots application. Stone [25] suggested that different weights should
be assigned to RFM variables depending on the characteristics of the industry. His proposed
model is efficient for particular databases without employing a systematic approach. , Liu and
Shih[8] proposed a weighted RFM-based method (WRFM-based method) that integrates AHP
and data mining to recommend products based on customer lifetime value. Although the AHP
technique removes the deficiencies inherent in the measurement and evaluation steps of RFM
analysis, it does not measure the possible dependencies among factors. The AHP method
assumes that the variables presented in the hierarchical structure are independent; however,
this is not always a reasonable presumption. This is particularly true for customers that their
needs to production change continuously.
A customer doesn’t buy all of yearly needs at one purchase during a year. Specially, when
needs be as decayable commodities or stuffs that time decrease their quality. Therefore, the
higher Frequency value decrease the Recency value and this corresponds to a higher
probability of the customer’s making a repeat purchase. A similar relationship exists between

International Journal of Database Theory and Application
Vol. 5, No. 3, September, 2012
76
Monetary and Frequency. Customers don’t usually spend high amount money in few numbers
of purchases. Customers with more purchase power have more purchase number, i.e., the
higher Monetary value increase the Frequency value (Figure 1).
As can be seen, the RFM variables are not independent of each other, and moreover, there
may even be a relationship among some variables. Since the variables weights are
traditionally computed by assuming that the variables are independent, it is possible that the
weights computed by including the dependent relations could be different. Possible changes
in the variables weights can change the loyalty of customers, and these changes, in turn, will
affect the CRM strategies and tactics. Therefore, it is necessary to employ analyses which
measure and take the possible dependencies among variables into account in RFM analysis
In this study, RFM analysis is performed using the analytical network process (ANP),
which allows measurement of dependency among RFM variables. At the same time, the AHP
method is used in order to determine the variable weights of the dependency or independency
and their effects on the loyalty rate of customers. A comparative presentation of the results
follows.
Figure 1. Internal Dependency among RFM Variables
2.4. Fuzzy Logic
In most cases, many decision problems are too complex to be understood with certainty
and all the necessary information are rarely available, but people can manage to come up with
a solution or decision by using knowledge that is imprecise rather than precise. The key idea
of fuzzy set theory is that an element has a degree of membership in a fuzzy set. Fuzzy set
theory (FST) resembles human reasoning in its use of approximate information and
uncertainty to generate decisions. FST is a mathematical theory introduced by Zadeh[26] in
1965 to model the uncertainty attributed to the vagueness and imprecision in real systems.
This theory can be viewed as a generalization of the classical set theory to deal with classes of
non-sharp boundaries. Thus, any methodology or theory implementing ‘crisp’ definitions
such as the classical set theory, arithmetic and programming may be ‘fuzzified’ by
generalizing the concept of a crisp set to the fuzzy set with blurred boundaries. The benefit of
extending crisp theory or analytical methods to fuzzy techniques is in its strength in solving
real-life problems, which inevitably entails some degree of uncertainty due to imprecision and
fuzziness [27]. A fuzzy set is defined by a membership function. The membership function
maps elements (crisp inputs) in the universe of discourse (interval that contains all the
possible input values) to elements (degrees of membership) within a certain interval, which
the most commonly used range for expressing degree of membership is the unit interval [0,
1]. If the value assigned is 0, the element does not belong to the set (it has no membership). If
the value assigned is 1, the element belongs completely to the set (it has total membership).
Finally, if the value lies within the interval [0, 1], the element has a certain degree of
membership (it belongs partially to the fuzzy set). A fuzzy set, then, contains elements that
have different degrees of membership in it. In this study, triangular fuzzy numbers, to , are
used to represent subjective pair wise comparisons of selection process (equal to extremely

International Journal of Database Theory and Application
Vol. 5, No. 3, September, 2012
77
preferred) in order to capture the vagueness (Table). A triangular fuzzy number denoted
as , where , has the following triangular type membership function:
ux
uxmumux
mxllmlx
lx
xA
;0
);/()(
);/()(
;0
)( (2)
The triangular fuzzy numbers, to , are utilized to improve the conventional nine-point
scaling scheme. In order to take the imprecision of human qualitative assessments into
consideration, the five triangular fuzzy numbers , , , and are defined with the
corresponding membership function. All attributes and alternatives are linguistically depicted
in Figure 2. The shape and position of linguistically terms are chosen in order to illustrate the
fuzzy extension of the method.
Table 1. The Linguistic Scaled Corresponding Triangular Fuzzy Numbers
Figure 2. Here’s The Fuzzy Membership Function Scale
3. Research Method
This study proposes a new procedure, joining quantitative value of RFM attributes and
SOM methodology to extract meaning rules from records about customers to cluster
International Journal of Database Theory and Application
Vol. 5, No. 3, September, 2012
78
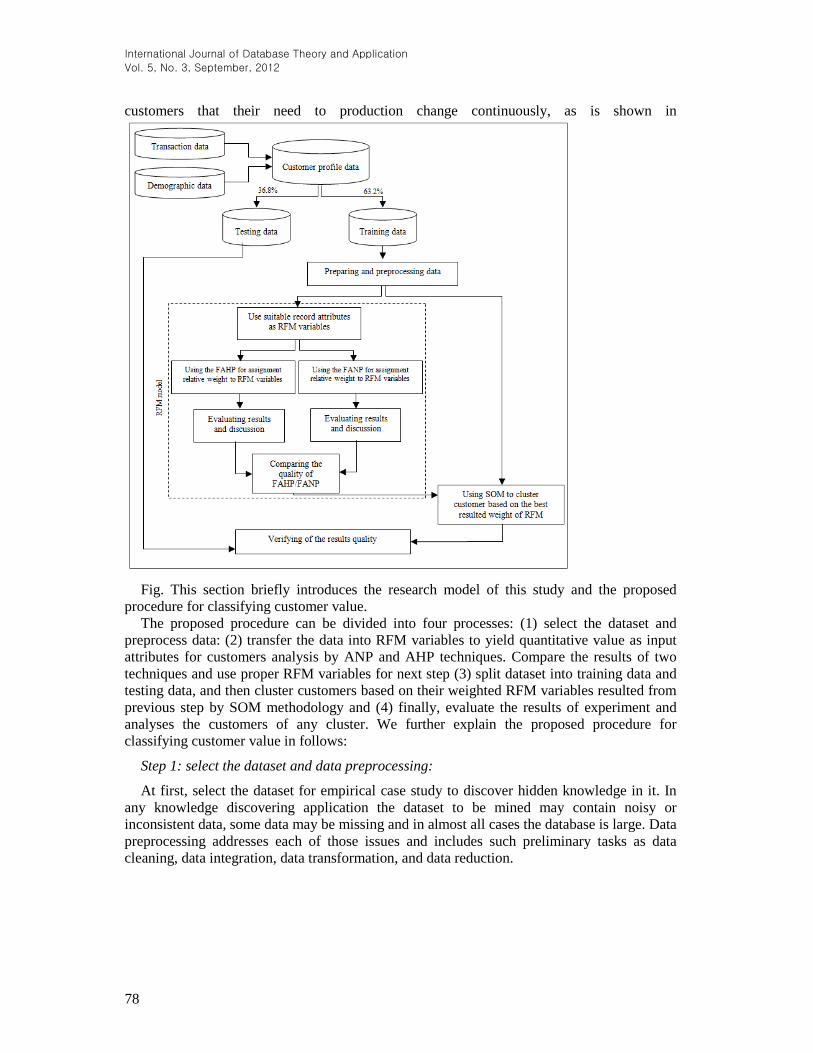
customers that their need to production change continuously, as is shown in
Fig. This section briefly introduces the research model of this study and the proposed
procedure for classifying customer value.
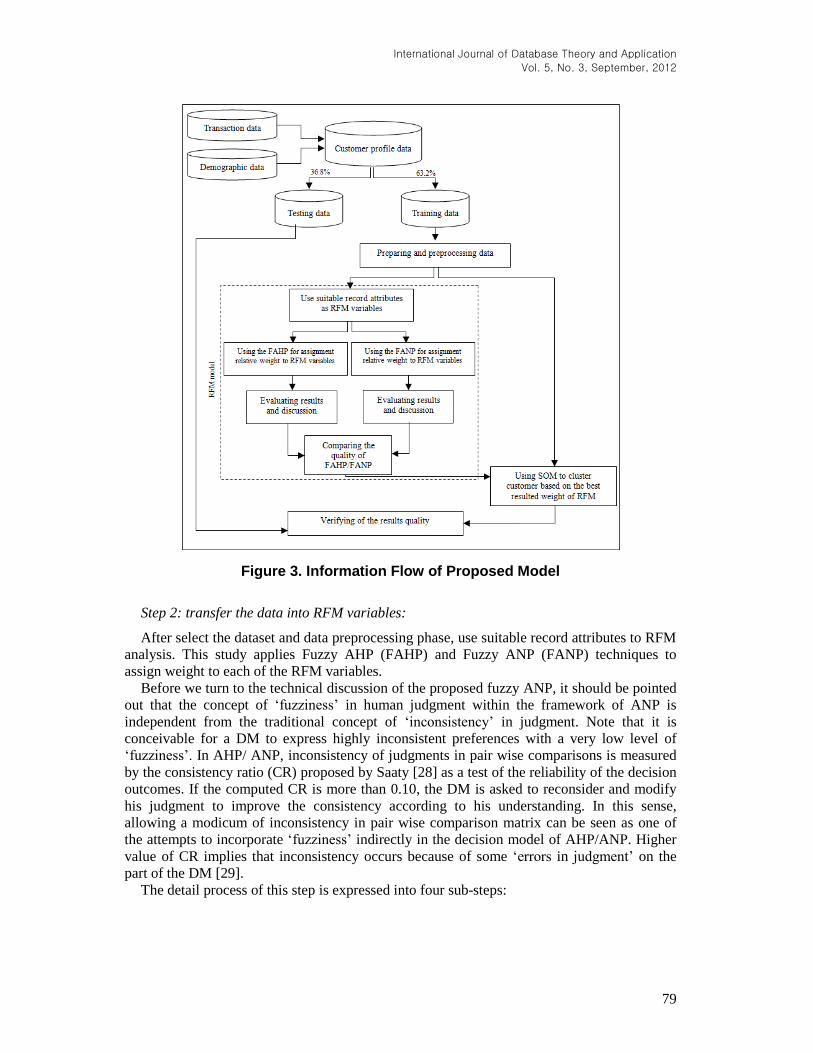
The proposed procedure can be divided into four processes: (1) select the dataset and
preprocess data: (2) transfer the data into RFM variables to yield quantitative value as input
attributes for customers analysis by ANP and AHP techniques. Compare the results of two
techniques and use proper RFM variables for next step (3) split dataset into training data and
testing data, and then cluster customers based on their weighted RFM variables resulted from
previous step by SOM methodology and (4) finally, evaluate the results of experiment and
analyses the customers of any cluster. We further explain the proposed procedure for
classifying customer value in follows:
Step 1: select the dataset and data preprocessing:
At first, select the dataset for empirical case study to discover hidden knowledge in it. In
any knowledge discovering application the dataset to be mined may contain noisy or
inconsistent data, some data may be missing and in almost all cases the database is large. Data
preprocessing addresses each of those issues and includes such preliminary tasks as data
cleaning, data integration, data transformation, and data reduction.
International Journal of Database Theory and Application
Vol. 5, No. 3, September, 2012
79
Figure 3. Information Flow of Proposed Model
Step 2: transfer the data into RFM variables:
After select the dataset and data preprocessing phase, use suitable record attributes to RFM
analysis. This study applies Fuzzy AHP (FAHP) and Fuzzy ANP (FANP) techniques to
assign weight to each of the RFM variables.
Before we turn to the technical discussion of the proposed fuzzy ANP, it should be pointed
out that the concept of ‘fuzziness’ in human judgment within the framework of ANP is
independent from the traditional concept of ‘inconsistency’ in judgment. Note that it is
conceivable for a DM to express highly inconsistent preferences with a very low level of
‘fuzziness’. In AHP/ ANP, inconsistency of judgments in pair wise comparisons is measured
by the consistency ratio (CR) proposed by Saaty [28] as a test of the reliability of the decision
outcomes. If the computed CR is more than 0.10, the DM is asked to reconsider and modify
his judgment to improve the consistency according to his understanding. In this sense,
allowing a modicum of inconsistency in pair wise comparison matrix can be seen as one of
the attempts to incorporate ‘fuzziness’ indirectly in the decision model of AHP/ANP. Higher
value of CR implies that inconsistency occurs because of some ‘errors in judgment’ on the
part of the DM [29].
The detail process of this step is expressed into four sub-steps:

International Journal of Database Theory and Application
Vol. 5, No. 3, September, 2012
80
Step 2-1: Model construction and problem structuring: The problem should be stated
clearly and be composed into a rational system, like a network. This network structure can
be obtained by decision-makers through brainstorming or other appropriate methods. The
hierarchical and network representation of the RFM model is shown in Fig.
Figure 4. (a) The Hierarchical Representation of the RFM Model. (b) The Network Representation of the RFM Model
Step 2-2: Pairwise comparison matrices and priority vectors: By using triangular fuzzy
numbers, the decision maker(s) are asked to respond to a series of pair wise comparisons with
respect to an upper level with respect to their importance towards their control criteria. In the
case of interdependencies, components in the same level are viewed as controlling
components for each other. Levels may also be interdependent. Triangular fuzzy numbers ( ,
, , and that are shown in Table are used to indicate the relative strength of each pair of
elements in the same hierarchy. Then, the fuzzy judgment matrix, , via pair wise
comparison is constructed as given below:
(3)
Regard to any entity is a triangular fuzzy number then:
(4)
A reciprocal value is assigned to the inverse comparison, that is, where ( )
denotes the importance of the ith (jth) element. Therefore:
(5)
Like with AHP, pair wise comparison in Fuzzy ANP is performed in the framework of a
matrix, and a local priority vector can be derived as an estimate of the relative importance
associated with the elements (or clusters) being compared by solving the following equation:
(a)
CLV
RFM
• • •
Elements
Clusters
(b)
CLV
RFM
• • •
#Level2: Criteria
#Level1: Goal

International Journal of Database Theory and Application
Vol. 5, No. 3, September, 2012
81
(6)
Where A is the matrix of pair wise comparison, is the eigenvector, and is the
largest eigenvalue of A.
Step 2-3: Super matrix formation: The super matrix concept is similar to the Markov chain
process [30]. The super matrix was introduced to serve as a unifying framework for the study
of priorities in hierarchy and in ‘systems with feedback’ [28]. To obtain global priorities in a
system with interdependent influences, the local priority vectors are entered in the appropriate
columns of a matrix. As an example, the super matrix representation for the hierarchy
structure that is shown in Fig(a) is as:
(7)
Where is a fuzzy sub matrix which represents the impact of the RFM variables on the
CLV, the importance in any these sub matrices present with a triangular number and is the
identity matrix that its entities are as triangular numbers.
In , this assumption was considered that clusters and elements are in depended but when
there is dependence among clusters or elements, change. If the criteria are dependent
among themselves, then the (2, 2) entry of given by . The interdependency is shown
by the presence of the matrix element, of the supermatrix of a RFM network with two
levels is as follows:
(8)
Each column of the super matrix is weighted, and the result, known as the weighted
supermatrix, is stochastic. Because is a column stochastic matrix, it is known that the
synthesis of all the interactions among the elements of this system is given by
.
(9)
Rising to powers gives the long-term relative influences of the elements on each other.
To achieve convergence of the importance weights, the weighted (stochastic) super matrix is
raised to power. This matrix is called the limit super matrix and is as:
(10)
Here, is the priority vector of weights of the alternatives. Hence, the vector can be used
for evaluating and ordering RFM variables. A detailed discussion regarding the mathematical
processes of the ANP is provided in [30-33].
Step 2-4: Analyse the RFM variables: The last step is ranking the resulted fuzzy. There are
many different methods of defuzzification available. In this paper use the center of area
method for defuzzification. This method is the most prevalent and physically most appealing
of all the defuzzification methods, and information about the center of the area is presented
under the fuzzy-membership function [34]. This is defined as follows:
(11)
According to the normalized results of Eq. (11), use RFM variables to cluster customers.
Step 3: cluster customer value by SOM methodology:
International Journal of Database Theory and Application
Vol. 5, No. 3, September, 2012
82
According to quantitative value of RFM variables for each customer, partition data (m
object) into K clusters using the SOM methodology for clustering customer value. The
analytical steps of SOM methodology are as follows[35]:
1. Determine dimension of the output map and its number of cells.
1. Initialize weights ( ) to neurons.
2. While stopping condition is false, do
3. For each input vector x, do
4. For each j, compute:
5. For index J such that D(j) is a minimum.
6. For all units j within a specified neighborhood of J, and for all i:
7. End
8. Update learning rate
9. Reduce radius of topological neighborhood at specified times.
10. End
Step 4: evaluate the results:
To avoid spurious results, and to assure that the resulting clusters are reflective of the
general population, the clustering solution should be validated. One common validation
method is to split the Customer profile data randomly into training and testing sets and the
same settings is used for two sets. The validation of method is evaluated based on having a
low error for the training set and a minimum difference between the training and testing set.
4. Application of the Proposed Procedure
In this section, we apply proposed procedure for data of a case company, and then analyze
its solutions. The applying proposed procedure on a case study can be expressed in detail as
follows:
Step 1: select the dataset and data preprocessing:
The used case study is one of textile manufacturing business with over 30 years of trading
history named by Albasco Co. The case company originally relied mainly on Iran markets. It
began using of Information Technology 5 years ago and has collected the data of 3millions
customers to personalize web pages and target email. Each customer in the database had a
profile with numerous attributes such as payment preferences, products interests, purchase
history, even birthday and anniversaries. To preprocess the dataset to make knowledge
discovery easier is needed. Thus, we firstly delete the records which include missing values or
inaccurate values, eliminate the redundant attributes and transform the datum into a format
that will be more easily and effectively processed for clustering customer value.
Step 2: transfer the data into RFM variables:
After data preprocessing, the dataset remains 1 million instances which are characterized
by the following seven fields: (i) ID, (ii) city, (iii) country, (iv) Recency, (v) Frequency, (vi)

International Journal of Database Theory and Application
Vol. 5, No. 3, September, 2012
83
Monetary, (vii) Credit amount. However, only the four attributes, ID, Recency, Frequency
and Monetary are used to calculate customers life time cycle and cluster customers based on
them.
Step 2-1: Model construction and problem structuring:
To convert the problem into a hierarchical structure, the top most elements are decomposed
into dimensions and attribute-enablers. The decision model development requires
identification of dimensions and attribute-enablers at each level and the definition of their
interrelationships. The schematic structure established is shown in
Fig. The aim of "CLV" is placed in the first level.
Figure 5. ANP Model for RFM Analysis
Step 2-2: Pairwise comparison matrices and priority vectors: In this study, select an expert
team familiar with the operation of the textile industry to use their comment across process.
At first, consider that RFM variables are independency from each other and construct the
pair wise comparison matrix of RFM variables. Any entity of this matrix shows importance of
any variable on CLV by a fuzzy number as explained before (Table 1). Then, by using Eqs.
(5) & (6), we calculate the weight of any factors (Table 2 & Table 3).
Table 1. Pair Wise Comparison Matrix of RFM Variables without any Dependency among Factors
Table 3. Weight of RFM Variables without any Dependency among Factor
On other hand, RFM variables aren’t in depended usually, therefore, to regard the
dependency among variables, determine the Inner dependence among the RFM variables by
analyzing the impact of each variable on every other and construct any matrix by using pair
wise comparisons. Using the analysis of both the internal and external environments of the

International Journal of Database Theory and Application
Vol. 5, No. 3, September, 2012
84
organization by experts, the dependencies among the RFM variables are determined (Figure
1). Based on the inner dependencies presented in Figure 1, pair wise comparison matrices are
formed for the variables (Table 4).
Table. 2. Pair Wise Comparison Matrix of RFM Variables by considering "Monetary" as a Controlling Factor
After forming dependency matrices, we calculate the relative weight of any factors by
using Eq. (6). The resulting is presented in the last column of Table 4.Error! Reference
source not found. Then, using the computed relative importance weights, the inner
dependence matrix of the RFM variables ( ) is formed (Table 5).
Table 5. Inner Dependency among Variables Matrix ( )
Step 2-3: Super matrix formation: by using the obtained matrices ( and ) and Eq.
(8), form the super matrix. This matrix isn’t normalized; therefore we should normalize it and
calculate weight of any RFM variable by using the normalized supper matrix (Table 6).
Table 6. Normalized Super Matrix
As said before, to calculate ultimate weight of any RFM variable, we need to power super
matrix until it is steady. As norm of normalized matrix is leather than one, it satisfy in defined
conditions and we can use (2, 1) entry of . Therefore, weight of any RFM variable is
calculated as Table 7:

International Journal of Database Theory and Application
Vol. 5, No. 3, September, 2012
85
Table 7. Weight of RFM Variables
Step 2-4: Analyse the RFM variables: To rank the RFM variables, use the ultimate weight
obtained of previous step. These weights are as fuzzy numbers and we need to rank fuzzy
numbers therefore we convert them to crisp number and rank respect to their crisp weights.
As said before, the most popular defuzzification method is the center of area method that we
use it in this paper. Therefore, resulted fuzzy numbers convert to a crisp number by using
Eq.(11). The weight of RFM variables is listed in Table 7.
According to the FANP technique is shown in Table 7, the priority values are 0.459, 0.409
and 0.132 for "Recency", "Frequency" and "Monetary" variables, respectively. Therefore, the
"Recency" variable is ranked the best, "Frequency" variable is the second and "Monetary"
variable is the third. By assuming there is no dependence among the variables and using same
pairwise comparison matrices to compute AHP priority values, the overall priorities
computed for the RFM variables are difference. In the AHP analysis, the "Monetary" variable
is found to be the most effective variable on CLV, with an overall priority value of 1.126.
However, the priority ordering of the RFM variables is changed to "Monetary"-"Recency"-
"Frequency". However, such a difference is expected because AHP does not take into account
dependencies among variables while ANP does. For this reason, the ANP method is better
able to model real world situations as compared to the AHP method. The superiority of ANP
allows RFM analysis to yield more realistic results. Not only has the suggested model enabled
us to satisfy the objective of our study but it has also demonstrated the functionality of the
model.
Moreover, the management assessments of the firm on which the case study was conducted
have said that they have found the results obtained from the suggested model to be
meaningful and useful. They claim that results of FANP technique to weight RFM variables
are indeed accepted as the ‘‘best priority’’.
Another parameter that verifies the validity of the model is the Saaty’s CR of the pair wise
comparison matrices. This is a necessary condition to satisfy the consistency in the fuzzy pair
wise comparison matrix [29]. In this study, the computed CR values from the modal value of
the fuzzy comparison matrices were within the tolerable range of 0.00–0.09.
Step 3: cluster customer value by SOM methodology:
At first, the RFM values of customers normalize by equations (12), (13), and (14).
(12)
(13)
(14)
Where, , and are normalized Recency, normalized Frequency and normalized
Monetary respectively. ( , ) represented the original Recency (Frequency, Monetary)
values of ith customer, while ( , ) and ( , ) represented the
largest and smallest Recency (Frequency, Monetary) value of all customers. Since Recency
variable has negative impact to CLV, the shown cost form in equation (12)Error! Reference source not found. is used to normalize the Recency value.
International Journal of Database Theory and Application
Vol. 5, No. 3, September, 2012
86
After value normalizing, the normalized RFM values of each customer multiple by the
weight of RFM variable, , and . As mentioned in previous step, FANP technique
yields to more realistic results. Therefore, we use crisp RFM weights resulted of FANP
technique as , and .
To analyse customers, cluster them by using SOM methodology. The input dataset consists
of 1 million customers of the textile manufacturing. These data belong to 2008/2009/2010
years, and they correspond to customer behavior patterns based on RFM variables. Record's
ID is used to label each customer in process. The dataset is split up into sub dataset: the
63.2% dataset (632000 records) is used as a training set, and the other 36.8% (368000) is used
as a testing set[36].
The first stage of SOM methodology is Determining dimension of the output map and its
number of cells. The dimension of the output map in this research is assumed to be two
( ), because most visible media (for example: paper, monitor panel and etc.) are 2-
dimensional. By using the heuristic method in SOM toolbar of MATLAB[37], the output map
is assumed a hexagonal network formed by a total of 6400 neurons (80×80) was used. This
size has been chosen to allow a better visualization of the output data of the training map. A
network with a greater number of cells would have hindered the visualization of the labels in
each neuron. In the same way, a smaller map than the one used by the authors would cause
many labels to be overlapped.
Finally, dataset run in Matlab 2008 environment in a single processor desktop computer
with2Core 1.6 GHz machine CPU and 1GB RAM under WINXP platform. Different training
architecture configurations, training algorithms and initial weight of neurons result to
different maps. Therefore, SOM is run ten times for each architecture configuration and the
map with the most accurate is used to analyse customers. The solution quality is analyzed in
terms of mean quantization error, which measures the resolution of the map. Quantization
error is the average distance (weighted with the mask) from each data vector of cluster to its
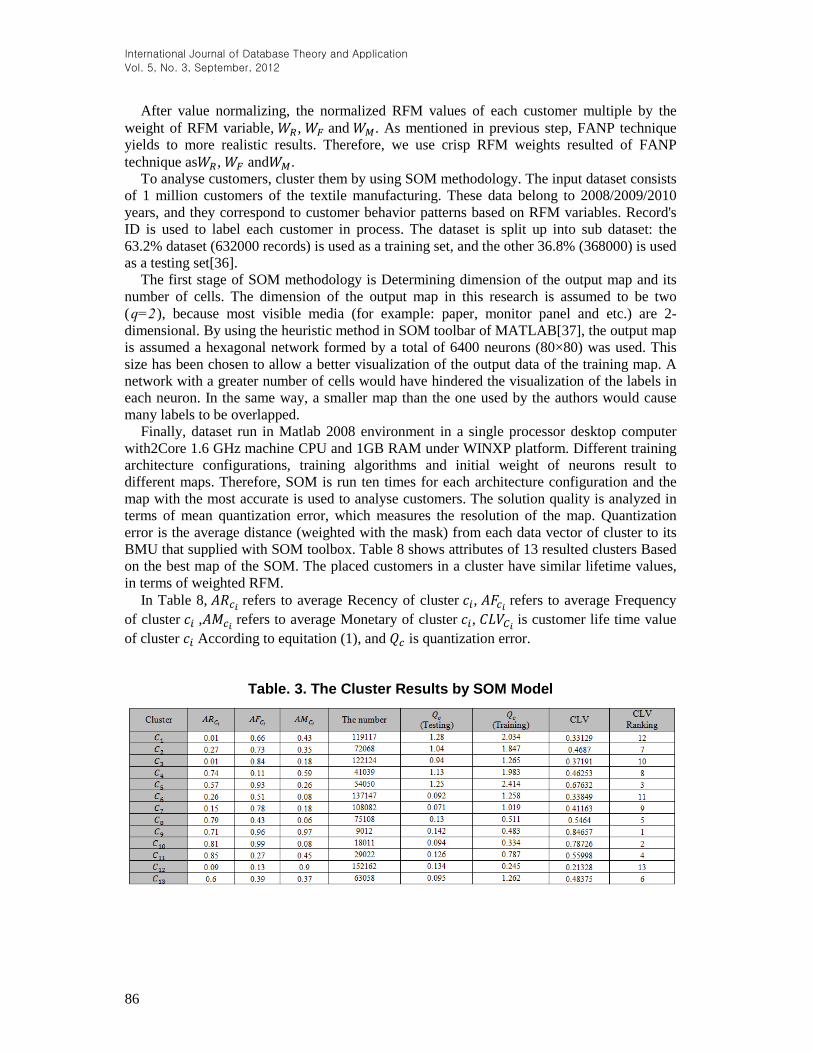
BMU that supplied with SOM toolbox. Table 8 shows attributes of 13 resulted clusters Based
on the best map of the SOM. The placed customers in a cluster have similar lifetime values,
in terms of weighted RFM.
In Table 8, refers to average Recency of cluster , refers to average Frequency
of cluster , refers to average Monetary of cluster , is customer life time value
of cluster According to equitation (1), and is quantization error.
Table. 3. The Cluster Results by SOM Model
International Journal of Database Theory and Application
Vol. 5, No. 3, September, 2012
87
Step 4: evaluate the results:
The lower values of the index(for testing and training data) in In Table 8, refers to
average Recency of cluster , refers to average Frequency of cluster , refers to
average Monetary of cluster , is customer life time value of cluster According to
equitation (1), and is quantization error.
Table. 3 demonstrate the efficiency of the proposed method to identification of new
customers and validate the resulted map. Moreover, SOM results to same index for two
sets and 13 clusters, that it can show robustness of model.
The ranking CLV for Albasco customers is 0.213, 0.331, 0.338, 0.676, 0.787 and 0.846 in
12, 1, 6, 5, 10 and 9 classes on output, respectively. By this ranking it is obtained that the less
customers have high the CLV rate(about 8.1% of all customers have the CLV more than
0.65). They are golden customers for firm. Therefore, customer retention strategies should
perform for these customers. As such, one-to-one marketing, loyalty programs and complaints
management can aim at maintaining a long term relationship with them. Many of customers
have the low CLV rate (about 40% of all customers have the CLV less than 0.35). These
classes may include new customers or customers who are being lost to the competition.
Customer identification and customer attraction is better for these customers. Such as target
customers' analysis and direct marketing. The rest of customers (about 51% of all customers),
have the medium CLV. The customer development strategies are suitable for them. Such as
lifetime value analysis, up/cross selling and market basket analysis.
5. Conclusion and Discussion
The Concept of customer lifetime value (CLV) or customer loyalty in CRM is important to
help decision-makers target markets more clearly in fiercely competitive environments. A
popular method to measure the CLV is RFM analysis that it assigns quantitative weighting to
RFM variables. Although some studies do perform such quantitative weighting, these studies
fail to consider the relations or dependencies of the variables of the RFM analysis. It is
generally not possible to assume the RFM variables to be independent and unrelated with one
another. This is particularly true in decayable commodities or stuffs that time decrease their
quality.
This study performs a RFM analysis, with a case study example (Albasco Co.) in Iran’s
textile industry, wherein the possible dependencies among RFM variables are included. The
FANP technique, which allows measurement of dependency among RFM variables and
modeling of vagueness and imprecision attributes, is utilized in this work. The FAHP
technique is also used with RFM analysis to compare the effects of the dependency among
the RFM variables on prioritizing and weighting them. The weights of the variables of the
RFM analysis differ according to the method used in the analysis (FAHP or FANP), due to
the dependency among the RFM variables. With the findings in this empirical case study, we
positively conclude that the FANP technique is more efficient than the FAHP technique.
Therefore, our work involved the introduction a novel methodology which joins FANP and
SOM to cluster customers. Based on results of our methodology, this study believes to aid
Albasco Co easier interpreting and more precise focusing the target customers. It can be
resulted to gain maximize profits with win–win situation for Albasco Co.
Since the RFM weights vary with the characteristics of product and industry, Future
research may seek to apply proposed methodology in other industries.
International Journal of Database Theory and Application
Vol. 5, No. 3, September, 2012
88
Acknowledgements
The authors would like to thank many from employees, managers, and Albasco Group
executive for allowing interviews and data collection, and for reviewing this paper.
References [1] J. Y. Lai and W. H. Chen, "Measuring e-business dependability: The employee perspective", Journal of
Systems and Software, vol. 82, (2009), pp. 1046-1055.
[2] J. Y.Lai and C. S. Ong, "Assessing and managing employees for embracing change: A multiple-item scale to
measure employee readiness for e-business", Technovation, vol. 30, (2009), pp. 76-85.
[3] N. C. Hsieh, "An integrated data mining and behavioral scoring model for analyzing bank customers", Expert
Systems with Applications, vol. 27, (2004), pp. 623-633.
[4] Y. Y. Shih and D. R. Liu, "Product recommendation approaches: Collaborative filtering via customer lifetime
value and customer demands", Expert Systems with Applications, vol. 35, (2008), pp. 350-360.
[5] M. Ma, Z. Li and J. Chen, "Phase-type distribution of customer relationship with Markovian response and
marketing expenditure decision on the customer lifetime value", European Journal of Operational Research,
vol. 187, (2008), pp. 313-326.
[6] K. A. Richards and E. Jones, "Customer relationship management: Finding value drivers", Industrial
Marketing Management, vol. 37, (2008), pp. 120-130.
[7] J. A. McCarty and M. Hastak, "Segmentation approaches in data-mining: A comparison of RFM, CHAID,
and logistic regression", Journal of business research, vol. 60, (2007), pp. 656-662.
[8] D. R. Liu and Y. Y. Shih, "Integrating AHP and data mining for product recommendation based on customer
lifetime value", Information & Management, vol. 42, (2005), pp. 387-400.
[9] C. H. Cheng and Y. S. Chen, "Classifying the segmentation of customer value via RFM model and RS
theory", Expert Systems with Applications, vol. 36, (2009), pp. 4176-4184.
[10] T. L. B. Tseng, C. C. Huang and Y. N. Fan, "Autonomous rule induction from data with tolerances in
customer relationship management", Expert Systems with Applications, (2010).
[11] S. Olafsson, X. Li and S. Wu, "Operations research and data mining", European Journal of Operational
Research, vol. 187, (2008), pp. 1429-1448.
[12] B. W. Cheng, C. L. Chang and I. S. Liu, "Enhancing care services quality of nursing homes using data
mining", Total Quality Management & Business Excellence, vol. 16, (2005), pp. 575-596.
[13] C. Giraud-Carrier and O. Povel, "Characterising data mining software", Intelligent Data Analysis, vol. 7,
(2003), pp. 181-192.
[14] S. Lessmann, "A reference model for customer-centric data mining with support vector machines", European
Journal of Operational Research, vol. 199, (2009), pp. 520-530.
[15] D. C. Li, W. L. Dai and W. T. Tseng, "A two-stage clustering method to analyze customer characteristics to
build discriminative customer management: A case of textile manufacturing business", Expert Systems with
Applications: An International Journal, vol. 38, (2011), pp. 7186-7191.
[16] M. Khajvand, K. Zolfaghar, S. Ashoori and S. Alizadeh, "Estimating customer lifetime value based on RFM
analysis of customer purchase behavior: Case study", Procedia Computer Science, vol. 3, (2011), pp. 57-63.
[17] E. W. T. Ngai, L. Xiu and D. C. K. Chau, "Application of data mining techniques in customer relationship
management: A literature review and classification", Expert Systems with Applications, vol. 36, (2009),
2592-2602.
[18] S. V. Verd ْ , M. O. Garcيa, C. Senabre, A. G. Marيn and F. J. G. Franco, "Classification, filtering, and
identification of electrical customer load patterns through the use of self-organizing maps", Power Systems,
IEEE Transactions on, vol. 21, (2006), pp. 1672-1682.
[19] S. M. S. Hosseini, A. Maleki and M. R. Gholamian, "Cluster analysis using data mining approach to develop
CRM methodology to assess the customer loyalty", Expert Systems with Applications, vol. 37, (2010), pp.
5259-5264.
[20] D. F. Benoit and D. Van den Poel, "Benefits of quantile regression for the analysis of customer lifetime value
in a contractual setting: An application in financial services", Expert Systems with Applications: An
International Journal, vol. 36, (2009), pp. 10475-10484.
[21] D. R. Liu and Y. Y. Shih, "Hybrid approaches to product recommendation based on customer lifetime value
and purchase preferences", Journal of Systems and Software, vol. 77, (2005), pp. 181-191.
[22] H. F. Wang and W. K. Hong, "Managing customer profitability in a competitive market by continuous data
mining", Industrial Marketing Management, vol. 35, (2006), pp. 715-723.
[23] C. C. H. Chan, "Online auction customer segmentation using a neural network model. International Journal of
Applied Science and Engineering 3, 101-109, (2005).
International Journal of Database Theory and Application
Vol. 5, No. 3, September, 2012
89
[24] Drozdenko, R. G.; Drake, P. D. Optimal database marketing: strategy, development, and data mining", Sage
Publications, Inc., (2002).
[25] B. Stone and R. Jacobs, "Successful direct marketing methods", McGraw-Hill Professional, (2007).
[26] L. A. Zadeh, "Fuzzy sets", Information and control, vol. 8, (1965), pp. 338-353.
[27] H. J. Zimmermann, "Fuzzy set theory--and its applications", Kluwer Academic Pub, (2001).
[28] T. L. Saaty, "The analytical hierarchy process", McGraw-Hill, New York, (1980).
[29] M. A. B. Promentilla, K. Ishii and N. Tanikawa, "A fuzzy analytic network process for multi-criteria
evaluation of contaminated site remedial countermeasures", Journal of Environmental Management, vol. 88,
(2008), pp. 479–495.
[30] T. L. Saaty, "Decision making with dependence and feedback: the analytic network process", RWS
Publications, Pittsburgh, Pa, (1996).
[31] C. D. Meyer, "Matrix analysis and applied linear algebra", Society for Industrial Mathematics, (2000).
[32] J. Ramik, "A decision system using ANP and fuzzy inputs", International Journal of Innovative Computing,
Information and Control. v3 i4, pp. 825-837.
[33] T. L. Saaty and L. G. Vargas, "Diagnosis with dependent symptoms: Bayes theorem and the analytic
hierarchy process", Operations Research, (1998), pp. 491-502.
[34] C. C. Lee, "Fuzzy logic in control systems: Fuzzy logic controller--part I", IEEE Transactions on systems,
man, and cybernetics, vol. 20, (1990), pp. 404-418.
[35] Y. H. Liang, "Integration of data mining technologies to analyze customer value for the automotive
maintenance industry", Expert Systems with Applications, vol. 37, (2010), pp. 7489-7496.
[36] I. H. Witten, "Data mining; Practical machine learning tools and techniques", San Francisco: Diane Cerra,
(2005).
[37] T. Kohonen, J. H., Jari Kangas and J. Laaksonen, "SOM PAK: The Self Organizing Map Program Package",
FINLAND, (1996).

International Journal of Database Theory and Application
Vol. 5, No. 3, September, 2012
90