implementation support for strategic ... support for strategic highway research program ii (shrp2)...
TRANSCRIPT

IMPLEMENTATION SUPPORT FOR STRATEGIC HIGHWAY RESEARCH PROGRAM II (SHRP2) RENEWAL PROJECT R21 NEW COMPOSITE
PAVEMENT SYSTEMS
Tennessee DOT Two-Lift Concrete Pavement Construction Project: I-65 NB Shoulder
April 2015

Implementation Support for SHRP2 Project R21 Tennessee DOT Two-Lift Concrete Pavement Construction Project April 2015
i
TABLE OF CONTENTS
Introduction ................................................................................................................... 1
Project Overview ........................................................................................................... 1
Mix Design ..................................................................................................................... 2
Pavement Design Considerations ............................................................................... 3
Construction Process ................................................................................................... 3
Mix Production .......................................................................................................... 3
Subgrade Preparation ............................................................................................... 4
Base Placement........................................................................................................ 5
Dowel Bar Basket and Tie Bar Placement ................................................................ 5
Concrete Paving ....................................................................................................... 6
Curing and Joint Sawing ........................................................................................... 8
Weather Conditions ................................................................................................ 10
Paving Operations .................................................................................................. 10
Testing ......................................................................................................................... 13
Summary ...................................................................................................................... 21
References ................................................................................................................... 22
Appendix A – SHRP2 R21 Application ...................................................................... 23
Appendix B – TDOT Implementation Plan ................................................................. 27
Appendix C – Change Order Documents .................................................................. 31
Appendix D – Contract Special Provision ................................................................. 33
Appendix E – Construction Photos ........................................................................... 37
Appendix F – FHWA Mobile Lab Summary Report .................................................. 67

Implementation Support for SHRP2 Project R21 April 2015 Tennessee DOT Two-Lift Concrete Pavement Construction Project
ii
LIST OF FIGURES Figure 1. Project location. ........................................................................................................... 2 Figure 2. Two-lift concrete composite shoulder pavement cross-section................................... 3 Figure 3. Mix production facilities. ............................................................................................ 4 Figure 4. Dowel bar basket placement. ....................................................................................... 5 Figure 5. Tie bar placement. ....................................................................................................... 6 Figure 6. Dowel bar and tie bar configuration. ........................................................................... 6 Figure 7. Placement of bottom lift. ............................................................................................. 7 Figure 8. Placement of top lift. ................................................................................................... 8 Figure 9. Finishing top lift. ......................................................................................................... 9 Figure 10. Applying curing compound. ........................................................................................ 9 Figure 11. Transverse joint and saw. .......................................................................................... 10 Figure 12. Edge slump and “blowouts.” ..................................................................................... 11 Figure 13. Over watering of concrete surface. ............................................................................ 12 Figure 14. Thin bottom lift. ........................................................................................................ 12 Figure 15. Field testing. .............................................................................................................. 13 Figure 16. Test apparatus for modulus of elasticity and Poisson’s ratio. ................................... 15 Figure 17. Example test apparatus for CTE. ............................................................................... 16 Figure 18. Example air void test equipment. .............................................................................. 17 Figure 19. Semi-Adiabatic calorimeter. ...................................................................................... 18 Figure 20. Heat signature curves. ............................................................................................... 18 Figure 21. SR meter. ................................................................................................................... 19 Figure 22. SR meter test results. ................................................................................................. 19 Figure 23. MIT Scan 2-BT ......................................................................................................... 20 Figure 24. MIT Scan T2 ............................................................................................................. 20
LIST OF TABLES Table 1. Mix design. ...................................................................................................................... 2 Table 2. Concrete mixture test results. ......................................................................................... 14 Table 3. Fresh concrete properties. .............................................................................................. 14 Table 4. Compressive strength testing results. ............................................................................. 15 Table 5. Modulus of elasticity and Poisson’s ratio test results. ................................................... 16 Table 6. SAM test results. ............................................................................................................ 17

Implementation Support for SHRP2 Project R21 Tennessee DOT Two-Lift Concrete Pavement Construction Project April 2015
1
Introduction
The Strategic Highway Research Program 2 (SHRP2) R21 project, Composite Pavement Systems, focused on the design and construction of sustainable, renewable composite pavements using either a hot-mix asphalt (HMA) or portland cement concrete (PCC) wearing course over a structural concrete layer (i.e., HMA/PCC or PCC/PCC). These composite pavement systems are promising technologies for providing sustainable roadways that can be constructed rapidly and rehabilitated with minimal disruption to the traveling public. Under a SHRP2 implementation project, the Federal Highway Administration (FHWA) Task Order is seeking to provide deployment support through the following project tasks:
Provide technical assistance―Respond to State Highway Agency (SHA) questions for planning, designing, and constructing new composite pavement systems.
Conduct a showcase―Develop and provide a multi-state showcase that demonstrates new composite pavement projects of national interest.
Conduct workshops―Develop and deliver workshop/training materials for the design and construction of new composite pavements.
Conduct a peer exchange―Organize and facilitate a multi-state peer exchange to share knowledge for implementing new composite pavement systems.
Documentation of results―Document lessons learned and specification revisions obtained from the technical assistance efforts, showcase, workshops, and peer exchange.
Outreach and marketing―Support awareness of the new composite pavement systems through presentations at national events and by developing marketing products.
The SHRP2 Implementation Assistance Program is designed to foster sharing of experience and lessons learned between highway agencies with the implementation of SHRP2 products. As part of the SHRP2 Solution (Round 4) effort, the Tennessee Department of Transportation (TDOT) expressed interest in the construction of a two-lift (wet-on-wet) concrete composite pavement. TDOT’s interest in the two-lift concrete pavement includes determining the viability of constructing a more cost-competitive concrete pavement, and based on a recent specification change, to move towards the use of more high-quality aggregates. TDOT integrated the construction of the two-lift concrete composite pavement into an existing full-depth concrete replacement project. As noted in the SHRP2 R21 application, TDOT will also conduct a cost evaluation of the use of polish-resistant aggregate in the full-depth concrete pavement compared to using polish-resistant aggregate only in the top lift of the two-lift concrete composite pavement. The TDOT SHRP2 R21application and the implementation plan are shown in Appendices A and B, respectively. This report documents the construction of a two-lift concrete composite pavement by the TDOT on October 21 – 22, 2014. Project Overview
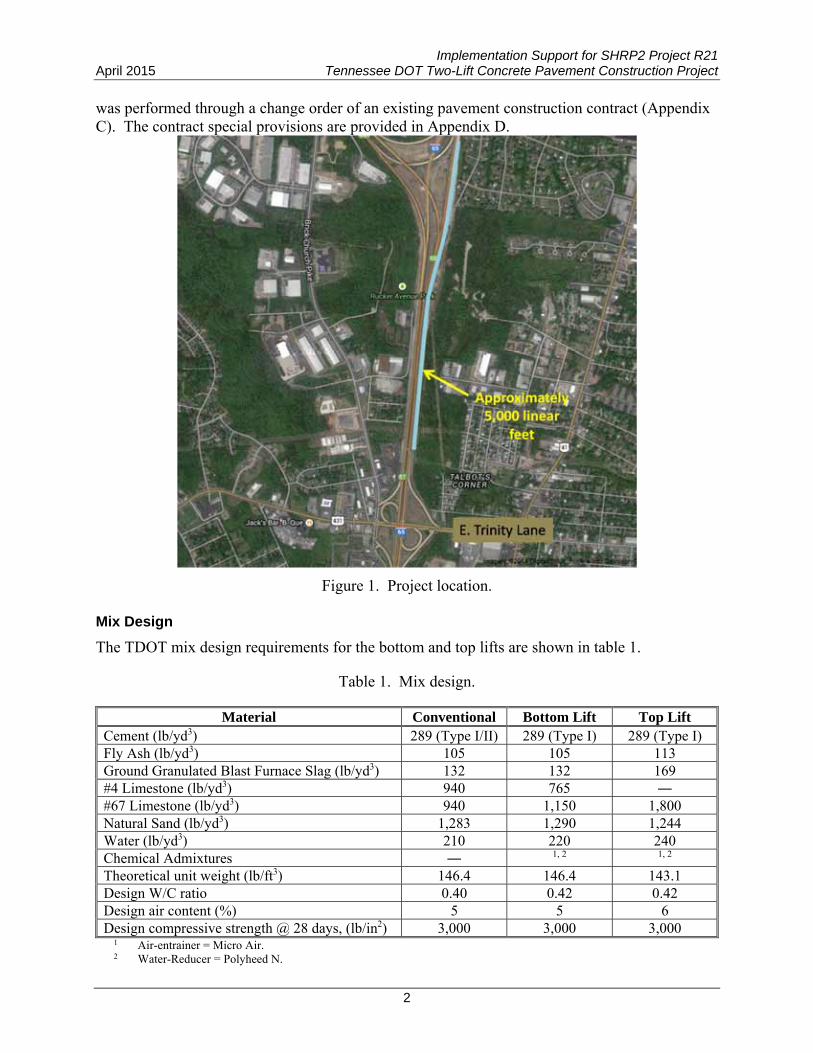
The two-lift pavement was constructed as a part of the 10-foot outside shoulder in the northbound lanes of Interstate 65 just north of downtown Nashville, Tennessee (see figure 1). Placement included approximately 5,000 lineal feet of two-lift concrete pavement. The work
Implementation Support for SHRP2 Project R21 April 2015 Tennessee DOT Two-Lift Concrete Pavement Construction Project
2
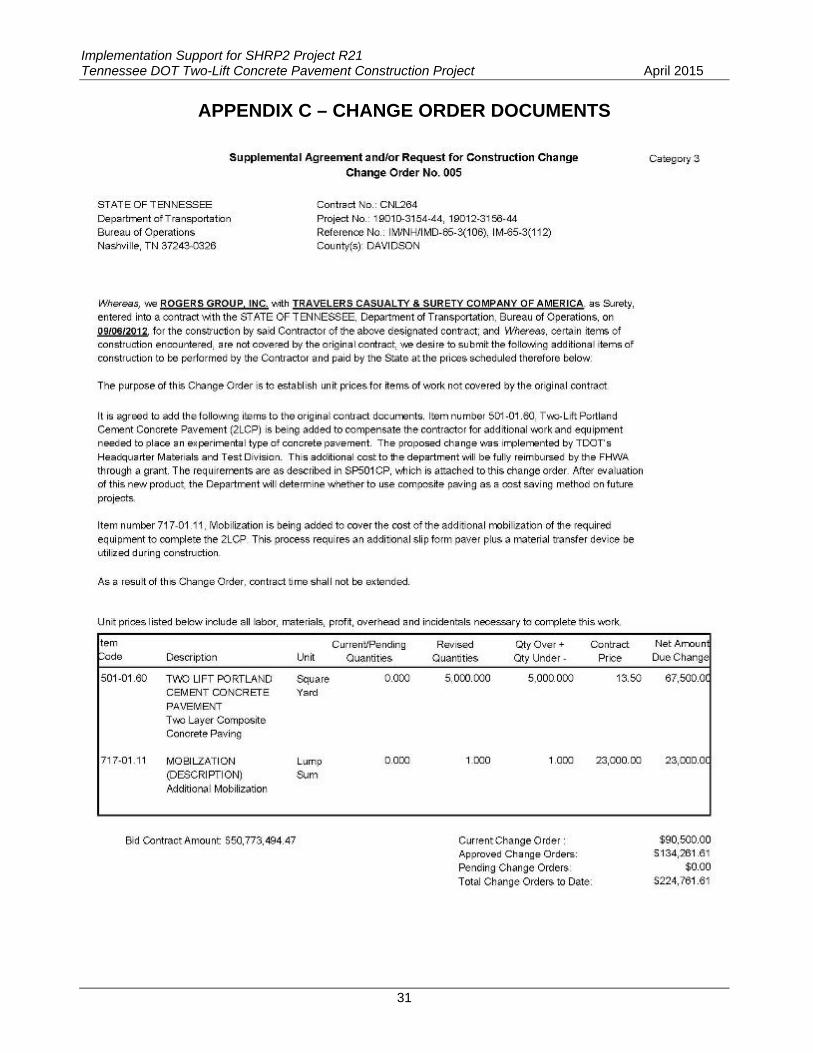
was performed through a change order of an existing pavement construction contract (AppendixC). The contract special provisions are provided in Appendix D.
Figure 1. Project location. Mix Design
The TDOT mix design requirements for the bottom and top lifts are shown in table 1.
Table 1. Mix design.
Material Conventional Bottom Lift Top Lift Cement (lb/yd3) 289 (Type I/II) 289 (Type I) 289 (Type I) Fly Ash (lb/yd3) 105 105 113Ground Granulated Blast Furnace Slag (lb/yd3) 132 132 169#4 Limestone (lb/yd3) 940 765 ― #67 Limestone (lb/yd3) 940 1,150 1,800Natural Sand (lb/yd3) 1,283 1,290 1,244Water (lb/yd3) 210 220 240Chemical Admixtures ― 1, 2 1, 2
Theoretical unit weight (lb/ft3) 146.4 146.4 143.1Design W/C ratio 0.40 0.42 0.42 Design air content (%) 5 5 6 Design compressive strength @ 28 days, (lb/in2) 3,000 3,000 3,000
1 2
Air-entrainer = Micro Air. Water-Reducer = Polyheed N.
Implementation Support for SHRP2 Project R21 Tennessee DOT Two-Lift Concrete Pavement Construction Project April 2015
3
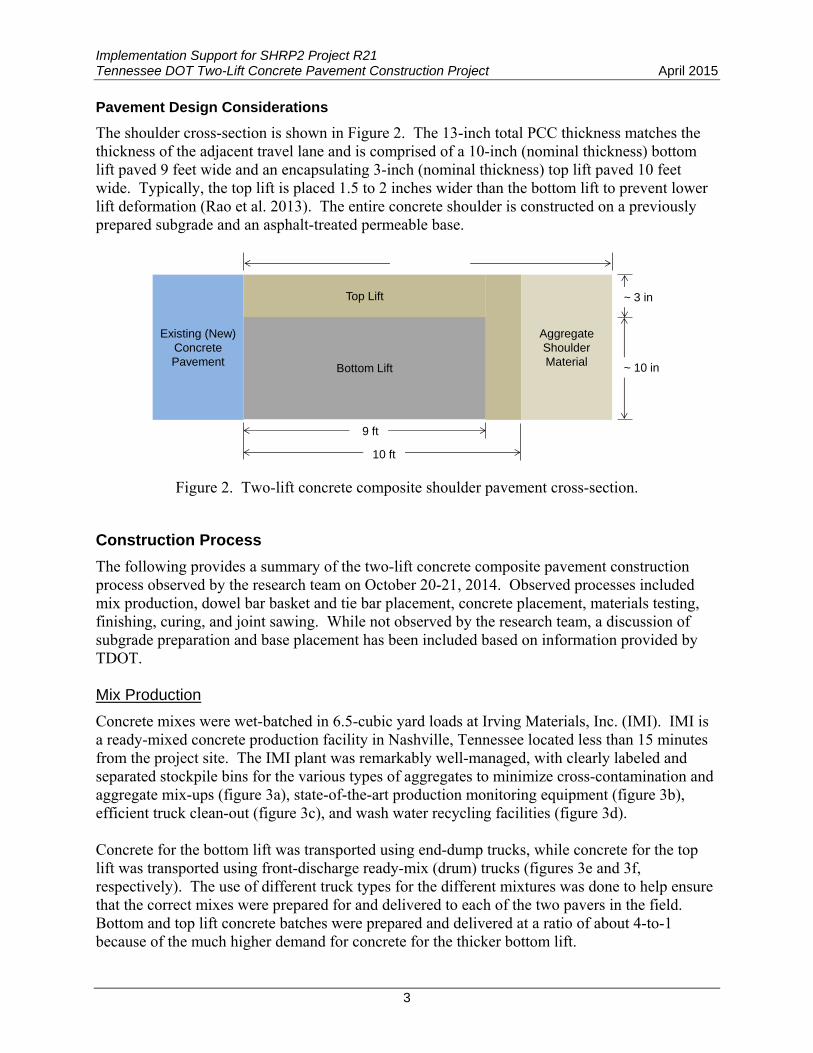
Pavement Design Considerations
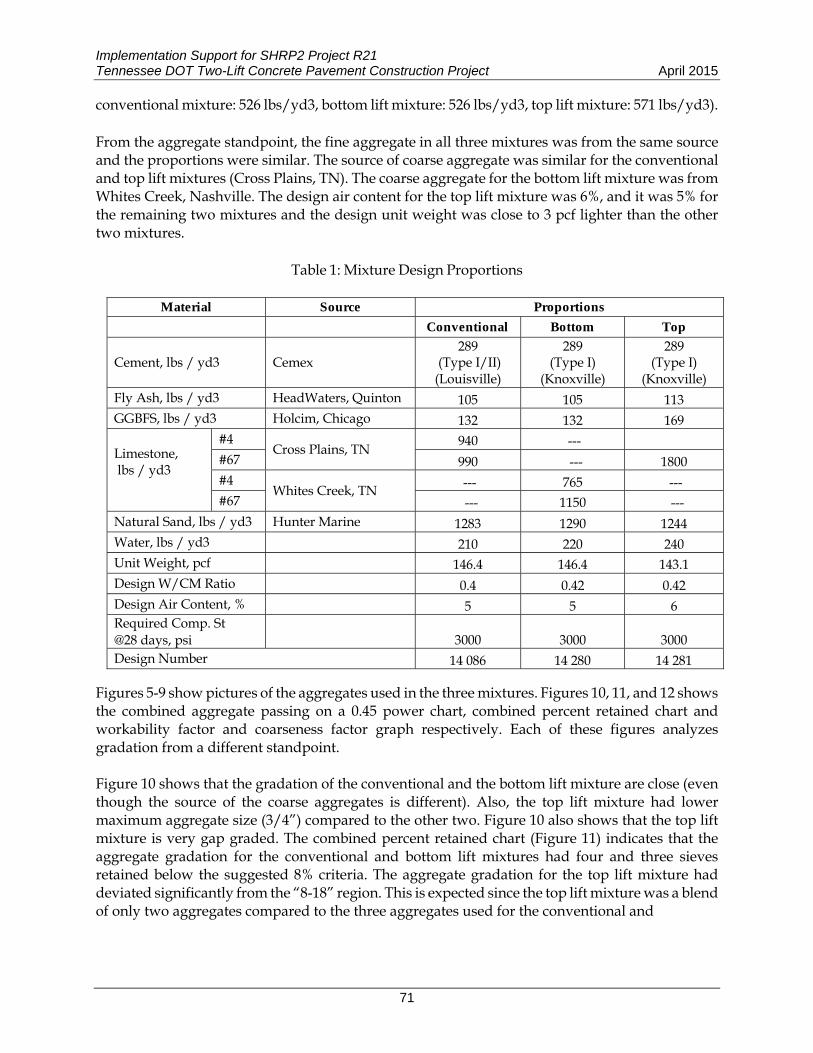
The shoulder cross-section is shown in Figure 2. The 13-inch total PCC thickness matches the thickness of the adjacent travel lane and is comprised of a 10-inch (nominal thickness) bottom lift paved 9 feet wide and an encapsulating 3-inch (nominal thickness) top lift paved 10 feet wide. Typically, the top lift is placed 1.5 to 2 inches wider than the bottom lift to prevent lower lift deformation (Rao et al. 2013). The entire concrete shoulder is constructed on a previously prepared subgrade and an asphalt-treated permeable base.
Figure 2. Two-lift concrete composite shoulder pavement cross-section.
Existing (New) Concrete Pavement Bottom Lift
Top Lift
Aggregate ShoulderMaterial
10 ft
9 ft
~ 3 in
~ 10 in
Shoulder
Construction Process
The following provides a summary of the two-lift concrete composite pavement construction process observed by the research team on October 20-21, 2014. Observed processes included mix production, dowel bar basket and tie bar placement, concrete placement, materials testing, finishing, curing, and joint sawing. While not observed by the research team, a discussion of subgrade preparation and base placement has been included based on information provided by TDOT. Mix Production
Concrete mixes were wet-batched in 6.5-cubic yard loads at Irving Materials, Inc. (IMI). IMI is a ready-mixed concrete production facility in Nashville, Tennessee located less than 15 minutes from the project site. The IMI plant was remarkably well-managed, with clearly labeled and separated stockpile bins for the various types of aggregates to minimize cross-contamination and aggregate mix-ups (figure 3a), state-of-the-art production monitoring equipment (figure 3b), efficient truck clean-out (figure 3c), and wash water recycling facilities (figure 3d). Concrete for the bottom lift was transported using end-dump trucks, while concrete for the top lift was transported using front-discharge ready-mix (drum) trucks (figures 3e and 3f, respectively). The use of different truck types for the different mixtures was done to help ensure that the correct mixes were prepared for and delivered to each of the two pavers in the field. Bottom and top lift concrete batches were prepared and delivered at a ratio of about 4-to-1 because of the much higher demand for concrete for the thicker bottom lift.

Implementation Support for SHRP2 Project R21 April 2015 Tennessee DOT Two-Lift Concrete Pavement Construction Project
4
a. Labeled and separated aggregate bins. b. Production monitoring equipment.
c. Truck clean-out. d. Wash water recycling facilities.
e. Dump trucks (bottom lift). f. Front-discharge dump trucks (top lift).
Figure 3. Mix production facilities.
Subgrade Preparation
Subgrade preparation was conducted in accordance with Item 207, Subgrade Construction and Preparation. This specification outlines requirements for preparation (excavation and

Implementation Support for SHRP2 Project R21 Tennessee DOT Two-Lift Concrete Pavement Construction Project April 2015
5
undercutting), compaction (to 100 percent of maximum density), drainage and protection, and checking lines, cross-sections, and grades of the subgrade, as well as methods for disposal of excess or unsuitable materials. Base Placement
Once subgrade preparation was complete, placement of 6 to 10 inches of mineral aggregate base (Item 303-01, Mineral Aggregate, Type A Base, Grade D) was performed in accordance with the contract plans. Following placement of the aggregate base, 4 inches of asphalt-treated permeable base material (Item 313-03, Treated Permeable Base) was placed in accordance with the Standard Specifications. There are no compaction requirements for the asphalt-treated permeable base in the Standard Specifications, nor was any supplied on the contract plans. Dowel Bar Basket and Tie Bar Placement
The shoulder is transversely jointed at 15-foot intervals to match the joint spacing of the adjacent travel lane. Load transfer is provided by 1.5-inch epoxy-coated cylindrical steel dowels on 12-inch centers that were mounted in baskets that provided a mid-depth dowel placement in the 13-inch shoulder pavement. Since the dowel baskets cannot extend beyond the width of the bottom lift placement, there are no dowels in outer 1.5 feet of the concrete shoulder. It appears that the assembled baskets were dipped in epoxy for corrosion protection. Dowel baskets were anchored to the base, with the first dowel being located 3 to 6 inches from the adjacent travel lane joint (see figure 4a). A bond breaker was applied on one-half of each dowel, alternating ends across the basket length (see figure 4b).
a. Dowel bar basket anchors. b. Bond breaker on opposite dowel bar ends.
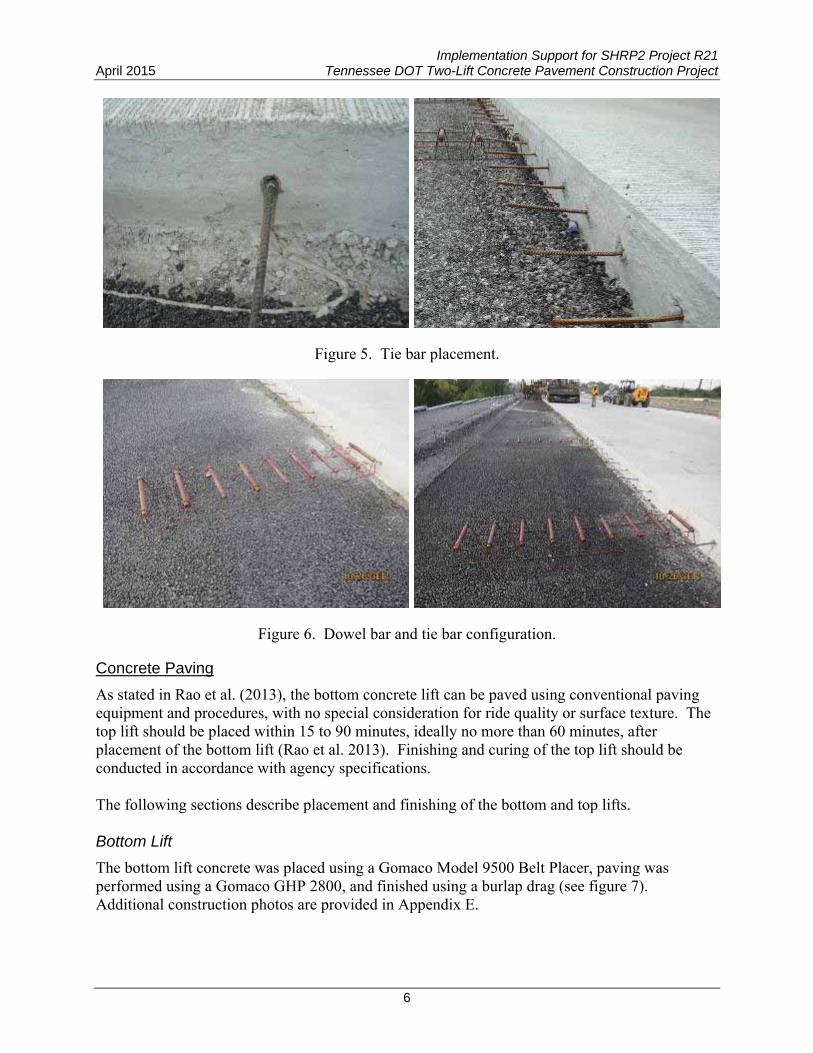
Figure 4. Dowel bar basket placement. Tie bars were drilled and anchored into the adjacent concrete using No. 5 deformed bars (see figure 5). Figure 6 illustrates the configuration of the dowel bar baskets and tie bars.
Implementation Support for SHRP2 Project R21 April 2015 Tennessee DOT Two-Lift Concrete Pavement Construction Project
6
Figure 5. Tie bar placement.
Figure 6. Dowel bar and tie bar configuration.
Concrete Paving
As stated in Rao et al. (2013), the bottom concrete lift can be paved using conventional paving equipment and procedures, with no special consideration for ride quality or surface texture. The top lift should be placed within 15 to 90 minutes, ideally no more than 60 minutes, after placement of the bottom lift (Rao et al. 2013). Finishing and curing of the top lift should be conducted in accordance with agency specifications. The following sections describe placement and finishing of the bottom and top lifts. Bottom Lift
The bottom lift concrete was placed using a Gomaco Model 9500 Belt Placer, paving was performed using a Gomaco GHP 2800, and finished using a burlap drag (see figure 7). Additional construction photos are provided in Appendix E.

Implementation Support for SHRP2 Project R21 Tennessee DOT Two-Lift Concrete Pavement Construction Project April 2015
7
a. Mix delivery. b. Mix delivery close-up.
c. Mix placement. d. Mix placement and paver.
e. Drag finish. f. Drag finish close-up.
Figure 7. Placement of bottom lift. Top Lift
The top lift concrete was placed immediately after the placement of the bottom lift using the discharge chute from the various front-discharge ready-mix trucks, and the top lift paver was a
Implementation Support for SHRP2 Project R21 April 2015 Tennessee DOT Two-Lift Concrete Pavement Construction Project
8
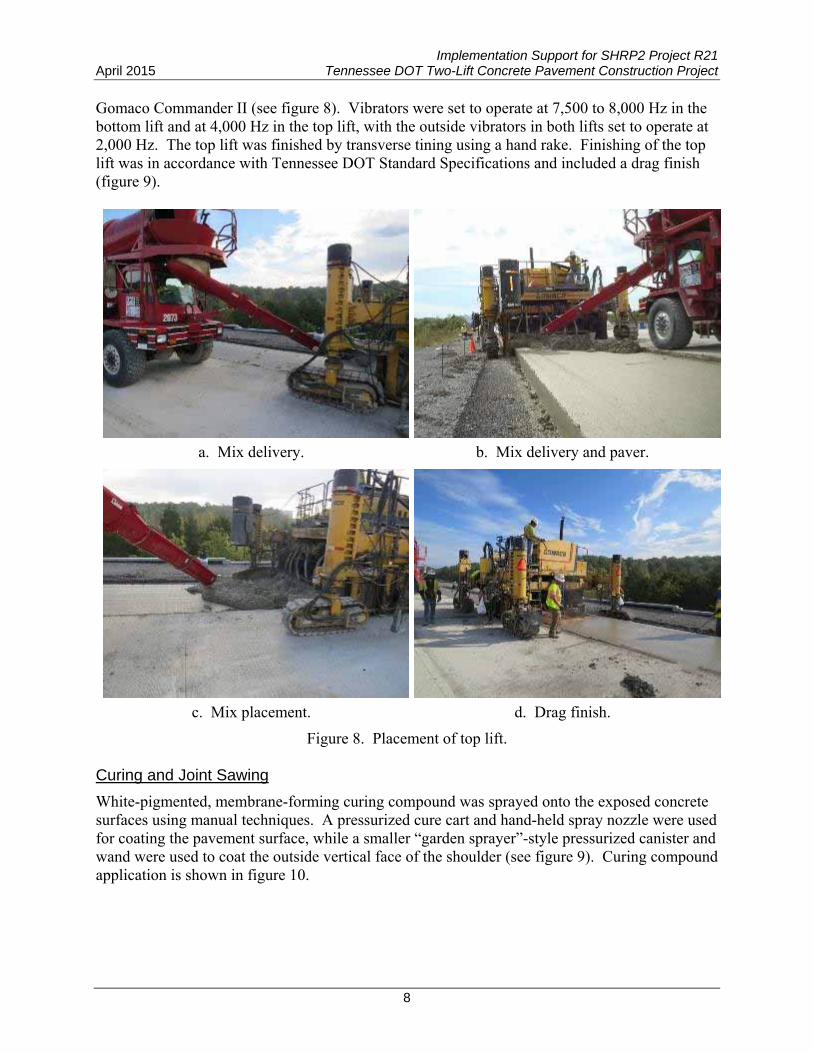
Gomaco Commander II (see figure 8). Vibrators were set to operate at 7,500 to 8,000 Hz in the bottom lift and at 4,000 Hz in the top lift, with the outside vibrators in both lifts set to operate at 2,000 Hz. The top lift was finished by transverse tining using a hand rake. Finishing of the top lift was in accordance with Tennessee DOT Standard Specifications and included a drag finish (figure 9).
a. Mix delivery. b. Mix delivery and paver.
c. Mix placement. d. Drag finish.
Figure 8. Placement of top lift. Curing and Joint Sawing
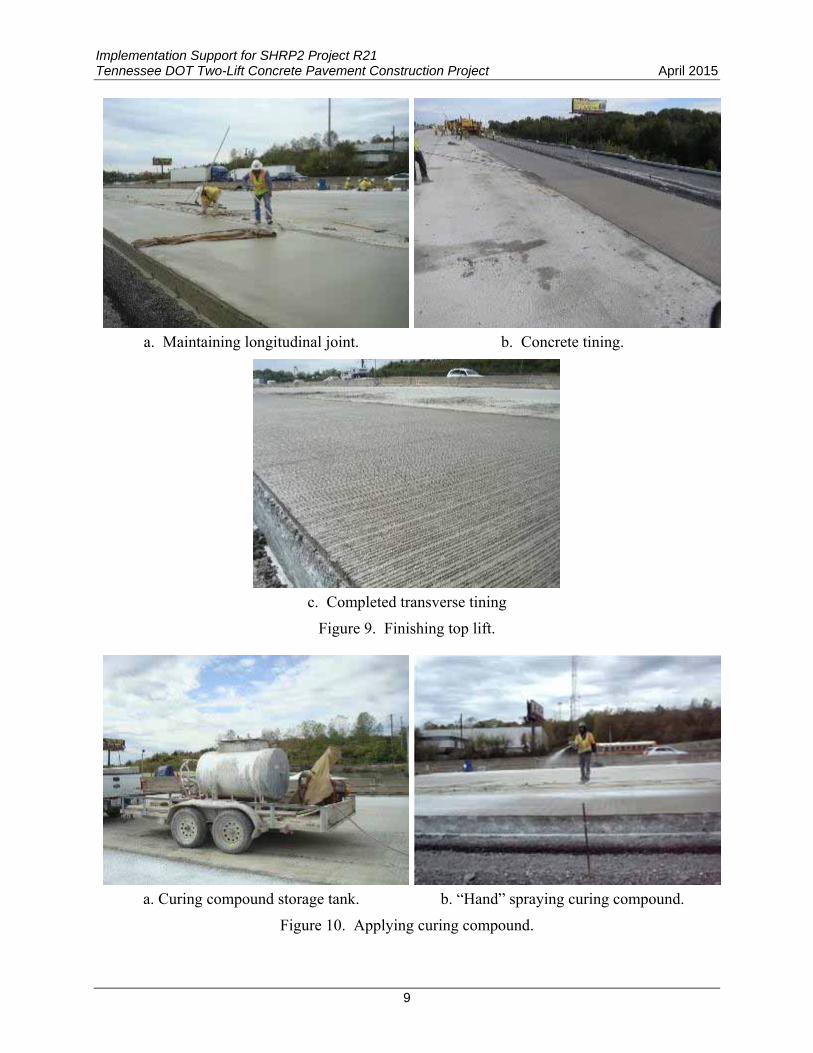
White-pigmented, membrane-forming curing compound was sprayed onto the exposed concrete surfaces using manual techniques. A pressurized cure cart and hand-held spray nozzle were used for coating the pavement surface, while a smaller “garden sprayer”-style pressurized canister and wand were used to coat the outside vertical face of the shoulder (see figure 9). Curing compound application is shown in figure 10.
Implementation Support for SHRP2 Project R21 Tennessee DOT Two-Lift Concrete Pavement Construction Project April 2015
9
a. Maintaining longitudinal joint. b. Concrete tining.
c. Completed transverse tining
Figure 9. Finishing top lift.
a. Curing compound storage tank. b. “Hand” spraying curing compound.
Figure 10. Applying curing compound.
Implementation Support for SHRP2 Project R21 April 2015 Tennessee DOT Two-Lift Concrete Pavement Construction Project
10
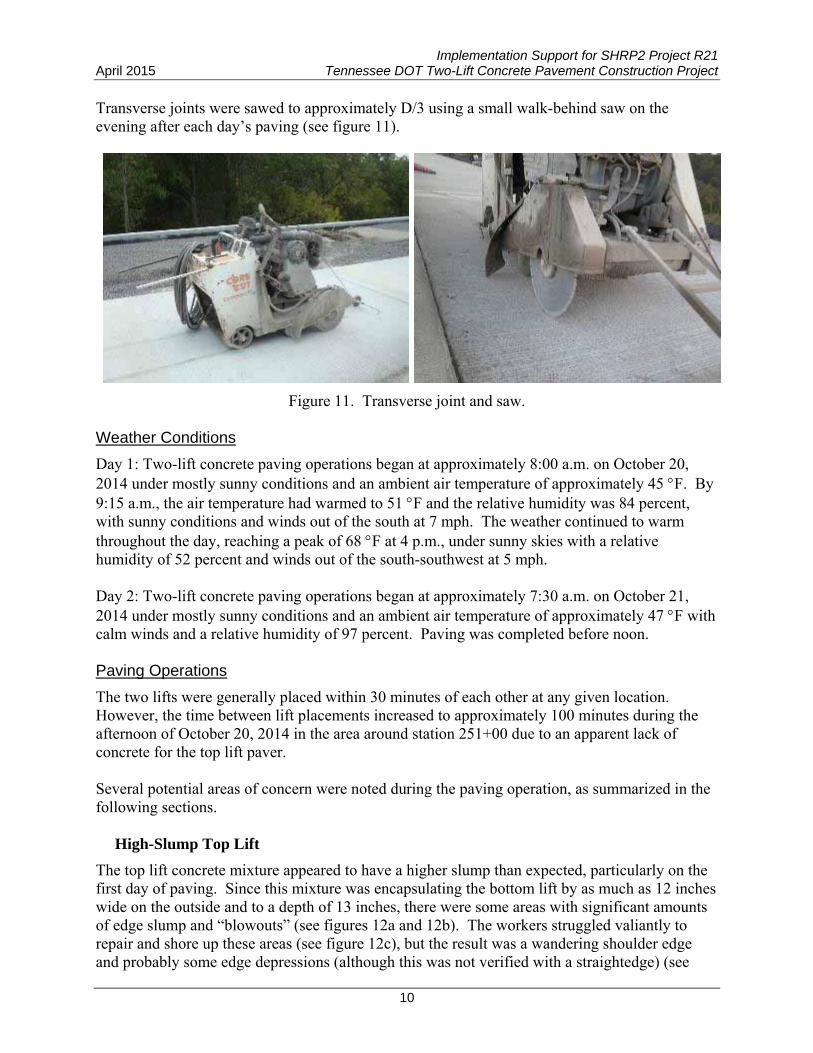
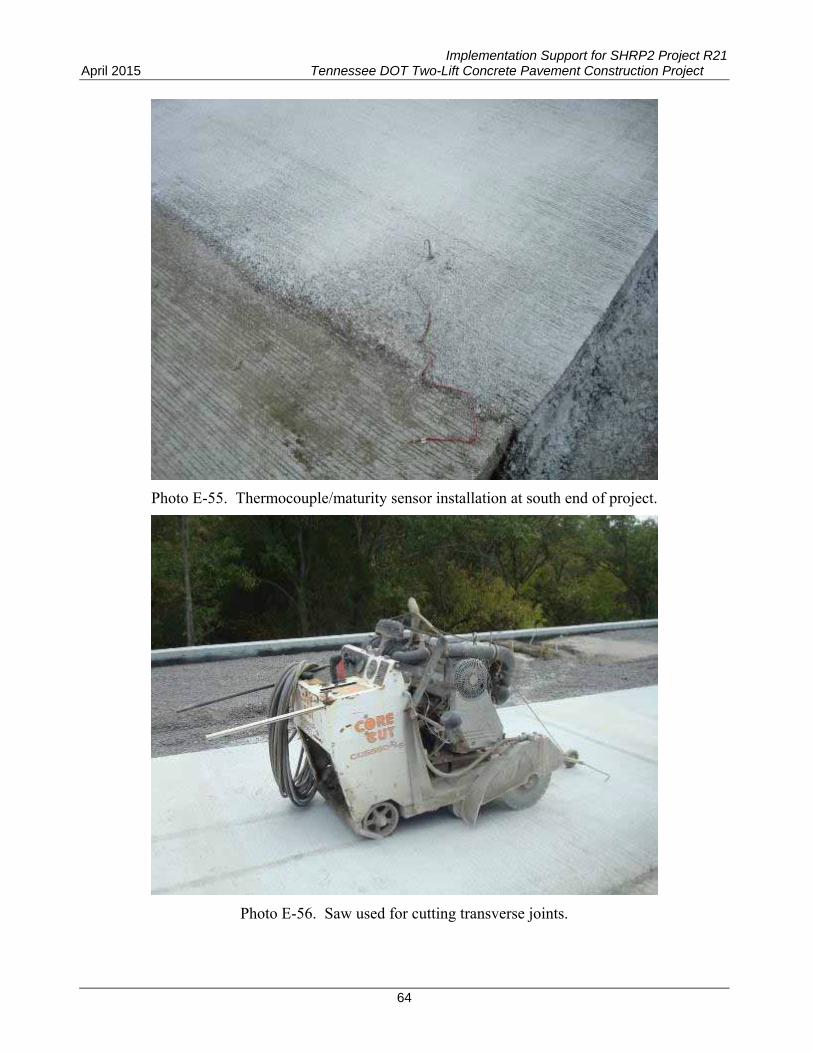
Transverse joints were sawed to approximately D/3 using a small walk-behind saw on the evening after each day’s paving (see figure 11).
Figure 11. Transverse joint and saw. Weather Conditions
Day 1: Two-lift concrete paving operations began at approximately 8:00 a.m. on October 20, 2014 under mostly sunny conditions and an ambient air temperature of approximately 45 F. By 9:15 a.m., the air temperature had warmed to 51 F and the relative humidity was 84 percent, with sunny conditions and winds out of the south at 7 mph. The weather continued to warm throughout the day, reaching a peak of 68 F at 4 p.m., under sunny skies with a relative humidity of 52 percent and winds out of the south-southwest at 5 mph. Day 2: Two-lift concrete paving operations began at approximately 7:30 a.m. on October 21, 2014 under mostly sunny conditions and an ambient air temperature of approximately 47 F with calm winds and a relative humidity of 97 percent. Paving was completed before noon. Paving Operations
The two lifts were generally placed within 30 minutes of each other at any given location. However, the time between lift placements increased to approximately 100 minutes during the afternoon of October 20, 2014 in the area around station 251+00 due to an apparent lack of concrete for the top lift paver. Several potential areas of concern were noted during the paving operation, as summarized in the following sections.
High-Slump Top Lift
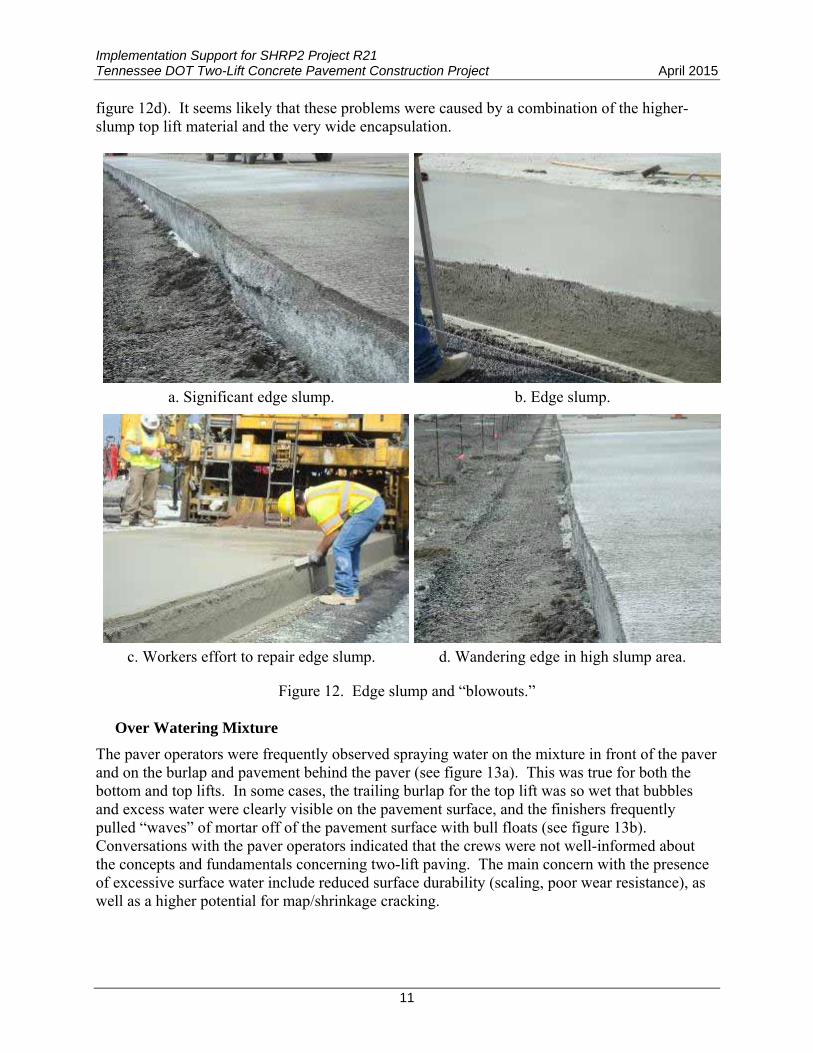
The top lift concrete mixture appeared to have a higher slump than expected, particularly on the first day of paving. Since this mixture was encapsulating the bottom lift by as much as 12 inches wide on the outside and to a depth of 13 inches, there were some areas with significant amounts of edge slump and “blowouts” (see figures 12a and 12b). The workers struggled valiantly to repair and shore up these areas (see figure 12c), but the result was a wandering shoulder edge and probably some edge depressions (although this was not verified with a straightedge) (see
Implementation Support for SHRP2 Project R21 Tennessee DOT Two-Lift Concrete Pavement Construction Project April 2015
11
figure 12d). It seems likely that these problems were caused by a combination of the higher-slump top lift material and the very wide encapsulation.
a. Significant edge slump. b. Edge slump.
c. Workers effort to repair edge slump. d. Wandering edge in high slump area.
Figure 12. Edge slump and “blowouts.”
Over Watering Mixture
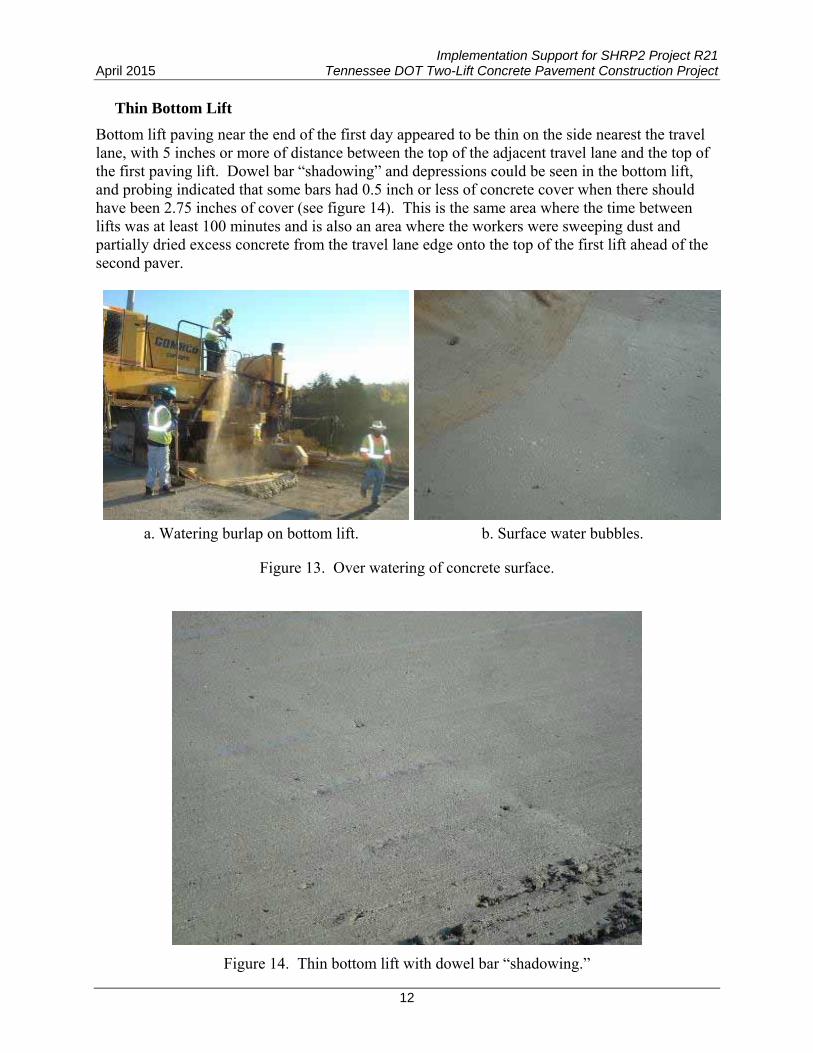
The paver operators were frequently observed spraying water on the mixture in front of the paver and on the burlap and pavement behind the paver (see figure 13a). This was true for both the bottom and top lifts. In some cases, the trailing burlap for the top lift was so wet that bubbles and excess water were clearly visible on the pavement surface, and the finishers frequently pulled “waves” of mortar off of the pavement surface with bull floats (see figure 13b). Conversations with the paver operators indicated that the crews were not well-informed about the concepts and fundamentals concerning two-lift paving. The main concern with the presence of excessive surface water include reduced surface durability (scaling, poor wear resistance), as well as a higher potential for map/shrinkage cracking.
Implementation Support for SHRP2 Project R21 April 2015 Tennessee DOT Two-Lift Concrete Pavement Construction Project
12
Thin Bottom Lift
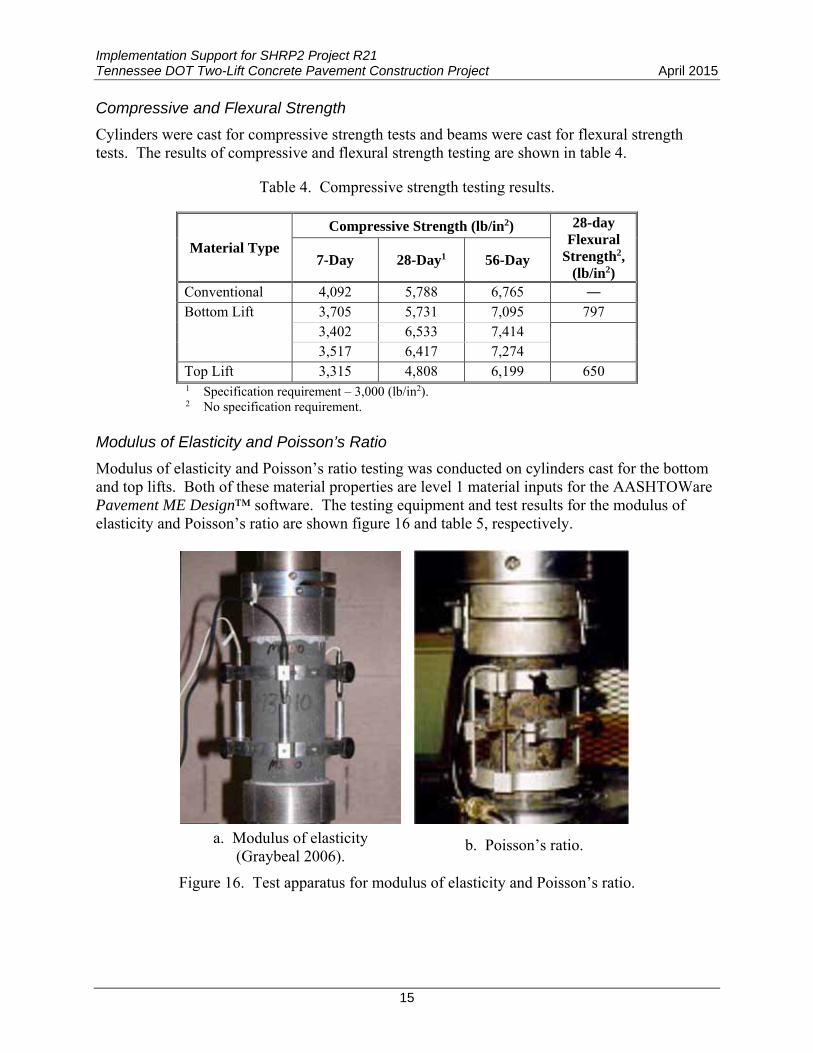
Bottom lift paving near the end of the first day appeared to be thin on the side nearest the travel lane, with 5 inches or more of distance between the top of the adjacent travel lane and the top of the first paving lift. Dowel bar “shadowing” and depressions could be seen in the bottom lift, and probing indicated that some bars had 0.5 inch or less of concrete cover when there should have been 2.75 inches of cover (see figure 14). This is the same area where the time between lifts was at least 100 minutes and is also an area where the workers were sweeping dust and partially dried excess concrete from the travel lane edge onto the top of the first lift ahead of the second paver.
a. Watering burlap on bottom lift. b. Surface water bubbles.
Figure 13. Over watering of concrete surface.
Figure 14. Thin bottom lift with dowel bar “shadowing.”

Implementation Support for SHRP2 Project R21 Tennessee DOT Two-Lift Concrete Pavement Construction Project April 2015
13
Testing
Concrete material testing was conducted during placement of both the bottom and top lifts. Testing included slump, air, beams for flexural strength, and cylinders for compressive strength (see figure 15). A summary of TDOT’s field test results are provided in table 2.
a. Mixture sampling. b. Sample preparation.
c. Slump test. d. Cylinder preparation.
e. Air test (Super-Air Meter [left] and Standard Volumetric Air Meter [right]).
f. Beam preparation.
Figure 15. Field testing.

Implementation Support for SHRP2 Project R21 April 2015 Tennessee DOT Two-Lift Concrete Pavement Construction Project
14
Table 2. TDOT’s concrete mixture test results.
Date
Bottom Lift Top Lift
Slump (in)
Temp (°F)1
Air (%)
Compressive Strength
(psi)2
Slump (in)
Temp (°F)1
Air (%)
Compressive Strength
(psi)2
Specification < 3 < 90/ 50-85
53 > 3,000 < 3 < 90/ 50-85
63 > 3,000
10/17/2014 1.00 57/68 4.1 5,230 2.25 70/78 4.6 5,260 10/18/2014 1.00 65/68 4.9 6,215 1.50 57/52 4.6 6,250 10/20/2014 1.50 57/51 4.4 6,455 1.50 60/75 5.0 5,265 10/20/2014 1.00 68/67 5.1 5,680 ― ― ― ― 10/21/2014 1.00 58/65 4.5 6,585 1.25 60/70 6.1 4,920 1 Ambient air temperature/concrete temperature. 2 28-day compressive strength. 3 Design air content; 3 to 8 percent is allowed during production.
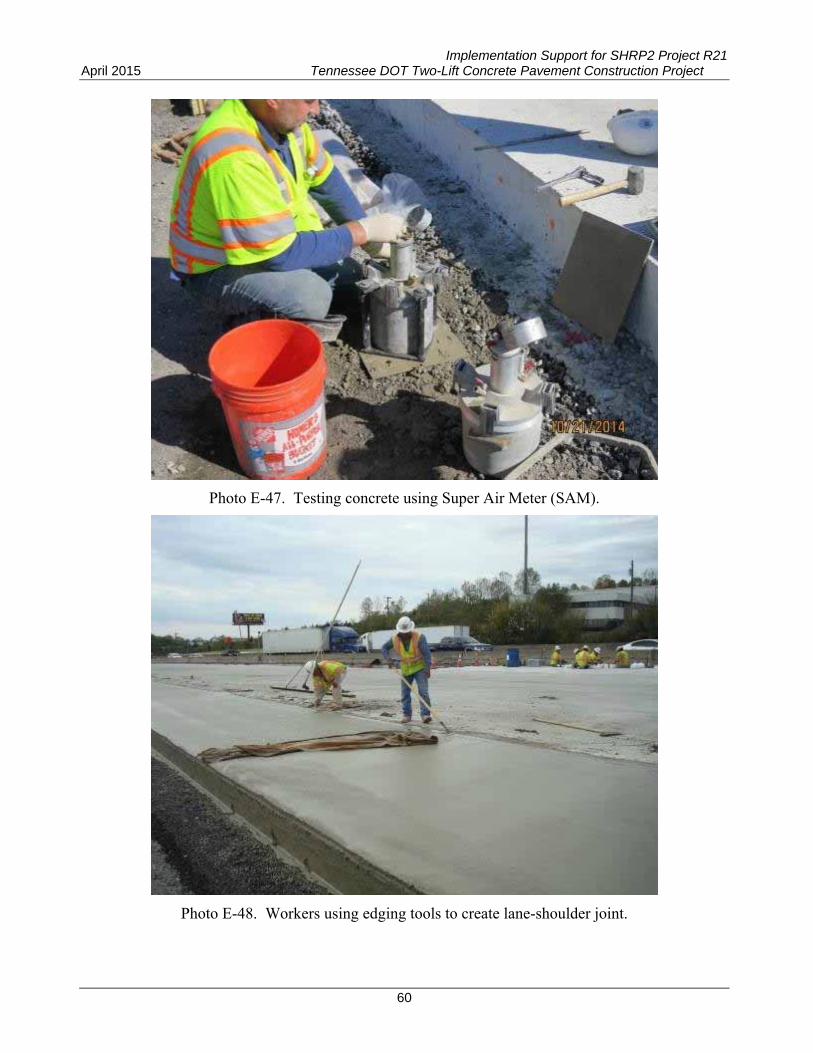
The FHWA Mobile Concrete Laboratory (MCL) was on site during placement of the two-lift concrete test section, as well as for placement of the adjacent conventional concrete shoulder. A detailed report on the MCL testing activities and results is provided in Appendix F, with an extraction of critical items from that report presented in the following sections. Fresh Concrete Properties
Table 3 provides a summary of conventional, bottom-, and top-lift fresh concrete properties. Test results, excluding two air content tests, indicated conformance with TDOT requirements.
Table 3. Fresh concrete properties.
Material Type Slump (inch)
Concrete Temperature (°F)
Unit Weight (lb/ft3)
Air content (percent)
Specification < 3 < 90 NA 4 – 8 Conventional 0.50 75 145.8 3.9
1.50 75 144.8 4.31.50 75 145.6 4.3
Bottom Lift 0.25 63 148.7 4.3 0.25 69 148.8 3.9 1.00 69 148.2 4.90.75 64 146.3 5.01.00 67 147.1 5.11.50 66 145.8 5.10.75 64 148.0 5.10.75 64 147.6 4.7
Top Lift 3.00 68 143.8 4.9 2.50 73 143.9 4.93.00 69 144.6 5.22.50 75 143.4 5.12.00 72 143.1 4.9
Note: shaded cells indicate test results that do not meet specification requirements.
Implementation Support for SHRP2 Project R21 Tennessee DOT Two-Lift Concrete Pavement Construction Project April 2015
15
Compressive and Flexural Strength
Cylinders were cast for compressive strength tests and beams were cast for flexural strength tests. The results of compressive and flexural strength testing are shown in table 4.
Table 4. Compressive strength testing results.
Material Type
Compressive Strength (lb/in2) 28-day Flexural
Strength2, (lb/in2)
7-Day 28-Day1 56-Day
Conventional 4,092 5,788 6,765 ― Bottom Lift 3,705 5,731 7,095 797
3,402 6,533 7,414 3,517 6,417 7,274
Top Lift 3,315 4,808 6,199 650 1 2
Specification requirement – 3,000 (lb/in2). No specification requirement.
Modulus of Elasticity and Poisson’s Ratio
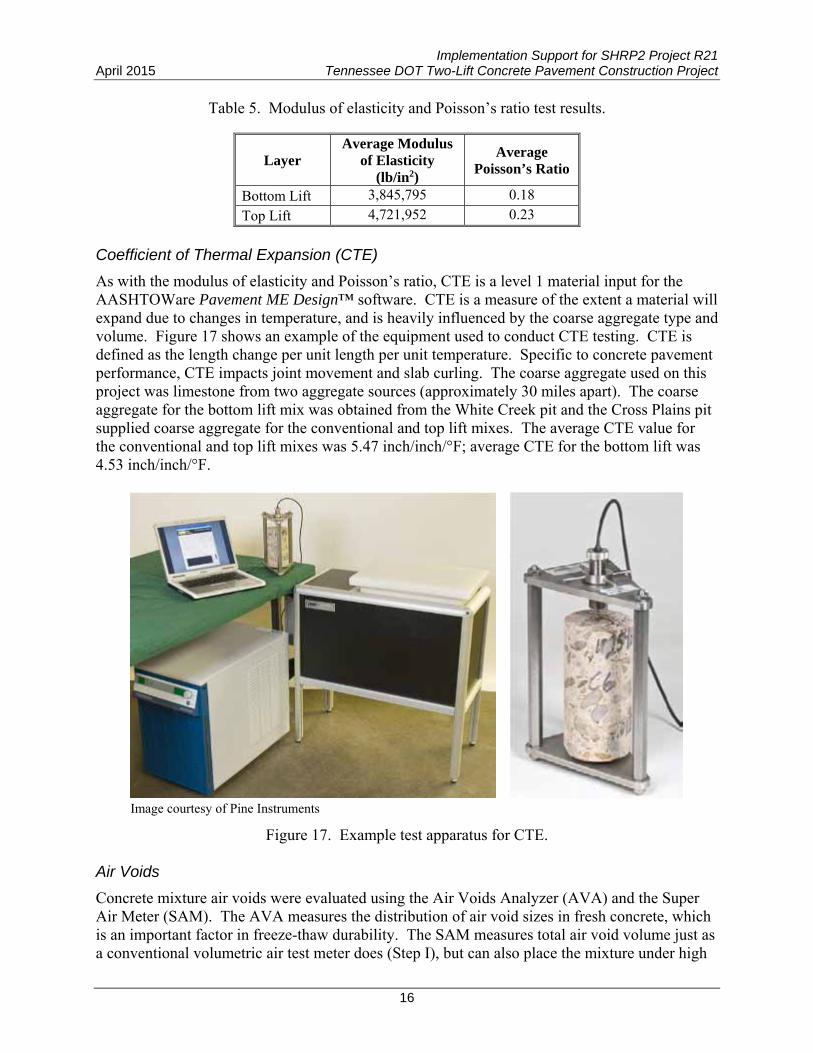
Modulus of elasticity and Poisson’s ratio testing was conducted on cylinders cast for the bottom and top lifts. Both of these material properties are level 1 material inputs for the AASHTOWare Pavement ME Design™ software. The testing equipment and test results for the modulus of elasticity and Poisson’s ratio are shown figure 16 and table 5, respectively.
b. Poisson’s ratio. a. Modulus of elasticity (Graybeal 2006).
Figure 16. Test apparatus for modulus of elasticity and Poisson’s ratio.
Implementation Support for SHRP2 Project R21 April 2015 Tennessee DOT Two-Lift Concrete Pavement Construction Project
16
Table 5. Modulus of elasticity and Poisson’s ratio test results.
Layer Average Modulus
of Elasticity (lb/in2)
Average Poisson’s Ratio
Bottom Lift 3,845,795 0.18
Top Lift 4,721,952 0.23
Coefficient of Thermal Expansion (CTE)
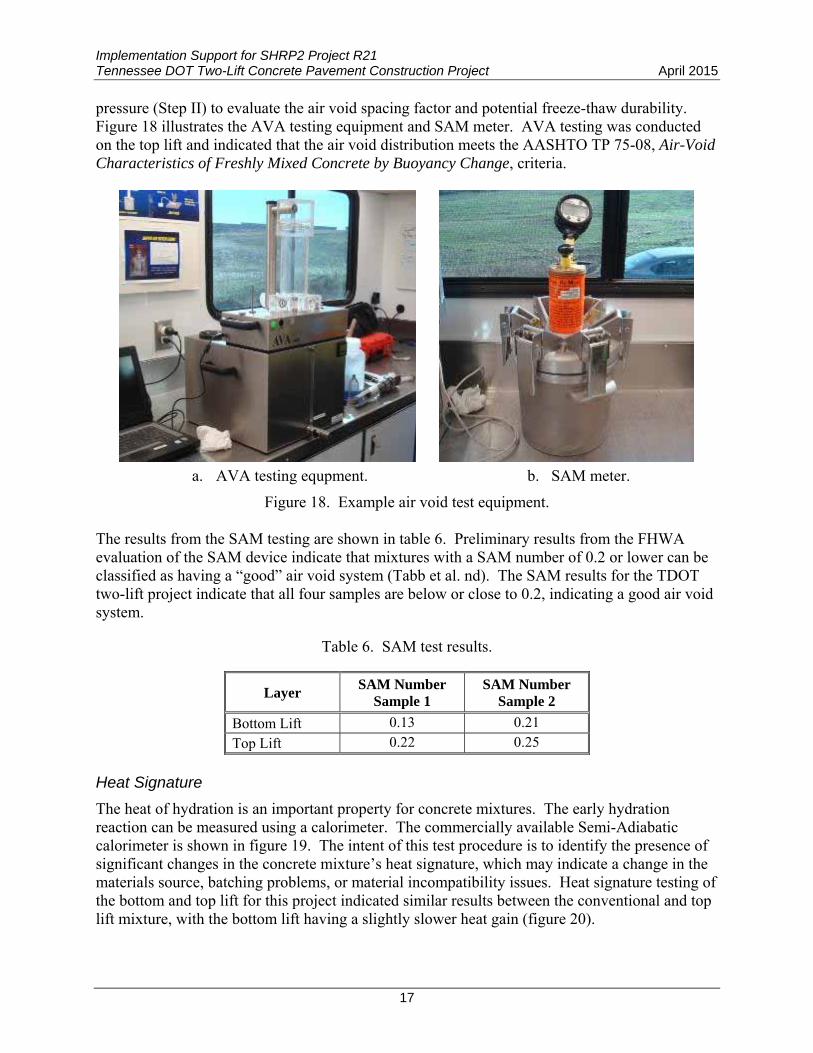
As with the modulus of elasticity and Poisson’s ratio, CTE is a level 1 material input for the AASHTOWare Pavement ME Design™ software. CTE is a measure of the extent a material will expand due to changes in temperature, and is heavily influenced by the coarse aggregate type and volume. Figure 17 shows an example of the equipment used to conduct CTE testing. CTE is defined as the length change per unit length per unit temperature. Specific to concrete pavement performance, CTE impacts joint movement and slab curling. The coarse aggregate used on this project was limestone from two aggregate sources (approximately 30 miles apart). The coarse aggregate for the bottom lift mix was obtained from the White Creek pit and the Cross Plains pit supplied coarse aggregate for the conventional and top lift mixes. The average CTE value for the conventional and top lift mixes was 5.47 inch/inch/°F; average CTE for the bottom lift was 4.53 inch/inch/°F.
Image courtesy of Pine Instruments
Figure 17. Example test apparatus for CTE. Air Voids
Concrete mixture air voids were evaluated using the Air Voids Analyzer (AVA) and the Super Air Meter (SAM). The AVA measures the distribution of air void sizes in fresh concrete, which is an important factor in freeze-thaw durability. The SAM measures total air void volume just as a conventional volumetric air test meter does (Step I), but can also place the mixture under high
Implementation Support for SHRP2 Project R21 Tennessee DOT Two-Lift Concrete Pavement Construction Project April 2015
17
pressure (Step II) to evaluate the air void spacing factor and potential freeze-thaw durability. Figure 18 illustrates the AVA testing equipment and SAM meter. AVA testing was conducted on the top lift and indicated that the air void distribution meets the AASHTO TP 75-08, Air-Void Characteristics of Freshly Mixed Concrete by Buoyancy Change, criteria.
a. AVA testing equpment. b. SAM meter.
Figure 18. Example air void test equipment. The results from the SAM testing are shown in table 6. Preliminary results from the FHWA evaluation of the SAM device indicate that mixtures with a SAM number of 0.2 or lower can be classified as having a “good” air void system (Tabb et al. nd). The SAM results for the TDOT two-lift project indicate that all four samples are below or close to 0.2, indicating a good air void system.
Table 6. SAM test results.
Layer SAM Number
Sample 1 SAM Number
Sample 2
Bottom Lift 0.13 0.21
Top Lift 0.22 0.25
Heat Signature
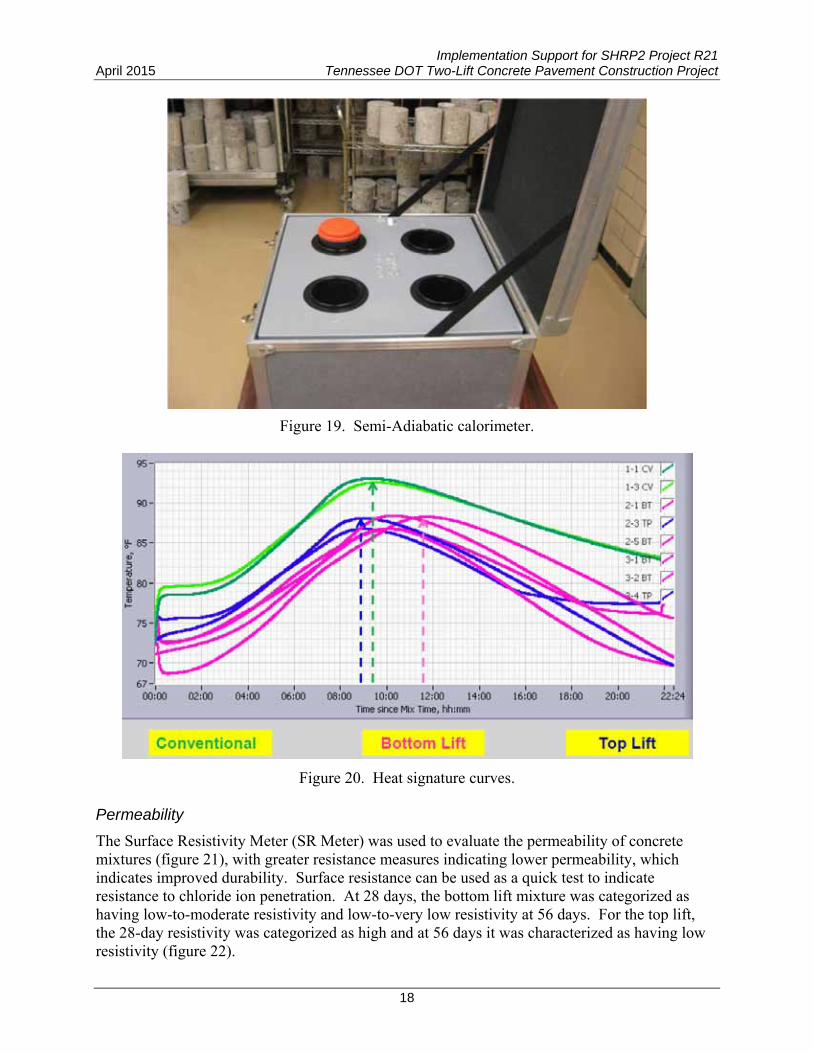
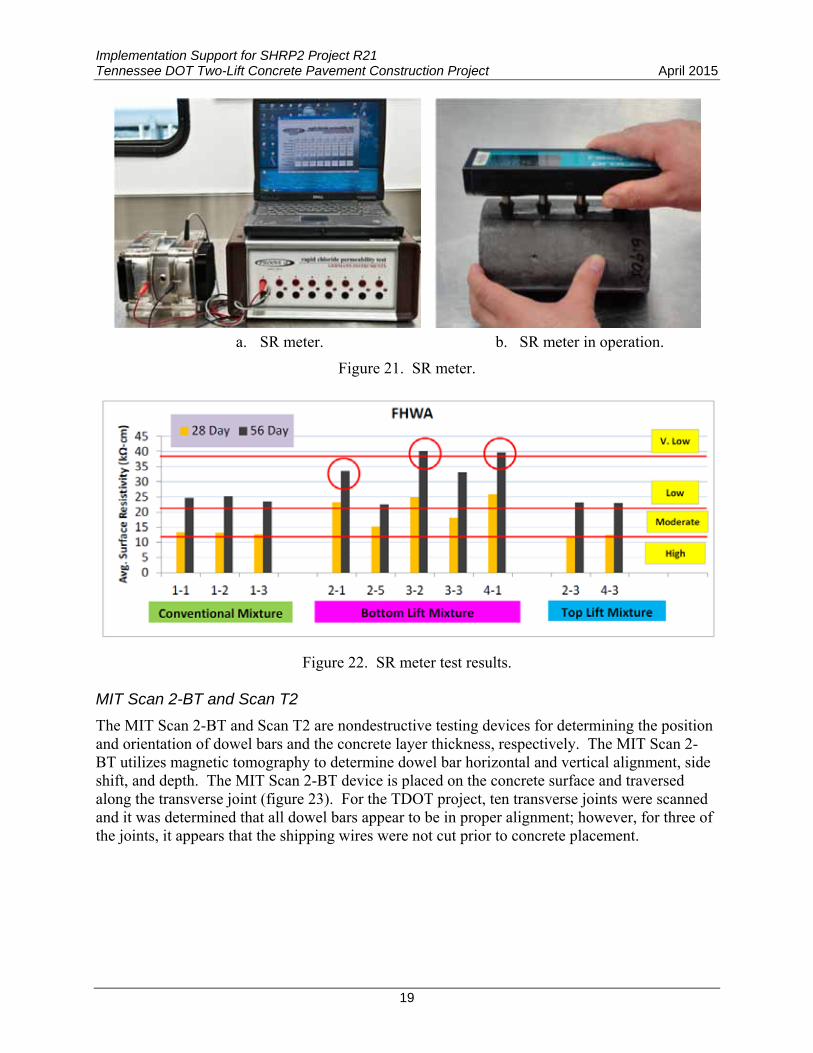
The heat of hydration is an important property for concrete mixtures. The early hydration reaction can be measured using a calorimeter. The commercially available Semi-Adiabatic calorimeter is shown in figure 19. The intent of this test procedure is to identify the presence of significant changes in the concrete mixture’s heat signature, which may indicate a change in the materials source, batching problems, or material incompatibility issues. Heat signature testing of the bottom and top lift for this project indicated similar results between the conventional and top lift mixture, with the bottom lift having a slightly slower heat gain (figure 20).
Implementation Support for SHRP2 Project R21 April 2015 Tennessee DOT Two-Lift Concrete Pavement Construction Project
18
Figure 19. Semi-Adiabatic calorimeter.
Figure 20. Heat signature curves. Permeability
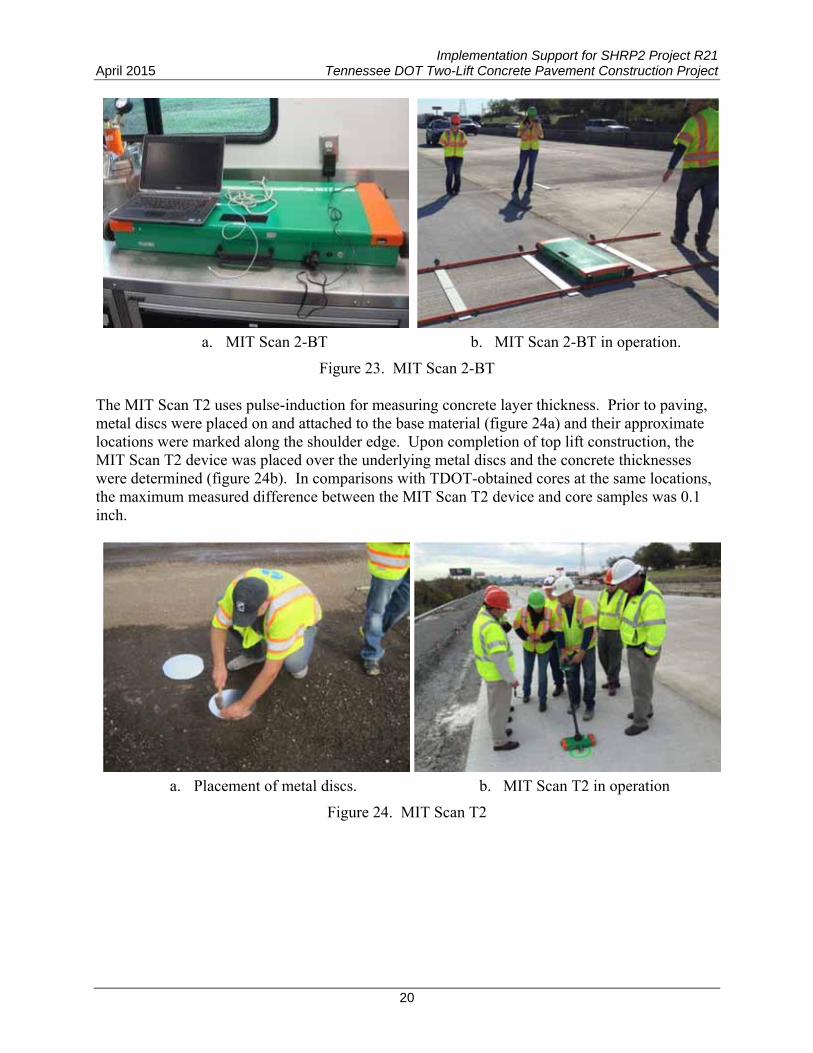
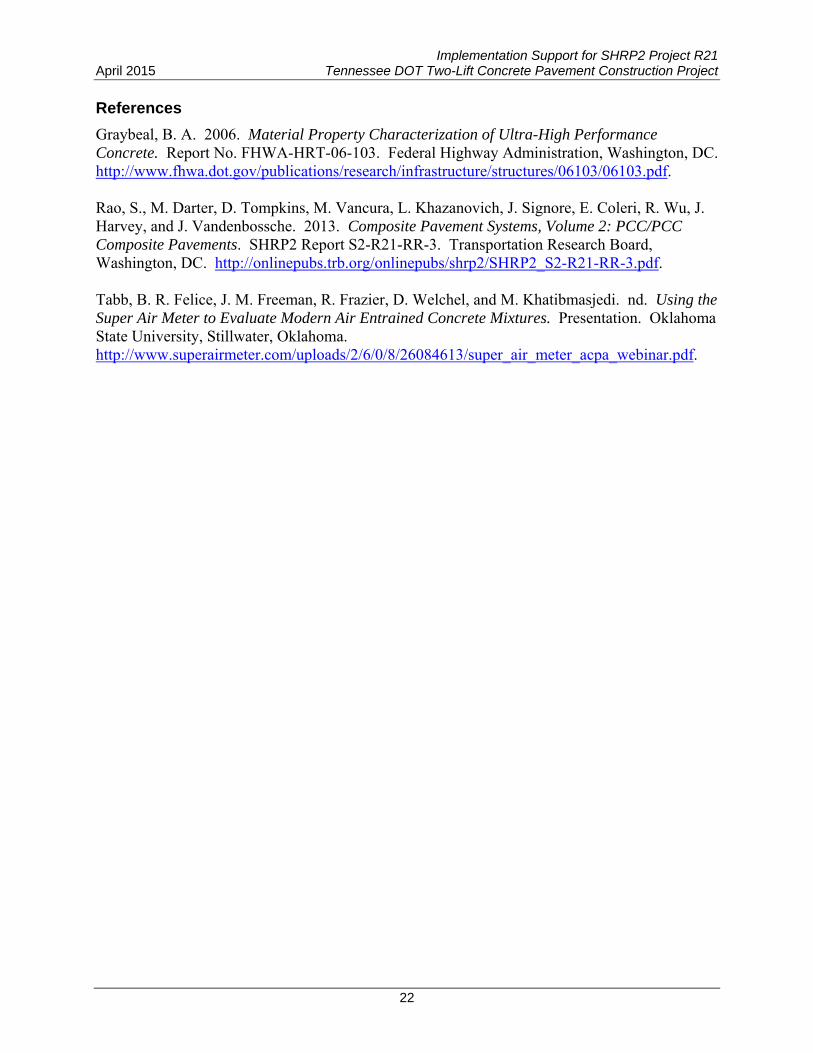
The Surface Resistivity Meter (SR Meter) was used to evaluate the permeability of concrete mixtures (figure 21), with greater resistance measures indicating lower permeability, which indicates improved durability. Surface resistance can be used as a quick test to indicate resistance to chloride ion penetration. At 28 days, the bottom lift mixture was categorized as having low-to-moderate resistivity and low-to-very low resistivity at 56 days. For the top lift, the 28-day resistivity was categorized as high and at 56 days it was characterized as having low resistivity (figure 22).
Implementation Support for SHRP2 Project R21 Tennessee DOT Two-Lift Concrete Pavement Construction Project April 2015
19
a. SR meter. b. SR meter in operation.
Figure 21. SR meter.
Figure 22. SR meter test results. MIT Scan 2-BT and Scan T2
The MIT Scan 2-BT and Scan T2 are nondestructive testing devices for determining the position and orientation of dowel bars and the concrete layer thickness, respectively. The MIT Scan 2-BT utilizes magnetic tomography to determine dowel bar horizontal and vertical alignment, side shift, and depth. The MIT Scan 2-BT device is placed on the concrete surface and traversed along the transverse joint (figure 23). For the TDOT project, ten transverse joints were scanned and it was determined that all dowel bars appear to be in proper alignment; however, for three of the joints, it appears that the shipping wires were not cut prior to concrete placement.
Implementation Support for SHRP2 Project R21 April 2015 Tennessee DOT Two-Lift Concrete Pavement Construction Project
20
a. MIT Scan 2-BT b. MIT Scan 2-BT in operation.
Figure 23. MIT Scan 2-BT The MIT Scan T2 uses pulse-induction for measuring concrete layer thickness. Prior to paving, metal discs were placed on and attached to the base material (figure 24a) and their approximate locations were marked along the shoulder edge. Upon completion of top lift construction, the MIT Scan T2 device was placed over the underlying metal discs and the concrete thicknesses were determined (figure 24b). In comparisons with TDOT-obtained cores at the same locations, the maximum measured difference between the MIT Scan T2 device and core samples was 0.1 inch.
a. Placement of metal discs. b. MIT Scan T2 in operation
Figure 24. MIT Scan T2

Implementation Support for SHRP2 Project R21 Tennessee DOT Two-Lift Concrete Pavement Construction Project April 2015
21
Summary
The following provides a summary of observations and findings from the TDOT field visit and materials testing: Construction Observations
The IMI plant was remarkably well-managed, with clearly labeled and separated stockpile bins, state-of-the art monitoring equipment, and efficient truck cleaning and wash water recycling facilities.
The use of different truck types was effective in ensuring that the correct mixture was delivered to the correct paver in the field.
The top lift had a higher slump than expected. In conjunction with the relatively wide encapsulation (12 inches), this resulted in significant amounts of edge slump and “blowouts.”
The over spraying of water on the mixture in front of the paver may result in a reduced surface durability, as well as a higher potential for map/shrinkage cracking.
Field Testing Results
The results from fresh concrete testing indicated that the bottom and top lift mixtures meet TDOT construction specification requirements (except for one slump test on the top lift and one slump test on the bottom lift).
The compressive strength on all cylinder tests exceeds the required 3,000 psi at 28 days. The distribution of air voids, measured using the AVA and SAM, indicated good air void
distribution for both the bottom and top lifts. The MIT Scan 2-BT was used to evaluate dowel bar location at ten transverse joints and
it was determined that all dowel bars appear to be in proper alignment; however, for three of the joints, it appears that the shipping wires were not cut prior to concrete placement.
The MIT Scan T2 was used to measure concrete layer thickness. When compared to TDOT-obtained cores, the maximum measured difference was 0.1 inch.
MCL Testing Results
Concrete materials were evaluated for modulus of elasticity, Poisson’s ratio, and coefficient of thermal expansion. These values are used as level 1 inputs into the AASHTOWare Pavement ME Design™ software.
Heat signature evaluation indicated similar results between the conventional and top lift mixture, with the bottom lift having a slightly slower heat gain. These results indicate no significant changes in materials source, no batching issues, or material compatibility issues.
At 56 days, the bottom lift mixture was categorized as having low-to-very low resistivity and the top lift was categorized as having low resistivity (lower permeability indicating improved durability).
Implementation Support for SHRP2 Project R21 April 2015 Tennessee DOT Two-Lift Concrete Pavement Construction Project
22
References
Graybeal, B. A. 2006. Material Property Characterization of Ultra-High Performance Concrete. Report No. FHWA-HRT-06-103. Federal Highway Administration, Washington, DC. http://www.fhwa.dot.gov/publications/research/infrastructure/structures/06103/06103.pdf. Rao, S., M. Darter, D. Tompkins, M. Vancura, L. Khazanovich, J. Signore, E. Coleri, R. Wu, J. Harvey, and J. Vandenbossche. 2013. Composite Pavement Systems, Volume 2: PCC/PCC Composite Pavements. SHRP2 Report S2-R21-RR-3. Transportation Research Board, Washington, DC. http://onlinepubs.trb.org/onlinepubs/shrp2/SHRP2_S2-R21-RR-3.pdf. Tabb, B. R. Felice, J. M. Freeman, R. Frazier, D. Welchel, and M. Khatibmasjedi. nd. Using the Super Air Meter to Evaluate Modern Air Entrained Concrete Mixtures. Presentation. Oklahoma State University, Stillwater, Oklahoma. http://www.superairmeter.com/uploads/2/6/0/8/26084613/super_air_meter_acpa_webinar.pdf.

Implementation Support for SHRP2 Project R21 Tennessee DOT Two-Lift Concrete Pavement Construction Project April 2015
23
APPENDIX A – SHRP2 R21 APPLICATION

Implementation Support for SHRP2 Project R21 April 2015 Tennessee DOT Two-Lift Concrete Pavement Construction Project
24
Implementation Support for SHRP2 Project R21 Tennessee DOT Two-Lift Concrete Pavement Construction Project April 2015
25

Implementation Support for SHRP2 Project R21 April 2015 Tennessee DOT Two-Lift Concrete Pavement Construction Project
26

Implementation Support for SHRP2 Project R21 Tennessee DOT Two-Lift Concrete Pavement Construction Project April 2015
27
APPENDIX B – TDOT IMPLEMENTATION PLAN
R21 PROJECT IMPLEMENTATION PLAN
This R21 New Composite Pavement –Agency Implementation Plan describes the Task; Expected Deliverables; SHRP2 Funding and Schedule; Use of Funds; Communication, Reporting and Monitoring; and Point of Contacts to the Tennessee DOT (TDOT) for the SHRP2 R21 Solution.
Task:
The TDOT is interested in utilizing a wet-on-wet concrete composite pavement. Utilizing an existing project with full depth concrete placement, TDOT would like to evaluate the constructability and cost comparison between using polish resistant aggregate only in the top portion of the pavement. A successful project would give TDOT the confidence to use this process in the future with alternative, cost effective, local and possibly recycled materials.
Expected Deliverables:
INSTRUCTIONS: Please list in this section the expected deliverables.
1. Evaluate the constructability and cost comparison between alternatives. Because this process requires two concrete mixtures and two paving operations, TDOT wished to evaluate the “logistical” and “planning” challenges of the wet on wet method. This is critical since we now require our concrete pavements to have a non-polishing coarse aggregate. If the composite concrete (wet/wet) methods are not too cumbersome and are acceptable to TDOT, contractors may elect to do this which would allow for the use of non-polishing aggregate in the top layer only. We are not expecting cost savings on this project because the volume is not significant enough and the project was bid using different aggregate sources.
2. Document & communicate findings (lessons learned, cost comparison, etc.) TDOT will be onsite during the composite paving to observe and photograph/video the operations. We will provide a summary of what the “lessons learned” and the “do’s and don’t do’s”. We will also provide a PowerPoint presentation with this information for use.
3. Provided TDOT confidence to use this process in the future. If the contractor is able to place the composite concrete (wet/wet) without problems and there is acceptable field performance while under traffic, TDOT will adopt a provision that will allow the composite concrete (wet/wet) method as an acceptable alternative to the full depth single lift method.
SHRP2 Funding & Schedule:
SHRP2 funding allocated to this project is limited to $170,000.00. The project must be completed within 2 years after the date of the FHWA funds Allocation Memorandum.

Implementation Support for SHRP2 Project R21 April 2015 Tennessee DOT Two-Lift Concrete Pavement Construction Project
28
Use of funds:
The funds will be used on a project presently in construction (TDOT contract CNL264, Davidson County, IM/NH/IMD-65-3(106), 19010-3154-44) primarily to offset the additional costs to mobilize a second paver as well an additional paving crew to try this alternative paving method, along with additional burden on staff for coordination and data collection.
For direct funding assistance, FHWA will need to transfer funding thru the FHWA Division office to the agency, obligating funding through FMIS. As such, the agency will need to work closely with the FHWA Division office to ensure this can be accomplished by the end of FY14). The State must obligate the funds in FMIS prior to September 26, 2014. Project activities may be conducted in the subsequent year provided the funds are obligated prior to the deadline. Additional Comments: In addition to direct funding assistance, technical assistance for design and construction related challenges is also available upon request, to include training and outreach/marketing by FHWA and/or their contractor/consultant services. Separate of SHRP2 R21 Implementation support, FHWA will attempt to support TDOT in their request for the FHWA Mobile Concrete Laboratory to assist in field testing and to demonstrate the MIT Scan equipment. NOTE: Feel free to provide any additional information applicable to implementing the R21 Solution. Communication, Reporting and Monitoring: As a Lead Adopter, the agency agrees to permit key staff to speak at government and/or industry events and prepare a presentation of their R21 solution and findings. The FHWA may ask the project applicant to present their experience on webinars, serve on expert panels, or other instances where it would be useful to present the challenges, successes, and lessons learned in implementing an application of R21 New Composite Pavements. This may occur while the project is underway or after the completion, as needed. Travel costs for these events will be provided by the SHRP2 program at no cost to the State DOT. The agency will be required to provide periodic status reports of DOT activities as well as the progress and completion of deliverables. The agency agrees to participate in R21 User Group/expert panel conference calls/webinars hosted by FHWA twice a year until the end of 2017 to share lessons learned /open dialogue with other interested agencies, contractors, academia, etc. interested in advancing composite pavement practices in their state.
The agency agrees to permit documentation of the project activities by the SHRP2 Program Team and understands that a case study may be developed from this documentation.
The agency agrees to host a workshop and/or showcase with other interested agencies and associations to share results.

Implementation Support for SHRP2 Project R21 Tennessee DOT Two-Lift Concrete Pavement Construction Project April 2015
29
POINT OF CONTACTS: DOT Point of Contact: Jamie Waller [email protected] 615-350-4151
FHWA TN Division Office Contact: John Steele [email protected] 615-781-5777
FHWA Office of Technical Services Contact: Stephen J. Cooper [email protected] 443-257-7145

Implementation Support for SHRP2 Project R21 April 2015 Tennessee DOT Two-Lift Concrete Pavement Construction Project
30
Implementation Support for SHRP2 Project R21 Tennessee DOT Two-Lift Concrete Pavement Construction Project April 2015
31
APPENDIX C – CHANGE ORDER DOCUMENTS

Implementation Support for SHRP2 Project R21 April 2015 Tennessee DOT Two-Lift Concrete Pavement Construction Project
32
Implementation Support for SHRP2 Project R21 Tennessee DOT Two-Lift Concrete Pavement Construction Project April 2015
33
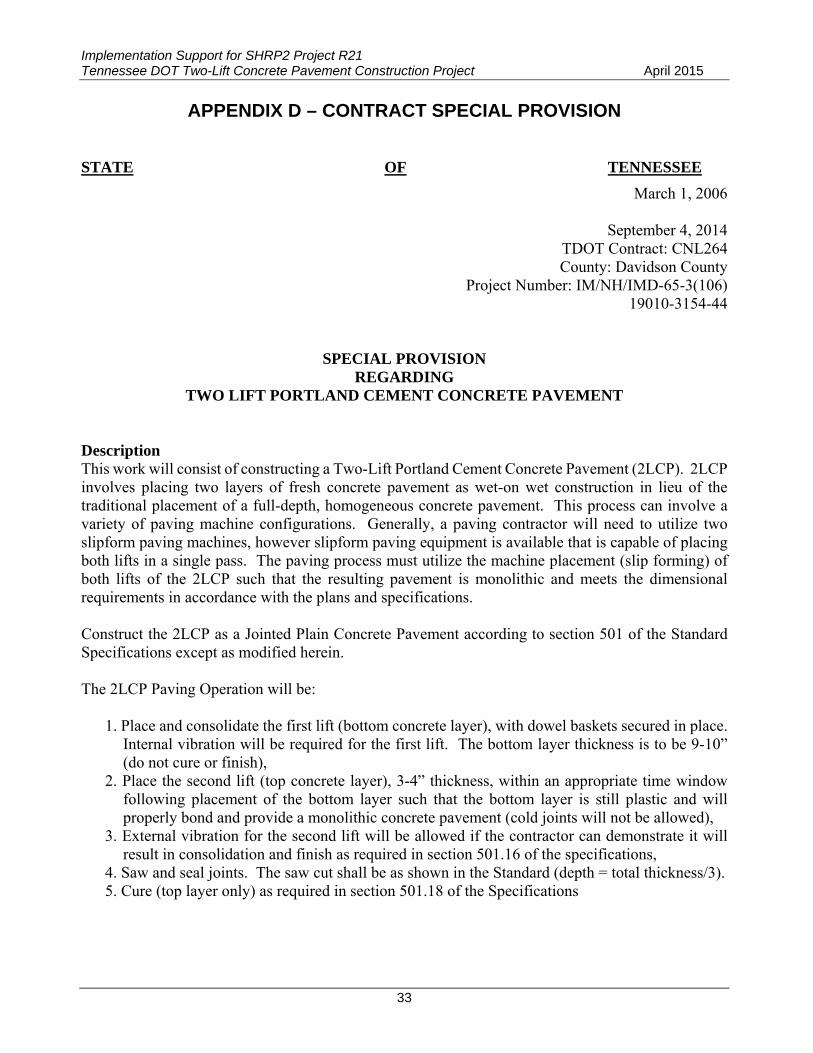
APPENDIX D – CONTRACT SPECIAL PROVISION STATE OF TENNESSEE
March 1, 2006
September 4, 2014 TDOT Contract: CNL264
County: Davidson County Project Number: IM/NH/IMD-65-3(106)
19010-3154-44
SPECIAL PROVISION REGARDING
TWO LIFT PORTLAND CEMENT CONCRETE PAVEMENT
Description This work will consist of constructing a Two-Lift Portland Cement Concrete Pavement (2LCP). 2LCP involves placing two layers of fresh concrete pavement as wet-on wet construction in lieu of the traditional placement of a full-depth, homogeneous concrete pavement. This process can involve a variety of paving machine configurations. Generally, a paving contractor will need to utilize two slipform paving machines, however slipform paving equipment is available that is capable of placing both lifts in a single pass. The paving process must utilize the machine placement (slip forming) of both lifts of the 2LCP such that the resulting pavement is monolithic and meets the dimensional requirements in accordance with the plans and specifications. Construct the 2LCP as a Jointed Plain Concrete Pavement according to section 501 of the Standard Specifications except as modified herein. The 2LCP Paving Operation will be:
1. Place and consolidate the first lift (bottom concrete layer), with dowel baskets secured in place. Internal vibration will be required for the first lift. The bottom layer thickness is to be 9-10” (do not cure or finish),
2. Place the second lift (top concrete layer), 3-4” thickness, within an appropriate time window following placement of the bottom layer such that the bottom layer is still plastic and will properly bond and provide a monolithic concrete pavement (cold joints will not be allowed),
3. External vibration for the second lift will be allowed if the contractor can demonstrate it will result in consolidation and finish as required in section 501.16 of the specifications,
4. Saw and seal joints. The saw cut shall be as shown in the Standard (depth = total thickness/3). 5. Cure (top layer only) as required in section 501.18 of the Specifications
Implementation Support for SHRP2 Project R21 April 2015 Tennessee DOT Two-Lift Concrete Pavement Construction Project
34
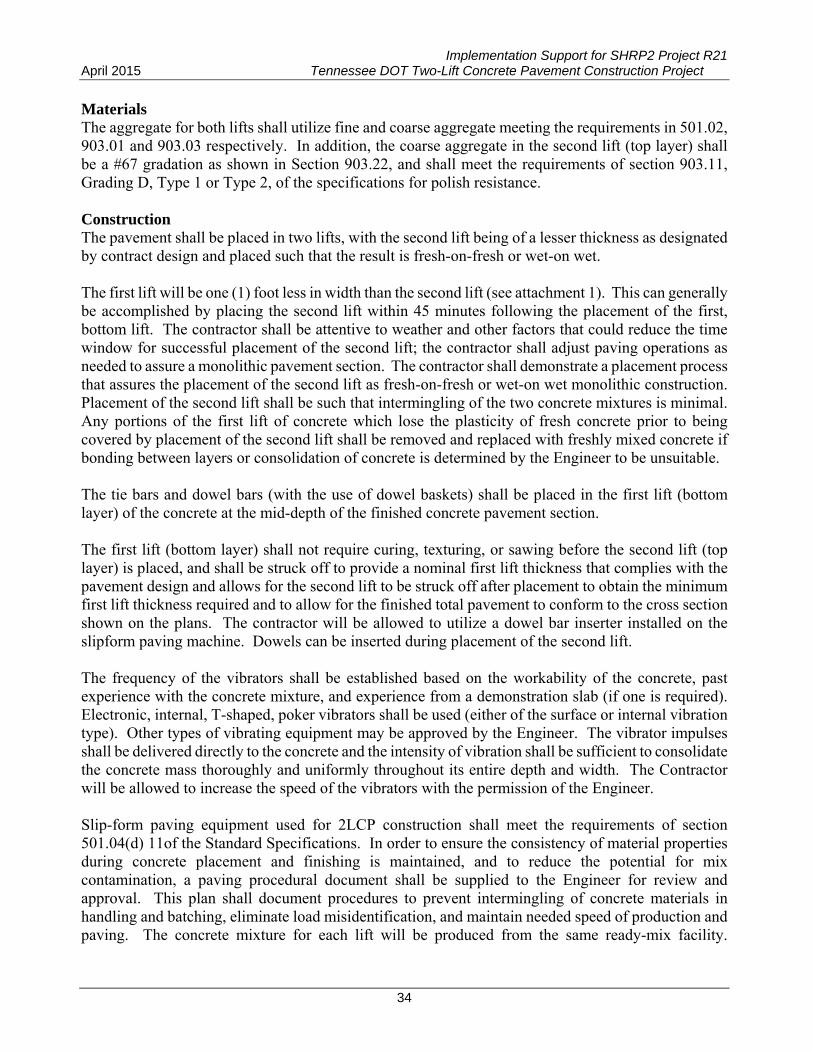
Materials The aggregate for both lifts shall utilize fine and coarse aggregate meeting the requirements in 501.02, 903.01 and 903.03 respectively. In addition, the coarse aggregate in the second lift (top layer) shall be a #67 gradation as shown in Section 903.22, and shall meet the requirements of section 903.11, Grading D, Type 1 or Type 2, of the specifications for polish resistance. Construction The pavement shall be placed in two lifts, with the second lift being of a lesser thickness as designated by contract design and placed such that the result is fresh-on-fresh or wet-on wet. The first lift will be one (1) foot less in width than the second lift (see attachment 1). This can generally be accomplished by placing the second lift within 45 minutes following the placement of the first, bottom lift. The contractor shall be attentive to weather and other factors that could reduce the time window for successful placement of the second lift; the contractor shall adjust paving operations as needed to assure a monolithic pavement section. The contractor shall demonstrate a placement process that assures the placement of the second lift as fresh-on-fresh or wet-on wet monolithic construction. Placement of the second lift shall be such that intermingling of the two concrete mixtures is minimal. Any portions of the first lift of concrete which lose the plasticity of fresh concrete prior to being covered by placement of the second lift shall be removed and replaced with freshly mixed concrete if bonding between layers or consolidation of concrete is determined by the Engineer to be unsuitable. The tie bars and dowel bars (with the use of dowel baskets) shall be placed in the first lift (bottom layer) of the concrete at the mid-depth of the finished concrete pavement section. The first lift (bottom layer) shall not require curing, texturing, or sawing before the second lift (top layer) is placed, and shall be struck off to provide a nominal first lift thickness that complies with the pavement design and allows for the second lift to be struck off after placement to obtain the minimum first lift thickness required and to allow for the finished total pavement to conform to the cross section shown on the plans. The contractor will be allowed to utilize a dowel bar inserter installed on the slipform paving machine. Dowels can be inserted during placement of the second lift. The frequency of the vibrators shall be established based on the workability of the concrete, past experience with the concrete mixture, and experience from a demonstration slab (if one is required). Electronic, internal, T-shaped, poker vibrators shall be used (either of the surface or internal vibration type). Other types of vibrating equipment may be approved by the Engineer. The vibrator impulses shall be delivered directly to the concrete and the intensity of vibration shall be sufficient to consolidate the concrete mass thoroughly and uniformly throughout its entire depth and width. The Contractor will be allowed to increase the speed of the vibrators with the permission of the Engineer. Slip-form paving equipment used for 2LCP construction shall meet the requirements of section 501.04(d) 11of the Standard Specifications. In order to ensure the consistency of material properties during concrete placement and finishing is maintained, and to reduce the potential for mix contamination, a paving procedural document shall be supplied to the Engineer for review and approval. This plan shall document procedures to prevent intermingling of concrete materials in handling and batching, eliminate load misidentification, and maintain needed speed of production and paving. The concrete mixture for each lift will be produced from the same ready-mix facility.

Implementation Support for SHRP2 Project R21 Tennessee DOT Two-Lift Concrete Pavement Construction Project April 2015
35
Delivery trucks shall clearly identify the concrete mixture type they are hauling through use of a color-code system or other identifying measure. Paving of 2LCP shall be continuous between transverse joint locations shown on the plans. Method of Measurement 2LCP will be measured by the square yard (SY). Basis of Payment Payment will be made at the contract unit price for item 501-01.06, PORTLAND CEM CONCRETE PVMT (PLAIN) 13" for the first lift area of the TWO LIFT PORTLAND CEMENT CONCRETE PAVEMENT placed. Payment will also be made for the additional equipment, materials and labor provided to place the second lift of Portland cement concrete of a two lift operation under item number 501-01.60, TWO LIFT PORTLAND CEMENT CONCRETE PAVEMENT, for the area constructed in a two lift operation.

Implementation Support for SHRP2 Project R21 April 2015 Tennessee DOT Two-Lift Concrete Pavement Construction Project
36
Implementation Support for SHRP2 Project R21 Tennessee DOT Two-Lift Concrete Pavement Construction Project April 2015
37
APPENDIX E – CONSTRUCTION PHOTOS
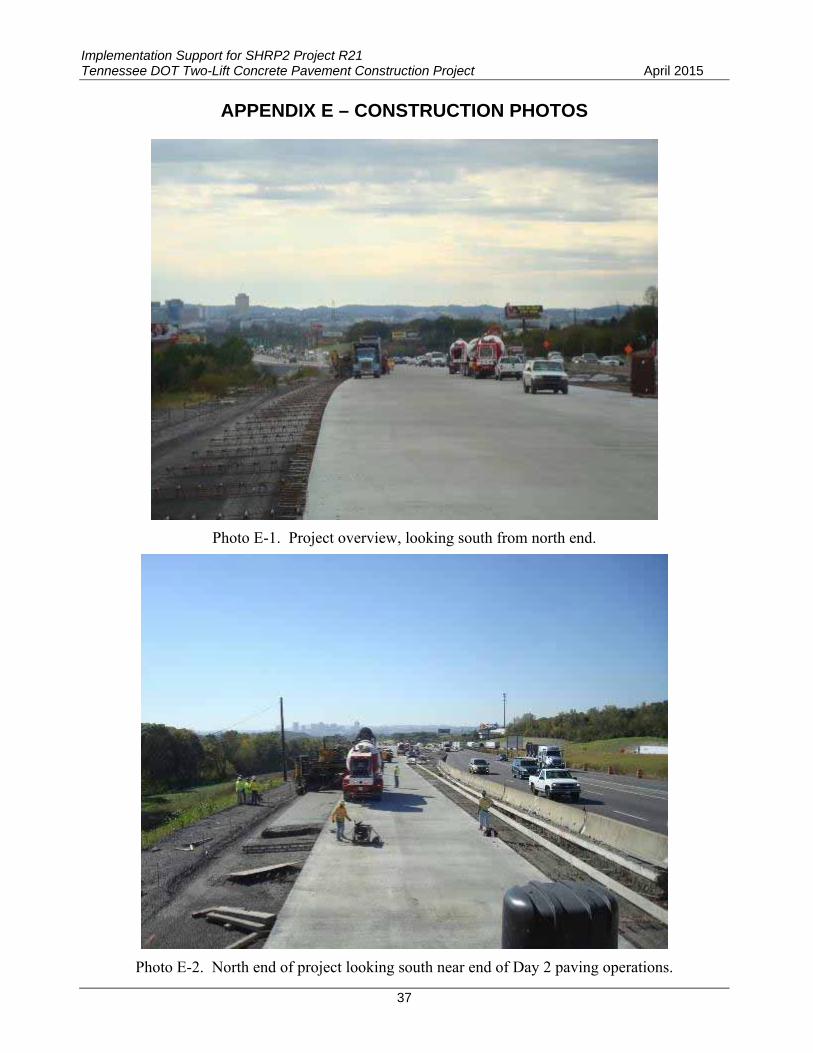
Photo E-1. Project overview, looking south from north end.
Photo E-2. North end of project looking south near end of Day 2 paving operations.
Implementation Support for SHRP2 Project R21 April 2015 Tennessee DOT Two-Lift Concrete Pavement Construction Project
38
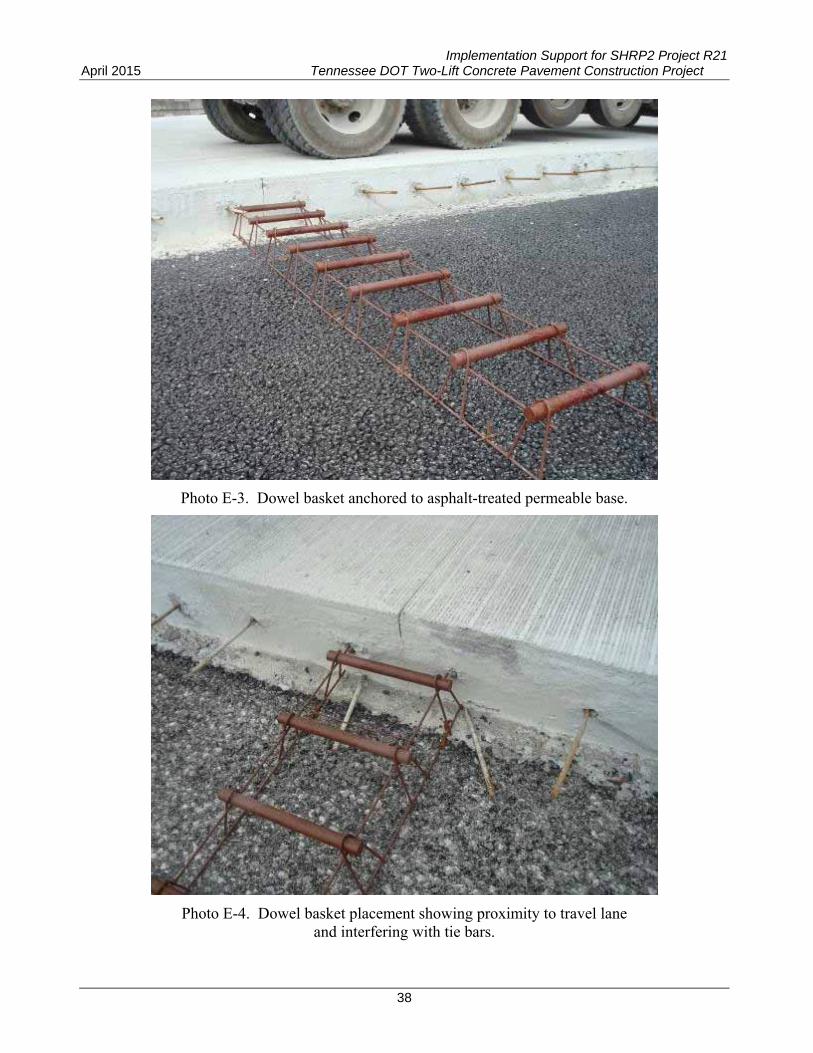
Photo E-3. Dowel basket anchored to asphalt-treated permeable base.
Photo E-4. Dowel basket placement showing proximity to travel lane and interfering with tie bars.
Implementation Support for SHRP2 Project R21 Tennessee DOT Two-Lift Concrete Pavement Construction Project April 2015
39
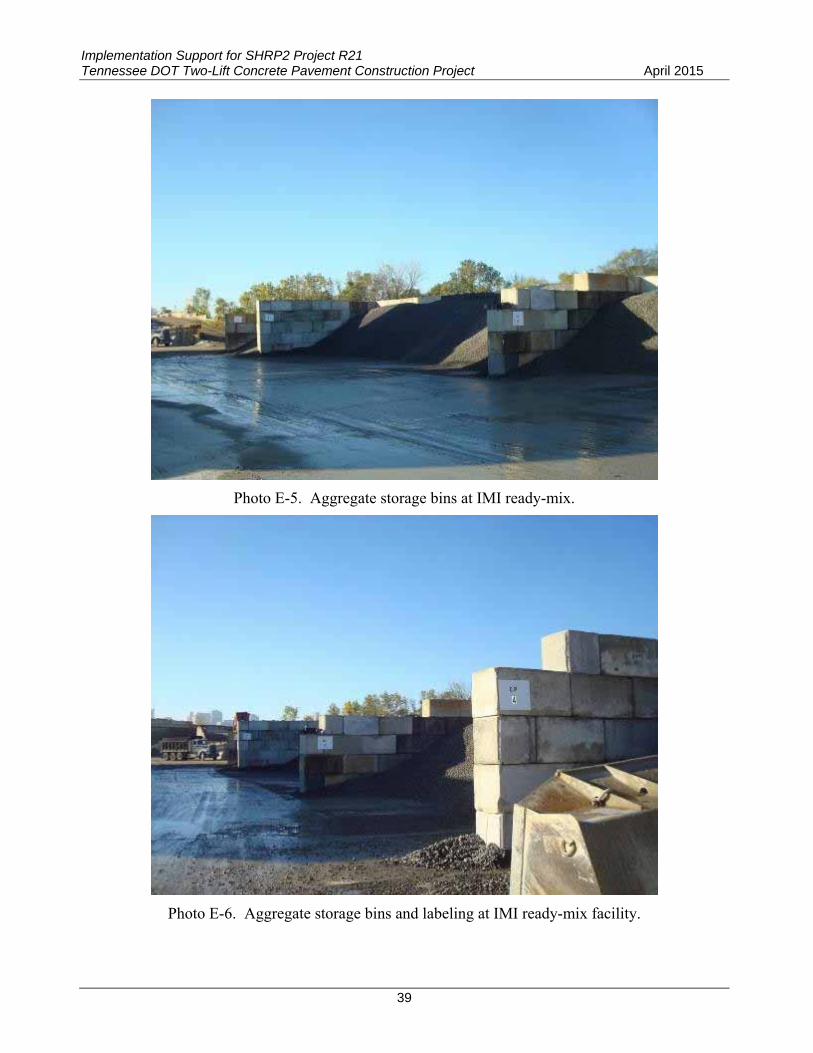
Photo E-5. Aggregate storage bins at IMI ready-mix.
Photo E-6. Aggregate storage bins and labeling at IMI ready-mix facility.
Implementation Support for SHRP2 Project R21 April 2015 Tennessee DOT Two-Lift Concrete Pavement Construction Project
40
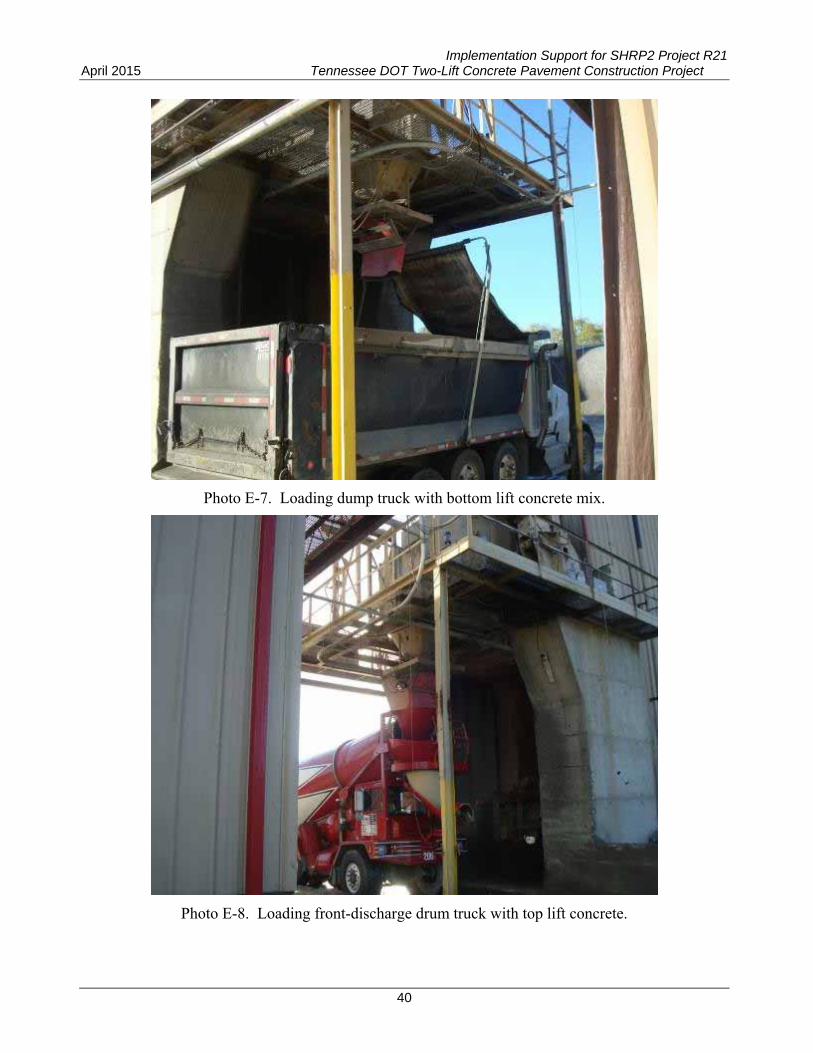
Photo E-7. Loading dump truck with bottom lift concrete mix.
Photo E-8. Loading front-discharge drum truck with top lift concrete.

Implementation Support for SHRP2 Project R21 Tennessee DOT Two-Lift Concrete Pavement Construction Project April 2015
41
Photo E-9. State-of-the-art process control facility at IMI ready mix facility.
Photo E-10. Truck wash station at IMI ready-mix facility.

Implementation Support for SHRP2 Project R21 April 2015 Tennessee DOT Two-Lift Concrete Pavement Construction Project
42
Photo E-11. Washing out dump truck at IMI ready-mix facility.
Photo E-12. Dump trucks and belt placer used for transport and placement of bottom lift concrete.
Implementation Support for SHRP2 Project R21 Tennessee DOT Two-Lift Concrete Pavement Construction Project April 2015
43
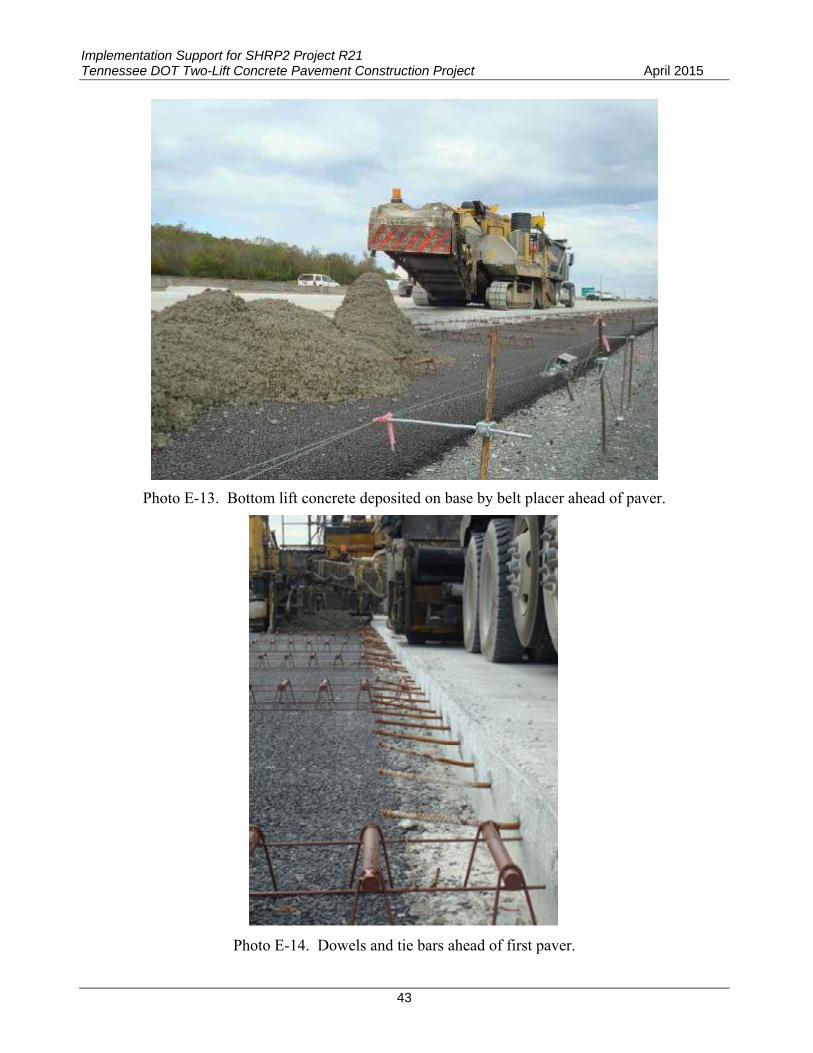
Photo E-13. Bottom lift concrete deposited on base by belt placer ahead of paver.
Photo E-14. Dowels and tie bars ahead of first paver.

Implementation Support for SHRP2 Project R21 April 2015 Tennessee DOT Two-Lift Concrete Pavement Construction Project
44
Photo E-15. Bottom lift paving, viewed from ahead of paver.
Photo E-16. Paving operation – bottom lift, front view.
Implementation Support for SHRP2 Project R21 Tennessee DOT Two-Lift Concrete Pavement Construction Project April 2015
45
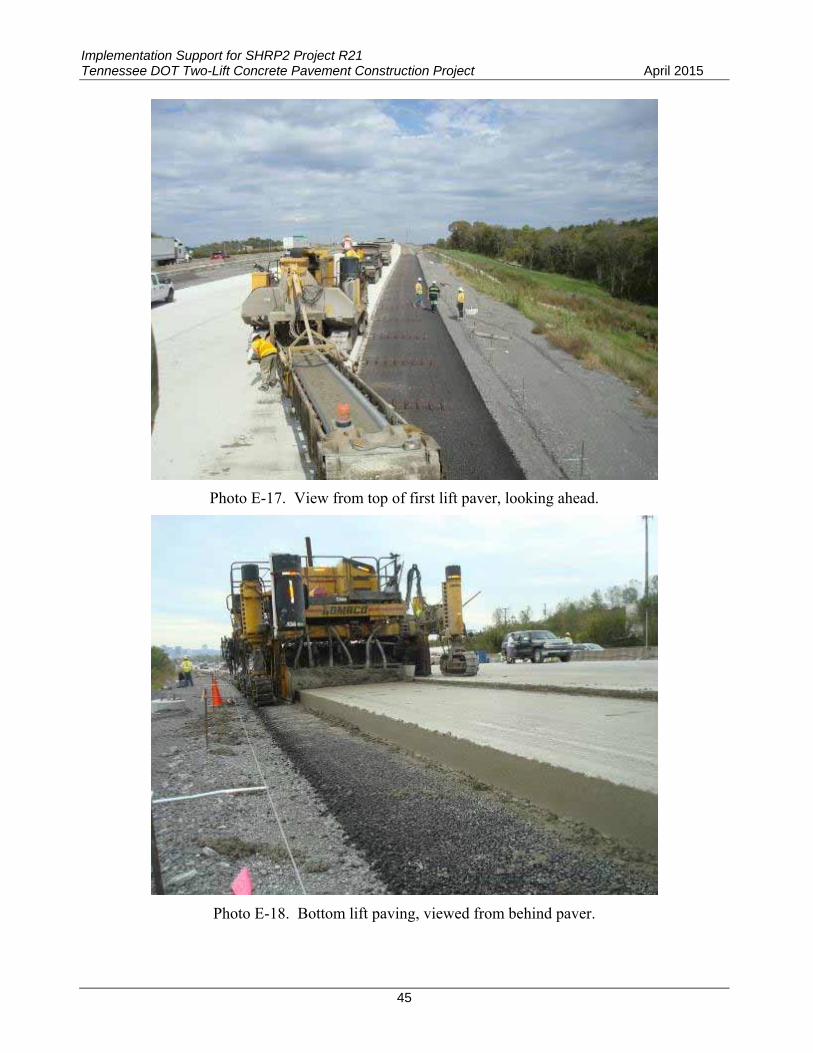
Photo E-17. View from top of first lift paver, looking ahead.
Photo E-18. Bottom lift paving, viewed from behind paver.

Implementation Support for SHRP2 Project R21 April 2015 Tennessee DOT Two-Lift Concrete Pavement Construction Project
46
Photo E-19. Workers checking bottom lift elevation and profile using stringline.
Photo E-20. Bottom lift surface behind paver (note: top lift will need to be more than 3 inches thick in this area).
Implementation Support for SHRP2 Project R21 Tennessee DOT Two-Lift Concrete Pavement Construction Project April 2015
47
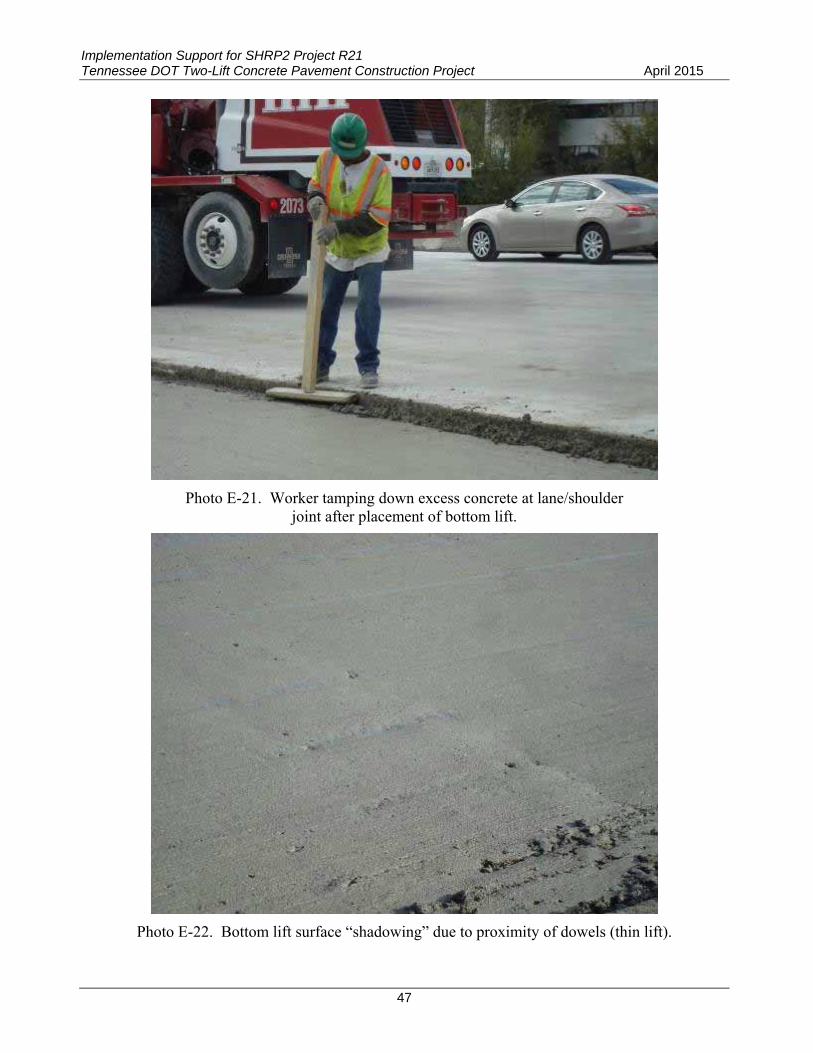
Photo E-21. Worker tamping down excess concrete at lane/shoulder joint after placement of bottom lift.
Photo E-22. Bottom lift surface “shadowing” due to proximity of dowels (thin lift).
Implementation Support for SHRP2 Project R21 April 2015 Tennessee DOT Two-Lift Concrete Pavement Construction Project
48
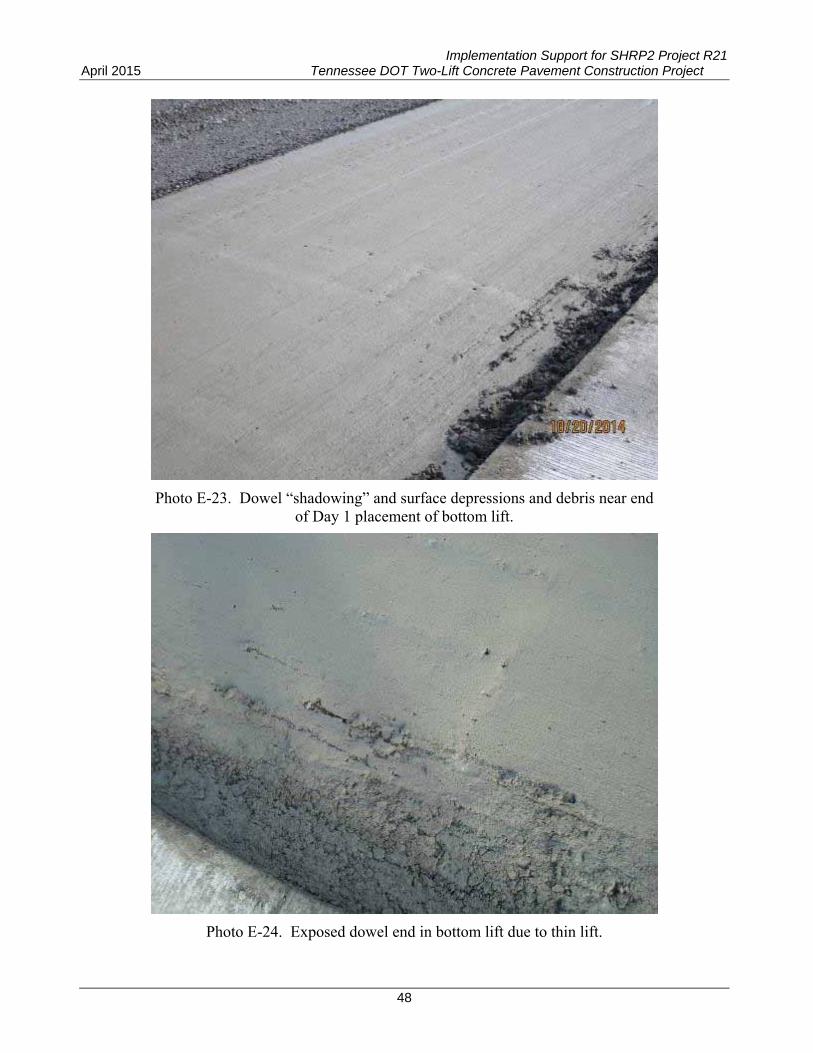
Photo E-23. Dowel “shadowing” and surface depressions and debris near end of Day 1 placement of bottom lift.
Photo E-24. Exposed dowel end in bottom lift due to thin lift.
Implementation Support for SHRP2 Project R21 Tennessee DOT Two-Lift Concrete Pavement Construction Project April 2015
49
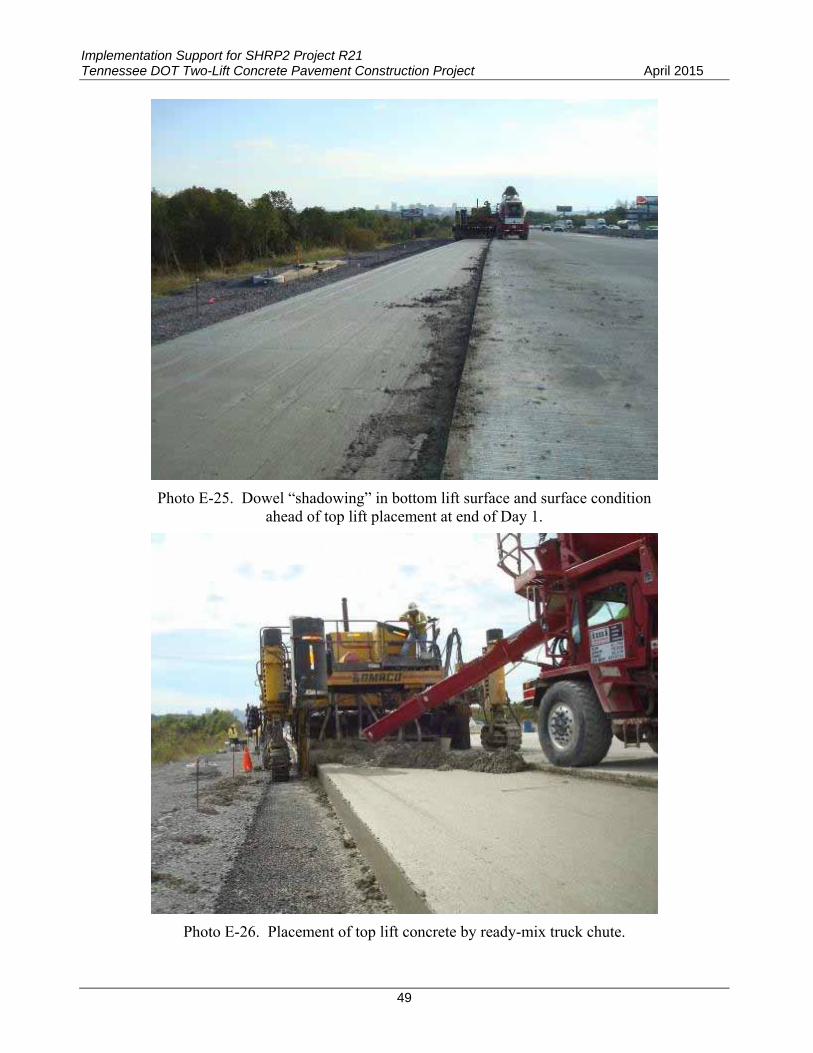
Photo E-25. Dowel “shadowing” in bottom lift surface and surface condition ahead of top lift placement at end of Day 1.
Photo E-26. Placement of top lift concrete by ready-mix truck chute.
Implementation Support for SHRP2 Project R21 April 2015 Tennessee DOT Two-Lift Concrete Pavement Construction Project
50
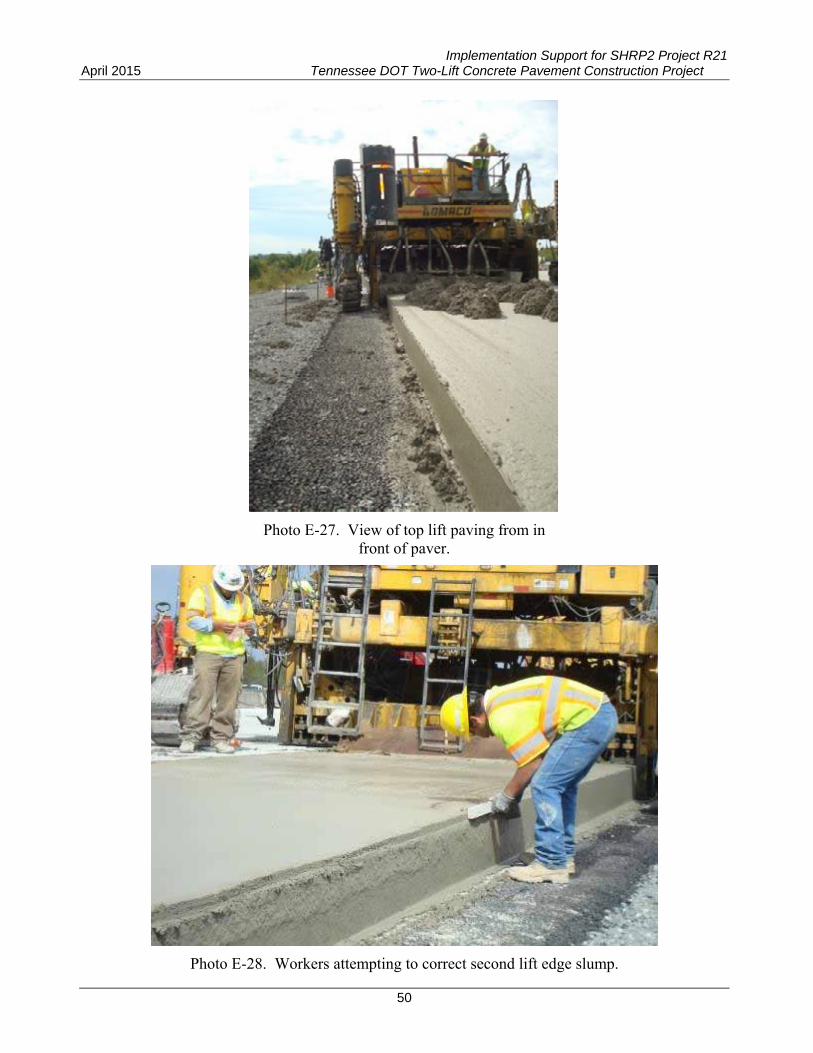
Photo E-27. View of top lift paving from in front of paver.
Photo E-28. Workers attempting to correct second lift edge slump.

Implementation Support for SHRP2 Project R21 Tennessee DOT Two-Lift Concrete Pavement Construction Project April 2015
51
Photo E-29. Shoulder edge line after first edge slump correction effort.
S
Photo E-30. Shoulder edge line after second edge slump correction effort.

Implementation Support for SHRP2 Project R21 April 2015 Tennessee DOT Two-Lift Concrete Pavement Construction Project
52
s
Photo E-31. Edge blowout #1.
Photo E-32. Edge blowout #2.

Implementation Support for SHRP2 Project R21 Tennessee DOT Two-Lift Concrete Pavement Construction Project April 2015
53
Photo E-33. Edge blowout #2 after repair.
Photo E-34. Free water and bubbles on surface of bottom lift due to excessive water application to burlap drag.

Implementation Support for SHRP2 Project R21 April 2015 Tennessee DOT Two-Lift Concrete Pavement Construction Project
54
Photo E-35. Construction of Day 1 header (prior to top lift placement).
Photo E-36. Day 1 header, just prior to top lift placement.
Implementation Support for SHRP2 Project R21 Tennessee DOT Two-Lift Concrete Pavement Construction Project April 2015
55
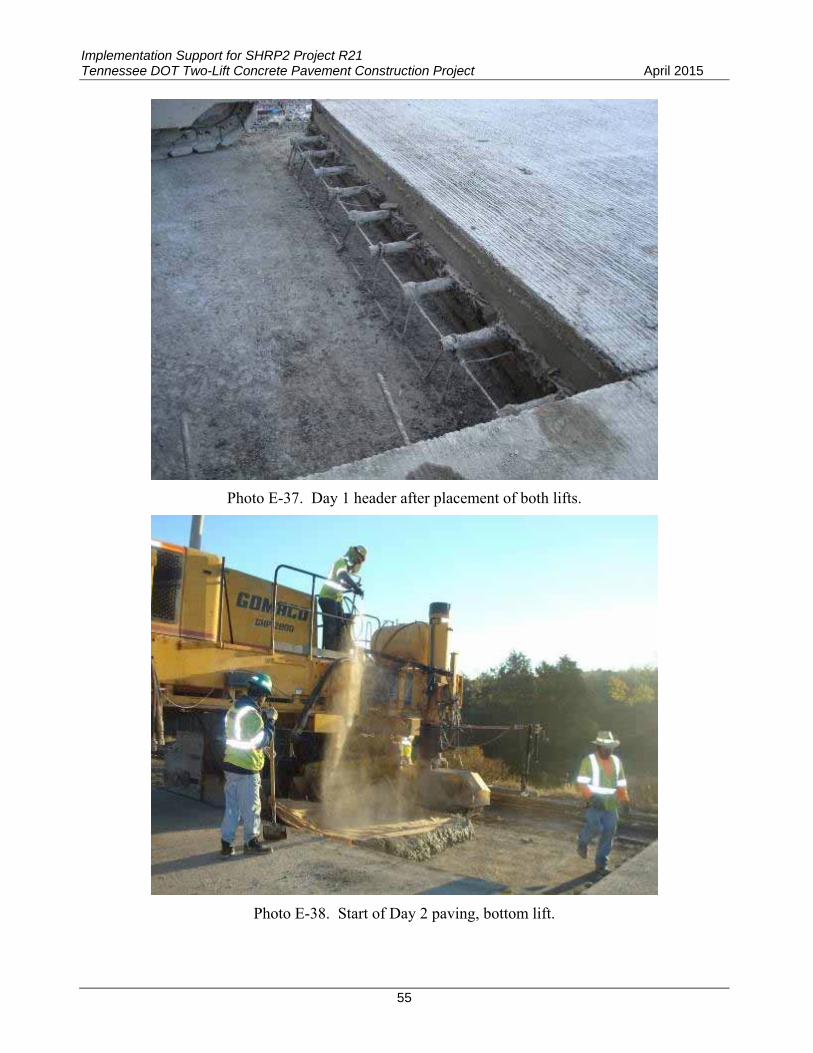
Photo E-37. Day 1 header after placement of both lifts.
Photo E-38. Start of Day 2 paving, bottom lift.

Implementation Support for SHRP2 Project R21 April 2015 Tennessee DOT Two-Lift Concrete Pavement Construction Project
56
Photo E-39. Water being sprayed on burlap drag at start of Day 2 placement.
Photo E-40. Hand placement to close gap with header at start of Day 2 paving.

Implementation Support for SHRP2 Project R21 Tennessee DOT Two-Lift Concrete Pavement Construction Project April 2015
57
s
Photo E-41. Day 2 bottom lift placement, viewed from behind paver.
Photo E-42. Day 2 top lift placement, viewed from in front of paver.
Implementation Support for SHRP2 Project R21 April 2015 Tennessee DOT Two-Lift Concrete Pavement Construction Project
58
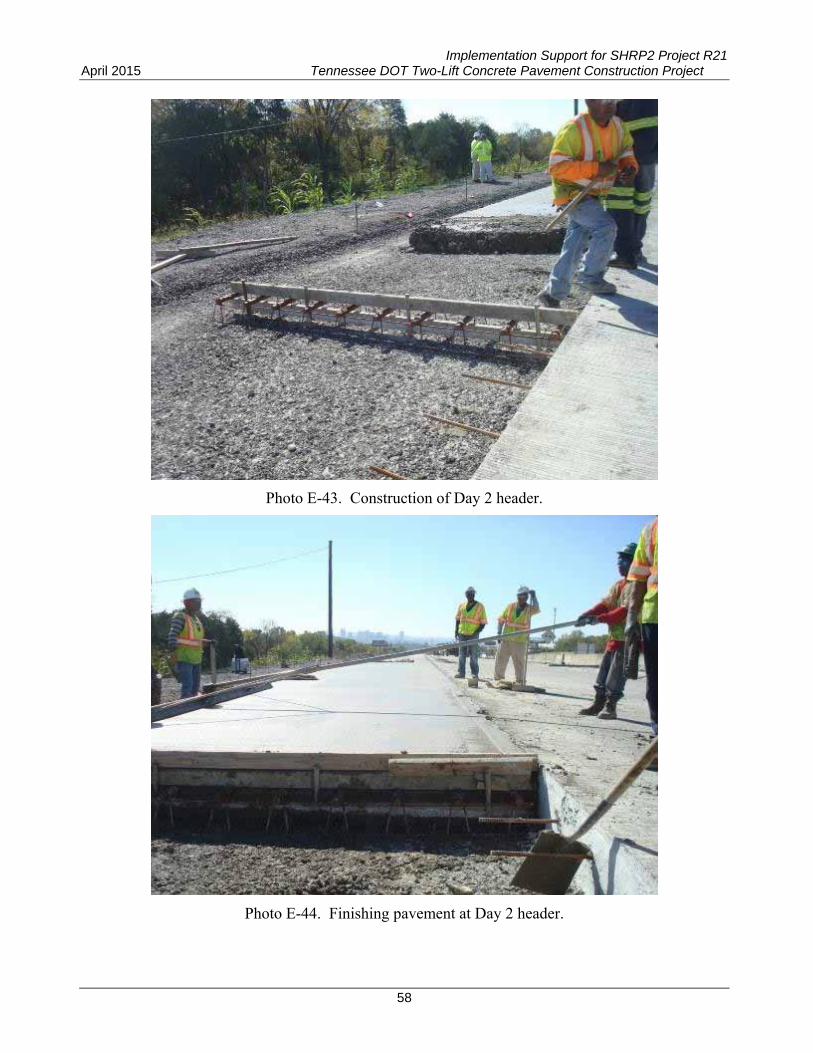
Photo E-43. Construction of Day 2 header.
Photo E-44. Finishing pavement at Day 2 header.
Implementation Support for SHRP2 Project R21 Tennessee DOT Two-Lift Concrete Pavement Construction Project April 2015
59
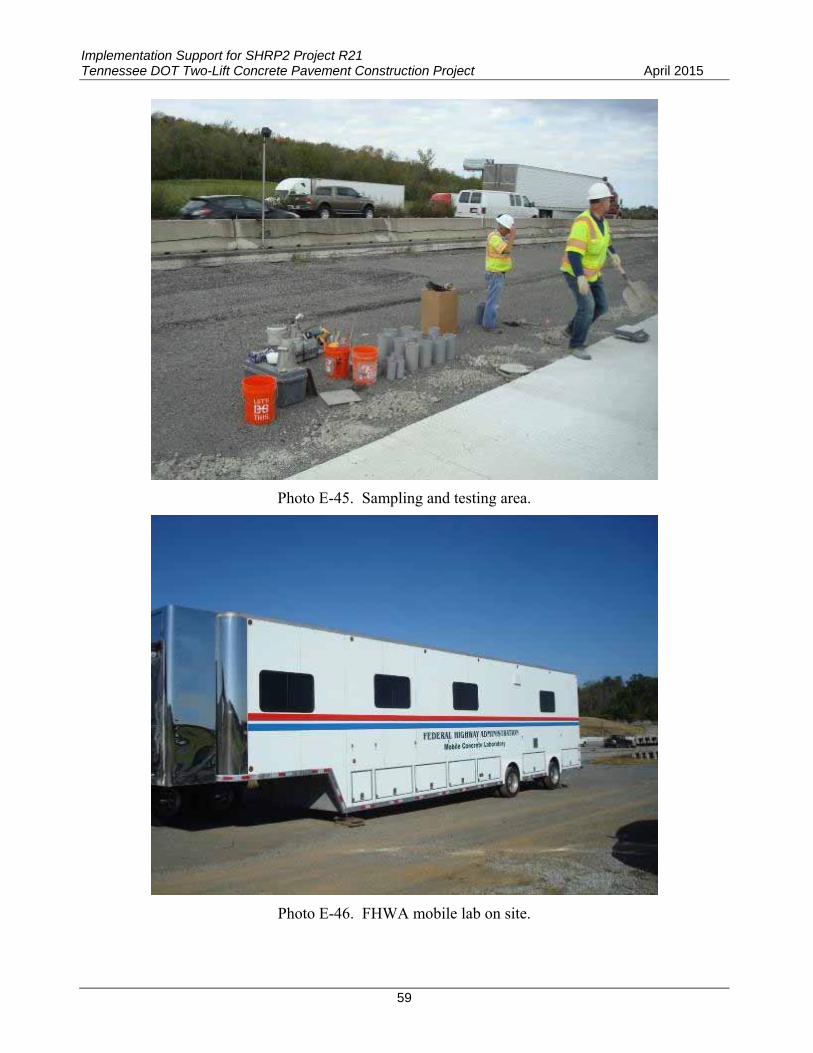
Photo E-45. Sampling and testing area.
Photo E-46. FHWA mobile lab on site.
Implementation Support for SHRP2 Project R21 April 2015 Tennessee DOT Two-Lift Concrete Pavement Construction Project
60
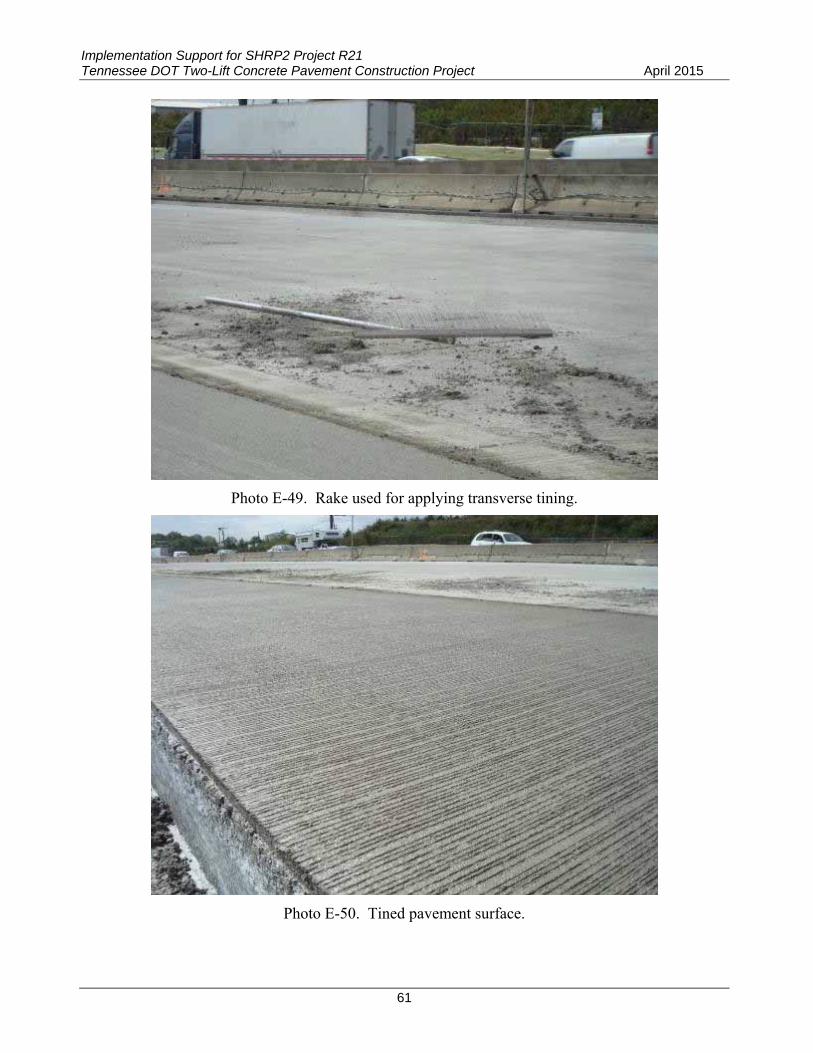
Photo E-47. Testing concrete using Super Air Meter (SAM).
Photo E-48. Workers using edging tools to create lane-shoulder joint.
Implementation Support for SHRP2 Project R21 Tennessee DOT Two-Lift Concrete Pavement Construction Project April 2015
61
Photo E-49. Rake used for applying transverse tining.
Photo E-50. Tined pavement surface.

Implementation Support for SHRP2 Project R21 April 2015 Tennessee DOT Two-Lift Concrete Pavement Construction Project
62
Photo E-51. Hand wand for applying cure compound to surface.
Photo E-52. Cure cart for surface applications.

Implementation Support for SHRP2 Project R21 Tennessee DOT Two-Lift Concrete Pavement Construction Project April 2015
63
Photo E-53. Shoulder appearance after typical cure application.
Photo E-54. “Garden sprayer” used for applying cure compound to outside shoulder edge.
Implementation Support for SHRP2 Project R21 April 2015 Tennessee DOT Two-Lift Concrete Pavement Construction Project
64
Photo E-55. Thermocouple/maturity sensor installation at south end of project.
Photo E-56. Saw used for cutting transverse joints.

Implementation Support for SHRP2 Project R21 Tennessee DOT Two-Lift Concrete Pavement Construction Project April 2015
65
Photo E-57. Activated transverse joint in two-lift pavement.

Implementation Support for SHRP2 Project R21 April 2015 Tennessee DOT Two-Lift Concrete Pavement Construction Project
66
Implementation Support for SHRP2 Project R21 Tennessee DOT Two-Lift Concrete Pavement Construction Project April 2015
67
APPENDIX F – FHWA MOBILE LAB SUMMARY REPORT
United States Department of Transportation
SUMMARY REPORT
I-65 Expansion & Composite Pavement Section
Nashville, TN October 2014
FHWA MCL Project # TN1406
Federal Highway Administration Office of Asset Management, Pavement and Construction HIAP-10 1200 New Jersey Avenue, SE Washington, DC 20590
Implementation Support for SHRP2 Project R21 April 2015 Tennessee DOT Two-Lift Concrete Pavement Construction Project
68
Table of Contents
INTRODUCTION ........................................................................................................................................................... 3
TEST PLAN and MCL’s Objective ............................................................................................................................... 4
TIMELINE........................................................................................................................................................................ 8
CONSTRUCTION ACTIVITIES ................................................................................................................................... 9
SAMPLING ................................................................................................................................................................... 11
SAMPLE CURING and TESTING ............................................................................................................................. 13
RESULTS ........................................................................................................................................................................ 13
1. Fresh Concrete Property Tests....................................................................................................................... 13
2. Compressive and Flexural Strengths ........................................................................................................... 16
3. Modulus of Elasticity and Poisson’s Ratio .................................................................................................. 18
4. Coefficient of Thermal Expansion ................................................................................................................ 19
5. Air Void Analyzer (AVA) .............................................................................................................................. 20
6. SUPER AIR METER (SAM) ........................................................................................................................... 21
7. Heat Signature (Calorimeter) ........................................................................................................................ 23
8. Permeability ..................................................................................................................................................... 25
9. MIT Scan -2 ...................................................................................................................................................... 31
10. MIT Scan T2 ...................................................................................................................................................... 34
CONCLUSIONS ........................................................................................................................................................... 36
SUMMARY .................................................................................................................................................................... 37
PERSONNEL ................................................................................................................................................................. 38
ACKNOWLEDGEMENTS .......................................................................................................................................... 38
REFERENCES ............................................................................................................................................................... 38
Appendix A: Mixture Designs .................................................................................................................................... 39
Appendix B: Aggregate Gradations .......................................................................................................................... 40
Appendix C: MIT Scan 2 Results ................................................................................................................................ 43
Implementation Support for SHRP2 Project R21 Tennessee DOT Two-Lift Concrete Pavement Construction Project April 2015
69
I-65 Reconstruction
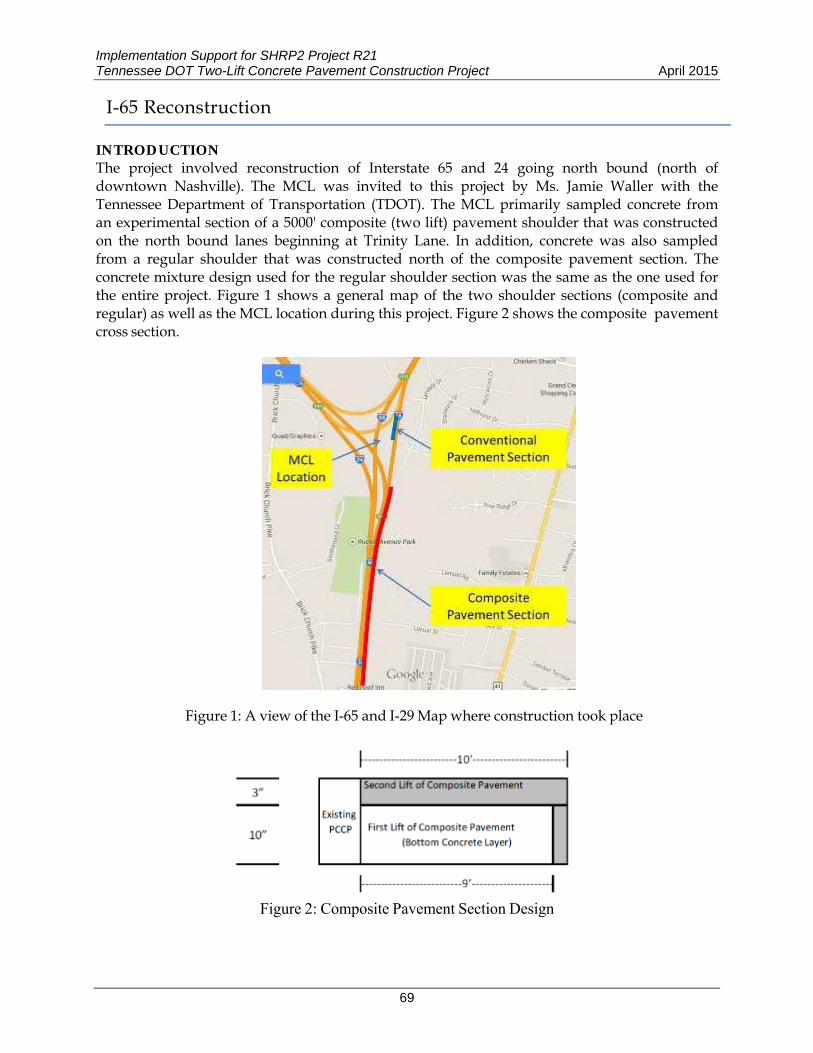
INTRODUCTION The project involved reconstruction of Interstate 65 and 24 going north bound (north of downtown Nashville). The MCL was invited to this project by Ms. Jamie Waller with the Tennessee Department of Transportation (TDOT). The MCL primarily sampled concrete from an experimental section of a 5000' composite (two lift) pavement shoulder that was constructed on the north bound lanes beginning at Trinity Lane. In addition, concrete was also sampled from a regular shoulder that was constructed north of the composite pavement section. The concrete mixture design used for the regular shoulder section was the same as the one used for the entire project. Figure 1 shows a general map of the two shoulder sections (composite and regular) as well as the MCL location during this project. Figure 2 shows the composite pavement cross section.
Figure 1: A view of the I-65 and I-29 Map where construction took place
Figure 2: Composite Pavement Section Design

Implementation Support for SHRP2 Project R21 April 2015 Tennessee DOT Two-Lift Concrete Pavement Construction Project
70
TEST PLAN and MCL’s Objective The primary objective of the MCL was to showcase and demonstrate best practices and new technologies related to concrete testing / concrete paving to TDOT. Additionally, data collected from this project was also intended to be used for teaching purposes in the FHWA sponsored workshops on Quality in the Concrete Paving Process. A test plan was prepared that included a combination of traditional and new tests. The following tests were performed by the MCL at the project site:
1. Fresh Concrete Properties (slump, air, unit weight, temperature) 2. Strength (compressive and flexural) 3. Modulus of Elasticity, Poisson’s Ratio 4. Coefficient of Thermal Expansion 5. AVA (Air Void Analyzer) 6. SAM (Super Air Meter) 7. Permeability (RCPT and Surface Resistivity) 8. Heat Signature (Calorimeter) 9. MIT Scan T2 (Pavement Thickness) 10. MIT Scan 2 (Dowel Alignment)
MATERIALS The Primary contractor for the project was Rogers Group. The paving subcontractor was APAC and the concrete producer was IMI. All the three mixtures for this project (conventional / regular mixture for the majority of the project and the two mixtures of the composite pavement section) were produced at the same plant. The plant is located approximately 10 miles from the job site. Figure 3 and 4 shows photos of the concrete plant and aggregate stockpiles respectively.
Table 1 shows the proportions for all three mixture designs. The cement content is the same in all three mixtures. All three mixtures also had Class C Fly Ash and Ground Granulated Blast Furnace Slag. However, the proportions of the supplementary cementitious materials were slightly higher for the top mixture of the composite pavement section (cementitious contents:
Figure 3: Concrete Batch Plant Figure 4: Stock Piles
Implementation Support for SHRP2 Project R21 Tennessee DOT Two-Lift Concrete Pavement Construction Project April 2015
71
conventional mixture: 526 lbs/yd3, bottom lift mixture: 526 lbs/yd3, top lift mixture: 571 lbs/yd3). From the aggregate standpoint, the fine aggregate in all three mixtures was from the same source and the proportions were similar. The source of coarse aggregate was similar for the conventional and top lift mixtures (Cross Plains, TN). The coarse aggregate for the bottom lift mixture was from Whites Creek, Nashville. The design air content for the top lift mixture was 6%, and it was 5% for the remaining two mixtures and the design unit weight was close to 3 pcf lighter than the other two mixtures.
Table 1: Mixture Design Proportions
Material Source Proportions Conventional Bottom Top
Cement, lbs / yd3
Cemex 289
(Type I/II) (Louisville)
289 (Type I)
(Knoxville)
289 (Type I)
(Knoxville) Fly Ash, lbs / yd3 HeadWaters, Quinton 105 105 113GGBFS, lbs /
yd3 Holcim, Chicago 132 132 169
Limestone, lbs / yd3
#4
Cross Plains, TN 940 --- #67 990 --- 1800#4
Whites Creek, TN --- 765 ---#67 --- 1150 ---
Natural Sand, lbs / yd3 Hunter Marine 1283 1290 1244Water, lbs / yd3 210 220 240Unit Weight, pcf 146.4 146.4 143.1 Design W/CM Ratio 0.4 0.42 0.42Design Air Content, % 5 5 6Required Comp. St @28 days, psi
3000
3000
3000
Design Number 14 086 14 280 14 281
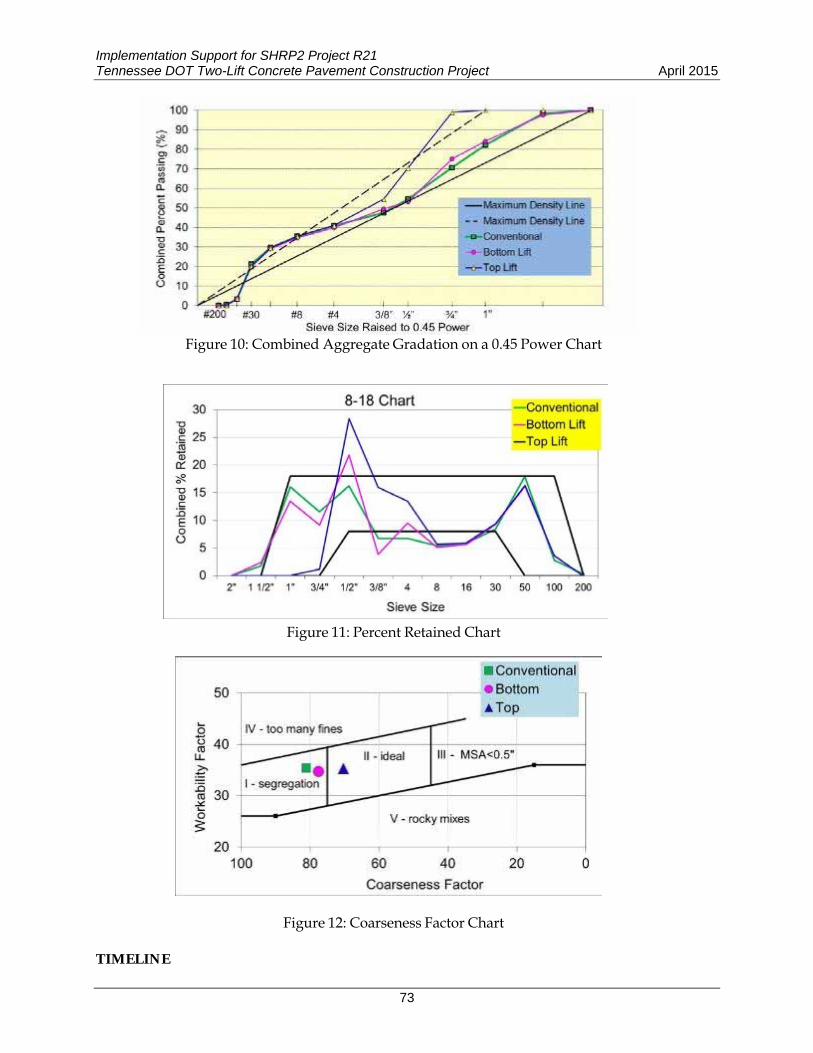
Figures 5-9 show pictures of the aggregates used in the three mixtures. Figures 10, 11, and 12 shows the combined aggregate passing on a 0.45 power chart, combined percent retained chart and workability factor and coarseness factor graph respectively. Each of these figures analyzes gradation from a different standpoint. Figure 10 shows that the gradation of the conventional and the bottom lift mixture are close (even though the source of the coarse aggregates is different). Also, the top lift mixture had lower maximum aggregate size (3/4”) compared to the other two. Figure 10 also shows that the top lift mixture is very gap graded. The combined percent retained chart (Figure 11) indicates that the aggregate gradation for the conventional and bottom lift mixtures had four and three sieves retained below the suggested 8% criteria. The aggregate gradation for the top lift mixture had deviated significantly from the “8-18” region. This is expected since the top lift mixture was a blend of only two aggregates compared to the three aggregates used for the conventional and
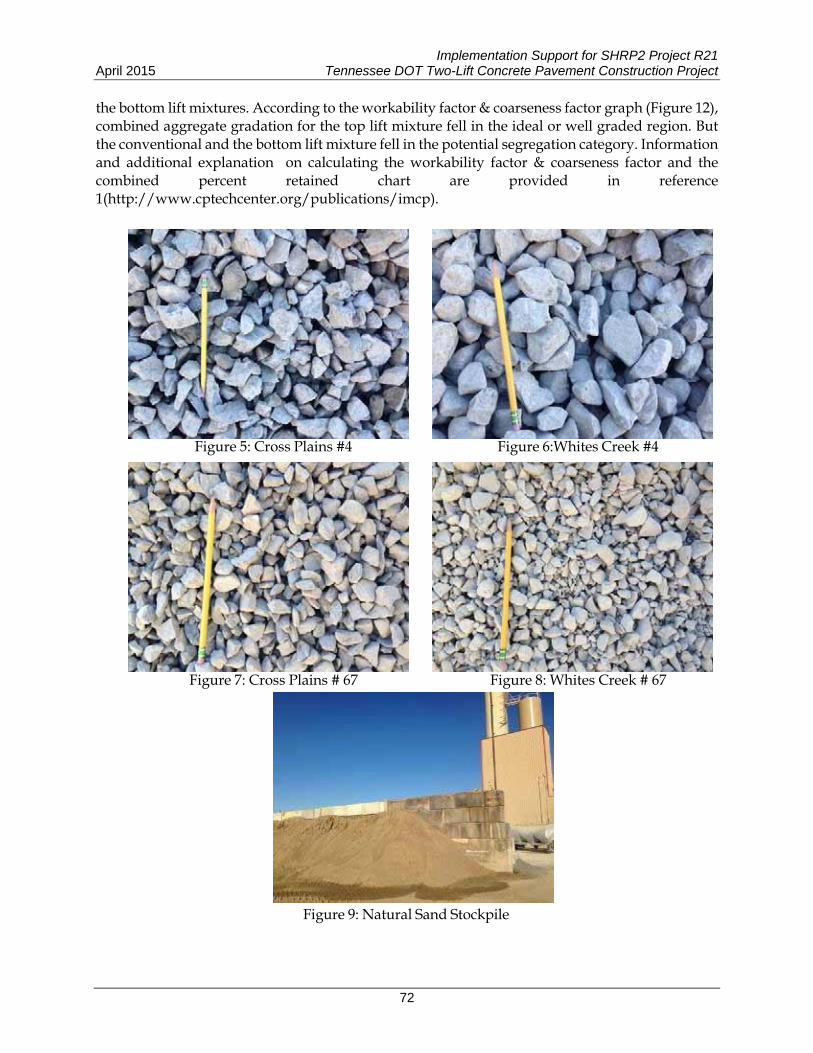
Implementation Support for SHRP2 Project R21 April 2015 Tennessee DOT Two-Lift Concrete Pavement Construction Project
72
the bottom lift mixtures. According to the workability factor & coarseness factor graph (Figure 12), combined aggregate gradation for the top lift mixture fell in the ideal or well graded region. But the conventional and the bottom lift mixture fell in the potential segregation category. Information and additional explanation on calculating the workability factor & coarseness factor and the combined percent retained chart are provided in reference 1(http://www.cptechcenter.org/publications/imcp).
Figure 5: Cross Plains #4 Figure 6:Whites Creek #4
Figure 7: Cross Plains # 67
Figure 8: Whites Creek # 67
Figure 9: Natural Sand Stockpile
Implementation Support for SHRP2 Project R21 Tennessee DOT Two-Lift Concrete Pavement Construction Project April 2015
73
Figure 10: Combined Aggregate Gradation on a 0.45 Power Chart
Figure 11: Percent Retained Chart
Figure 12: Coarseness Factor Chart
TIMELINE
Implementation Support for SHRP2 Project R21 April 2015 Tennessee DOT Two-Lift Concrete Pavement Construction Project
74
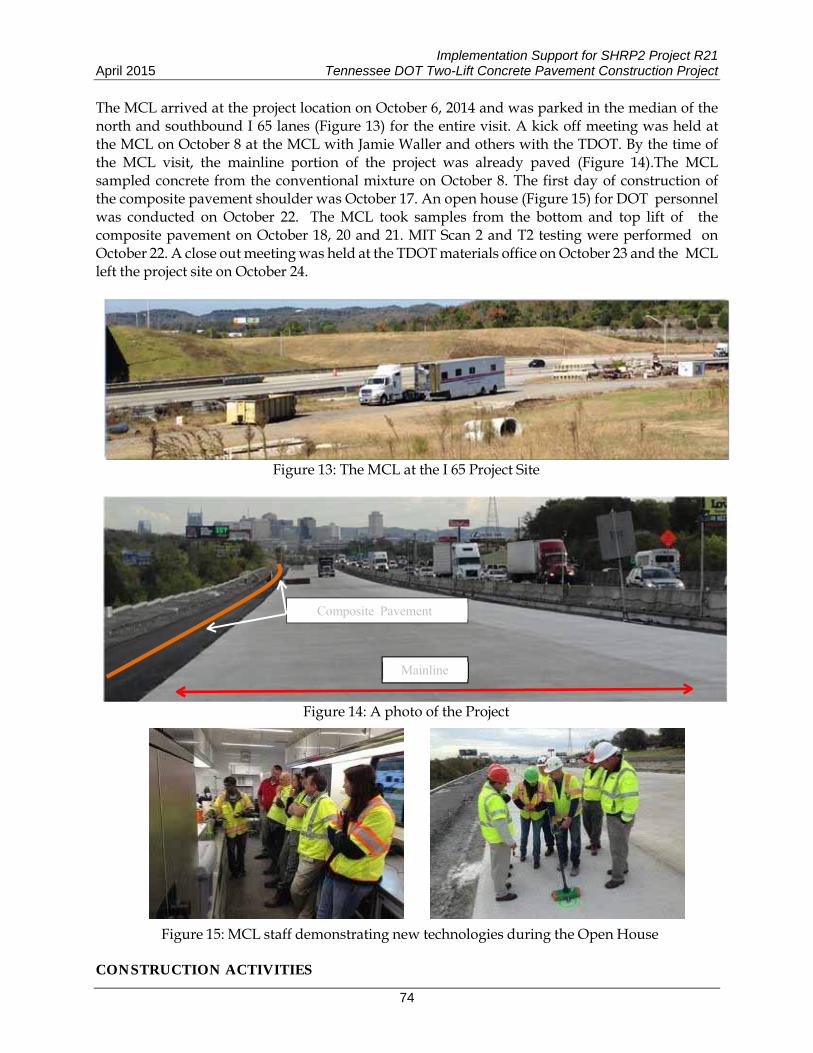
The MCL arrived at the project location on October 6, 2014 and was parked in the median of the north and southbound I 65 lanes (Figure 13) for the entire visit. A kick off meeting was held at the MCL on October 8 at the MCL with Jamie Waller and others with the TDOT. By the time of the MCL visit, the mainline portion of the project was already paved (Figure 14).The MCL sampled concrete from the conventional mixture on October 8. The first day of construction of the composite pavement shoulder was October 17. An open house (Figure 15) for DOT personnel was conducted on October 22. The MCL took samples from the bottom and top lift of the composite pavement on October 18, 20 and 21. MIT Scan 2 and T2 testing were performed on October 22. A close out meeting was held at the TDOT materials office on October 23 and the MCL left the project site on October 24.
Figure 13: The MCL at the I 65 Project Site
Figure 14: A photo of the Project
Composite Pavement
Mainline
Figure 15: MCL staff demonstrating new technologies during the Open House
CONSTRUCTION ACTIVITIES
Implementation Support for SHRP2 Project R21 Tennessee DOT Two-Lift Concrete Pavement Construction Project April 2015
75
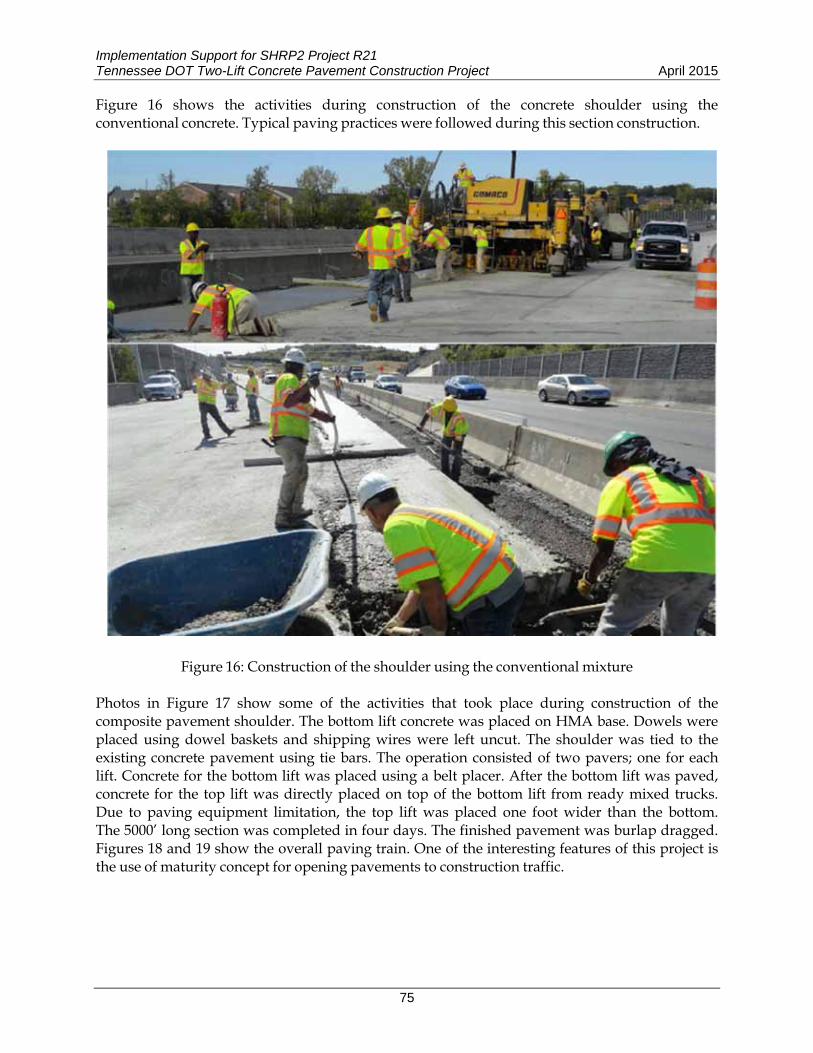
Figure 16 shows the activities during construction of the concrete shoulder using the conventional concrete. Typical paving practices were followed during this section construction.
Figure 16: Construction of the shoulder using the conventional mixture Photos in Figure 17 show some of the activities that took place during construction of the composite pavement shoulder. The bottom lift concrete was placed on HMA base. Dowels were placed using dowel baskets and shipping wires were left uncut. The shoulder was tied to the existing concrete pavement using tie bars. The operation consisted of two pavers; one for each lift. Concrete for the bottom lift was placed using a belt placer. After the bottom lift was paved, concrete for the top lift was directly placed on top of the bottom lift from ready mixed trucks. Due to paving equipment limitation, the top lift was placed one foot wider than the bottom. The 5000’ long section was completed in four days. The finished pavement was burlap dragged. Figures 18 and 19 show the overall paving train. One of the interesting features of this project is the use of maturity concept for opening pavements to construction traffic.
Implementation Support for SHRP2 Project R21 April 2015 Tennessee DOT Two-Lift Concrete Pavement Construction Project
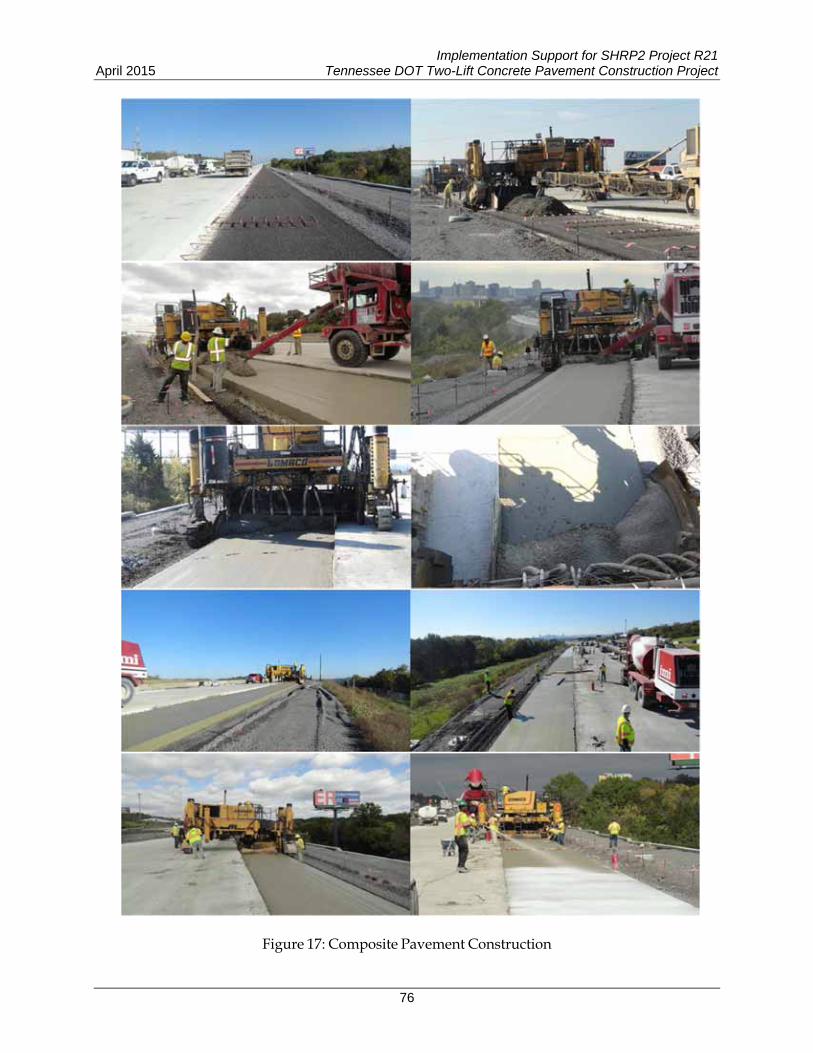
76
Figure 17: Composite Pavement Construction

Implementation Support for SHRP2 Project R21 Tennessee DOT Two-Lift Concrete Pavement Construction Project April 2015
77
SAMPLING All of the sampling performed by the MCL was on grade before the paver. Figure 20 shows the MCL sampling location and process. Table 2 shows the various tests that were run by the MCL.
In addition to the tests performed on the sampled concrete on the grade, the following work was also performed in the field: 1) MIT Scan T2 discs were placed on the base for measuring pavement thickness and 2) MIT Scan 2 was used to scan the alignment of dowel bars. Both of these activities took place at the composite pavement section.
Figure 18: Paving Train for the Composite Lift Pavement Construction
Figure 19: Paving Train for the Composite Lift Pavement Construction
Figure 20: Sampling on the Grade

Implementation Support for SHRP2 Project R21 April 2015 Tennessee DOT Two-Lift Concrete Pavement Construction Project
78

Implementation Support for SHRP2 Project R21 Tennessee DOT Two-Lift Concrete Pavement Construction Project April 2015
79
SAMPLE CURING and TESTING Specimens cast from each day of paving were left overnight at the sampling site (after covering them with lids or wet burlap and plastic). The following day, specimens were demolded, and stored in the MCL curing tanks. Depending on testing age requirement, some specimens were tested when the MCL was in the field, in transit, and the remaining specimens were tested at the TFHRC (The MCL’s duty station when not on travel). RESULTS
1. Fresh Concrete Property Tests Fresh concrete properties; unit weight (AASHTO T121/ASTM C 138), air content (AASHTO T 152/ASTM C231), slump (AASHTO T119/ASTM C143), and temperature (AASHTO T309/ASTM C1064) were measured for 16 samples (including conventional, bottom and top mixtures) and the results are presented in Table 3 and in graphical format in Figures 21 through 25.
Table 3: Fresh Concrete Properties
S. No.
Sample ID
Mixture
Date
Time
Slump, inches
Conc. Temp,
F
Unit Weight, pcf
Air Content,
%1 1-1
Convent ional
10/8 12:25 p.m. 0.5 75 145.8 3.9%2 1-2 10/8 1:37 p.m. 1.5 75 144.8 4.3%3 1-3 10/8 3:31 p.m. 1.5 75 145.6 4.3%
4 2-1
Bottom Lift
Mixture
10/18 9:57 a.m. 0.25 63 148.7 4.3%7 2-4 10/18 2:30 p.m. 0.25 69 148.8 3.9%8 2-5 10/18 3:06 p.m. 1.0 69 148.2 4.9%10 3-1 10/20 10:33 a.m. 0.75 64 146.3 5.0%11 3-2 10/20 1:37 p.m. 1.0 67 147.1 5.1%12 3-3 10/20 3:35 p.m. 1.5 66 145.8 5.1%14 4-1 10/21 8:21 a.m. 0.75 64 148.0 5.1%15 4-2 10/21 9:36 a.m. 0.75 64 147.6 4.7%
5 2-2
Top Lift Mixture
10/18 10:42 a.m. 3.0 68 143.8 4.9%6 2-3 10/18 11:43 a.m. 2.5 73 143.9 4.9%9 2-6 10/18 3:43 p.m. 3.0 69 144.6 5.2%13 3-4 10/20 4:45 p.m. 2.5 75 143.4 5.1%16 4-3 10/21 10:50 a.m. 2.0 72 143.1 4.9%
Specification Requirement 0-3” max
90 F Max
6±2%
The unit weight of fresh concrete is a good indicator of batch-to-batch uniformity and can also be used to check weights and proportioning equipment. A variability of more than 3 pcf is typically considered significant. The green line shown in Figure 21 is the mixture design target unit weight. The target unit weight of the top lift was lower than the conventional and bottom lift. Upper and lower limits shown in Figure 21 are three pcf above and below the target unit weight value.

Implementation Support for SHRP2 Project R21 April 2015 Tennessee DOT Two-Lift Concrete Pavement Construction Project
80
Overall, the unit weight of the conventional and the top lift mixtures were consistent and close to the target unit weight. The unit weight of the bottom lift mixture had some variability; however, these fluctuations in unit weight were well within the ± 3 pcf which is typically considered significant.
Figure 21: Control Chart – Unit Weight
Figure 22 shows air content results for the 16 samples. The target air content for the conventional and the bottom lift mixtures was 5%, while the target for the top lift was 6%. The lower and upper limits were ± 2% from the target. The air contents for all the three mixtures were at or slightly below the target.
Figure 22: Control Chart - Air Content at plant
Figure 23 (a,b,c) show a plot of unit weight and air content for all the conventional, bottom lift and top lift mixture samples separately. As expected, unit weight and air content follow a relatively close trend for the conventional mixture. From this it can be inferred that the changes in unit weight were potentially due to changes in air content and not due to other changes in the mixture. For the bottom lifts mixture, only a few data points for unit weight and air content
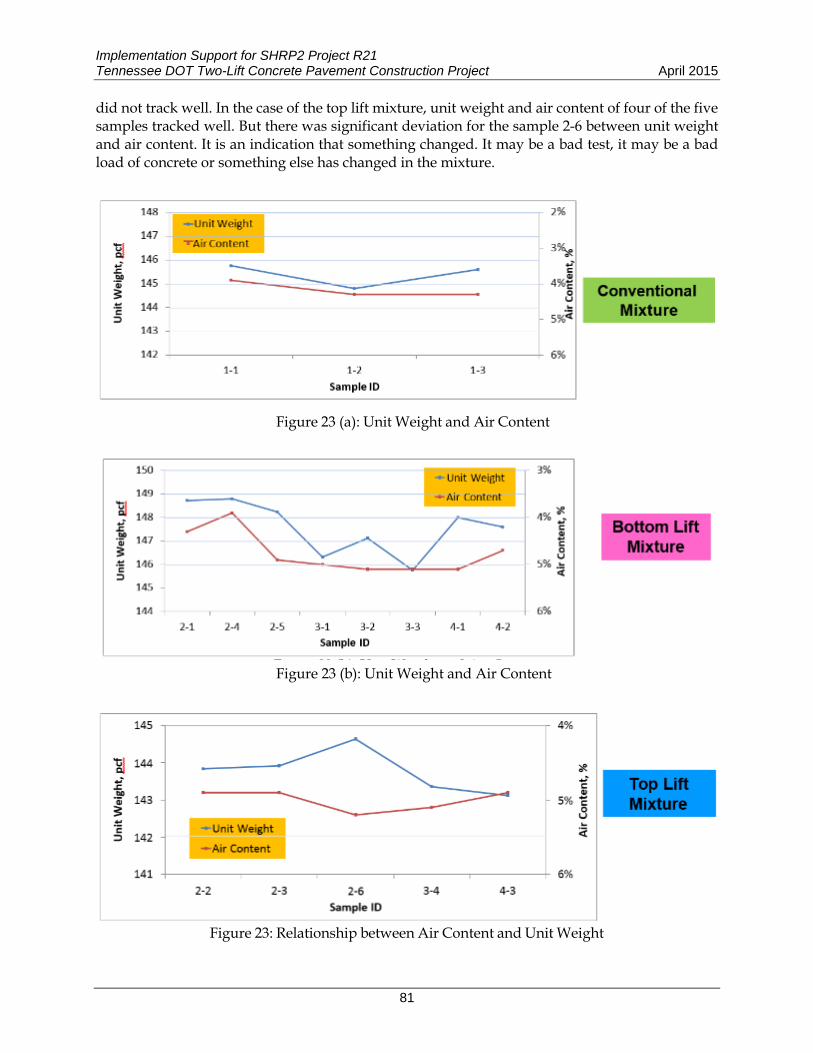
Implementation Support for SHRP2 Project R21 Tennessee DOT Two-Lift Concrete Pavement Construction Project April 2015
81
did not track well. In the case of the top lift mixture, unit weight and air content of four of the five samples tracked well. But there was significant deviation for the sample 2-6 between unit weight and air content. It is an indication that something changed. It may be a bad test, it may be a bad load of concrete or something else has changed in the mixture.
Figure 23 (a): Unit Weight and Air Content
Figure 23 (b): Unit Weight and Air Content
Figure 23: Relationship between Air Content and Unit Weight
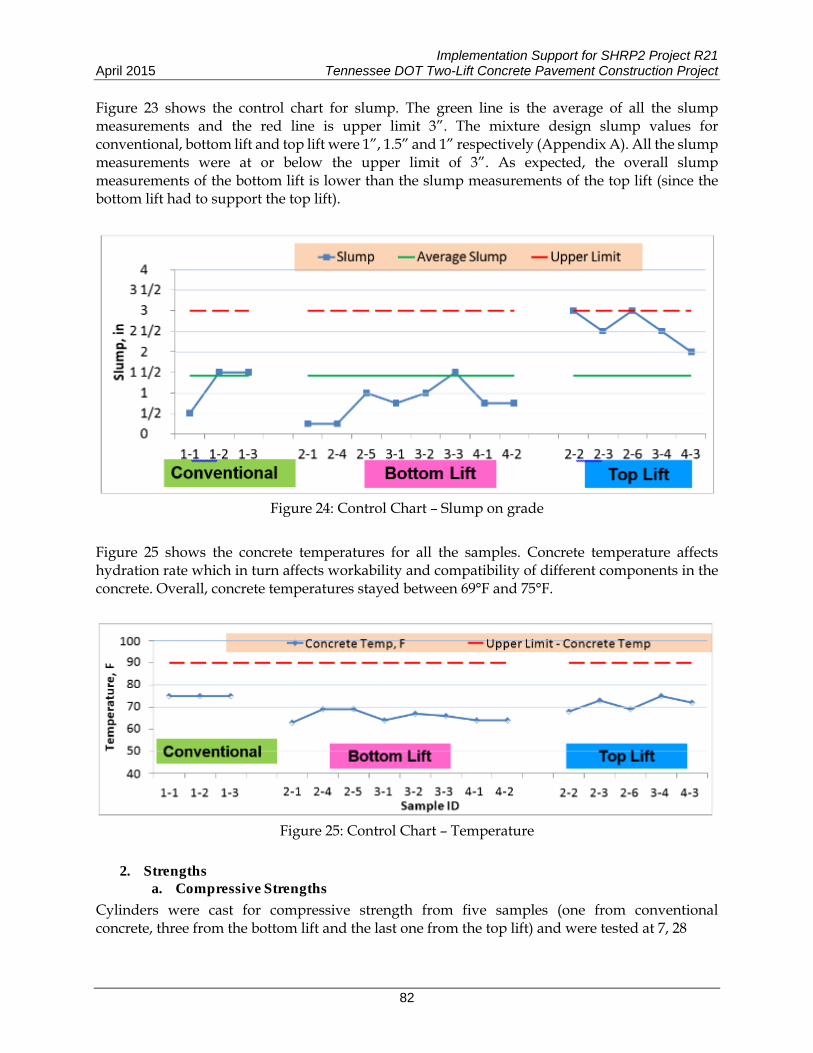
Implementation Support for SHRP2 Project R21 April 2015 Tennessee DOT Two-Lift Concrete Pavement Construction Project
82
Figure 23 shows the control chart for slump. The green line is the average of all the slump measurements and the red line is upper limit 3”. The mixture design slump values for conventional, bottom lift and top lift were 1”, 1.5” and 1” respectively (Appendix A). All the slump measurements were at or below the upper limit of 3”. As expected, the overall slump measurements of the bottom lift is lower than the slump measurements of the top lift (since the bottom lift had to support the top lift).
Figure 24: Control Chart – Slump on grade
Figure 25 shows the concrete temperatures for all the samples. Concrete temperature affects hydration rate which in turn affects workability and compatibility of different components in the concrete. Overall, concrete temperatures stayed between 69°F and 75°F.
Figure 25: Control Chart – Temperature
2. Strengths
a. Compressive Strengths Cylinders were cast for compressive strength from five samples (one from conventional concrete, three from the bottom lift and the last one from the top lift) and were tested at 7, 28
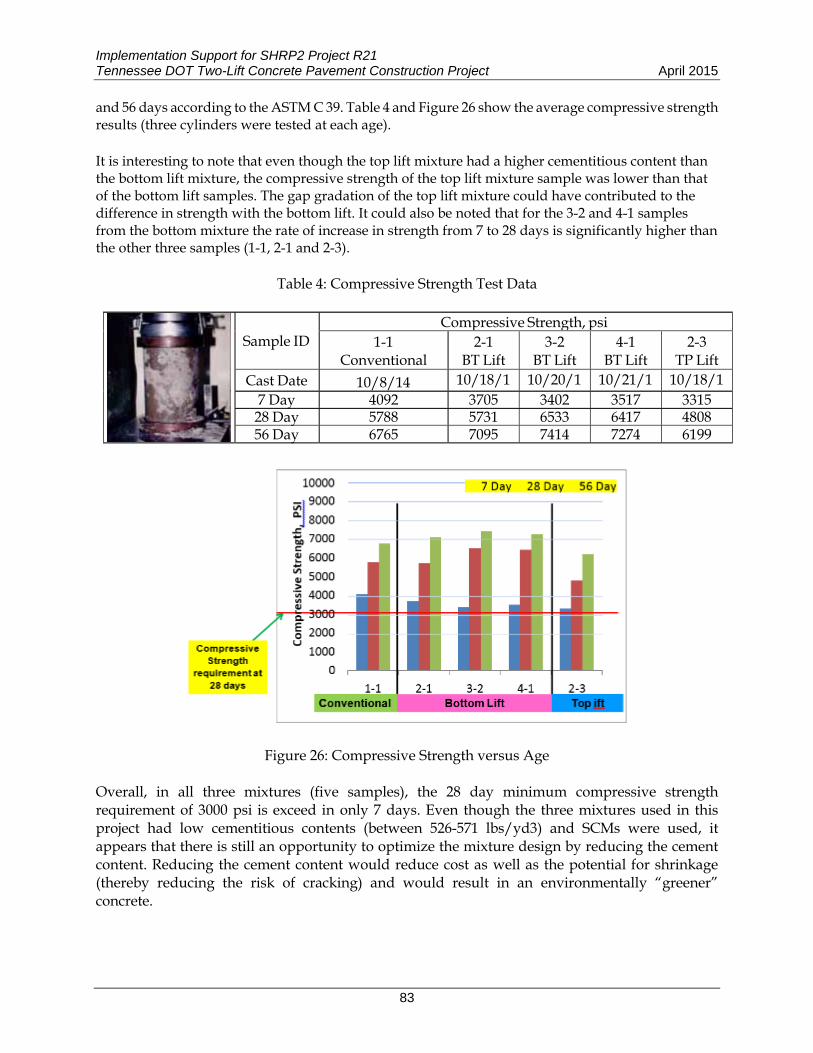
Implementation Support for SHRP2 Project R21 Tennessee DOT Two-Lift Concrete Pavement Construction Project April 2015
83
and 56 days according to the ASTM C 39. Table 4 and Figure 26 show the average compressive strength results (three cylinders were tested at each age). It is interesting to note that even though the top lift mixture had a higher cementitious content than the bottom lift mixture, the compressive strength of the top lift mixture sample was lower than that of the bottom lift samples. The gap gradation of the top lift mixture could have contributed to the difference in strength with the bottom lift. It could also be noted that for the 3-2 and 4-1 samples from the bottom mixture the rate of increase in strength from 7 to 28 days is significantly higher than the other three samples (1-1, 2-1 and 2-3).
Table 4: Compressive Strength Test Data
Compressive Strength, psi Sample ID 1-1 2-1 3-2 4-1 2-3
Conventional BT Lift BT Lift BT Lift TP Lift Cast Date 10/8/14
7 Day 4092 3705 3402 3517 331528 Day 5788 5731 6533 6417 480856 Day 6765 7095 7414 7274 6199
10/18/1 10/20/1 10/21/1 10/18/1
Figure 26: Compressive Strength versus Age Overall, in all three mixtures (five samples), the 28 day minimum compressive strength requirement of 3000 psi is exceed in only 7 days. Even though the three mixtures used in this project had low cementitious contents (between 526-571 lbs/yd3) and SCMs were used, it appears that there is still an opportunity to optimize the mixture design by reducing the cement content. Reducing the cement content would reduce cost as well as the potential for shrinkage (thereby reducing the risk of cracking) and would result in an environmentally “greener” concrete.

Implementation Support for SHRP2 Project R21 April 2015 Tennessee DOT Two-Lift Concrete Pavement Construction Project
84
b. Flexural Strengths A set of three beams were cast from the top and bottom lift mixtures from sample 4-2 and 4-3 respectively. The 28 day flexural strengths using the third point method for these beams is shown in Table 5 and Figure 27. Similar to the compressive strength data, the bottom lift mixture had higher flexural strength compared to the top lift mixture.
Table 5: Average Flexural Strengths based on center point loading
Sample ID
Cast Date
Age, Days
Flexural Strength,
psi
COV, %
4-2 (Bottom Lift) 10/21/14 28 797 4.3
4-3 (Top Lift) 10/21/14 28 650 3.4
Figure 27: Flexural Strengths
3. Modulus of Elasticity and Poisson’s Ratio
Table 6 and Figure 28 shows the modulus of elasticity and Poisson’s ratio for cylinders cast from the bottom lift and top lift mixtures. Modulus of elasticity is a level 1 material input for the AASHTO Pavement ME Design™ software. The modulus of elasticity and Poisson’s ratio are higher for the bottom lift mixture compared to the top lift mixtures.
Table 6: Modulus of Elasticity and Poisson’s Ratio
Sample ID Mixture Modulus of Elasticity (E),psi Poisson's Ratio (µ)
3,834,955 0.18 Top Lift 2-3 3,856,635 0.19 Average 3,845,795 0.18
Bottom 4,741,770 0.23 3-2 Lift 4,702,134 0.22
Average 4,721,952 0.23

Implementation Support for SHRP2 Project R21 Tennessee DOT Two-Lift Concrete Pavement Construction Project April 2015
85
Figure 28: Modulus of Elasticity and Poisson’s Ratio
4. Coefficient of Thermal Expansion Coefficient of Thermal Expansion (CTE) is a level 1 material input for the AASHTO Pavement ME Design™ software. The coefficient of thermal expansion is a parameter that quantifies the extent with which a material changes length in response to changes in temperature. The CTE is the length change per unit length per unit temperature – microstrain/0C for example. CTE has a large impact on the performance of concrete pavements because a uniform temperature change will affect the opening/closing of joints and a temperature gradient through the thickness of the slab will produce curling of the slab. Accurate measurements of CTE will allow for better estimates of slab movement and stress development due to temperature changes. With the recent release of the AASHTO Pavement ME Design™ software, there will be a greater emphasis on using CTE of concrete for pavement design since several research studies have shown CTE to have a significant impact on pavement design. In this project, the MCL cast a 4x8” cylinder from some samples to measure CTE. Table 7 shows the CTE data and the testing age for all three mixtures. The CTE of the top lift and conventional mixtures is similar and is significantly higher than that of the bottom lift mixture. It is well documented in literature that CTE is heavily influenced by the aggregate type. The quantity and source of fine aggregate (natural sand from Hunter Marine, TN) is the same for all the three mixture in this project. The coarse aggregate geology used in all three mixtures is limestone. However, the source of the limestone for the conventional and top lift mixtures was Cross Plains which is 30 miles north of the coarse aggregate source of the bottom lift mixture which is White Creek, TN. This could potentially be the reason for the big difference in CTE between the mixtures. These results illustrate how CTE can be different for aggregates with the same geology within a state and show the importance of using measured CTE values instead of using typical values when designing pavements using the new AASHTO Pavement ME Design™ software.
Table 7: Coefficient of Thermal Expansion per AASHTO T 336

Implementation Support for SHRP2 Project R21 April 2015 Tennessee DOT Two-Lift Concrete Pavement Construction Project
86
ample ID
Mixture
Age, Days
CTE
Microstrain/°C
Coarse Aggregate
Source
Coarse Aggregate Geological
Characteristic
1-1 Conventional Mixture
89 9.9 Cross Plains,
TN
Limestone
1-2 90 9.9
2-1 Bottom Lift Mixture
75 8.3 White Creek, TN 3-2 77 8
2-3 Top Lift Mixture
75 9.7 Cross Plains,
TN 4-3 78 9.9 Note: A Titanium specimen with a CTE of 9.0 microstrain/⁰F was used as the calibration specimen for CTE testing. For use in MEPDG as well as the current version of the AASHTO Pavement ME Design™), the CTE values shown in Table 7 should be increased by 1.5 microstrain/⁰C (for example, 8 +1.5=9.5 microstrain/⁰C) in order to account for LTTP CTE values used to calibrate the models in the current version of the AASHTO Pavement ME Design™ software.
5. Air Void Analyzer (AVA) The presence of closely spaced air voids in concrete is recognized as the primary factor in improving the freeze-thaw durability of concrete. Normal tests performed on fresh content provide information on the total air content of the sample, but do not give any indication of the quality of the air void system. Petrographic methods are normally used to determine the spacing and specific surface of hardened samples, but the petrographic analysis process takes many days and therefore is of little value in controlling concrete during construction. The MCL is equipped with an efficient, real-time method of determining the distribution of air voids in fresh concrete. The Air Void Analyzer (AVA) releases air from a fresh concrete sample and measures the quantity of air rising in a water column. From this information, the air void parameters, such as spacing factor (SF) and specific surface (SS), can be calculated. A provisional test method was adopted by AASHTO in 2008 entitled AASHTO TP 75-08 “Air- Void Characteristics of Freshly Mixed Concrete By Buoyancy change”. This provisional test method is based on the Air Void Analyzer. For the purpose of AVA testing in this project a 6”x12”cylinder was cast from the top lift mixture and an AVA sample was taken from this cylinder. Figure 29 shows the MCL personnel taking an AVA sample from a cylinder. Figure 30 shows a picture of the AVA.
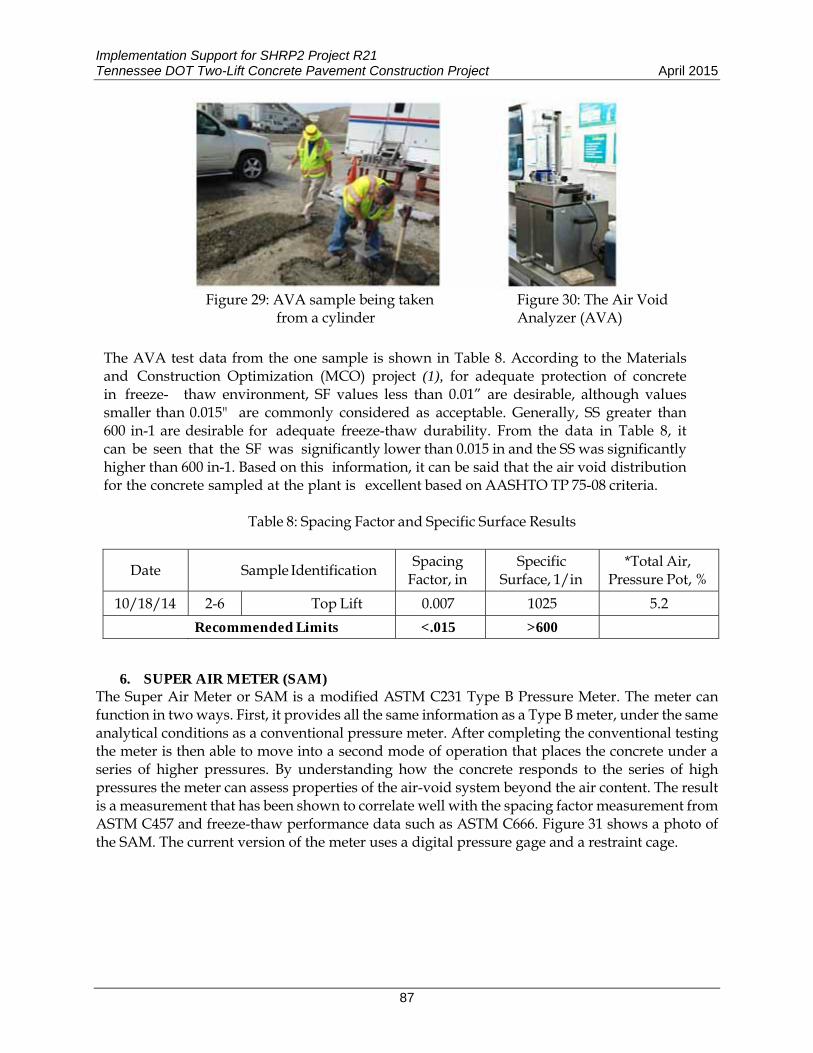
Implementation Support for SHRP2 Project R21 Tennessee DOT Two-Lift Concrete Pavement Construction Project April 2015
87
Figure 29: AVA sample being taken
from a cylinder Figure 30: The Air Void Analyzer (AVA)
The AVA test data from the one sample is shown in Table 8. According to the Materials and Construction Optimization (MCO) project (1), for adequate protection of concrete in freeze- thaw environment, SF values less than 0.01” are desirable, although values smaller than 0.015" are commonly considered as acceptable. Generally, SS greater than 600 in-1 are desirable for adequate freeze-thaw durability. From the data in Table 8, it can be seen that the SF was significantly lower than 0.015 in and the SS was significantly higher than 600 in-1. Based on this information, it can be said that the air void distribution for the concrete sampled at the plant is excellent based on AASHTO TP 75-08 criteria.
Table 8: Spacing Factor and Specific Surface Results
Spacing Specific *Total Air,
Date Sample Identification Factor, in Surface, 1/in Pressure Pot, %
10/18/14 2-6 Top Lift 0.007 1025 5.2
Recommended Limits <.015 >600
6. SUPER AIR METER (SAM) The Super Air Meter or SAM is a modified ASTM C231 Type B Pressure Meter. The meter can function in two ways. First, it provides all the same information as a Type B meter, under the same analytical conditions as a conventional pressure meter. After completing the conventional testing the meter is then able to move into a second mode of operation that places the concrete under a series of higher pressures. By understanding how the concrete responds to the series of high pressures the meter can assess properties of the air-void system beyond the air content. The result is a measurement that has been shown to correlate well with the spacing factor measurement from ASTM C457 and freeze-thaw performance data such as ASTM C666. Figure 31 shows a photo of the SAM. The current version of the meter uses a digital pressure gage and a restraint cage.

Implementation Support for SHRP2 Project R21 April 2015 Tennessee DOT Two-Lift Concrete Pavement Construction Project
88
Figure 31: The SAM meter
To run the test, concrete is placed and consolidated similar to running a typical ASTM C231 test. However with this test, the test is run multiple times without releasing the pressure in the bottom bowl. The test takes just over 10 minutes to run and provides immediate information about the air void quality in the fresh concrete. This is especially useful to evaluate a concrete mixture before and after a paver, or a pump and for investigation of concrete mixtures with a number of admixtures. The FHWA is currently evaluating the SAM by using it in several field projects across the country. In this project, four SAM tests were conducted; two from the top lift mixture and two from the bottom lift mixture (Figure 32). These results are presented in Table 9 and Figure 33. Based on the research at Oklahoma State University, SAM number of 0.2 or lower is classified as a “GOOD” air void system. All the four samples from this project have SAM numbers below or close to the SAM number of 0.2 which indicates that the air void system for both the concrete mixtures is good.
Figure 32: MCL Staff performing the SAM test

Implementation Support for SHRP2 Project R21 Tennessee DOT Two-Lift Concrete Pavement Construction Project April 2015
89
Table 9: The SAM Test Results
Sample 2-6 (Top) Sample 3-3 (Bottom) Sample 4-2 (Bottom) Sample 4-3 (Top) Step I Step II Step I Step II Step I Step II Step I Step II
14.5 7.8 7.92 7.57 7.63 8.08 8.2 8.06 8.14SAM Pressure Level,
30 19.45 19.62 18.94 19.08 20.03 20.22 19.78 19.98psi
45 32.7 32.92 32.11 32.24 33.52 33.73 33.17 33.420.22 0.13 0.21 0.25
Improved air content (%) SAM Number 0.22 0.13 0.21 0.25
Classification of Air Void System
Figure 33: The Super Air Meter (SAM) Test Results The SAM is a state of the art technology for measuring the air void system of fresh concrete. As mentioned previously, the MCL is currently evaluating the SAM by using it in several field projects and correlating SAM data with Freeze-Thaw and Hardened Air Content Test (ASTM C457) tests. The SAM has the potential to revolutionize the way air is tested in concrete. Some of the advantages of SAM are its ease of use, economical, rapid results, and field implementable.
7. Heat Signature (Calorimeter) The hydration of cementitious materials results in a number of exothermic chemical reactions. These reactions can be monitored by measuring the total heat liberated over time. The heat generated during early hydration reactions of cementitious materials can be measured using a calorimeter. F-Cal® is a commercially available Semi-Adiabatic calorimeter that can be used in the field to monitor the hydration reactions. Figure 34 shows a picture of a commercially available calorimeter.
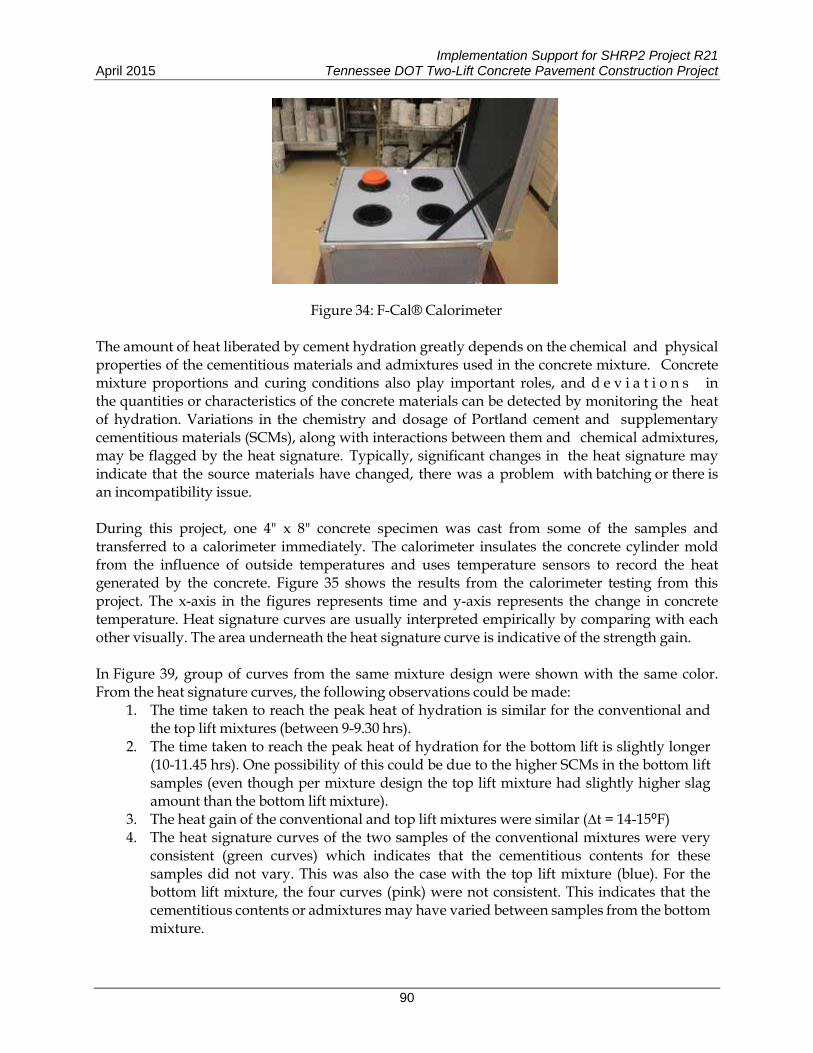
Implementation Support for SHRP2 Project R21 April 2015 Tennessee DOT Two-Lift Concrete Pavement Construction Project
90
Figure 34: F-Cal® Calorimeter
The amount of heat liberated by cement hydration greatly depends on the chemical and physical properties of the cementitious materials and admixtures used in the concrete mixture. Concrete mixture proportions and curing conditions also play important roles, and d e v i a t i o n s in the quantities or characteristics of the concrete materials can be detected by monitoring the heat of hydration. Variations in the chemistry and dosage of Portland cement and supplementary cementitious materials (SCMs), along with interactions between them and chemical admixtures, may be flagged by the heat signature. Typically, significant changes in the heat signature may indicate that the source materials have changed, there was a problem with batching or there is an incompatibility issue. During this project, one 4" x 8" concrete specimen was cast from some of the samples and transferred to a calorimeter immediately. The calorimeter insulates the concrete cylinder mold from the influence of outside temperatures and uses temperature sensors to record the heat generated by the concrete. Figure 35 shows the results from the calorimeter testing from this project. The x-axis in the figures represents time and y-axis represents the change in concrete temperature. Heat signature curves are usually interpreted empirically by comparing with each other visually. The area underneath the heat signature curve is indicative of the strength gain. In Figure 39, group of curves from the same mixture design were shown with the same color. From the heat signature curves, the following observations could be made:
1. The time taken to reach the peak heat of hydration is similar for the conventional and the top lift mixtures (between 9-9.30 hrs).
2. The time taken to reach the peak heat of hydration for the bottom lift is slightly longer (10-11.45 hrs). One possibility of this could be due to the higher SCMs in the bottom lift samples (even though per mixture design the top lift mixture had slightly higher slag amount than the bottom lift mixture).
3. The heat gain of the conventional and top lift mixtures were similar (∆t = 14-15⁰F) 4. The heat signature curves of the two samples of the conventional mixtures were very
consistent (green curves) which indicates that the cementitious contents for these samples did not vary. This was also the case with the top lift mixture (blue). For the bottom lift mixture, the four curves (pink) were not consistent. This indicates that the cementitious contents or admixtures may have varied between samples from the bottom mixture.
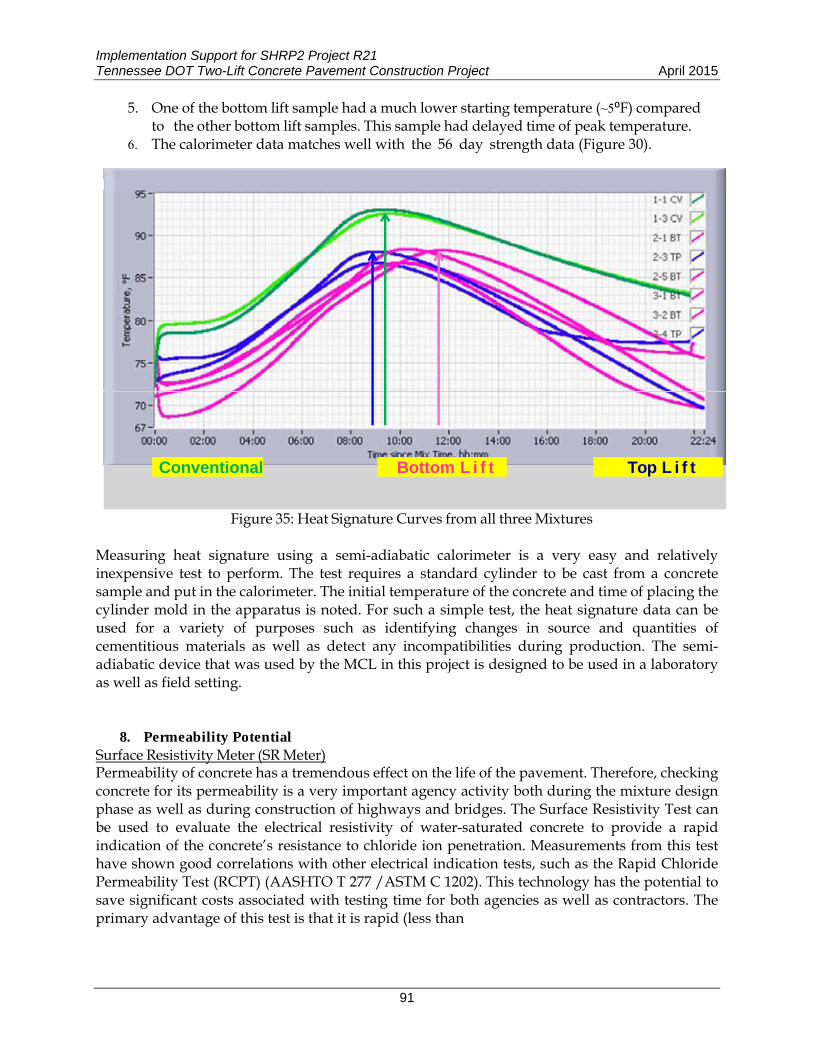
Implementation Support for SHRP2 Project R21 Tennessee DOT Two-Lift Concrete Pavement Construction Project April 2015
91
5. One of the bottom lift sample had a much lower starting temperature (~5⁰F) compared to the other bottom lift samples. This sample had delayed time of peak temperature.
6. The calorimeter data matches well with the 56 day strength data (Figure 30).
Conventional Bottom L i f t Top L i f t
Figure 35: Heat Signature Curves from all three Mixtures Measuring heat signature using a semi-adiabatic calorimeter is a very easy and relatively inexpensive test to perform. The test requires a standard cylinder to be cast from a concrete sample and put in the calorimeter. The initial temperature of the concrete and time of placing the cylinder mold in the apparatus is noted. For such a simple test, the heat signature data can be used for a variety of purposes such as identifying changes in source and quantities of cementitious materials as well as detect any incompatibilities during production. The semi- adiabatic device that was used by the MCL in this project is designed to be used in a laboratory as well as field setting.
8. Permeability Potential Surface Resistivity Meter (SR Meter) Permeability of concrete has a tremendous effect on the life of the pavement. Therefore, checking concrete for its permeability is a very important agency activity both during the mixture design phase as well as during construction of highways and bridges. The Surface Resistivity Test can be used to evaluate the electrical resistivity of water-saturated concrete to provide a rapid indication of the concrete’s resistance to chloride ion penetration. Measurements from this test have shown good correlations with other electrical indication tests, such as the Rapid Chloride Permeability Test (RCPT) (AASHTO T 277 /ASTM C 1202). This technology has the potential to save significant costs associated with testing time for both agencies as well as contractors. The primary advantage of this test is that it is rapid (less than
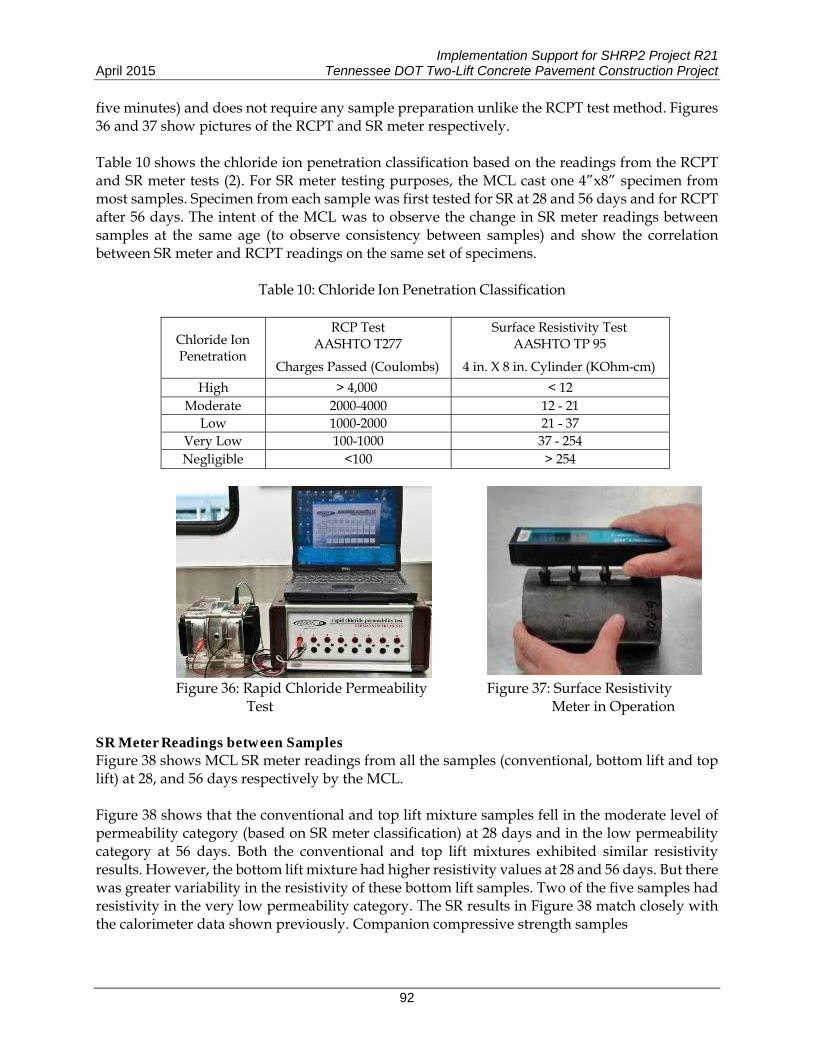
Implementation Support for SHRP2 Project R21 April 2015 Tennessee DOT Two-Lift Concrete Pavement Construction Project
92
five minutes) and does not require any sample preparation unlike the RCPT test method. Figures 36 and 37 show pictures of the RCPT and SR meter respectively. Table 10 shows the chloride ion penetration classification based on the readings from the RCPT and SR meter tests (2). For SR meter testing purposes, the MCL cast one 4”x8” specimen from most samples. Specimen from each sample was first tested for SR at 28 and 56 days and for RCPT after 56 days. The intent of the MCL was to observe the change in SR meter readings between samples at the same age (to observe consistency between samples) and show the correlation between SR meter and RCPT readings on the same set of specimens.
Table 10: Chloride Ion Penetration Classification
Chloride Ion Penetration
RCP Test AASHTO T277
Charges Passed (Coulombs) 4 in.
Surface Resistivity Test AASHTO TP 95
X 8 in. Cylinder (KOhm-cm)
High > 4,000 < 12 Moderate 2000-4000 12 - 21
Low 1000-2000 21 - 37 Very Low 100-1000 37 - 254 Negligible <100 > 254
Figure 36: Rapid Chloride Permeability
Test
Figure 37: Surface Resistivity
Meter in Operation SR Meter Readings between Samples Figure 38 shows MCL SR meter readings from all the samples (conventional, bottom lift and top lift) at 28, and 56 days respectively by the MCL. Figure 38 shows that the conventional and top lift mixture samples fell in the moderate level of permeability category (based on SR meter classification) at 28 days and in the low permeability category at 56 days. Both the conventional and top lift mixtures exhibited similar resistivity results. However, the bottom lift mixture had higher resistivity values at 28 and 56 days. But there was greater variability in the resistivity of these bottom lift samples. Two of the five samples had resistivity in the very low permeability category. The SR results in Figure 38 match closely with the calorimeter data shown previously. Companion compressive strength samples
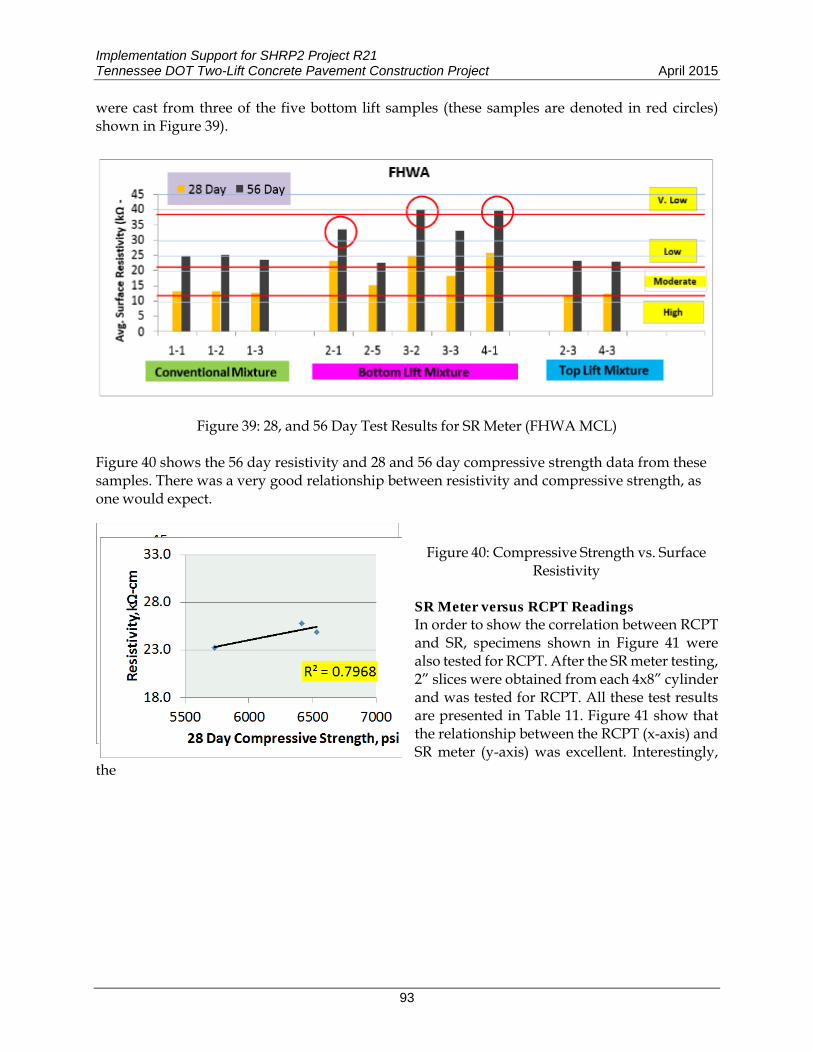
Implementation Support for SHRP2 Project R21 Tennessee DOT Two-Lift Concrete Pavement Construction Project April 2015
93
were cast from three of the five bottom lift samples (these samples are denoted in red circles) shown in Figure 39).
Figure 39: 28, and 56 Day Test Results for SR Meter (FHWA MCL) Figure 40 shows the 56 day resistivity and 28 and 56 day compressive strength data from these samples. There was a very good relationship between resisti vity and compressive strength, as one would expect.
Figure 40: Compressive Strength vs. Surface
Resistivity SR Meter versus RCPT Readings n order to show the correlation between RCPT nd SR, specimens shown in Figure 41 were lso tested for RCPT. After the SR meter testing, ” slices were obtained from each 4x8” cylinder nd was tested for RCPT. All these test results re presented in Table 11. Figure 41 show that he relationship between the RCPT (x-axis) and R meter (y-axis) was excellent. Interestingly,
Iaa2aatS
the

Implementation Support for SHRP2 Project R21 April 2015 Tennessee DOT Two-Lift Concrete Pavement Construction Project
94
and top lift mixture samples in the moderate permeability category.
Table 11: RCPT and SR Meter Results after 56 Days (MCL specimens)
Specimen ID
Mixture Type
Age, Days
Adjusted charge passed
RCPT Classification
Surface Resistivity
SR Meter Classification
1-1 Conventional
56 2323 Moderate 24.7 Low 1-2 56 2374 Moderate 25.2 Low1-3 56 2335 Moderate 23.5 Low
2-1
Bottom Lift
58 1245 Low 33.5 Low 2-5 58 1905 Low 22.6 Low3-2 56 1019 Low 40.1 Very Low3-3 56 1362 Low 33.1 Low4-1 55 - -- 39.7 Low2-3
Top Lift 58 2234 Moderate 23.1 Low
4-3 55 2275 Moderate 22.9 Low
Figure 41: Relationship between RCPT and Surface Resistivity
Surface Resistivity Testing – Comparison between Laboratories and Curing Conditions Since Tennessee DOT also has an SR meter and there were concerns pertaining to the impact of curing conditions on the SR results, a small comparison study was undertaken during the MCL visit to Tennessee. In addition to those specimens cast for SR testing mentioned above, five companion specimens were cast from some samples. Two of these specimens were retained by

Implementation Support for SHRP2 Project R21 Tennessee DOT Two-Lift Concrete Pavement Construction Project April 2015
95
the MCL and three of the specimens were given to Tennessee DOT. One of the MCL specimens was demolded after casting and put in lime water bath. The second MCL specimen from these samples was capped and put in lime water bath without demolding until the day of the test (56 days). Water leaked into some of the undemolded cylinders and some cylinders remained dry. Of the three SR specimens from each sample that were given to Tennessee, one of them was demoled and put in moisture room, and the other was demolded and put in lime water bath. The third sample was capped and put in lime water bath and not demolded until the day of testing (either 28 or 56 days). Table 12 explains in detail the test matrix of the various curing conditions and samples.
Table 12: RCPT and SR Meter Results at 56 Days
FHWA Tennessee DOT
Sample Water Undemolded Moisture Water Undemolded Mixture Type
ID Bath Specimen Room Bath Specimen
1‐1 Conventional x x x 2‐1 x x x x x 2‐5 Bottom Lift x x x x x 3‐2 Mixture x x x x x 3‐3 x x x x x 2‐3 Top Lift x x x x x
4‐3 Mixture x x x x x Figure 42 shows the results between various curing conditions from TDOT and the MCL. The figures show that there was not a significant difference in resistivity measurements between specimens that were demolded and cured in limewater bath and those that was non-demolded and left in lime water baths. Interestingly, there was slight difference in resistivity measurements between moisture cured and lime water bath cured specimens. Almost all the data points in Figure 42 fell slightly above the line of equality. The SR results of the moisture cured specimen in Figure 42c were corrected per AASHTO TP95 (increased the actual measurements by 10% by multiplying the measured SR measurements with 1.1).
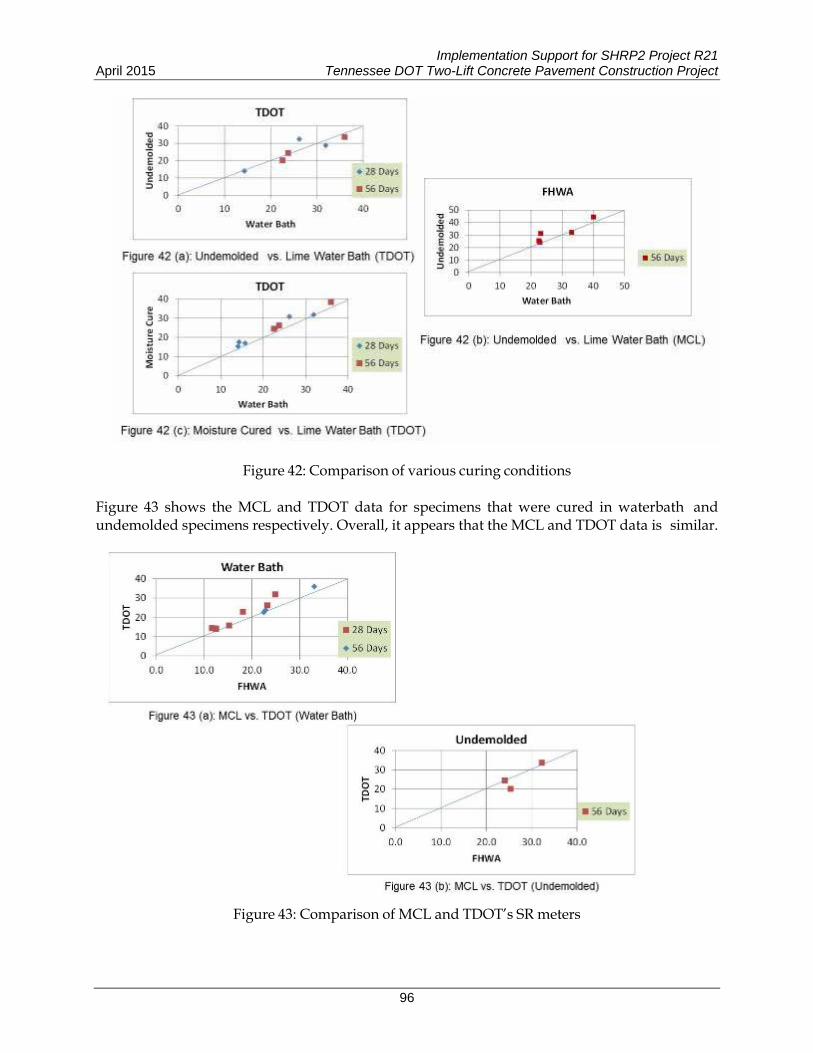
Implementation Support for SHRP2 Project R21 April 2015 Tennessee DOT Two-Lift Concrete Pavement Construction Project
96
Figure 42: Comparison of various curing conditions Figure 43 shows the MCL and TDOT data for specimens that were cured in waterbath and undemolded specimens respectively. Overall, it appears that the MCL and TDOT data is similar.
Figure 43: Comparison of MCL and TDOT’s SR meters
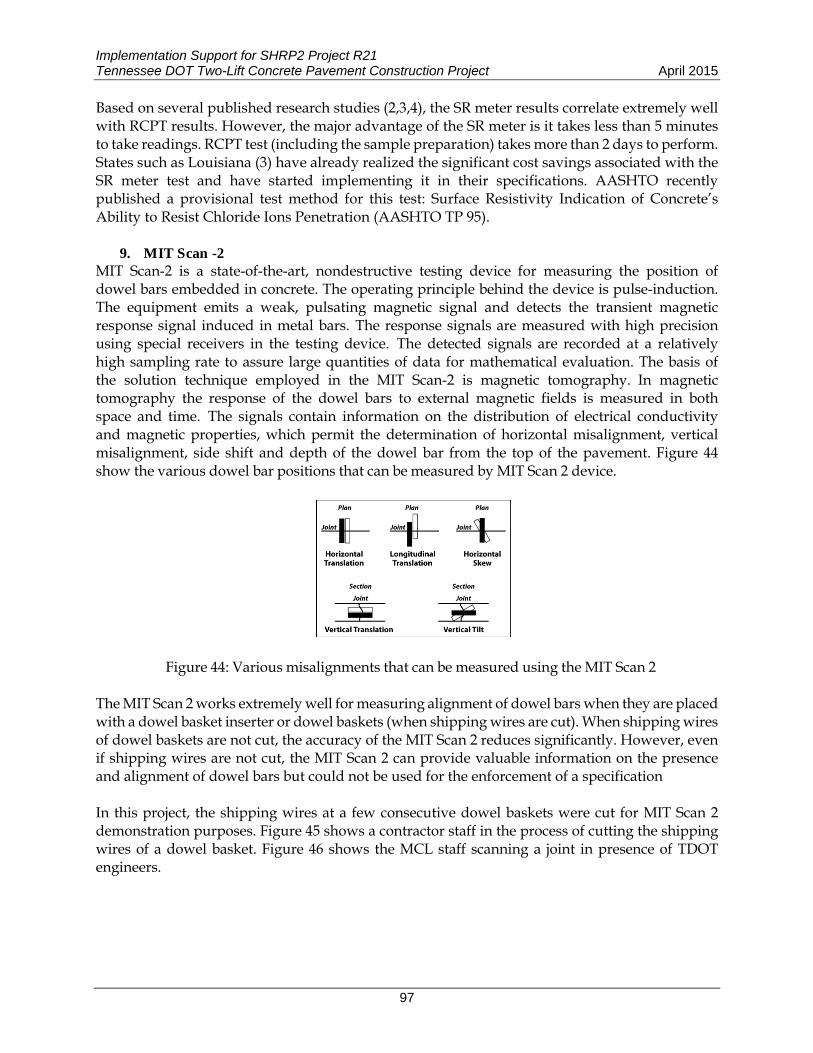
Implementation Support for SHRP2 Project R21 Tennessee DOT Two-Lift Concrete Pavement Construction Project April 2015
97
Based on several published research studies (2,3,4), the SR meter results correlate extremely well with RCPT results. However, the major advantage of the SR meter is it takes less than 5 minutes to take readings. RCPT test (including the sample preparation) takes more than 2 days to perform. States such as Louisiana (3) have already realized the significant cost savings associated with the SR meter test and have started implementing it in their specifications. AASHTO recently published a provisional test method for this test: Surface Resistivity Indication of Concrete’s Ability to Resist Chloride Ions Penetration (AASHTO TP 95).
9. MIT Scan -2 MIT Scan-2 is a state-of-the-art, nondestructive testing device for measuring the position of dowel bars embedded in concrete. The operating principle behind the device is pulse-induction. The equipment emits a weak, pulsating magnetic signal and detects the transient magnetic response signal induced in metal bars. The response signals are measured with high precision using special receivers in the testing device. The detected signals are recorded at a relatively high sampling rate to assure large quantities of data for mathematical evaluation. The basis of the solution technique employed in the MIT Scan-2 is magnetic tomography. In magnetic tomography the response of the dowel bars to external magnetic fields is measured in both space and time. The signals contain information on the distribution of electrical conductivity and magnetic properties, which permit the determination of horizontal misalignment, vertical misalignment, side shift and depth of the dowel bar from the top of the pavement. Figure 44 show the various dowel bar positions that can be measured by MIT Scan 2 device.
Figure 44: Various misalignments that can be measured using the MIT Scan 2 The MIT Scan 2 works extremely well for measuring alignment of dowel bars when they are placed with a dowel basket inserter or dowel baskets (when shipping wires are cut). When shipping wires of dowel baskets are not cut, the accuracy of the MIT Scan 2 reduces significantly. However, even if shipping wires are not cut, the MIT Scan 2 can provide valuable information on the presence and alignment of dowel bars but could not be used for the enforcement of a specification In this project, the shipping wires at a few consecutive dowel baskets were cut for MIT Scan 2 demonstration purposes. Figure 45 shows a contractor staff in the process of cutting the shipping wires of a dowel basket. Figure 46 shows the MCL staff scanning a joint in presence of TDOT engineers.
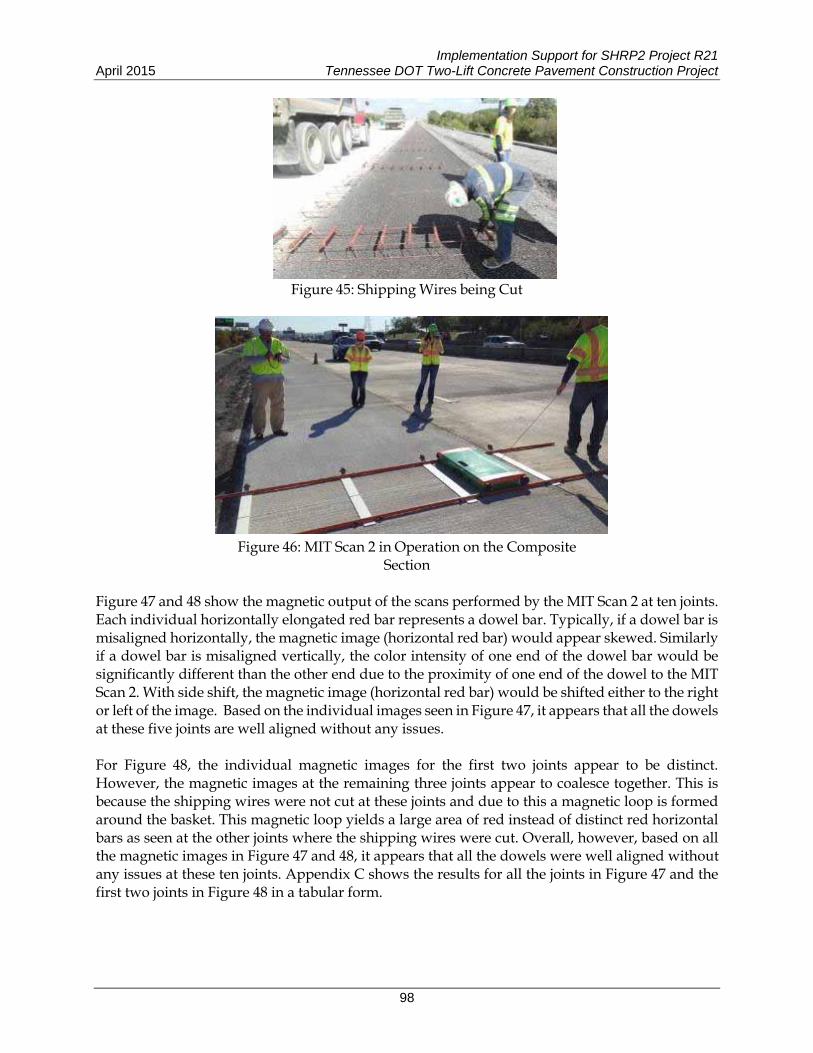
Implementation Support for SHRP2 Project R21 April 2015 Tennessee DOT Two-Lift Concrete Pavement Construction Project
98
Figure 45: Shipping Wires being Cut
Figure 46: MIT Scan 2 in Operation on the Composite
Section Figure 47 and 48 show the magnetic output of the scans performed by the MIT Scan 2 at ten joints. Each individual horizontally elongated red bar represents a dowel bar. Typically, if a dowel bar is misaligned horizontally, the magnetic image (horizontal red bar) would appear skewed. Similarly if a dowel bar is misaligned vertically, the color intensity of one end of the dowel bar would be significantly different than the other end due to the proximity of one end of the dowel to the MIT Scan 2. With side shift, the magnetic image (horizontal red bar) would be shifted either to the right or left of the image. Based on the individual images seen in Figure 47, it appears that all the dowels at these five joints are well aligned without any issues. For Figure 48, the individual magnetic images for the first two joints appear to be distinct. However, the magnetic images at the remaining three joints appear to coalesce together. This is because the shipping wires were not cut at these joints and due to this a magnetic loop is formed around the basket. This magnetic loop yields a large area of red instead of distinct red horizontal bars as seen at the other joints where the shipping wires were cut. Overall, however, based on all the magnetic images in Figure 47 and 48, it appears that all the dowels were well aligned without any issues at these ten joints. Appendix C shows the results for all the joints in Figure 47 and the first two joints in Figure 48 in a tabular form.
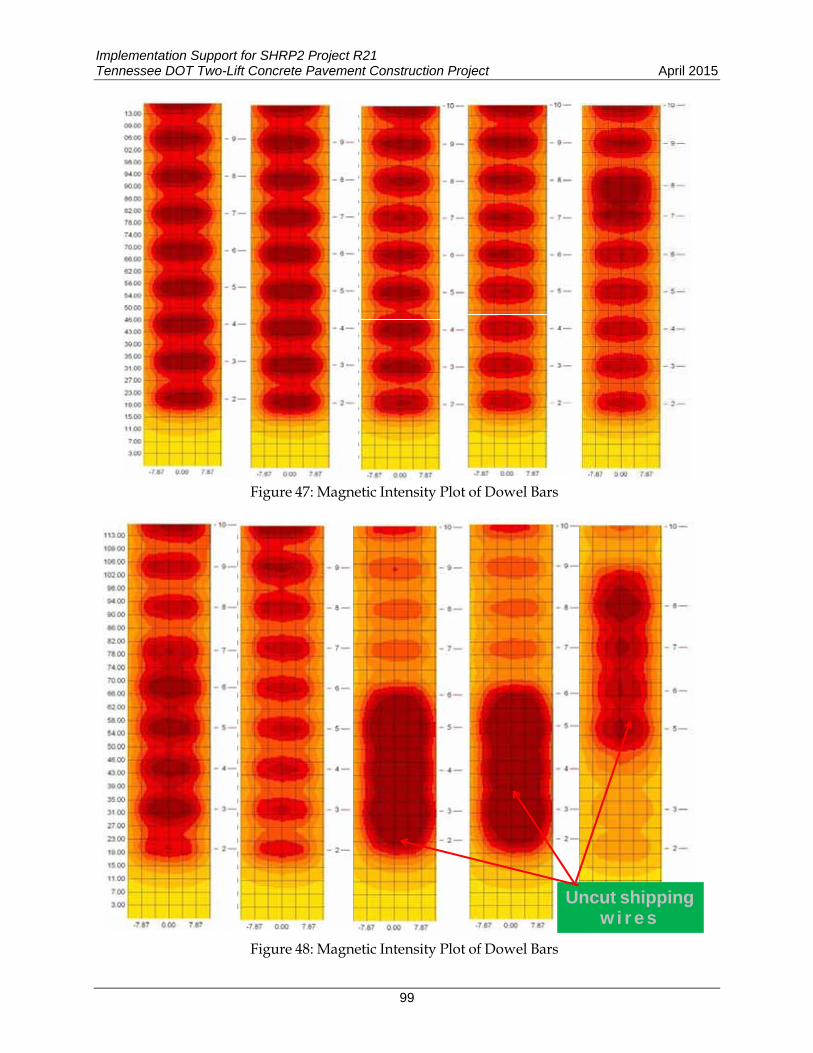
Implementation Support for SHRP2 Project R21 Tennessee DOT Two-Lift Concrete Pavement Construction Project April 2015
99
Figure 47: Magnetic Intensity Plot of Dowel Bars
Figure 48: Magnetic Intensity Plot of Dowel Bars
Uncut shippingw i r e s

Implementation Support for SHRP2 Project R21 April 2015 Tennessee DOT Two-Lift Concrete Pavement Construction Project
100
MIT Scan 2 is a very effective tool specifically designed to non-destructively identify the presence and alignment of dowel bars at a joint. The advantage with MIT Scan 2 is it can be used as soon as the pavement can be walked upon to check the presence and alignment of dowel bars and allows the contractor to take corrective action immediately. Coring is not typically resorted to unless dowel bar placement issues are suspected. Even in those cases, coring is not a good method to check the presence and alignment of dowel bars, since coring can be performed at only a limited number of joints. In addition, multiple cores have to be taken at each joint since taking one or two cores will not reveal the overall picture of dowel bar alignment at a joint. The major benefit of MIT Scan 2 is that it is nondestructive, results can be seen in a graphical display or a tabular format (Appendix C) immediately in the field for quality control and it is not too complicated to operate.
10. MIT Scan T2 MIT Scan T2 (T2) is a nondestructive testing device for measuring pavement thickness. The operating principle behind the device is pulse-induction. A metal target must be pre-placed on the top of the base. The equipment emits a weak, pulsating magnetic signal. The T2 device detects the plate and pulse induction is utilized to determine the thickness of the concrete pavement. During the composite pavement section construction, the MCL staff in presence of the TDOT inspectors placed nine T2 targets on the base before pavement construction. To prevent the targets from being displaced during the paving process, they were nailed down to the base (Figure 49). The approximate locations of the targets were marked. After the pavement was constructed, the MCL staff, in the presence of the TDOT staff, identified the exact locations of the targets and pavement thicknesses were measured using the T2 (Figure 50). Following the pavement thickness measurements, TDOT staff took cores at three of the nine locations to confirm / verify the T2 measurements. Table 13 and Figure 51 show the pavement thickness measurements data using the T2. Overall, T2 measurements indicate that the average pavement thickness was 13.6” versus the design thickness of 13.0”. However, the Scan T2 measured thickness ranged from 12.8 to 14.8”. Table 13 also shows the lengths of cores taken at three of the nine locations where T2 measurements were made. From Table 13, it can be clearly seen that pavement thickness measurements using T2 correlates extremely well with the lengths of cores taken at the same locations. The maximum difference between the two modes of measurement was only 0.1”.
Figure 49: MCL staff Placing a Metal
Target on the Base Figure 50: MCL staff measuring Pavement Thickness using the MIT
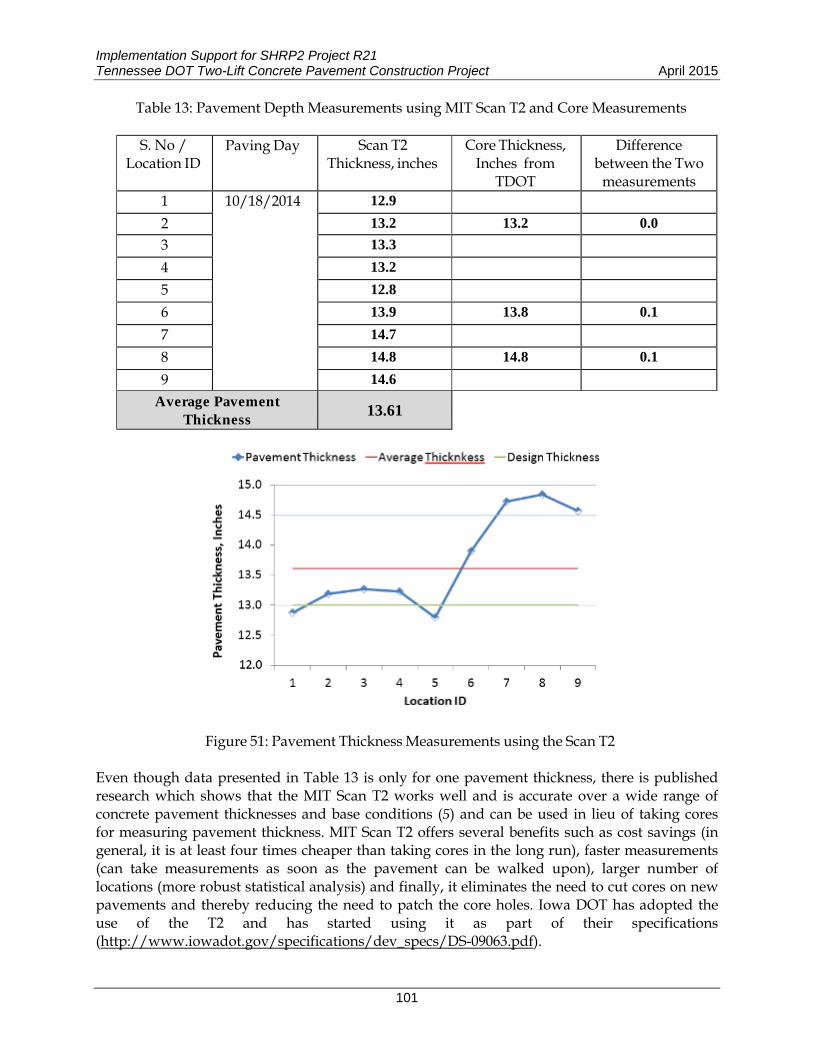
Implementation Support for SHRP2 Project R21 Tennessee DOT Two-Lift Concrete Pavement Construction Project April 2015
101
Table 13: Pavement Depth Measurements using MIT Scan T2 and Core Measurements
S. No / Paving Day Scan T2 Core Thickness, Difference Location ID Thickness, inches Inches from between the Two
TDOT measurements 1 10/18/2014 12.9
2 13.2 13.2 0.03 13.3
4 13.2
5 12.8
6 13.9 13.8 0.1
7 14.7
8 14.8 14.8 0.1
9 14.6 Average Pavement
Thickness 13.61
Figure 51: Pavement Thickness Measurements using the Scan T2
Even though data presented in Table 13 is only for one pavement thickness, there is published research which shows that the MIT Scan T2 works well and is accurate over a wide range of concrete pavement thicknesses and base conditions (5) and can be used in lieu of taking cores for measuring pavement thickness. MIT Scan T2 offers several benefits such as cost savings (in general, it is at least four times cheaper than taking cores in the long run), faster measurements (can take measurements as soon as the pavement can be walked upon), larger number of locations (more robust statistical analysis) and finally, it eliminates the need to cut cores on new pavements and thereby reducing the need to patch the core holes. Iowa DOT has adopted the use of the T2 and has started using it as part of their specifications (http://www.iowadot.gov/specifications/dev_specs/DS-09063.pdf).
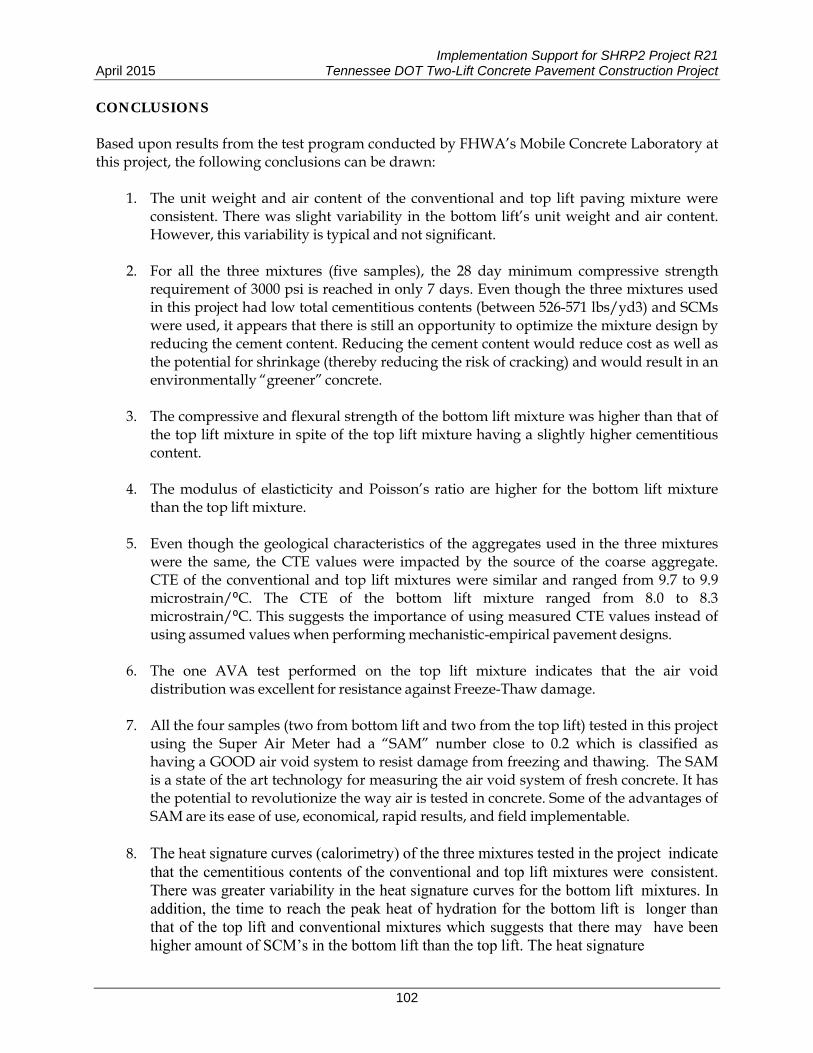
Implementation Support for SHRP2 Project R21 April 2015 Tennessee DOT Two-Lift Concrete Pavement Construction Project
102
CONCLUSIONS Based upon results from the test program conducted by FHWA’s Mobile Concrete Laboratory at this project, the following conclusions can be drawn:
1. The unit weight and air content of the conventional and top lift paving mixture were consistent. There was slight variability in the bottom lift’s unit weight and air content. However, this variability is typical and not significant.
2. For all the three mixtures (five samples), the 28 day minimum compressive strength
requirement of 3000 psi is reached in only 7 days. Even though the three mixtures used in this project had low total cementitious contents (between 526-571 lbs/yd3) and SCMs were used, it appears that there is still an opportunity to optimize the mixture design by reducing the cement content. Reducing the cement content would reduce cost as well as the potential for shrinkage (thereby reducing the risk of cracking) and would result in an environmentally “greener” concrete.
3. The compressive and flexural strength of the bottom lift mixture was higher than that of
the top lift mixture in spite of the top lift mixture having a slightly higher cementitious content.
4. The modulus of elasticticity and Poisson’s ratio are higher for the bottom lift mixture
than the top lift mixture.
5. Even though the geological characteristics of the aggregates used in the three mixtures were the same, the CTE values were impacted by the source of the coarse aggregate. CTE of the conventional and top lift mixtures were similar and ranged from 9.7 to 9.9 microstrain/⁰C. The CTE of the bottom lift mixture ranged from 8.0 to 8.3 microstrain/⁰C. This suggests the importance of using measured CTE values instead of using assumed values when performing mechanistic-empirical pavement designs.
6. The one AVA test performed on the top lift mixture indicates that the air void
distribution was excellent for resistance against Freeze-Thaw damage.
7. All the four samples (two from bottom lift and two from the top lift) tested in this project using the Super Air Meter had a “SAM” number close to 0.2 which is classified as having a GOOD air void system to resist damage from freezing and thawing. The SAM is a state of the art technology for measuring the air void system of fresh concrete. It has the potential to revolutionize the way air is tested in concrete. Some of the advantages of SAM are its ease of use, economical, rapid results, and field implementable.
8. The heat signature curves (calorimetry) of the three mixtures tested in the project indicate
that the cementitious contents of the conventional and top lift mixtures were consistent. There was greater variability in the heat signature curves for the bottom lift mixtures. In addition, the time to reach the peak heat of hydration for the bottom lift is longer than that of the top lift and conventional mixtures which suggests that there may have been higher amount of SCM’s in the bottom lift than the top lift. The heat signature
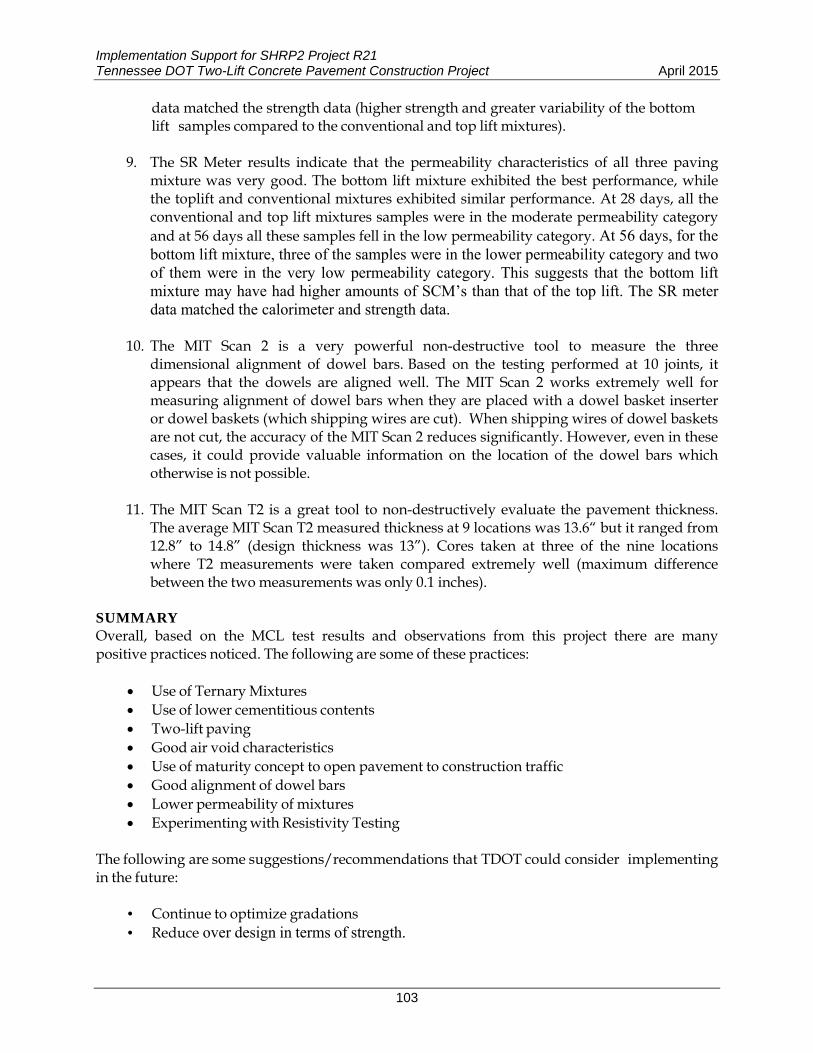
Implementation Support for SHRP2 Project R21 Tennessee DOT Two-Lift Concrete Pavement Construction Project April 2015
103
data matched the strength data (higher strength and greater variability of the bottom lift samples compared to the conventional and top lift mixtures).
9. The SR Meter results indicate that the permeability characteristics of all three paving
mixture was very good. The bottom lift mixture exhibited the best performance, while the toplift and conventional mixtures exhibited similar performance. At 28 days, all the conventional and top lift mixtures samples were in the moderate permeability category and at 56 days all these samples fell in the low permeability category. At 56 days, for the bottom lift mixture, three of the samples were in the lower permeability category and two of them were in the very low permeability category. This suggests that the bottom lift mixture may have had higher amounts of SCM’s than that of the top lift. The SR meter data matched the calorimeter and strength data.
10. The MIT Scan 2 is a very powerful non-destructive tool to measure the three
dimensional alignment of dowel bars. Based on the testing performed at 10 joints, it appears that the dowels are aligned well. The MIT Scan 2 works extremely well for measuring alignment of dowel bars when they are placed with a dowel basket inserter or dowel baskets (which shipping wires are cut). When shipping wires of dowel baskets are not cut, the accuracy of the MIT Scan 2 reduces significantly. However, even in these cases, it could provide valuable information on the location of the dowel bars which otherwise is not possible.
11. The MIT Scan T2 is a great tool to non-destructively evaluate the pavement thickness.
The average MIT Scan T2 measured thickness at 9 locations was 13.6“ but it ranged from 12.8” to 14.8” (design thickness was 13”). Cores taken at three of the nine locations where T2 measurements were taken compared extremely well (maximum difference between the two measurements was only 0.1 inches).
SUMMARY Overall, based on the MCL test results and observations from this project there are many positive practices noticed. The following are some of these practices:
Use of Ternary Mixtures Use of lower cementitious contents Two-lift paving Good air void characteristics Use of maturity concept to open pavement to construction traffic Good alignment of dowel bars Lower permeability of mixtures Experimenting with Resistivity Testing
The following are some suggestions/recommendations that TDOT could consider implementing in the future:
• Continue to optimize gradations • Reduce over design in terms of strength.

Implementation Support for SHRP2 Project R21 April 2015 Tennessee DOT Two-Lift Concrete Pavement Construction Project
104
• Use of HIPERPAV software to evaluate early age cracking potential. • Surface Resistivity Testing • MIT Scan T2 for pavement thickness.
PERSONNEL The following MCL personnel performed testing at the project: Nicolai Morari: Fresh Concrete Properties, SR meter testing, CTE, SAM, RCPT, Bulk Resistivity, Strength Testing, MIT Scan T2, MIT Scan 2, Sampling and Casting Jon Anderson: AVA, MIT Scan 2, Sampling and Casting Jagan Gudimettla: Calorimetry, MIT Scan T2, MIT Scan 2, Data analysis, Report Preparation, Sampling and Casting Jim Grove: Sampling, and Casting ACKNOWLEDGEMENTS Assistance provided by the following individuals is greatly appreciated: Tennessee DOT: Jamie Waller, Heather Hall, Brian Egan, and Terry Hampton FHWA Division Office: John Steele Contractors: Randy Allen (Rogers Group), APAC and IMI Tennessee Concrete Paving Association: Andy Maybee Applied Pavement Technology, Inc.: Kurt Smith and Mark Snyder REFERENCES
1. Integrated Materials and Construction Practices for Concrete Pavement: A State-of-the- Practice Manual, A State of the Practice Manual, National Concrete Pavement Technology Center, October 2007. (http://www.cptechcenter.org/publications/imcp/)
2. Kessler, Powers, Vivas, Paredes, Virmani, “Surface Resistivity as an Indicator of Concrete Chloride Penetration Resistance”, 2008 Concrete Bridge Conference.
3. Rupnow, Icenogle, “Evaluation of Surface Resistivity Measurements as an Alternative
to the Rapid Chloride Permeability Test for Quality Assurance and Acceptance”, Louisiana Transportation Research Center Project Report, July 2011.
4. Eric William Ryan, Master’s thesis, “Comparison of Two Methods for the Assessment of
Chloride Ion Penetration in Concrete: A Field Study”, University of Tennessee, Knoxville, 2011.
5. Jim Grove, Kevin Jones, Dan Ye, Jagan Gudimettla, “Non-Destructive Pavement
Thickness Measurement-It Really Works!” Transportation Research Record: Journal of the Transportation Research Board, 2012.

Implementation Support for SHRP2 Project R21 Tennessee DOT Two-Lift Concrete Pavement Construction Project April 2015
105
Appendix A: Mixture Design
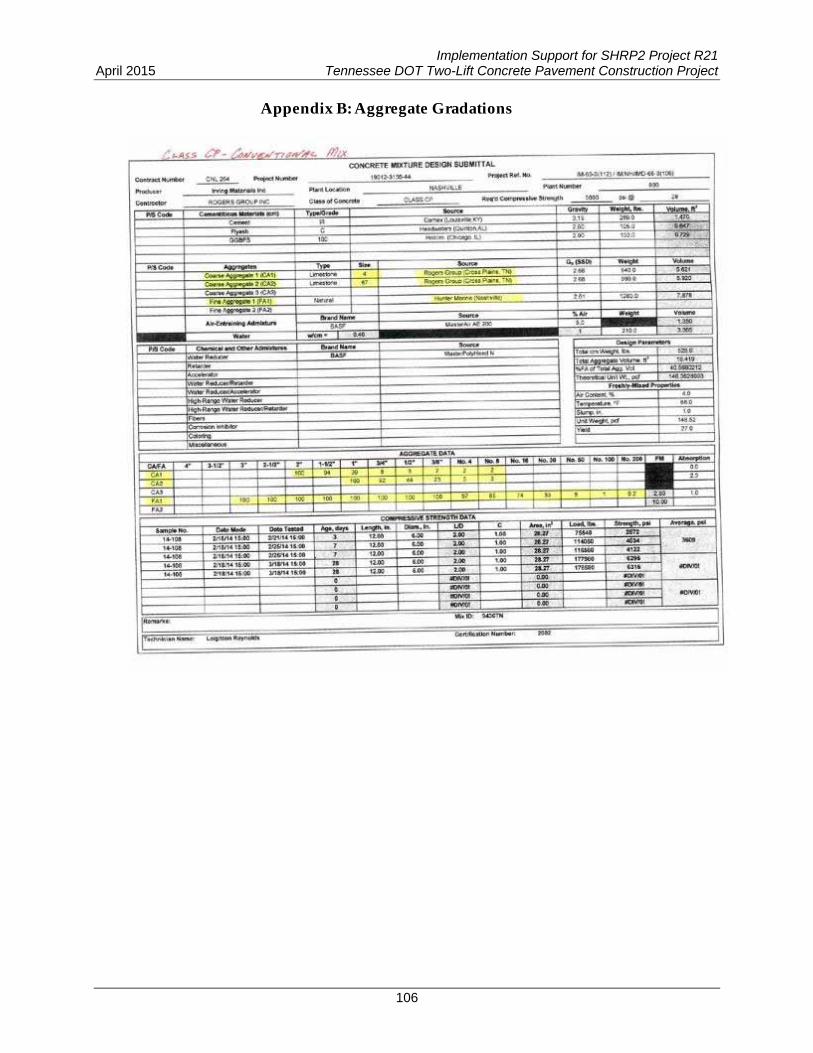
Implementation Support for SHRP2 Project R21 April 2015 Tennessee DOT Two-Lift Concrete Pavement Construction Project
106
Appendix B: Aggregate Gradations
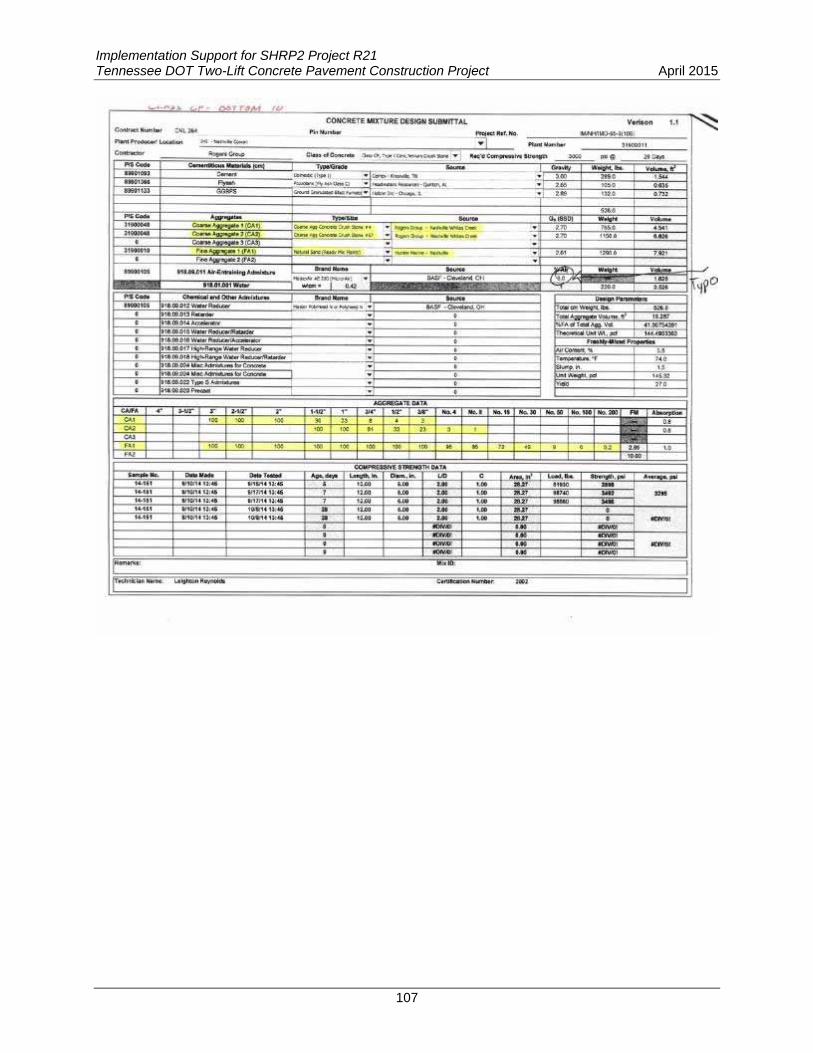
Implementation Support for SHRP2 Project R21 Tennessee DOT Two-Lift Concrete Pavement Construction Project April 2015
107

Implementation Support for SHRP2 Project R21 April 2015 Tennessee DOT Two-Lift Concrete Pavement Construction Project
108

Implementation Support for SHRP2 Project R21 Tennessee DOT Two-Lift Concrete Pavement Construction Project April 2015
109
Appendix C: MIT Scan 2 Results
Horizontal Misalignment, inchesJoint 1 2 3 4 5 6 7 8 9
1 ‐0.2 ‐0.3 ‐0.2 ‐0.2 ‐0.2 ‐0.2 ‐0.2 ‐0.1 ‐0.3 2 ‐0.2 ‐0.2 ‐0.1 ‐0.1 ‐0.1 ‐0.2 ‐0.2 0.0 ‐0.2 3 0.0 0.1 0.0 0.1 0.1 0.1 0.4 0.4 0.3 4 0.2 0.2 0.3 0.4 0.4 0.2 0.3 0.2 0.3 5 0.0 ‐0.1 0.0 0.0 ‐0.1 0.0 0.1 ‐0.1 0.0 6 0.6 0.2 0.2 0.3 0.2 0.2 0.2 0.0 0.1 7 0.4 0.4 0.4 0.4 0.4 0.4 0.4 0.7 0.3
Vertical Misalignment, inches
Joint 1 2 3 4 5 6 7 8 9 1 0.0 0.0 0.0 0.0 0.1 0.1 0.1 0.1 ‐0.3 2 0.0 0.0 0.0 0.0 0.1 0.1 0.1 0.1 ‐0.2 3 0.1 0.2 0.2 0.2 0.2 0.2 0.1 ‐0.2 ‐0.2 4 0.0 0.1 0.0 0.1 0.1 0.2 0.1 0.2 0.2 5 0.2 0.3 0.2 0.2 0.2 0.2 0.3 0.3 0.5 6 0.2 0.4 0.3 0.4 0.3 0.0 ‐0.1 0.4 0.4 7 0.0 0.1 0.0 ‐0.1 0.1 0.2 0.4 0.6 0.4
Side Shift, inchesJoint 1 2 3 4 5 6 7 8 9
1 0.4 0.4 0.2 0.2 0.0 ‐0.1 ‐0.2 ‐0.5 ‐0.9 2 0.4 0.4 0.2 0.2 0.0 0.0 ‐0.1 ‐0.4 ‐0.7 3 0.4 0.4 0.5 0.3 0.3 0.2 0.4 0.1 1.1 4 ‐0.4 ‐0.4 ‐0.2 ‐0.2 ‐0.2 ‐0.1 0.0 0.4 1.1 5 0.5 0.6 0.4 0.3 0.3 0.2 0.5 0.8 1.1 6 0.1 0.9 0.9 0.9 0.9 0.4 0.5 0.9 1.5 7 0.0 0.1 0.2 0.3 0.3 0.5 0.4 0.7 0.6
Depth, inchesJoint 1 2 3 4 5 6 7 8 9
1 6.3 6.2 6.2 6.3 6.3 6.3 6.3 6.3 6.2 2 6.3 6.2 6.2 6.2 6.2 6.3 6.3 6.3 6.1 3 6.3 6.2 6.2 6.3 6.3 6.4 6.3 6.3 5.9 4 6.4 6.3 6.4 6.3 6.3 6.3 6.2 6.1 5.8 5 6.5 6.5 6.5 6.5 6.4 6.4 6.1 6.3 6.1 6 6.6 5.9 6.0 6.0 5.9 6.3 6.4 6.3 6.0 7 6.7 6.6 6.5 6.6 6.5 6.5 6.4 6.2 5.8

Implementation Support for SHRP2 Project R21 April 2015 Tennessee DOT Two-Lift Concrete Pavement Construction Project
110