implementation pilot for two-dimensional (2d) vaccine ... pilot for two-dimensional (2d) vaccine...
TRANSCRIPT

Implementation Pilot for Two-Dimensional (2D) Vaccine Barcode Utilization: Summary Report
Prepared for
Immunization Services Division National Center for Immunization and Respiratory Diseases Centers for Disease Control and Prevention Prepared by Leslie Fierro Marshall Gaddis Michael Kinney Jenica Reed Bonni Kirkwood Michael Greene Paul Robinson Patrick Koeppl David Friedman Deloitte Consulting LLP
November 2014
1

Introduction ....................................................................................................................................................... 3
Context and Background .................................................................................................................................. 3
The Implementation Pilot ................................................................................................................................. 4
Evaluation Purpose and Methodology ............................................................................................................. 6 Process evaluation methodology ...................................................................................................................................... 7 Outcome evaluation methodology .................................................................................................................................... 7
Results ................................................................................................................................................................. 9 Process evaluation questions ............................................................................................................................................ 9 Outcome evaluation questions ........................................................................................................................................ 15
Strengths and Limitations of the Evaluation ................................................................................................ 20
Benefits of the Pilot Project to Date ............................................................................................................... 22
Conclusions....................................................................................................................................................... 23
Recommendations ............................................................................................................................................ 23
References......................................................................................................................................................... 27
Contents
2

Introduction This summary report provides an overview of the Centers for Disease Control and Prevention’s (CDC) Implementation Pilot for Two-Dimensional (2D) Vaccine Barcode Utilization. In this summary, we specifically address the context and background of using 2D barcode scanning to record data about vaccines and introduce the component parts of our implementation project. We then focus on the evaluation purpose and methodology, the results for each evaluation question examined, and present the conclusions, along with a discussion of the strengths and limitations of this pilot project. In closing, we provide recommendations based on our experiences with the implementation pilot and benefits realized to date. Some key findings from this pilot project include:
1. The completeness of lot number and expiration date entries improved in the presence of 2D barcode scanning. Similar improvements were not apparent for accuracy of lot number and expiration date entries.
2. Practitioners in the subset of practices participating in a workflow analysis saved time by using 2D barcode scanning when recording data about vaccines entered into inventory. However, these practitioners took longer to record data about vaccines administered, when using 2D barcode scanning compared with manual data entry.
3. There was a general positive receptiveness to 2D barcode scanning among staff in participating practices (both before and after their use of this technology). Staff reported that it was easy to learn and use 2D barcode scanning technology in a short timeframe.
4. The challenge most frequently reported by staff in integrating 2D barcode scanning into their vaccine recording processes was the limited number of 2D barcoded vaccines available for use during the pilot project timeframe.
5. Staff generally agreed that their practice should use 2D barcode scanning to record data about vaccines in the future, if most vaccines have a 2D barcode.
Context and Background Complete and accurate recording of the lot number, expiration date, and product identifier (ID) of a vaccine administered is important to enable efficient and thorough identification of vaccine products or lots that may present patient safety issues. The small font often present on human readable labels can be challenging for health care practitioners to read and interpret and may lead to errors and inefficiencies when manually entering data into electronic systems. Enhancing the labeling and associated data entry process for recording vaccine data has the potential to improve data quality and increase data entry efficiency. Improved data quality can help the public health community to determine if vaccine-related adverse events are associated with a particular vaccine lot, which could indicate a safety problem with that lot. Additionally, improved data quality can assist health care practitioners in verifying that the right patient receives the correct vaccine at the right time and can aid in identifying patients who received a vaccine from a recalled lot.
In alignment with the importance of these vaccine data, the National Childhood Vaccine Injury Act (NCVIA) of 1986 required health care practitioners to record an administered vaccine’s lot number and manufacturer (1). Earlier, in 1982, the American Academy of Pediatrics (AAP) recommended recording the vaccine expiration date (2). Despite the central importance of these data elements in vaccine safety, existing studies indicate that one or more of these data elements are frequently missing in data systems. Even when these elements are present, there is evidence to suggest they may not be accurate (3-8).
Barcode scanning technology can automate the process of recording data about a vaccine’s lot number, expiration date, and product ID1; as a result, it has the potential to decrease errors associated with the manual entry of this information. In 2004, the U.S. Food and Drug Administration (FDA) sought to reduce medication errors by passing a labeling rule that required the placement of a machine-readable linear barcode containing a
1 The labeler segment of the product identifier includes the vaccine manufacturer.
3
National Drug Code (NDC) on the labels of certain human drug and biological products, including vaccines (9). NDCs are unique product IDs, specific to the manufacturer, brand, and presentation of a pharmaceutical product.
The inclusion of an encoded NDC on pharmaceutical products in linear barcode format provided a standard option to scan pharmaceutical product IDs into health information systems, many of which now leverage NDCs as a point of reference from which to determine the manufacturer and related CVX code (a code used to document the vaccine product administered). However, linear barcodes on vaccines do not contain vaccine lot number or expiration date information. These data elements are necessary to reduce medication errors that may occur from administering a vaccine that has expired or been recalled, which is the intent of the labeling rule requiring the encoding of an NDC.
Encoding these additional data elements on a linear barcode would make the barcode too large for practical application on most vaccine vial and syringe (unit-of-use) labels. Barcodes that use 2D symbology offer a solution. 2D barcodes have a higher data capacity than linear barcodes, allowing the storage of more data elements than a linear barcode while remaining small enough to place on a vaccine unit-of-use.
The use of 2D barcodes for recording vaccine data was not an option until recently when FDA altered existing vaccine labeling requirements. Specifically, in August 2011 the FDA published guidance allowing vaccine manufacturers to request a waiver to the 2004 rule; allowing them to replace linear barcodes with “alternative technology such as two dimensional symbology” that encodes data elements such as the product ID, lot number, and expiration date on vaccine products. For those vaccine manufacturers wishing to retain a linear barcode and add a 2D barcode on a unit-of-use, the FDA required the submission of a Prior Approval Supplement (PAS) (10).
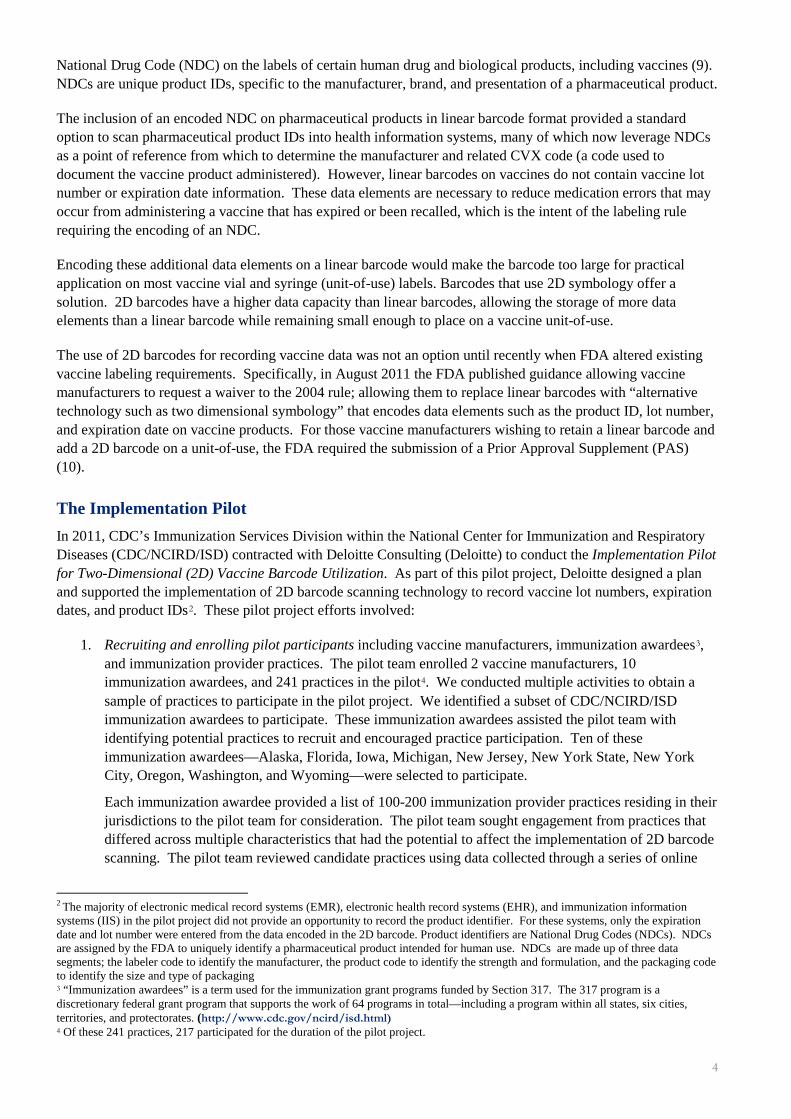
The Implementation Pilot In 2011, CDC’s Immunization Services Division within the National Center for Immunization and Respiratory Diseases (CDC/NCIRD/ISD) contracted with Deloitte Consulting (Deloitte) to conduct the Implementation Pilot for Two-Dimensional (2D) Vaccine Barcode Utilization. As part of this pilot project, Deloitte designed a plan and supported the implementation of 2D barcode scanning technology to record vaccine lot numbers, expiration dates, and product IDs2. These pilot project efforts involved:
1. Recruiting and enrolling pilot participants including vaccine manufacturers, immunization awardees3, and immunization provider practices. The pilot team enrolled 2 vaccine manufacturers, 10 immunization awardees, and 241 practices in the pilot4. We conducted multiple activities to obtain a sample of practices to participate in the pilot project. We identified a subset of CDC/NCIRD/ISD immunization awardees to participate. These immunization awardees assisted the pilot team with identifying potential practices to recruit and encouraged practice participation. Ten of these immunization awardees—Alaska, Florida, Iowa, Michigan, New Jersey, New York State, New York City, Oregon, Washington, and Wyoming—were selected to participate.
Each immunization awardee provided a list of 100-200 immunization provider practices residing in their jurisdictions to the pilot team for consideration. The pilot team sought engagement from practices that differed across multiple characteristics that had the potential to affect the implementation of 2D barcode scanning. The pilot team reviewed candidate practices using data collected through a series of online
2 The majority of electronic medical record systems (EMR), electronic health record systems (EHR), and immunization information systems (IIS) in the pilot project did not provide an opportunity to record the product identifier. For these systems, only the expiration date and lot number were entered from the data encoded in the 2D barcode. Product identifiers are National Drug Codes (NDCs). NDCs are assigned by the FDA to uniquely identify a pharmaceutical product intended for human use. NDCs are made up of three data segments; the labeler code to identify the manufacturer, the product code to identify the strength and formulation, and the packaging code to identify the size and type of packaging 3 “Immunization awardees” is a term used for the immunization grant programs funded by Section 317. The 317 program is a discretionary federal grant program that supports the work of 64 programs in total—including a program within all states, six cities, territories, and protectorates. (http://www.cdc.gov/ncird/isd.html) 4 Of these 241 practices, 217 participated for the duration of the pilot project.
4

surveys to determine the extent to which they met a set of inclusion criteria. The main inclusion criteria included:
o o
o o o
o
o o
Willingness to participate Used the vaccines scheduled for distribution with 2D barcodes at or near the proposed implementation start date Reported vaccination data to the state immunization registry Used an electronic system (EMR/EHR or IIS) to capture data about vaccines administered Had hardware necessary to support the project—namely active computer ports for the 2D barcode scanners Used EMR/EHR/IIS solutions that provide the ability to configure the 2D barcode scanners to input data into either their vaccine administration or vaccine inventory modules Agreed to report de-identified vaccination data to the pilot team Were able to scan vaccines at the point of administration
Participating vaccine manufacturers distributed 2D barcoded vaccines to pilot and non-pilot practices via their existing supply chain. During the pilot project, these manufacturers released eight vaccines into the supply chain:
o o o o o o o o
Menactra unit-dose vials (November 2011) Pediatric DT unit-dose vials (November 2011) Adacel vials (July 2012) Daptacel vials (July 2012) Fluzone unit-dose vials (July 2012) Tenivac vials (October 2012) Havrix Adult unit-dose vials (September 2012) IPOL multi-dose vials (November 2012
6. Selecting a technology solution to enable 2D barcode scanning across a wide range of health information systems. This solution consisted of a 2D barcode scanner, stand, and a configuration utility to insert scanned data elements into Electronic Medical Records’ (EMR), Electronic Health Records’ (EHR), and Immunization Information Systems’ (IIS) (EMR/EHR/IIS) data fields.
7. Installing technology and training practice staff during onsite visits to practices. Pilot team members installed, configured, and tested the 2D barcode scanning technology. Additionally, they educated at least one staff member at each practice regarding the purpose of the pilot project, as well as how to use the 2D barcode scanning technology. Our team members also coordinated with practice points of contact to acquire EMR/EHR data extracts, vaccine ending inventory reports, and vaccine shipping, and manifest logs for time periods prior to the installation and training visit date.
8. Supporting implementation activities and communicating with stakeholders after the pilot team installed 2D barcode scanning technology and trained staff at pilot practices. The pilot team provided technical assistance to the pilot practices through a technical support help desk, developed additional trainings and educational materials, and provided ongoing learning opportunities for pilot participants and others interested in the pilot project. The project team maintained a publicly available website to share pilot project and 2D barcode vaccine information, disseminated monthly newsletters to the vaccine barcoding community, and shared monthly updates on the pilot project with immunization awardees throughout the project. We also hosted two in-person forums. The first was a vaccine manufacturer forum (January 2012) where more than 60 industry stakeholders engaged in discussions about the implications, opportunities, and challenges associated with implementing 2D barcode scanning. The second forum (April 2013) had a broader audience, with more than 78 individuals in attendance representing vaccine manufacturers, immunization awardees, EMR/EHR/IIS vendors, and immunization providers to discuss the lessons learned to date from the pilot project.
9. Performing an evaluation. In addition to performing the aforementioned activities, the pilot team designed and conducted an evaluation of the implementation. We used multiple data sources for the evaluation including but not limited to ongoing pilot project activity logs, surveys of individuals likely to use the 2D barcode scanning technology within practices, onsite observations of workflow processes
5

for a subset of practices, and de-identified data about vaccines administered in practices from existing administrative records (EMR/EHR and IIS). In collaboration with CDC, we designed the evaluation to learn about practice staff experiences integrating 2D barcode scanning into their vaccination recording procedures and to assess the extent to which 2D barcode scanning may have affected the quality of vaccine records (i.e., lot number, expiration date, and product ID). In this summary report, we provide a general overview of the methods used to perform the evaluation, present findings from the evaluation, and summarize the results of our work.
Evaluation Purpose and Methodology The evaluation performed for this pilot project consisted of two components—a process and an outcome evaluation. The purpose of the process evaluation was to examine, in detail, the implementation of the 2D barcode intervention in pilot practices. The purpose of the outcome evaluation was to examine the extent to which two outcomes of interest—(1) time to record vaccine data and (2) quality of data entered about vaccines administered (as measured by completeness. accuracy, and a combined metric of completeness and accuracy)—changed in relation to the use of 2D barcode scanning during the pilot project. Eight overarching questions guided the evaluation inquiry—six for the process evaluation and two for the outcome evaluation (Table ES.1).
All but one of the evaluation questions (outcome evaluation question two) considered the use of 2D barcode scanning for two processes within the practices. One process of interest in this evaluation was the recording of data about vaccines administered by practitioners within the practice. We refer to this process as vaccine administration throughout this report. The second process of interest in the evaluation was recording of data about vaccines that staff within the practices newly entered into vaccine inventory. We refer to this process as vaccine inventory throughout the report.
Table ES.1. Overarching Evaluation Questions
Process Evaluation Outcome Evaluation 1. What are the characteristics of practices
and individuals who participated in the pilot and contributed data for this process evaluation?
2. How was 2D barcode scanning implemented across practices?
3. What were the challenges experienced when integrating 2D barcodes into the practice and what strategies did practices use to resolve them?
4. What was the practice staff’s experience with using 2D barcode scanning?
5. What were practice staff perceptions of the extent to which 2D barcode scanning changed the intended outcomes of efficiency and accuracy?
6. What are some future considerations for sustaining and potentially enhancing the implementation of 2D barcode scanning after the pilot project?
1. Following the introduction of 2D barcode scanning, does the time to record vaccination data change?
2. Does the quality of vaccine administration data change during the pilot project and what amount of this change is due to the introduction of 2D barcode scanning?
6

Process evaluation methodology
The pilot team addressed the process evaluation questions by analyzing both qualitative and quantitative data from eight different sources. These data sources included three project activity logs—the recruitment, installation, and technical support logs—that documented the characteristics of the pilot practices, provided details about each installation and training visit, and described each technical support request received by the Help Desk. Workflow analyses (WFA) performed early and late in the pilot implementation process also provided data for the process evaluation. Specifically, interviews with staff and process flow diagrams produced by pilot team members through their observations of workflow procedures informed our analyses. The pilot team also designed and disseminated three surveys to practice staff:
1. User Expectation Survey (UXS): The pilot team administered UXS as a paper instrument during the installation and training visits (April-July 2012). Through this survey, we gathered data about the respondents’ expectations regarding the extent to which 2D barcode scanning would change the accuracy and efficiency of recording vaccine data, the ease of integrating 2D barcode scanning into their practice workflow, and specific concerns about 2D barcoded vaccines.
2. User Experience Survey 1 (UE1): We distributed UE1 online at the midpoint of the implementation period (January 2013). In this survey, we requested feedback on the pilot project and 2D barcode scanning, challenges experienced and any solutions employed to date, the ease of integrating 2D barcode scanning into the practice workflow, and the perceived changes to accuracy/efficiency of recording vaccine data with 2D barcode scanning.
3. User Experience Survey 2 (UE2): The pilot team distributed UE2online at the end of the pilot project implementation (April 2013). In this survey we asked similar questions as in UE1, however we also included questions to learn more about how respondents used the 2D barcode scanner, the extent to which factors that may motivate individuals to use 2D barcode scanning existed in their practice, and the potential sustainability of 2D barcode scanning in the practice after the pilot project.
In the first step of the data analysis process, the pilot team calculated descriptive statistics for all quantitative data, analyzed qualitative responses to open-ended survey questions, and identified salient points from the WFA process maps and interviews. The pilot team shared results of these initial analyses with CDC, engaged in an interactive discussion to identify additional analyses to perform, and generated a specific set a priori hypotheses to examine using specific statistical tests. In collaboration with CDC, we selected additional descriptive analyses to perform based upon the potential use of the findings for a variety of anticipated stakeholders of this report.
The majority of findings described in this report for the process evaluation arise from patterns identified using descriptive statistics. We also describe the results of statistical tests we performed to test the a priori hypotheses generated with the CDC. The specific test statistic and p-value are typically included as a footnote. When we describe patterns identified in data analyses in the absence of a test statistic, we did not conduct a specific statistical test.
Outcome evaluation methodology
The pilot team analyzed several sources of quantitative data in response to the two outcome evaluation questions. For the first outcome evaluation question about possible changes in time to record vaccine data with the introduction of 2D barcode scanning, we employed a pre-post design without a control condition. Using this approach, we compared the difference in time that it took for staff in a subset of participating practices to record vaccine data using 2D barcode scanning with the time it took them to enter the same data using their traditional data entry methods (e.g., manual entry, selecting from a drop-down menu).
Pilot team staff who conducted the first and second workflow analyses were responsible for recording these data entry times. Specifically, they recorded the time (in seconds) for practice staff to enter data about a vaccine’s lot number, expiration date, and product ID into their EMR/EHR/IIS. We measured the time it took to record vaccine data using traditional data entry methods for one or more staff members from each practice participating
7
in the first workflow analysis (WFA1). Our team observed the same staff, whenever possible, during the second workflow analysis (WFA2) to obtain measures of the time to record data using 2D barcode scanning. When the same staff were not available for WFA2 observations, our team requested a replacement staff member to observe.
A small number of practices (N=10) participated in the first and second WFA. In all of these practices, we recorded times for entering data about vaccines administered to patients. In eight of these practices, pilot team members also recorded times associated with entering data about a newly received vaccine into the inventory system for the first time. Our team initially analyzed these data using descriptive statistics—examining the mean data entry times and associated variance—to identify patterns within and between individual practices. Subsequently, the team performed a statistical test (t-test) to determine if the difference in the mean data entry time measured at WFA1 (traditional data entry methods) and WFA2 (2D barcode scan) was statistically significant. We performed this statistical test for each individual practice in the WFA as well as for the data combined across all practices participating in the WFA.
There are many factors beyond the data entry method used (i.e., traditional method or 2D barcode scan) that can affect the amount of time it takes a staff member to record vaccine data in a practice. Therefore, we also performed an additional statistical analysis (ordinary least squares regression) to see if the difference in time that we were attributing to recording data using traditional versus 2D barcode scanning remained after accounting for broad variations in recording time that occur naturally within practices.
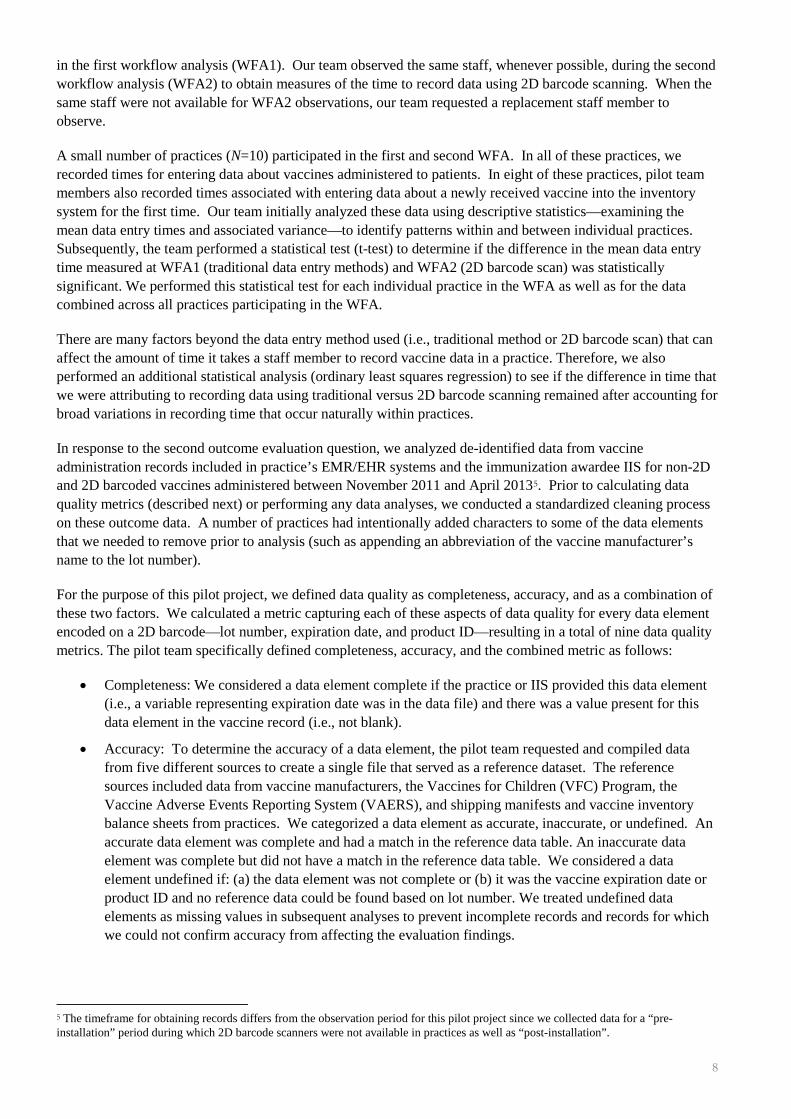
In response to the second outcome evaluation question, we analyzed de-identified data from vaccine administration records included in practice’s EMR/EHR systems and the immunization awardee IIS for non-2D and 2D barcoded vaccines administered between November 2011 and April 20135. Prior to calculating data quality metrics (described next) or performing any data analyses, we conducted a standardized cleaning process on these outcome data. A number of practices had intentionally added characters to some of the data elements that we needed to remove prior to analysis (such as appending an abbreviation of the vaccine manufacturer’s name to the lot number).
For the purpose of this pilot project, we defined data quality as completeness, accuracy, and as a combination of these two factors. We calculated a metric capturing each of these aspects of data quality for every data element encoded on a 2D barcode—lot number, expiration date, and product ID—resulting in a total of nine data quality metrics. The pilot team specifically defined completeness, accuracy, and the combined metric as follows:
• Completeness: We considered a data element complete if the practice or IIS provided this data element (i.e., a variable representing expiration date was in the data file) and there was a value present for this data element in the vaccine record (i.e., not blank).
• Accuracy: To determine the accuracy of a data element, the pilot team requested and compiled data from five different sources to create a single file that served as a reference dataset. The reference sources included data from vaccine manufacturers, the Vaccines for Children (VFC) Program, the Vaccine Adverse Events Reporting System (VAERS), and shipping manifests and vaccine inventory balance sheets from practices. We categorized a data element as accurate, inaccurate, or undefined. An accurate data element was complete and had a match in the reference data table. An inaccurate data element was complete but did not have a match in the reference data table. We considered a data element undefined if: (a) the data element was not complete or (b) it was the vaccine expiration date or product ID and no reference data could be found based on lot number. We treated undefined data elements as missing values in subsequent analyses to prevent incomplete records and records for which we could not confirm accuracy from affecting the evaluation findings.
5 The timeframe for obtaining records differs from the observation period for this pilot project since we collected data for a “pre-installation” period during which 2D barcode scanners were not available in practices as well as “post-installation”.
8

• Completeness and Accuracy6: We classified a data element as “complete and accurate” when the data field was not blank and a match was present in the reference dataset. A field would not be complete and accurate if it was either (1) incomplete or (2) inaccurate according to the previous two metric definitions. This metric was always equal to or lower than completeness –given the previous definitions a record cannot be accurate without being complete therefore the maximum possible for “complete and accurate” is the number complete. When a proportion of the complete records are inaccurate, the completeness and accuracy metric is less than the related completeness metric.
We assigned a value of zero or one to the lot number, expiration date, and product ID included in each vaccine administration record to indicate whether the data element was accurate, complete, and complete and accurate as defined above. We aggregated the values assigned to a data element for a specific aspect of data quality (e.g., accuracy) to a practice-month level. An example of the resulting variable is the proportion of practice administration records in a given month that have an accurate lot number.
We subsequently performed statistical analyses7 to examine the extent to which these proportions changed in relation to the use of 2D barcode scanning while accounting for several other factors8 that also had the potential to explain these changes (i.e., confounding factors). A direct indicator of whether a data element was entered using 2D barcode scanning or using the traditional method of data entry was unavailable for this evaluation. Therefore, we created a variable “Scan Effect” to indicate whether a data element was likely entered into the system using a 2D barcode scan. The pilot team calculated this Scan Effect variable based on: (1) whether the data were entered during a time period when the practice had a 2D barcode scanner installed at the facility; (2) the estimated proportion of vaccine product that was 2D barcoded at the practice; (3) whether the scanners installed at the practice were configured to record the data element of interest; and (4) the self-reported compliance of scanning 2D barcoded vaccines among practitioners at the given practice.
Results As previously described, eight overarching questions framed our inquiry in this evaluation. We provide an overview of the findings for each of these questions in the sections that follow.
Process evaluation questions Question 1: What are the characteristics of practices and individuals who participated in the pilot and contributed data for this process evaluation?
Two hundred forty one practices initially enrolled in the pilot project, with 217 completing the pilot. Practices provided a variety of reasons for attrition. Common themes included a lack of 2D barcoded vaccines, a change in practice priorities, and turnover among practice staff. These 217 practices were located in nine states and one city—Alaska, Florida, Iowa, Michigan, New Jersey, New York, New York City, Oregon, Washington, and Wyoming. Practices were most frequently located in Michigan (n=42, 19%) and New York (n=40, 18%). Predominant practice specialties included pediatrics (n=88, 41%), family practice (n=66, 30%), and public health departments (n=37, 17%). Private practices and practices considered small in size (i.e., five or fewer physicians) were prevalent—comprising 66% (n=144) and 71% (n=154) of all pilot practices, respectively.
Practices enrolled in the pilot used 23 different EMR/EHRs that include varying functionality and complexity. Approximately half of the practices were distributed across four systems—AllScripts (n=43, 20%), eClinical Works (n=27, 12%), Medent (n=23, 11%), and EPIC (n=18, 8%). A small percentage (n=7, 16%) of practices
6 An example describing the completeness and accuracy metric at an aggregate level (e.g., practice-month) may help to differentiate this metric from the other two metrics. If 80/100 records are complete, and 60/80 complete records are accurate; the accuracy metric is 75% because 60 of the 80 complete records were accurate. In this example, the completeness and accuracy metric would be 60/100 and therefore reflect both metrics in a single combined metric. 7 Hierarchical binomial logistic regression 8 Confounding factors included: temporal patterns, proportion of total vaccines that were publicly funded, individual practice data quality, percentage of missing vaccine names, percentage of missing vaccine manufacturer names, percentage of records with a generic vaccine name, common typographical errors, EMR type, and reporting method.
9

did not have an EMR/EHR in place. All practices enrolled also shared data with their IIS9—either via direct data entry into the IIS (n=56, 26%) or indirectly through a method of data transfer from the EMR/EHR to the IIS (n=161, 74%). The majority of practices were initially configured to scan 2D barcoded vaccines to record data about both vaccines administered and vaccines entered into inventory (n=131, 60%). Some practices were initially configured to scan 2D barcoded vaccines only for vaccines administered (n=57, 26%), with a few were configured to scan 2D barcodes only to enter data about vaccines into inventory (n=29, 13%).
The characteristics of practices represented by respondents to the user experience surveys (UE1 and UE2) were similarly distributed to those in the larger pool of all participating practices with respect to practice specialty and the number of physicians working in the practice. Additionally, the practices that participated in the Workflow Analysis studies (WFA1 and WFA2) were similarly distributed in terms of geographic location, practice specialty, number of physicians, method of reporting to the IIS, and type of EMR/EHR. At least one respondent from a large majority (n=195, 90%) of practices participated in the user experience surveys. Survey respondents most frequently self-identified as nurses (UE1: n=151, 48%; UE2: n=152, 49%) and reported commonly serving in roles that provide direct clinical care (UE1: n=193, 62; UE2: n=201, 65%). Most of the respondents personally record vaccines administered and enter vaccine information into inventory (UE1: n=193, 60%; UE2: n=181, 59%).
We analyzed technical report requests submitted by practices located in all participating jurisdictions for the evaluation. Of the pilot practices submitting a request for technical support (n=131), most submitted a single request (n=111, 85%). The most frequent requests for technical support concerned: difficulties populating data elements of lot number and expiration date (n=37); scanner trouble or malfunctions (n=30); requests for new or additional scanners (n=24); or clarification of data requested as part of pilot (n=21).
Question 2: How was 2D barcode scanning implemented across practices?
The pilot team installed more 2D barcode scanners in 59 practices to record data about vaccines administered by practitioners, 31 practices to record data about vaccines entered into inventory, and 137 practices to record data both about vaccines administered and about vaccines entered into inventory. Two to four 2D barcode scanners were installed in most practices to record data about vaccines administered (n=103, 50%), whereas it was most common to install one 2D barcode scanner to record data about vaccine inventory (n=87, 52%). The pilot team trained one to three staff members to use 2D barcode scanners in most of the practices (n=110, 62%). Typically, practices used a “train-the-trainer” model to train others at their practice. Respondents to UE2 frequently reported that they use computers located outside of exam rooms (n=168, 54%) or computers located within exam rooms (n=128, 41%) to record vaccine information. Many respondents also indicated using laptops that they carry to each exam room (n=104, 33%).
Responses from UE1 and UE2 indicate that practice staff had limited exposure to 2D barcoded vaccines during the pilot project. Seventy-three percent (n=111) of practices that administer Menactra had received the 2D barcoded version of this vaccine by April/May 2013. For the other vaccines released with 2D barcodes during the pilot project, 30% or fewer of the practices that administer the vaccine had received the 2D barcoded version of the vaccine by the end of the pilot. Practices never received some vaccines with 2D barcodes (i.e., Tenivac).
We asked respondents who noted that they personally scanned 2D barcodes to record data about vaccines administered to report how frequently they scanned 2D barcodes for this purpose in a typical week. Respondents could select one of five options: less than once a week, one to three times per week, four to six times per week, seven to nine times per week, or 10 or more times per week. Respondents most frequently answered that they scanned 2D barcoded vaccines less than once per week (UE1: n=67, 44%; UE2: n=65, 43%). The second most frequent response selected was one to three times per week (UE1: n=41, 27%; UE2: n=32, 21%).
9 Direct entry into the IIS occurred when a practice only used the IIS to record electronic medical information (n=7, 15%) as well as when a practice entered medical information for a patient twice—into their practice’s EMR/EHR and directly into the IIS (n=41, 19%).
10

Practice staff reported scanning the 2D barcoded vaccines they encountered either most of the time or infrequently. Over 35% of respondents to UE1 (n=57, 38%) and UE2 (n=58, 39%) reported scanning vaccines they personally administered “Most (76-99%)” of the time. The second most common response was “Very few (1-25%)”—with just over 20% of respondents selecting this response on UE1(n=39, 26%) and UE2 (n=33, 22%). Respondents also frequently mentioned scanning 2D barcoded vaccines they personally administered all (100%) of the time (UE1: n=29, 19%, UE2: n=30, 20%).
Respondents who noted that they had personally scanned 2D barcodes most frequently reported using the scanner when it was located in the stand to record data about a vaccine administered (n=99, 66%). A smaller percentage of respondents indicated that they used the stand to record data about a vaccine into inventory (n=36, 52%). UE2 respondents who personally scanned 2D barcodes to record vaccine administrations were almost evenly divided between when they perform this scanning—53% (n=80) usually scanned the barcode after administering the vaccine and 47% (n=70) usually scanned the barcode prior to administering the vaccine. Additional analyses of these data indicate that practice staff who administered vaccines within public health departments more frequently reported scanning 2D barcoded vaccines after administration (n=22, 76%) than before (n=7, 24%). Comparatively, individuals located in practices with other medical specialties were evenly divided between scanning 2D barcodes before and after vaccine administration—52% (n=43) of respondents from pediatric practices and 50% (n=19) of respondents from family practices reported scanning 2D barcoded vaccines before administering the vaccine.
Question 3: What were the challenges experienced when integrating 2D barcodes into the practice and what strategies did practices use to resolve them?
Not receiving 2D barcoded vaccines was noted most frequently as the reason why practices had not scanned 2D barcodes to record data about either vaccines administered (n=40, 63%) or about vaccines entered into inventory (n=43, 48%) by the end of the implementation period. Staff representing practices that did receive 2D barcoded vaccines during the pilot project frequently noted that having only a small percentage of vaccines with 2D barcodes presented a challenge to integrating 2D barcode scanning into their practice’s processes for recording vaccine information (n=161, 77% at UE2).
Other challenges mentioned frequently by practice staff included difficulties scanning 2D barcodes (UE2: n=77, 37%), receiving an inconsistent supply of 2D barcoded vaccines (UE2: n=77, 37%), needing to use a different process to record data from 2D barcoded vaccines as compared to non-2D barcoded vaccines (UE2: n=67, 32%), having to open the box to scan 2D barcoded vaccines into inventory10 (UE2: n=42, 20%), and not enough information about the vaccine, such as the NDC or dosage, populating into the EMR/EHR following a 2D barcode scan(UE2: n=42, 20%).
Qualitative comments provided in data sources indicated that the limited and inconsistent supply of 2D barcoded vaccines during the pilot, coupled with the different processes used to record data about non-2D and 2D barcoded vaccines made it difficult for practice staff to remember to scan 2D barcoded vaccines or to identify vaccines that had 2D barcodes affixed, and it interrupted their workflows. When recording data for multiple vaccines administered during a single patient visit where some vaccines were 2D barcoded and some were not, the respondents felt scanning a 2D barcode was inconvenient and sometimes more time consuming than their traditional method of entering data.
Some practice staff employed techniques to help overcome the implementation challenges. Examples included providing additional training, offering encouragement to practice staff, and issuing reminders to scan 2D barcoded vaccines. Respondents to UE2 were specifically asked whether their practice used any techniques to
10 The introduction of 2D barcodes onto vaccines occurred on the vaccine primary packaging (vial or syringe) with the exception of GSK vaccines where a 2D barcode was available on both levels of packaging. As a result, practitioners generally needed to open the secondary package, remove a vaccine vial or syringe, and scan the 2D barcode on the vial or syringe in order to scan at the point of vaccine inventory. When a 2D barcode was available on secondary packaging, we encouraged practitioners to use the same procedure (open box and scan 2D barcode on vial or syringe). This is because NDCs for most vaccines differ at the packaging level per FDA requirements. Most inventory systems we encountered did not possess the ability to convert the secondary packaging NDC to the equivalent quantity of vaccines for the NDC of the primary packaging.
11

remind employees to identify and scan 2D barcoded vaccines. Of the 195 individuals who responded to this question, 89 (46%) answered “yes.” When examined at a practice-level, 31% (n=33) of the 108 practices from which a response was received indicated that their practice had used a technique to remind employees to identify and scan 2D barcoded vaccines. Further descriptive analyses did not indicate a relationship between the use of reminders and the proportion of 2D barcoded vaccines administered that were scanned. Qualitative descriptions of issues received by the Help Desk note that individuals who contacted the Help Desk for assistance were often retrained on the use of the 2D barcode scanners or were provided with assistance with reconfiguring the scanner.11
Question 4: What was the practice staff’s experience with using 2D barcode scanning?
The majority of respondents to UE2 noted that it was somewhat or very easy to integrate 2D barcode scanning into their process of recording data about vaccines entered into inventory (n=65, 78%) and vaccines administered (n=112, 65%)—with a larger percentage indicating ease at inventory compared to administration. We performed several statistical tests to examine whether there was a relationship between the level of reported ease or difficulty in integrating 2D barcode scanning into practice processes for recording vaccine administrations and several factors. None of the tests detected a relationship. Specifically, the reported level of ease or difficulty of integration did not differ based upon:
• The systems respondents used to record vaccine data into patient records (e.g., computers located outside of exam room, inside exam room, laptops)12
• The number of years for which the individual had been recording vaccines administered13
• The mean proportion of 2D barcoded vaccines administered in the practice14
Individuals who reported personally scanning 2D barcodes to record data about vaccines entered into inventory or vaccine administrations in UE2 frequently reported that they found using 2D barcode scanning to be somewhat (n=57, 36%) or very easy (n= 70, 44%). A large majority of UE2 respondents (n= 171, 88%) noted that they felt skilled using the 2D barcode scanners. Similarly these individuals found learning to operate the 2D barcode scanning technology to be somewhat (n=66, 42%) or very easy (n=87, 55%). This general ease was also exhibited with respect to how long it took respondents to feel skilled using 2D barcode scanners. Respondents indicated feeling skilled after a short time—after scanning once (n=50, 29%) or only a few times (n=108, 63%).
Although practice staff who responded to UE2 frequently indicated that they were somewhat satisfied with the introduction of 2D barcodes into their practice (n=97, 49%), few indicated that the actual implementation of 2D barcode scanning exceeded (n=9, 5%) or greatly exceeded (n=5, 3%) their original expectations. Most respondents indicated that the actual implementation met (n=87, 44%) or fell short (n=84, 42%) of their expectations. Common themes for why individuals were dissatisfied or why their expectations were not met included expecting more vaccines to be 2D barcoded and expecting more information would be entered into the electronic record after scanning a 2D barcode. Reasons respondents provided for being satisfied or having their expectations met or exceeded included perceived gains in accuracy and efficiency from using 2D barcode scanning as well as the general ease of using 2D barcode scanning technology.
Descriptive analyses indicated that fewer representatives of public health departments (n=27, 59%) were satisfied with the introduction of 2D barcodes into their practice relative to pediatric (n=72, 71%) or family practice (n=37, 79%) participants. Additionally, representatives from smaller practices (as indicated by the
11 To reconfigure scanners, the pilot team members built a new configuration (instructions) that describes where a scanner should deposit data from a scanned barcode into the EMR/EHR/IIS record. The team then encoded these instructions into a 2D barcode and provided the barcode to the practice. Staff scanned this 2D barcode, which resulted in re-imaging their scanner so it deposited the data elements in the correct location in the electronic record. 12 (χ2 (3, N=166)=3.205, p=.361) 13 (χ2 (1, N= 149) =.523, p=.469) 14 (t (110)= -1.951, p=.057
12

number of physicians) (n=116, 73%) were slightly more likely than those from larger practices (n=23, 58%) to indicate they were satisfied with the introduction of 2D barcodes into their practice.
Statistical tests indicated that the mean proportion of 2D barcoded vaccines administered in practices where respondents noted they were either very or somewhat satisfied (M=.103) was higher than in practices where respondents expressed that they were either very or somewhat dissatisfied (M=.079).15 Additionally, individuals who reported that their practice had scanned at both administration and inventory were statistically significantly more likely to report being somewhat or very satisfied (n=80, 42%) with the introduction of 2D barcodes into their practice than those who reported scanning at administration only (n=55, 29%).16 We also performed a statistical test to examine whether a relationship existed between respondents’ reported level of satisfaction/dissatisfaction and the frequency with which they reported personally scanning 2D barcodes to record vaccines administered in a typical week. Levels of reported satisfaction or dissatisfaction did vary based upon the level of reported use in a typical week.17 For example, respondents who reported personally scanning 2D barcodes to record vaccines administered four or more times in a typical week were more likely to indicate that they were very or somewhat satisfied (n= 44, 30%) with the introduction of 2D barcodes into their practice than respondents who scanned less than once in a typical week (n=38, 26%).
Question 5: What were practice staff perceptions of the extent to which 2D barcode scanning changed the intended outcomes of efficiency and accuracy?
Prior to the start of 2D barcode scanning, practice staff overwhelmingly anticipated that 2D barcode scanners would positively impact efficiency and accuracy when recording data about vaccines administered and vaccines entered into inventory. Almost all respondents to the User Expectation Survey (UXS) anticipated that using 2D barcode scanners would have a very or somewhat positive impact on the accuracy of data recorded about vaccine administrations (n=612, 99%) and for vaccine inventory (n=605, 99%). These respondents also expected that 2D barcode scanning would have a very or somewhat positive impact on the efficiency associated with recording data about vaccines administered (n=583, 97%) and vaccine inventory (n=588, 99%).
Once 2D barcode scanning was underway at participating practices, ratings of the perceived impact of 2D barcode scanning on the accuracy of vaccine records declined, but stayed positive. For example, more than half of respondents at UE2 perceived the impact of scanning 2D barcodes on the accuracy of recording data about vaccine administrations and vaccine inventory as somewhat (Administration: n=65, 38%; Inventory: n=30, 36%) or very positive (Administration: n=82, 47%; Inventory: n=41, 49%). Ratings of perceived impact of 2D barcode scanning on the efficiency of recording data about vaccines administered and vaccine inventory also declined but stayed positive. More than half of respondents at UE2 perceived the impact of scanning 2D barcodes on the efficiency of recording vaccine inventory as somewhat (Administration: n=74, 43%; Inventory: n=35, 42%) or very positive (Administration: n=39, 23%; Inventory: n=20, 24%).
When asked specifically about time savings experienced at both administration and inventory, ratings were less positive than when staff reported changes to “efficiency” for these same processes. Forty-seven percent (n=69) of respondents indicated that they agreed or strongly agreed that scanning saves time at administration, and 54% (n=37) of respondents agreed or strongly agreed that 2D barcode scanning saves them time when recording vaccine inventory. Respondents rated 2D barcode scanning more favorably with respect to efficiency— 65% (n=113), indicating that 2D barcode scanning had a somewhat or very positive impact on the efficiency of recording data about vaccines administered and 65% (n=55) provided the same response for recording vaccine inventory. Focus on a more specific element (time savings) versus a broader term (efficiency) may account for these different patterns.
15 This difference was statistically significant (t(104)=-2.42, p=.017). A non-parametric equivalent to the independent samples t-test was also performed to test the null hypothesis of equivalence between the distribution of the proportion of 2D barcoded vaccines administered in practices between respondent groups indicating very/somewhat dissatisfied vs. very/somewhat satisfied (Mann-Whitney U). This test also attained statistical significance with p=.048. The standard deviation associated with the mean proportion in practices where respondents noted they were very or somewhat dissatisfied was .047. In practices where respondents reported being very or somewhat satisfied the standard deviation associated with the mean proportion of 2D barcoded vaccines administered in practices was .065. 16χ2(1, N=189)=10.385, p=.001 17 χ2(2, N=145)=10.712, p=.005
13

Statistical tests indicated that practitioners who encountered more 2D barcoded vaccines were more likely to agree that 2D barcoding saved them time when entering data. We performed a statistical test to examine whether the mean proportion of 2D barcoded vaccines administered in practices differed by the level of agreement or disagreement indicated by the respondent regarding time savings for recording data about vaccine administrations. The results of this test indicated that the mean proportion of 2D barcoded vaccines administered did differ based upon the level of reported agreement or disagreement.18 Specifically, the mean proportion of 2D barcoded vaccines administered in practices where respondents reported they very strongly/strongly disagreed that 2D barcode scanning saved them time when recording data on vaccines administered was lower (M=.08, SD=.05) than in practices where respondents reported that they were “neutral” (M=.12, SD=.07) with respect to time savings. This finding is also supported by a similar statistical analysis19 that indicated a relationship exists between the frequency of scanning and the respondents’ reported agreement or disagreement with the statement that 2D barcode scanning saves them time.
Question 6: What are some future considerations for sustaining and potentially enhancing the implementation of 2D barcode scanning after the pilot project?
Practice staff perceptions regarding the likelihood that their practice would continue the use of 2D barcode scanning after the pilot were mixed. Just over half of the UE2 respondents who answered a question about sustainability noted that it was likely or extremely likely that their practice would continue using 2D barcode scanning after the pilot ended (n=153, 52%). Among individuals who reported that their practice was likely or extremely likely to continue 2D barcode scanning after the pilot, 38% (n=58) indicated that their practice had specific plans to continue. However, the details respondents provided about these plans were typically general in nature—acknowledging the practice’s intention to continue scanning as more 2D barcoded vaccines became available.
Some respondents more frequently noted that it was likely or very likely that their practice will continue using 2D barcode scanning after the pilot ends compared to their counterparts. We observed the following patterns in the data:
• Ninety-five percent (n=39) of respondents who noted that they personally scan 2D barcoded vaccines four or more times per week to record data about vaccines administered noted that their practice was likely or very likely to continue scanning after the pilot project as compared to 68% (n=30) of respondents who personally scan 2D barcoded vaccines for this purpose less than once per week.
• No pattern was seen between the median proportion of 2D barcoded vaccines administered in the practices and the reported likelihood that they would continue to scan 2D barcoded vaccines after the pilot project20.
• Respondents who reported that they scan all (100%) or most (76-99%) of the 2D barcoded vaccines they administer more frequently noted that their practice was likely or very likely to continue scanning after the pilot (n=22, 92% and n=34, 77% respectively) than those who reported scanning some (26-50%) or very few (1-25%) (n=8, 67% and n=15, 68% respectively).
• Almost all respondents who indicated that it was very easy to integrate 2D barcode scanning into their practice’s process for recording vaccine administrations or vaccine inventory indicated that it was likely or very likely that their practice would continue scanning after the pilot (n=38, 97% and n=19, 90% respectively). Respondents providing other responses less frequently indicated that their practice would be likely or very likely to continue scanning after the pilot—for example, 85% (n=41) of respondents who noted that it was somewhat easy to integrate 2D barcode scanning to record data about vaccine
18 F(2, 98)=3.34, p=.039. The non-parametric equivalent of the one-way ANOVA (i.e., Kruskal-Wallis) was also statistically significant—indicating a difference in distributions between groups (p=.049). 19 The pilot team used a Fisher’s Exact Test to examine the null hypothesis of independence of rows and columns in the data, and used 100,000 Monte Carlo simulations to simulate the p-value from the data. We reported the p-value from a simulation of the two-sided hypothesis. Statistical significance was attained at p=0.00054. 20 Spearman correlation coefficient=0.097
14

administrations and 79% (n=30) of those who selected this same response for recording vaccine inventory noted that their practice would be likely or very likely to continue scanning.
• Individuals who found it very easy or somewhat easy to use 2D barcode scanning more frequently noted that their practice was likely or very likely to continue scanning after the pilot (n=46, 85% and n=39, 81% respectively) than those who found it somewhat difficult to use 2D barcode scanning (n=10, 48%).
• Respondents from public health departments more frequently noted that their practice was unlikely to continue using 2D barcode scanning after the pilot ended (n=14, 34%) than respondents from other types of practices such as pediatrics (n=15, 15%) or family practices (n=5, 11%).
The majority of practice staff indicated that having more vaccines with 2D barcodes would make it more likely that their practice would continue scanning after the pilot (n=204, 66%). The large majority (n=173, 86%) of these staff noted that more than 50% of the vaccines in their practice would need to have a 2D barcode to sustain the use of scanning in their practice. Respondents most frequently estimated that between 76% and 99% of the vaccines in their office would need to be 2D barcoded to sustain their use (n=89, 44%). Many practice staff who reported personally scanning 2D barcodes to record data about either vaccine inventory or vaccine administrations agreed (n=55, 35%) or strongly agreed (n=60, 38%) that 2D barcode scanning should be used consistently to record vaccines administered in their clinic when 2D barcodes are available on most vaccines.
Qualitative suggestions for how to improve the process of recording vaccine data by scanning 2D barcodes was consistent with the data acquired in response to the other process evaluation questions—highlighting the importance of having more or all vaccines with 2D barcodes, populating more data elements into the electronic record after scanning a 2D barcode, improving EMR/EHRs, improving the scanning process or scanner itself, and placing the 2D barcode on external packaging.
Outcome evaluation questions Question 1: Following the introduction of 2D barcode scanning, does the time to record vaccination data change? 21
The pilot team selected thirteen pilot practices to participate in the WFA. Three of these practices did not have opportunities to scan 2D barcoded vaccines during the pilot project and therefore did not participate in the second WFA. Of the ten practices that participated in both WFA1 and WFA2, all scanned data about vaccines administered. Eight of these practices scanned 2D barcodes to record data about vaccine inventory.
Descriptive analyses performed at the individual-practice level indicated that three of the 10 practices that used 2D barcode scanning to record data about vaccines administered during both WFA1 and WFA2 saw a decrease in the average amount of time it took to record data about vaccines administered. Decreases in average time to record data about vaccines administered within practices ranged from less than one second to seven seconds. None of these decreases in average time within practice attained statistical significance22 (Figure ES.1). Average increases ranged from two seconds to 19 seconds. In two of the seven practices where the average time increased, statistical significance was attained.
Analyses of the 502 observations obtained from these ten practices showed an average increase in time to record data about vaccines administered from pre- to post-implementation of 2D barcoding technology of 3.6 seconds (from 17.7 to 21.3 seconds). We used a statistical model23 to account for natural variations that can occur within a practice and that may affect the time it takes practitioners to record data about vaccines administered. After accounting for this practice variation, it took practitioners an average of 4.06 seconds longer to use 2D barcode
21 Findings presented in this report vary slightly from those provided during the Educational Forum in April 2013. Differences are a result of further data cleaning procedures that resulted in corrections to some practice and EMR/EHR average time to record vaccine data. 22 We tested the average change in time to record vaccine data within practice using a t-test. P-values were adjusted for multiple comparisons using a Bonferroni adjustment accounting for a total of 18 comparisons performed across vaccine administration and vaccine inventory procedures. The adjusted α=.00278. 23 Multiple linear regression
15

technology to record data about vaccines administered compared to the traditional method of data entry. This result was statistically significant24.
* Indicates the difference is statistically significant at an adjusted α=.0028. † The value listed in the graph was rounded for ease of interpretation. The actual value is a decrease of -.13 seconds.
Figure ES.1. Difference in time to record data about vaccines administered
In six of the eight pilot practices where observations of vaccine inventory recording were available at WFA1 and WFA2, the average time to record vaccine data decreased. Average differences in time from pre- to post-implementation of 2D barcode scanning ranged from two seconds to 28 seconds. Four of the six instances in which average time decreased attained statistical significance25 (Figure ES.2). In two practices, the average time increased by three and seven seconds (neither attained statistical significance).
Analyses of the 372 observations obtained from these eight practices showed an average decrease in the time to record data about vaccines entered into inventory from pre- to post-implementation of 2D barcoding technology. From pre to post-implementation, this average time decreased by 10.71 seconds (from 38.0 to 27.3 seconds). Similar to the procedures we used to analyze the time to enter data about vaccines administered, we employed a statistical model to see if a difference remained between the time to record data about vaccine inventory using 2D barcode scanning compared to traditional methods after accounting for natural variations within practices that may affect this time. After adjusting for this practice-level variation, the use of 2D barcoding technology still took less time than using traditional data entry procedures for recording data about vaccine inventory. Specifically, this statistical model indicated that it took 10.82 seconds less to record vaccine inventory using 2D barcode scanning as opposed to traditional methods. This result was statistically significant26.
24 F(1,9)=22.69, p < 0.0001 25 We tested the average change in time to record vaccine data within practice using a t-test. P-values were adjusted for multiple comparisons using a Bonferroni adjustment accounting for a total of 18 comparisons performed across vaccine administration and vaccine inventory procedures. The adjusted α=.00278. 26 F (1,7)= 97.17, p < 0.0001
16

* Indicates the difference is statistically significant at an adjusted α=.0028
Figure ES.2. Difference in time to record data about vaccines into inventory
We performed additional exploratory analyses to identify patterns in the time measurement data at administration and inventory across a number of practice-level characteristics. Descriptive analyses of time measurements at vaccine administration showed increases within each type of practice specialty (i.e., family practice, general practice, and pediatrics) and for each type of EMR/EHR vendor included in the WFA, though this was not the case for measurement at inventory. Differences seen by practice specialty in inventory time measurements included a decrease from pre to post-implementation of 12 seconds for all pediatric practices combined (n= 7), whereas the single family practice office showed an increase of seven seconds. Examination of patterns between the proportion of 2D barcoded vaccines administered in practices and the time to record data about vaccines administered and about vaccine inventory produced inconclusive findings—analyses using EMR data showed one pattern, analyses using IIS data showed an opposite pattern.
Question 2: Does the quality of vaccine administration data change during the pilot project and what amount of this change is due to the introduction of 2D barcode scanning?
The pilot team received approximately 1.7 million records of vaccines administered from EMR/EHR systems and 2.0 million records of vaccines administered from IIS during the pilot project. Of these, we analyzed 1.4 million EMR/EHR vaccination records and 1.7 million IIS vaccination records to evaluate the completeness and accuracy of data entered using 2D barcode scanning versus data entered using the practice’s traditional method (e.g., manual entry, select from drop down menu). These records represent data from 160 practices that sent EMR/EHR data and from 211 practices where the IIS provided data27. There were eight different vaccine products in the supply chain during the pilot project with 2D barcodes. The datasets used for analyses include records for 53,508 2D barcoded vaccinations28 in EMR/EHR data and 46,039 2D barcoded vaccinations in IIS data.
27 After the application of additional inclusion criteria that analysis data included vaccine records from 101 practices for EMR analysis and 192 for IIS analysis 28 2D barcoded status is based on the lot number in the vaccination record in comparison to lot numbers provided by participating manufacturers.
17
In both the EMR/EHR and IIS analysis datasets, the nine metrics representing data quality29 had high averages across the entire pilot period (above 90%) and low variability. Although there was only a small opportunity for improvement due to high pre-implementation data quality, post-implementation data quality was generally higher than pre-implementation data quality. The average EMR/EHR data quality metrics increased from 90.9% to 96% pre-implementation to post-implementation whereas the average IIS data quality metrics increased from 94.7% to 96.2%, pre-implementation to post-implementation.
Prior to adjusting for confounding factors, data quality metrics from pre- to post-implementation indicated a positive effect of 2D barcode scanning—meaning that the data quality as indicated by the three metrics of interest (completeness, accuracy, and the combined metric) improved after 2D barcode scanners were installed in the practices. Quality improved for each of the nine key quality metrics in EMR/EHR pilot practices from pre-implementation to post-implementation. Some metrics, such as expiration date completeness, improved over 10%.
A majority of data quality metrics in the IIS analysis dataset also increased from pre-implementation to post-implementation. Lot number accuracy was unchanged, and product code accuracy and the combined metric of completeness and accuracy declined slightly for IIS data. The high data quality at pre-implementation (96% for accuracy and for the combined metric of completeness and accuracy) may have limited the improvement following the implementation of 2D barcode scanning. In addition, only a small number of practices were able to capture product ID information using a 2D barcode scanner in the post-implementation period.
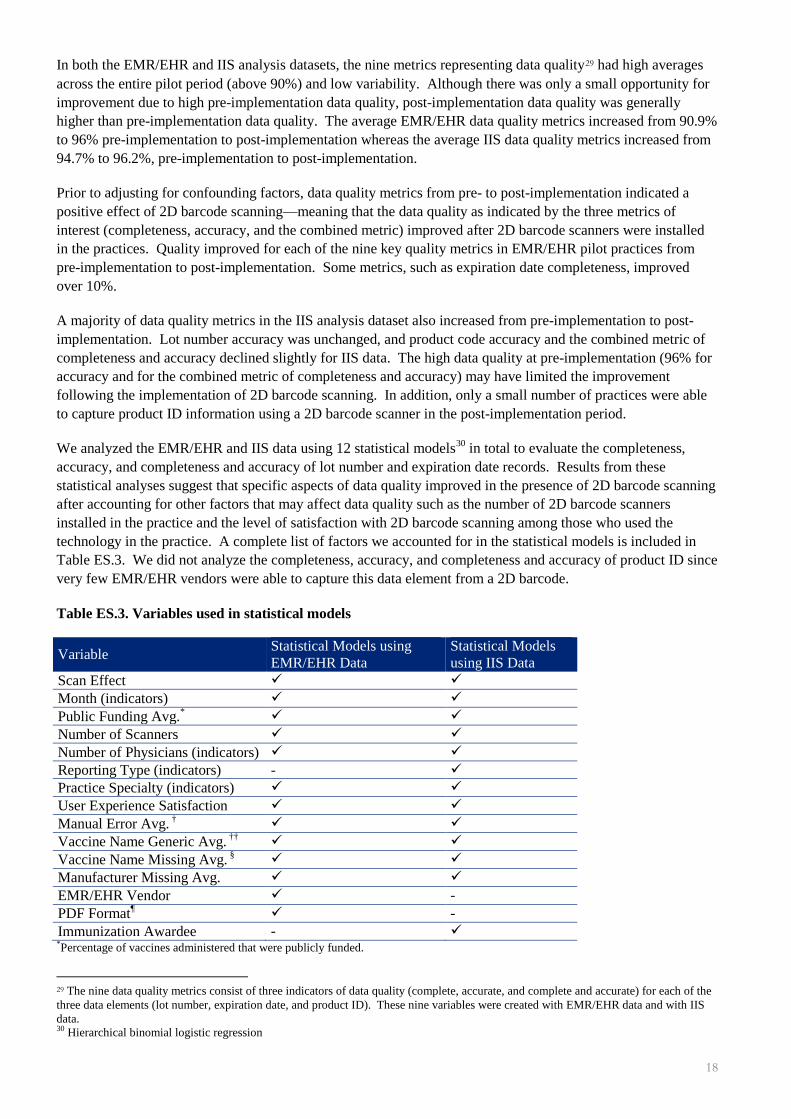
We analyzed the EMR/EHR and IIS data using 12 statistical models30 in total to evaluate the completeness, accuracy, and completeness and accuracy of lot number and expiration date records. Results from these statistical analyses suggest that specific aspects of data quality improved in the presence of 2D barcode scanning after accounting for other factors that may affect data quality such as the number of 2D barcode scanners installed in the practice and the level of satisfaction with 2D barcode scanning among those who used the technology in the practice. A complete list of factors we accounted for in the statistical models is included in Table ES.3. We did not analyze the completeness, accuracy, and completeness and accuracy of product ID since very few EMR/EHR vendors were able to capture this data element from a 2D barcode.
Table ES.3. Variables used in statistical models
Variable Statistical Models using EMR/EHR Data
Statistical Models using IIS Data
Scan Effect Month (indicators) Public Funding Avg.* Number of Scanners Number of Physicians (indicators) Reporting Type (indicators) - Practice Specialty (indicators) User Experience Satisfaction Manual Error Avg. † Vaccine Name Generic Avg. †† Vaccine Name Missing Avg. § Manufacturer Missing Avg. EMR/EHR Vendor - PDF Format¶ - Immunization Awardee - *Percentage of vaccines administered that were publicly funded.
29 The nine data quality metrics consist of three indicators of data quality (complete, accurate, and complete and accurate) for each of the three data elements (lot number, expiration date, and product ID). These nine variables were created with EMR/EHR data and with IIS data. 30 Hierarchical binomial logistic regression
18

† The percentage of total errors flagged as manual errors. Flagged manual errors were special replaces (8 for B, O for 0, etc.) or swaps (2031 for 2013). †† Percentage of vaccination administration records with generic vaccine name (e.g., “flu” rather than brand name). § Percentage of vaccination administration records missing vaccination name. ¶The PDF Format variable is an indicator that refers specifically to data files that the pilot team received from individual practices as PDF images and had to enter by hand into the administration data
Table ES.4 describes the findings of the 12 statistical models we employed that account for the variables included in Table ES.3. Parameter estimates with a positive value and a p-value less than 0.000147 indicate statistically significant improvements in data quality. Lot number and expiration date completeness improved where the scan effect variable indicated that a practitioner scanned a 2D barcoded vaccine rather than entered the data using a traditional method. This finding regarding the improvement in completeness for these two data elements was consistent between models that used EMR/EHR or IIS data. The completeness and accuracy metric also demonstrated a statistically significant improvement where the scan effect variable indicated that a practitioner used 2D barcode scanning to enter the expiration date into the EMR/EHR. No other statistically significant improvements or decreases in data quality were associated with 2D barcode scanning in the models.
Table ES.4. Results of adjusted* statistical models - data quality in relation to scan effect
Data Quality Metric EMR/EHR Data Parameter Estimate† (p-value††)
IIS Data§ Parameter Estimate (p-value)
Lot Number
Completeness 3.2882 (0.000006) ¶ 11.4056 (<.000001) ¶
Accuracy -0.7255 (0.056521) 0.462 (0.808288)
Completeness and Accuracy 1.7493 (0.002418) 1.4557 (0.353038)
Expiration Date
Completeness 1.9055 (<.000001) ¶ 10.254 (<.000001) ¶
Accuracy 0.4025 (0.139895) -0.4754 (.799034)
Completeness and Accuracy 1.4573 (<.000001) ¶ 5.1594 (0.008802) *Findings presented in this table are from the 12 statistical models that account for the effect of the factors listed in Table ES.3 on the data quality metrics. †A statistically significant positive parameter estimate indicates an improvement in the data quality metric of interest when the scan effect variable indicated a practitioner used 2D barcode scanning to enter data for the lot number or expiration date. A statistically significant negative parameter estimate would indicate a decrease in data quality associated with the use of 2D barcode scanning. ††P-values are the calculated probability that a test statistic at least as extreme as the one obtained happened by chance. A lower p-value indicates stronger belief that the result did not occur by chance. §We excluded all (or a majority of) records from five immunization awardees for the models using IIS data for the three data quality metrics related to expiration date. Some IIS have different ability to receive expiration dates based on the way practices report their data. IIS that receive lot numbers but not expiration dates from practices often use a lookup table to place expiration dates in IIS data. These expiration dates do not represent data elements actually entered by the practice at administration. In some cases, this scenario was present for all practices reporting to a single IIS (in which case all records were excluded); in other cases, this scenario was present only for some practices reporting to a specific IIS (in which case we excluded only those records). ¶Statistically significant at α = .000147. This α level is adjusted for the use of multiple statistical tests. Specifically, we used a Bonferroni adjustment, which is a statistical technique used to account for the desired experiment α and the number of comparisons made (20). The pilot team desired an overall α = 0.05. Seventeen anticipated models with a conservative average of 20 tests per model leads to a significance threshold of 0.05/ (17*20) = .000147. Because we only used 12 models, this value is a very conservative cutoff.
19
Strengths and Limitations of the Evaluation In reflecting upon the pilot project and evaluation our team performed, we identified a number of strengths and limitations that are important to consider when interpreting the aforementioned key findings.
Strengths
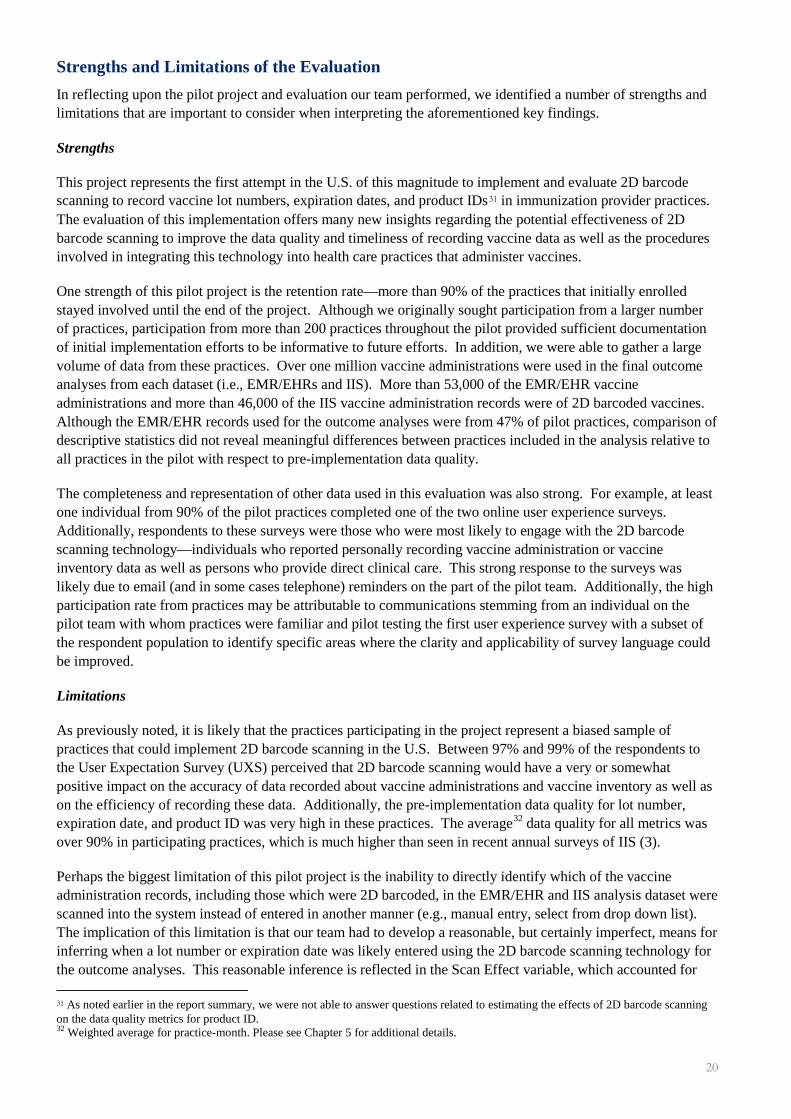
This project represents the first attempt in the U.S. of this magnitude to implement and evaluate 2D barcode scanning to record vaccine lot numbers, expiration dates, and product IDs31 in immunization provider practices. The evaluation of this implementation offers many new insights regarding the potential effectiveness of 2D barcode scanning to improve the data quality and timeliness of recording vaccine data as well as the procedures involved in integrating this technology into health care practices that administer vaccines.
One strength of this pilot project is the retention rate—more than 90% of the practices that initially enrolled stayed involved until the end of the project. Although we originally sought participation from a larger number of practices, participation from more than 200 practices throughout the pilot provided sufficient documentation of initial implementation efforts to be informative to future efforts. In addition, we were able to gather a large volume of data from these practices. Over one million vaccine administrations were used in the final outcome analyses from each dataset (i.e., EMR/EHRs and IIS). More than 53,000 of the EMR/EHR vaccine administrations and more than 46,000 of the IIS vaccine administration records were of 2D barcoded vaccines. Although the EMR/EHR records used for the outcome analyses were from 47% of pilot practices, comparison of descriptive statistics did not reveal meaningful differences between practices included in the analysis relative to all practices in the pilot with respect to pre-implementation data quality.
The completeness and representation of other data used in this evaluation was also strong. For example, at least one individual from 90% of the pilot practices completed one of the two online user experience surveys. Additionally, respondents to these surveys were those who were most likely to engage with the 2D barcode scanning technology—individuals who reported personally recording vaccine administration or vaccine inventory data as well as persons who provide direct clinical care. This strong response to the surveys was likely due to email (and in some cases telephone) reminders on the part of the pilot team. Additionally, the high participation rate from practices may be attributable to communications stemming from an individual on the pilot team with whom practices were familiar and pilot testing the first user experience survey with a subset of the respondent population to identify specific areas where the clarity and applicability of survey language could be improved.
Limitations
As previously noted, it is likely that the practices participating in the project represent a biased sample of practices that could implement 2D barcode scanning in the U.S. Between 97% and 99% of the respondents to the User Expectation Survey (UXS) perceived that 2D barcode scanning would have a very or somewhat positive impact on the accuracy of data recorded about vaccine administrations and vaccine inventory as well as on the efficiency of recording these data. Additionally, the pre-implementation data quality for lot number, expiration date, and product ID was very high in these practices. The average32 data quality for all metrics was over 90% in participating practices, which is much higher than seen in recent annual surveys of IIS (3).
Perhaps the biggest limitation of this pilot project is the inability to directly identify which of the vaccine administration records, including those which were 2D barcoded, in the EMR/EHR and IIS analysis dataset were scanned into the system instead of entered in another manner (e.g., manual entry, select from drop down list). The implication of this limitation is that our team had to develop a reasonable, but certainly imperfect, means for inferring when a lot number or expiration date was likely entered using the 2D barcode scanning technology for the outcome analyses. This reasonable inference is reflected in the Scan Effect variable, which accounted for
31 As noted earlier in the report summary, we were not able to answer questions related to estimating the effects of 2D barcode scanning on the data quality metrics for product ID. 32 Weighted average for practice-month. Please see Chapter 5 for additional details.
20

the presence of 2D barcoded vaccines, the presence of a 2D barcode scanner, an appropriate configuration of technology at a practice, and practice compliance to using 2D barcode scanning. Such inferences come with a certain amount of error that we were not able to quantify as part of the pilot project. However, our team did make extensive efforts to examine patterns in the data associated with the components of the Scan Effect variable to ensure that these patterns were in alignment with expectations.33
Just as there is some uncertainty in our estimate of when a 2D barcode was scanned to record vaccine data, there is also some uncertainty associated with the accuracy metric for lot numbers. As part of a second set of WFAs our team performed in June/July 2014, we became aware of the potential for lot numbers to auto-populate incorrectly into an electronic record following a 2D barcode scan. Some EMR systems select lot numbers via an auto-populate feature that may inadvertently input an incorrect lot number based upon how the EMR selects a match. For example, if the configuration is set up to look for a match with the first three digits of a lot number and there are two lot numbers in the EMR system with the same first three digits, the EMR may select and enter the wrong lot number. Since we characterized a lot number as accurate when it matched a lot number in the reference dataset we would not have detected such inaccuracies in our analyses.
Although the data used for this evaluation are rich and reasonably complete, there are some additional limitations to note. One lesson learned from our work is that great variation exists among practice workflows, technology, and general operations. It is important to document these types of nuances so they can be controlled for in data analyses or included in descriptions of the context within which data analyses should be interpreted. One way the pilot team attempted to capture this type of data was through the recruitment and installation logs. Given that this was a pilot project, we were unaware of all data elements that would be important to capture beforehand. Future efforts should obtain data about whether a practice’s inventory and administration recording are linked through their record system and the specific process used to enter data (e.g., manual entry, drop down menu, what fields auto-populate and how) into an electronic record.
Although the EMR/EHR and IIS data were plentiful, there were some limitations associated with these datasets. First, EMR/EHR records used for the outcome analyses were from 47% of pilot practices. Second, it was common for an affiliated group of practices to aggregate the immunization data across their individual practices prior to communicating their data to an immunization registry. Sometimes we found that the immunization records for a practice within an affiliated group were present in the data we obtained from the EMR/EHR but were not present in records contained in the related IIS data. These appeared to be case-by-case omissions on the part of the originating practice since the omissions were not systematic in nature. Due to the greater level of resolution available in the EMR/EHR dataset (i.e., provided by each practice rather than as a single group at the awardee level), we were able to discern when data were missing or not collected within a practice. As practices submitted data to the pilot team, we kept detailed documentation of each practice’s capabilities to provide each data element. Practices are not all configured to collect all the information the pilot team requested. For example, practices often record only one of the product identifying codes, NCD, CVX or CPT. We were not able to do so with the IIS data given the grouping of practice data by grantee. Immunization reporting requirements of participating IIS did not include alternate reporting requirements for practice group sites than non-practice group sites for the immunization data elements observed in the pilot.
The quality and consistency of data collected for the workflow analyses may have been stronger had the same practice staff member recorded data at WFA1 and WFA2. Although our team made efforts to facilitate consistency in the observations of individuals who performed these measurements, it was not always possible to record data for the same individual at both time points due to turnover and the availability of practice staff. We realize that the approach may have introduced some level of inaccuracy into the time measurements. Given the small average changes between pre and post-measurements, such staffing changes could have introduced enough error to explain some of our findings. This is particularly the case for the findings associated with recording
33 The pilot team issued a simple manual data entry log with the intent for practices to record when they did not or could not scan a 2D barcoded vaccine; however, practice staff completed very few manual logs during the pilot project and the pilot team was therefore unable to use this as a means of identifying additional 2D barcoded vaccines.
21

data about vaccines administered, where we found a mean difference of four seconds. Other evaluation data sources were, however, available to triangulate findings and provide additional support for this finding.
A small number of practices were included in the WFA analyses designed to examine differences in the mean time to record vaccine data. Ultimately, we included data from ten practices in the analyses examining the time to record data about vaccines administered and eight practices in the analyses specific to recording data about vaccines entered into inventory. The small number of practices did limit our ability to perform additional statistical tests that could have provided valuable information for detecting possible reasons for differences in time measurements between practices.
Readers should be aware that survey responses were de-identified; therefore tracking changes in a particular individual respondent’s perceptions from the first to the second user experience survey was not possible. This was a necessary feature of the data collection effort, as it provided a level of confidentiality to the respondent that is important for eliciting candid responses. However, this was at the expense of being able to draw strong conclusions about changes in perceptions and experience over time.
Benefits of the Pilot Project to Date Observations from the overall pilot project indicate that positive change is underway to promote the availability and use of 2D barcodes to record vaccine data. Some positive changes that we consider benefits of the pilot project are:
1. The pilot team successfully worked with GS134 to change the GS1 General Specification to allow the representation of a Global Document Type Identifier (GDTI) in a GS1 DataMatrix Barcode when used for a health care purpose. Working with GS1 health care US representatives, we submitted a change request to the GS1 Standards Maintenance Group. Version 13 of the GS1 General Specification (January 2013) included the resulting changes. The CDC initiated this change to authenticate the use of encoding VIS edition information as a 2D DataMatrix barcode on VIS publications. The resulting change has broadened opportunities for the use of 2D DataMatrix barcodes on other health care documentation.
2. The pilot project also raised awareness of and expectations to use 2D barcoding technology for immunizers, vaccine manufacturers, and EMR/ EHR vendors sooner than otherwise may have been the case – essentially accelerating market acceptance and future use of 2D barcodes. For example, the pilot project resulted in a group of potential early adopters and future champions of 2D barcoding for the immunizer community. Multiple publications and articles in the immunizer community have cited the pilot project. This ongoing buzz can also pique the interest of other health care practices throughout the U.S. that provide immunizations, possibly leading to earlier adoption of this technology. The pilot also raised the awareness and engagement of vaccine manufacturers. Two vaccine manufacturers updated their product lines to accommodate 2D barcodes and others now have plans to add 2D barcodes to their vaccine products for the year 2014 and beyond. Finally, the pilot project raised awareness of 2D barcoding with the EMR/EHR vendor community. At the time of the writing of this report, several vendors now have plans to update the functionality of their product to accept 2D barcodes in immunizer/clinic environments. Overall, this pilot project will likely accelerate the realization of public health benefits that may be associated with 2D barcodes.
It is our hope that members of the immunization community will use the lessons learned from this pilot project to inform their decision-making processes about future 2D barcode vaccine implementation. With this in mind, we offer a set of conclusions and recommendations to inform future discussions.
34 GS1 is an international not-for-profit association dedicated to the design and implementation of global standards and solution to improve the efficiency and visibility of supply and demand chains globally and across sectors. It is the most widely used supply chain standards system in the world. Source: GS1 Website; http//:www.gs1.org
22

Conclusions Findings from this pilot project are mixed. The outcome evaluation suggests that practitioners can save time when recording data about vaccines entered into inventory by using 2D barcode scanning. However, practitioners took longer to record data about vaccines administered. The outcome evaluation also suggests that the primary gains to data quality when using 2D barcode scanning to record data about vaccines administered is to the completeness of lot number and expiration date entries. We did not find similar results for accuracy of lot number and expiration date.
Process evaluation findings indicate a general receptiveness to 2D barcode scanning among participating health care providers (both before and after their use of this technology). Although only partially consistent with what we saw in the outcome evaluation, staff largely perceived that 2D barcoding had positive impacts on the accuracy and efficiency of recording vaccine data at both administration and inventory. Staff reported that it was easy to learn and use 2D barcode scanning technology in a short timeframe. However, staff frequently noted that integrating 2D barcode scanning into their vaccine recording processes was challenging because of the limited number of 2D barcodes available for use during the pilot project timeframe. Staff generally agreed that their practice should use 2D barcode scanning to record vaccine information in the future, if most vaccines have a 2D barcode.
Patterns identified in the process evaluation data suggest that the experience of using 2D barcode scanning was not as positive for staff located within public health departments compared to other types of practices. Specifically, fewer respondents to the second user experience survey who worked in public health departments (n=27, 59%) were satisfied with the introduction of 2D barcodes into their practice relative to pediatric (n=72, 71%) or family practice (n=37, 79%) participants. Respondents from public health departments also more frequently noted that they strongly disagree or disagree (n=12, 43%) that 2D barcoding saved them time to record vaccine administrations than respondents from pediatric (n=16, 20%) or family practice (n=8, 22%) specialties. Similar patterns emerged for perceptions of time savings when recording data about vaccine inventory.
Although the large majority of practice staff indicated that they were satisfied with the introduction of 2D barcode scanning in their practice, it appears that there is room for improvement in the future. Results of statistical tests on the process evaluation data suggest that increasing the volume of 2D barcoded vaccines in the supply chain may result in greater satisfaction levels among end users. Practitioners working in practices where an average of 10% of the vaccines administered between January and April 2013 were 2D barcoded indicated that they were somewhat or very satisfied with the introduction of 2D barcodes, compared to practices where an average of 8% of the vaccines administered were 2D barcoded. Additionally, respondents who reported personally scanning 2D barcodes to record vaccines they administered four or more times in a typical week were more likely to report being very or somewhat satisfied with the introduction of 2D barcodes into their practice than were respondents who scanned less than once in a typical week. This difference was statistically significant.
Recommendations The Implementation Pilot for Two-Dimensional (2D) Vaccine Barcode Utilization provided the immunization community with an opportunity to understand the early implementation of 2D barcode scanning to record data about vaccines administered and vaccine inventory in the U.S. Taking into consideration the findings from the evaluation and the broader lessons learned from our experience designing and supporting the implementation efforts, we offer the following recommendations for consideration by the immunization community:
1. Apply 2D barcodes to the unit-of-use and unit-of-sale for all vaccine products
Results from the outcome evaluation indicate that 2D barcode scanning to record vaccine data may improve the quality of lot number and expiration date entries. Additionally, health care practitioners noted through our surveys that until the opportunity to use 2D scanning becomes the standard instead of the exception, reluctance to adopt 2D scanning would linger. The lack of universal application of 2D
23

barcodes on vaccines limits the likelihood of using 2D barcode scanning to record vaccine data, thereby limiting the potential to improve data quality.
In addition, not taking steps to apply 2D barcodes universally to vaccines counters the positive steps taken or planned by many vaccine manufacturers. During the course of this pilot project, there was an increase in the number of available 2D barcoded vaccines from two in November 2011 to eight in November 2012. As of March 2014, 24 vaccines had 2D barcodes. GSK and Sanofi have applied 2D barcodes to over 60% of the formulations of their vaccines. Merck and GSK both publicly announced their intent to 2D barcode their entire vaccine portfolios. Sanofi Pasteur has similarly announced their intent to 2D barcode their vaccine products but has done so in an incremental manner. In addition, other vaccine manufacturers have shared with us that they are working to apply 2D barcodes to their vaccines.
We also recommend that vaccine manufacturers consider applying 2D barcodes on all vaccine units-of-sale. This practice currently varies by vaccine manufacturer. Entering vaccines into inventory using the NDC located on the unit-of-sale is a common practice. Customers of vaccine manufacturers that have not applied a 2D barcode onto the vaccine unit-of-sale do not have the ability to enter the vaccine unit-of-sale lot number and expiration date via a scan. Universal application of 2D barcodes onto both the vaccine unit-of-use and unit-of-sale would remove this current barrier.
2. Facilitate the development and adoption of EMR/EHR/IIS 2D barcode scanning capabilities
Only two EMR/EHR solutions had established 2D barcode vaccine scanning capabilities in their ambulatory products for vaccine administration and inventory as of the pilot start date. Such capabilities enable EMR/EHR/IIS solutions to process the data from a scan of a 2D barcoded vaccine and deposit all three data elements (lot number, expiration date, and product ID) into the correct locations in a vaccine record. Since this capability was unavailable in most systems, the pilot team used the configuration utility supplied with the 2D barcode scanner to emulate this activity in EMR/EHR/IIS systems. This configuration utility allowed our team to construct practice-specific configurations that were capable of extracting and depositing data elements (lot number and expiration date) encoded on the 2D barcode into EMR/EHR/IIS fields based on the field location in the record.
A configuration utility approach, however, offers a temporary, imperfect, and impractical solution for entering data from a 2D barcode scan into electronic record systems. The implications of using such an approach in the future are numerous. Many EMR/EHR/IIS will not accept all of the data elements included on a 2D barcode when interfaced using a configuration utility. Data entry is unnecessarily complicated for the end-user since they often need to place a cursor in a specific EMR/EHR/IIS field prior to scanning. Adding to data entry complication, scanning configurations are specific to inventory entry or vaccine administration. Switching between configurations requires an end-user to set the scanner into the correct mode by scanning a barcode. If the end-user does not select the appropriate mode and a scan occurs, there is the potential for data to deposit into the incorrect fields in the EMR/EHR/IIS.
Additionally, a configuration utility approach is field position specific. This position-based dependency means that if the field position or tab sequence of a field receiving scanned data changes from its position during the configuration build, a new configuration is required to ensure scanned data deposits into the correct fields.
In order to realize the full potential of 2D barcode scanning, EMR/EHR/IIS vendors will need to enhance their solutions to enable processing data input via a 2D barcode scan. Results from a separate project conducted by Deloitte to identify the functional capabilities these electronic systems need to process 2D barcoded vaccines was recently published by CDC (11). This information may be helpful to vendors wishing to modify their existing systems to support 2D barcode scanning.
3. Standardize IIS receipt of key vaccination data fields
The identification that some IIS participating in the pilot project are not programmed to capture vaccine expiration dates provided from vaccination encounters reported using certain transmission methods (e.g., batch file, HL7) highlights the lack of consistency across IIS. Inconsistent methods across IIS can
24

present challenges to organizations that report vaccination encounters to multiple IIS as well as reduce confidence in IIS vaccination encounter data integrity. An assessment of the existing and planned IIS data receiving abilities by data transmission method would help to develop a comprehensive national picture of the variability currently in place. Using this baseline, a coordinated effort to migrate IIS to a standard of receiving the key vaccination data fields of lot number and expiration date reported to IIS as the data of record will work to establish consistency.
4. Improve stakeholders’ understanding and expectations of 2D barcode scanning to record vaccine data
Findings from the evaluation suggest that opportunities exist for educating the immunization community about 2D barcode scanning. Future educational efforts might focus on increasing the awareness of the purpose and potential positive benefits of using 2D barcode scanning to record data about vaccine administrations. Twenty-eight percent (n=44) of respondents to the final user experience survey who personally scanned 2D barcodes to record vaccine administrations or vaccine inventory were neutral with respect to the statement, “using 2D barcode scanning is important for patient safety.” Educational messages might include information about how 2D barcode scanning may improve vaccine data quality and the resulting benefits. For example, benefits might include increasing the likelihood that health care practitioners will administer the correct vaccine to the right patient at the appropriate time, decreasing the likelihood of administering a vaccine that has past its expiration date, and improving the ability to identify bad lots and the patients who received them.
Another educational opportunity exists to share the general principles of how 2D barcode scanning works with respect to recording vaccine data. Many individuals who responded to the final user experience survey did not select one of the challenges listed—“limitations of EMR/EHR system;” however, many did select “not enough information about the vaccine is scanned into our system.” The resulting information displayed in an electronic record from scanning a 2D barcoded vaccine is largely the result of the functional capabilities of electronic record systems rather than what specific data elements exist on the 2D barcode.
The vaccine manufacturer community has adopted an encoding standard authored by GS1. They have standardized the data elements encoded to contain the same three data elements of lot number, expiration date, and product ID. Enhancements to present information in addition to the three encoded data elements require adjustment by most EMR/EHR/IIS system vendors. Educating health care practitioners about encoded 2D barcoded vaccine data elements and how to leverage them by EMR/EHR/IIS solutions may help set realistic expectations regarding 2D barcode scanning. As an example, a 2D barcode on a vaccine does not include the name of the vaccine manufacturer. An EMR/EHR/IIS can derive this information from the labeler segment of the encoded NDC. Conversely, a 2D barcode on a vaccine does not include data from which an EMR/EHR/IIS can derive whether public or private funds purchased a vaccine. Education in this area may lead to health care practitioners requesting their EMR/EHR/IIS vendors enhance solutions so they enable and optimize the benefits of 2D barcode scanning; thereby facilitating our second recommendation.
5. Perform additional evaluation activities and make adjustments to the existing evaluation methodology
The current evaluation is the first in the U.S. of this magnitude to examine the possible effects of integrating 2D barcode scanning to record vaccine data in health care practices. As such, we have several recommendations about what would be useful to include in future evaluation efforts that examine the use and effectiveness of 2D barcode scanning to record vaccine data.
a. Perform additional evaluations with a direct indicator of 2D barcode scanning: A direct indicator of when vaccine data were entered using a 2D barcode scanner versus another method was not available in the current evaluation. Future evaluations should incorporate a direct indicator of 2D barcode scanning.
b. Conduct additional workflow analyses: Observations conducted during the pilot project were limited to a small sample of practices (n=10) and as a result may not provide an accurate
25

representation of the operational benefits from, and challenges to, incorporating 2D barcode scanning into health care practices. Additional observations across a broader set of practice types may corroborate the WFA findings from the current pilot project or identify new considerations. As an example, dispensary systems in pharmacy settings typically require steps not observed in public and private practices. Additional WFA would also bring greater diversity of the types of EMR/EHR/IIS systems affected. While naturally occurring, initial WFA practices contained a disproportionate number of 2D enabled systems. Also, conducting WFAs once more vaccines with 2D barcodes are in circulation for an extended period of time and after practitioners have adopted the practice of using 2D barcode scanners would afford an opportunity to better understand how 2D barcode scanning affects workflows when 2D barcode scanning to record vaccine data is more prevalent.
c. Assess vaccination data error correction processes: Through the pilot project, we confirmed that a wide variety of processes exists to identify and correct errant vaccination data submitted to immunization registries. Such protocols—such as returning errant data to the submitter or aggregating errant data in a queue for the submitter to correct—exist within health care practices as well as within immunization registries. Improving our understanding of how, and what types, of errors are corrected through these various processes can help to establish more accurate estimates of the effect of 2D barcodes on data quality. Analysts can integrate data about the error handling procedures of practices and their respective IIS into future analyses examining the outcomes of 2D barcode scanning. Such steps will allow analysts to account for the occurrence and subsequent removal of errant records when generating estimates of changes to data accuracy resulting from 2D barcode scanning. Additionally, such analyses should estimate the potential time savings associated with having fewer or no errors in the three data elements of interest (lot number, expiration date, product ID).
6. Perform additional activities to expand the knowledge of the potential uses and effects of 2D barcode scanning to record vaccine data
During the course of this pilot project, the immunization community posed several questions about the potential utility of 2D barcode scanning beyond the settings included in this pilot. Specifically, questions arose about how the potential benefits of 2D barcode scanning might translate in the event of a vaccine recall or pandemic event. Based upon these inquiries we suggest taking the following actions:
a. Assess historical vaccination recall instances: A significant benefit of scanning 2D barcoded vaccines is the potential to enhance patient safety through improved data quality. Future projects can assess the potential extent of improving the quality of vaccine lot number, expiration date, and product ID on patient safety in the event of a vaccine recall. Comparing the recall timeframe and sample patient identification and notification procedures would provide the ability to quantify this benefit of 2D barcoded vaccines, and contribute valuable information to assessing possible benefits.
b. Clarify the potential benefits of using 2D barcoded vaccines for a pandemic response: This pilot project raised many questions from stakeholders about the potential benefits of using 2D barcoded vaccines during a pandemic response. These questions highlighted assumptions and, often, misconceptions regarding the possible benefits and use of 2D barcoded vaccines for recording vaccine data. Developing an information statement that clearly states the data contained in 2D barcoded vaccines and explains ways to leverage these data for incident management and health information systems will provide an efficient mechanism to educate the emergency responder community on the possibilities and limitations of using 2D barcoded vaccines during a pandemic response.
Improving the quality of data about vaccines administered has the potential to protect the public’s health, providing the information that medical and public health practitioners need to identify who received a specific vaccine product in the event of a vaccine recall. Furthermore, such data quality is central to the ability to determine if vaccine-related adverse events are related to a certain vaccine lot, to verify that practitioners are administering the right vaccine to the right patient at the right time, and to reduce the occurrence of the administration of expired vaccines, when vaccines are scanned prior to administration.
Our evaluation suggests that 2D barcode scanning holds promise for improving the quality of data elements important to vaccine safety—lot number and expiration date. It is our hope that the details we offer in this
26

report will inform decisions by immunization providers, immunization awardees, EMR/EHR/IIS vendors, vaccine manufacturers, and Federal agencies as they prepare for a market where 2D vaccine barcoding is becoming increasingly common.
References 1. National Childhood Vaccine Injury Act of 1986, Pub. L. No. 99-660, 42 U.S.C. 300aa-1 to 300aa-34.
(1986).
2. Sobczyk, E. American Academy of Pediatrics [personal communication] 2013 May 8.
3. CDC. Progress in Immunization Information Systems—United States, 2011. MMWR 2013;62:48-51.
4. Bundy, DG, Shore, AD, Morlock, LL, Miller, MR. Pediatric vaccination errors: Application of the “5 rights” framework to a national error reporting database. Vaccine 2009;27:3890-6.
5. Mullooly, J, Drew, L, DeStefano, F, Chen, R, Okoro, K, Swint, E, et al. Quality of HMO vaccination databases used to monitor childhood vaccine safety. Am J Epidemiol 1999;149(2):186-194.
6. Samuels, R.C., Appel, L., Reddy, S.I., Tilson, R.S. Improving accuracy in a computerized immunization registry. Ambulatory Pediatrics 2002;2:187-192.
7. Varricchio, F., Reed, J., VAERS Working Group. Follow-up study of medication errors reported to the Vaccine Adverse Event Reporting System (VAERS). Southern Medical Journal 2006;99(5):486-89.
8. Wilton, R, Pennisi, A. Evaluating the accuracy of transcribed computer-stored immunization data. Pediatrics 1994;94:902-6.
9. Bar Code Label Requirement for Human Drug Products and Biological Products, Final Rule. 21 C.F.R. Parts 201, 606, and 610 [Docket No. 2002N-0204]. (2004).
10. FDA. Guidance for industry: Bar code label requirements—questions and answers; Availability Notice. Fed Regist 2011 Aug 11;76(155): 49772-49773.
11. Deloitte Consulting LLP. EHR-IIS 2D Barcode Functional Capabilities Report (version 1.0). 2013. [cited 2013 Nov 1]. Available from URL: http://www.cdc.gov/vaccines/programs/iis/2d-vaccine-barcodes/downloads/barcode-functional-capabilities.pdf
27