implementation of wireless electrocardiogram …...ii. m ethods ecg monitoring system consists of 5...
TRANSCRIPT
Implementation of Wireless Electrocardiogram
Monitoring System
Thanapong Chaichana, Yutthana Pititeeraphab, Manas Sangworasil, and Takenobu Masuura Biomedical Engineering Program, Department of Physics, Rangsit University, Thailand
Email: {thanapong.c, yutthana.p, manas.s, takenobu.m}@rsu.ac.th
Abstract—We describe the design and development of
wireless electrocardiogram monitoring system to meet the
biomedical needs. Our system is able to acquire, display and
record the patient’s real time electrocardiogram (ECG) data.
Patient data received from this system can be further used
for analysis of abnormal heart rate and new clinical
applications. System hardware comprises of an electrode as
part of signal input, signal conditioning components for
manipulating signal, the 8051 microcontroller unit to
perform signal processing and wireless communication
module. Software was developed in Visual Basic 6 to record
and visualise ECG signal in real time. Therefore, we
implemented ECG monitor system, and this can be used to
advanced ECG study.
Index Terms—microcontroller, ECG, signal processing
I. INTRODUCTION
Heart disease is one of a chronic disease, mostly kill
elderly people as well as tend to be a young generation.
Today our society has been changed rapidly and
technology is a living stand, whilst health system is kept
moving after. Besides, a promising technique is required
to support our healthcare. Electrocardiogram (ECG) is the
electrical activity of the heart [1], [2]. It likes a magnifier
to spot the heart function and bring its motion to be
visible. Hence, early diagnosis and detection of
cardiovascular diseases can be performed by monitoring
ECG signal.
Modern approach for reducing mortality rate is thought
to be performing non-invasive ECG signal monitoring at
home or a non-clinical environment. This requires
persons to measure their ECG signal periodically or
sometimes monitoring. In addition, a basic analysis of
physiological data, such as, ECG data, is required to
provide in education for understanding the heart function
based ECG signal.
Prior research reported on ECG study, Yanowittz et al.,
1974 [1] demonstrated an online computer system to
recognise ECG signal in real time. Results showed that
about 90% of the signals recorded correctly by computer
system when compared to a perspective clinical data.
Because, the signal is too small to be detected, however,
the computer system is reliable to warrant further clinical
study under a controlled condition. Huang et al., 2014 [3]
intended to develop a wearable portable ECG device for
Manuscript received February 20, 2015; revised September 21, 2015.
warning cardiovascular risk factor in real time, and
reported 2 main concerns of the system are a valid signal
transmitting and power consumption of ECG device.
This paper describes an implementing ECG monitoring
system and this system is able to recognise ECG signals
in real-time. In general, heart disease can be identified as
unusual heart rate, whereas, normal resting condition
ranges from 60 to 100 beats per minute, and ECG signal
characterises a beat detection and other features [3]. It
considers as a basic reliable ECG system is a crucial
portable device, and will be extensively used in the
expectation for early finding cardiovascular disease.
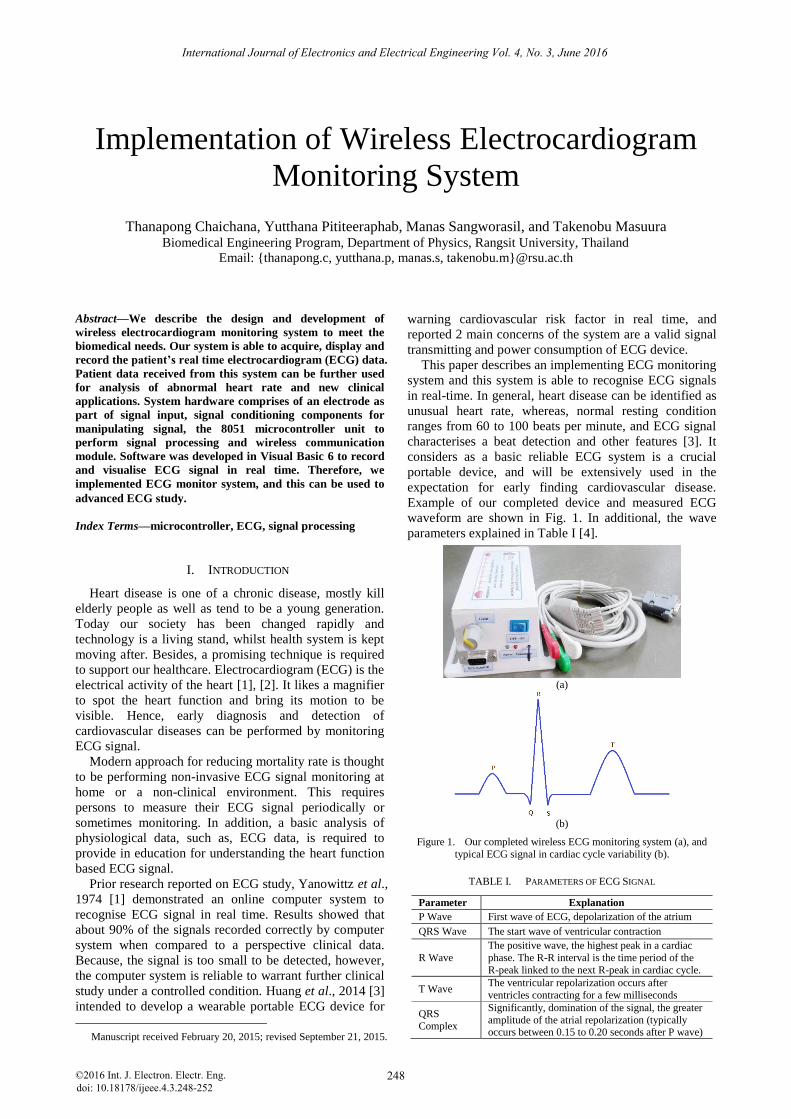
Example of our completed device and measured ECG
waveform are shown in Fig. 1. In additional, the wave
parameters explained in Table I [4].
(a)
(b)
Figure 1. Our completed wireless ECG monitoring system (a), and
typical ECG signal in cardiac cycle variability (b).
TABLE I. PARAMETERS OF ECG SIGNAL
Parameter Explanation
P Wave First wave of ECG, depolarization of the atrium
QRS Wave The start wave of ventricular contraction
R Wave
The positive wave, the highest peak in a cardiac
phase. The R-R interval is the time period of the
R-peak linked to the next R-peak in cardiac cycle.
T Wave The ventricular repolarization occurs after
ventricles contracting for a few milliseconds
QRS
Complex
Significantly, domination of the signal, the greater
amplitude of the atrial repolarization (typically occurs between 0.15 to 0.20 seconds after P wave)
International Journal of Electronics and Electrical Engineering Vol. 4, No. 3, June 2016
©2016 Int. J. Electron. Electr. Eng. 248doi: 10.18178/ijeee.4.3.248-252

II. METHODS
ECG monitoring system consists of 5 sections, signal
input, signal conditioning, signal processing, wireless
communicating and computer software. Furthermore, the
block diagram of this system is shown in Fig. 2.
Figure 2. Block diagram of ECG monitoring system.
A. Signal Input
An electric activity of a heart muscle is measured by
placing an electrode at outer surface of the skin, as the
heart performing of its function to pump the blood
through the circulation system. Electrode is used for
sensing bioelectrical potential caused by muscle cells, as
a result of mechanical events inside heart muscles are a
certain cycle of electrical activity or ECG signal [5], [6].
Thus, electrodes used in this study and location of its
placements, to acquire ECG signal as shown in Fig. 3.
(a) (b)
Figure 3. Acquisition of ECG signal: (a) an electrode (b) placement positions (blue, green and gray dots).
Furthermore, electrodes are located on the body in
different views of the heart, also known as “ECG lead”,
and the ECG lead is expected to be detected the
movement of ion vectors in particularly direction between
two points on the surface of the skin. This is a differential
measurement of the voltage difference projected across
the heart. For this work, electrocardiogram monitoring
system is focused on the lead II configuration concerning
completed combinations of electrodes positioned on the
right arm (negative pole), left leg (positive pole), and the
reference electrode is positioned on the right leg (a signal
ground connection) or relatively positioned on the left
arm, in the present use.
There are three configurations of the ECG monitoring
purpose: namely, lead I, II and III, to perceive the
projection of ion moving vectors flow from the negative
pole to the positive pole (normally called electrical
polarity) (see Fig. 3, ECG lead II configuration). In order
to receive the large positive R-wave (see Fig. 1(b)), ECG
lead II is the most frequently used, since this type of
configuration provided the large positive R-wave, and in
this study, ECG monitoring system was used lead II
placement. The relationship between lead I, II, and III
configurations can be expressed as:
Lead I + Lead III = Lead II (1)
where lead I, II, and III are the lead voltages according to
Kirchhoff’s law defined on the Einthoven standard limb
leads (bipolar) [7].
B. Signal Conditioning
Typically, ECG signal obtained from an electrode was
very small amplitude, and ranged around ±2mV, is a very
weak signal [5]. Thus, an accurate amplification of ECG
signal is a crucial practice, and required to further
analysis and displaying a proper ECG waveform.
Moreover, the Common-Mode Rejection Ratio (CMRR)
of electronic amplifier is required as a high ratio to reject
an unwanted input signals from the lead input of ECG
signal. For this reason, the INA326 instrumentation
amplifier has been selected and used in this study for
improved about 1,000 times of original signal and
received an accurate ECG data for displaying unit.
C. Microcontroller
Accurate ECG signal was achieved by signal
conditioning unit, then signal processing is required to
perform interchanging analogue signal into digital form
for wireless communicating unit. Microcontroller was
commonly employed to visualise ECG signal [8], [9].
The digital converter is mostly used a microcontroller.
For this purpose, the Texas Instruments ADC0804 was
used for converting analogue to digital signal. And then
transfer digital ECG signal to a wireless transmitter, the
8051 microcontroller was used for this purpose.
Therefore, this digital ECG signal is further processed for
wireless communication with PC laptop or desktop.
D. Wireless Connection
The 2 Xbee-pro wireless modules was used for
wireless communicating, one was set up as a wireless
transmitter connected with 8051 microcontroller to send
the digital ECG signal, and the other one was set up as
receiver connected with computer/laptop using USB port
to receive ECG signal in a digital form. Wireless ECG
system was regularly engaged to figure ECG signal [10]-
[12]. The main purpose to use the wireless system is to
provide an opportunity to translate the wireless station to
be a wearable wireless ECG device. However, there are
several signal processing issues to be resolved beforehand
for a modern healthcare application, and this hope is
expected to be obtained the ECG data with additional
information on signal processing techniques should be
provided.
E. Computer Software
Software to visualise ECG signals was developed in
Visual Basic, used to process the received ECG data. At
this time, we can detect instantaneous ECG data
incorporated with the heart rate. Fig. 4 displays a
Graphical User Interface (GUI) for visualising ECG
signal. In addition, the calculation of heart rate was
calculated using the peak of R-wave, in the term of the
International Journal of Electronics and Electrical Engineering Vol. 4, No. 3, June 2016
©2016 Int. J. Electron. Electr. Eng. 249

time period in between the R-peak to R-peak, identified
as R-R interval [13], [14]. The calculation of heart rate in
beat per minute can be determined by (2).
Heart rate = 60/R-R interval (2)
where R-R interval is an average time between R-peak-
to-R-peak.
III. RESULTS AND DISCUSSION
ECG Signals were measured in analogue and digital
forms using our device (see Fig. 1). The wireless range
was set up in a room’s length is about five metres.
Testing measurement has done in both ECG simulator
and actual human. ECG simulator generated 3 different
signals are 30, 60 and 120 beats per minute, and then our
ECG monitor device was used to measure ECG signals
from the ECG simulator. The measurements of acquired
ECG signals were 34, 60 and 121 beats per minute. These
parameters were calculated percentage different between
our ECG monitor against the heart rate that generated
from ECG simulator. As a result, calculations of
percentage changes were 13.33%, 0% and 0.83%,
respectively. In addition, three volunteers were measured
ECG signal using our device. The computations of heart
rate are 63, 65, and 74 beats per minute. For example, in
the measured ECG from the third volunteer presented an
average R-R interval was roughly 0.8125 s, and then the
computed heart rate by (2) is 74 beat per minute.
For instance, a beat detection of ECG signal and its
corresponding frequency are shown in Fig. 5.
(a)
(b)
Figure 4. ECG signal: (a) and resulted signal in frequency (b).
Figure 5. The designed GUI to visualise ECG signal.
ECG signal is a very small in amplitude, and we found
that the accuracy of ECG monitoring system is depending
on the amplifier department for gain o an input signal
received from the electrodes placed on the skin. In this
work, we designed and tested the instrumentation
amplifiers, before choosing the high-performance, low-
cost amplifier INA326. To prove that, we used ECG
simulator to generate the signal input (voltage input) with
stage of 0.004 volts peak-to-peak and frequency is 40Hz.
We then increased signal amplitude by calculating gain
with designed amplifier circuit for 100 times, 500 times
and 1,000 times, respectively. Table II presents a
different gain of ECG signal, and the percentage error.
Results in Table II showed that our designed amplifier
unit presented a practical voltage gain response. The
voltage output increased at 1,000 times of input, and the
error rate had shown an acceptable voltage output at 4.75
percentage error for each time in ten calculations. As a
result, ECG signal measurement in order to the voltage
gain error, for instance, ECG identification from ECG
simulator revealed a computation of heart rate was 121
beats per minute, presented 1% fluctuation of actual 120
heart rate reached out from the ECG simulator.
In addition, we also tested an accuracy of a wireless
unit, compared with ECG system using leads, and found
that data transmitting is over five metres has established
International Journal of Electronics and Electrical Engineering Vol. 4, No. 3, June 2016
©2016 Int. J. Electron. Electr. Eng. 250

an unstable signal receiving to display on the software
window. Thus, our ECG wireless monitor was used
within a room’s length, as well as, wireless system
offered a securing condition for patients while using ECG
monitoring unit, and this may prevent a current revert to
patient from a short circuit on a computer.
TABLE II. CALCULATION OF ECG GAIN RESPONSE
Voltage Out Voltage Gain = Vout/Vin
100 500 1,000
1 0.40 1.76 3.80
2 0.40 1.76 3.80
3 0.40 1.96 3.80
4 0.42 1.96 3.80
5 0.40 2.00 3.60
6 0.38 2.00 3.60
7 0.42 1.76 3.80
8 0.40 1.96 3.96
9 0.40 2.00 3.96
10 0.40 2.00 3.96
Average 0.40 1.92 3.81
Actual Gain 100 480 952.5
Error (%) 0.00 4.00 4.75
IV. CONCLUSION
This paper presented the wireless ECG monitoring
system to acquire real-time ECG signal. This preliminary
work is quite important to visualise the heart condition,
and this system might be advantaged for further research
on investigation of electrocardiogram information to
indicate on the heart failure. In the recent development,
ECG monitoring system intended for signal acquisition
and visualisation in real-time. System hardware consisted
of ECG signal detector and amplifier, integrated signal
with microcontroller and wireless unit. Software for
visualising real-time ECG signal was developed in Visual
Basic 6.
ECG monitoring system has been tested on the
volunteers and verified with ECG simulator. The 3 adults
were measured ECG signals, and measurement results
showed that all volunteers had the pulse rate are 64, 65,
and 74 beats per minute, respectively. According to
verify the measured ECG results, the ECG simulator was
arranged signal outputs, 3 different parameters of the
pulse rate are 30, 60, 120 beats per minute. This ECG
system monitoring was confirmed with ECG simulator,
and the percentage differences on each measurement are
13.33%, 0% and 0.83%, respectively. Therefore, ECG
system is acceptable, and useful for further healthcare
applications.
Future works included improvement of the ECG signal
detector for visualising smoothly and more stable ECG
signal, analysis of ECG waveform to provide more
realistic data to cover all information, and investigation of
the patient-specific ECG data to possibly designate the
heart failure and abnormal ECG rhythm.
REFERENCES
[1] F. Yanowitz, P. Kinias, D. Rawling, and H. A. Fozzard, “Accuracy of a continuous real-time ECG dysrhythmia monitoring
system,” Circulation, vol. 50, pp. 65-72, 1974.
[2] A. Muegmanee, K. Siviengxay, and Y. Pititeeraphab, “A study on the design and construction of wireless electrocardiogram monitor,”
BSc Dissertation, Biomedical Engineering Program, Department
of Physics, Rangsit University, Thailand. [3] A. Huang, W. Xu, Z. Li, L. Xie, M. Sarrafzadeh, X. Li, and J.
Cong, “System light-loading technology for mHealth: Manifold-
Learning-Based medical data cleansing and clinical trials in WE-CARE project,” IEEE Journal of Biomedical and Health
Informatics, vol. 18, no. 5, pp. 1581-1589, 2014. [4] Electrocardiography I Laboratory: CleveLabs Laboratory Course
System, Teacher edition, Cleveland Medical Devices Inc., pp. 6,
2006.
[5] D. H. Gawali and V. M. Wadhai, “Implementation of ECG sensor
for real time signal processing applications,” in Proc. IEEE
Conference ICAECC, 2014, pp. 1-3. [6] J. C. Hsieh, K. C. Yu, H. C. Chuang, and H. C. Lo, “The clinical
application of an XML-based 12 lead ECG structure report
system,” in Proc. IEEE Conference Computers in Cardiology, 2009, pp. 533-536.
[7] J. Malmivuo and R. Plonsey, Bioelectromagnetism – Principles
and Applications of Bioelectric and Biomagnetic Fields, New York: Oxford University Press, 1995, ch. 15.
[8] D. Sarkar and A. Chowdhury, “Low cost and efficient ECG
measurement system using PIC18F4550 microcontroller,” in Proc. IEEE Conference EDCAV, 2015, pp. 6-11.
[9] R. Rieger and S. Deng, “Double-Differential recording and AGC
using microcontrolled variable gain ASIC,” IEEE Transactions on Neural Systems and Rehabilitation Engineering, 2013, vol. 21, pp.
47-54.
[10] L. H. Wang, T. Y. Chen, K. H. Lin, Q. F. Fang, and S. Y. Lee,
“Implementation of a wireless ECG acquisition SoC for IEEE
802.15.4 (ZigBee) applications,” IEEE Journal of Biomedical and
Health Informatics, vol. 19, no. 1, pp. 247-255, 2015.
[11] T. H. Tsai, J. H. Hong, L. H. Wang, and S. Y. Lee, “Low-Power
analog integrated circuits for wireless ECG acquisition systems,”
IEEE Transactions on Information Technology in Biomedicine, vol. 16, no. 5, pp. 247-255, 2012.
International Journal of Electronics and Electrical Engineering Vol. 4, No. 3, June 2016
©2016 Int. J. Electron. Electr. Eng. 251
[12] C. T. Lin, K. C. Chang, et al., “An intelligent telecardiology
system using a wearable and wireless ECG to detect atrial fibrillation,” IEEE Transactions on Information Technology in
Biomedicine, vol. 14, no. 3, pp. 726-733, 2010.
[13] H. ChuDuc, P. K. Stein, and H. PhamManh, “Effect of calculation algorithm on heart rate variability by chaos theory,” International
Journal of Electronics and Electrical Engineering, vol. 1, pp. 145-
148, 2013.
[14] G. D. Clifford, F. Azuaje, and P. E. McSharry, Advanced Methods
and Tools for ECG Data Analysis, London: Artech House, 2006.
Thanapong Chaichana joined Rangsit
University in January 2015 as a lecturer in
signal and medical image processing, and research supervisor in the Rehab and Robotics
Lab, Biomedical Engineering, Rangsit
University. He is a former postdoctoral research fellow in division of medical physics,
faculty of medicine and health, University of
Leeds, England, United Kingdom. He was awarded Ph.D. scholarship by E-Medicine
centre, Western Australia in 2008, where he obtained his Ph.D. in medical imaging (biomedical engineering) from Curtin University (the
Western Australian Institute of Technology), Perth, Australia in
December 2012. He received his B.Eng (science scholarship recipient) in electronics engineering and M.Eng in biomedical electronics from
King Mongkut's Institute of Technology, Ladkrabang, Bangkok,
Thailand in 2006 and 2008, respectively. His major research interests focus on signal and image processing and cardiovascular
haemodynamics.

Yutthana Pititeeraphab received his Bachelor of Industrial Technology in
telecommunication technology, and Master of
Engineering in biomedical electronics from King Mongkut's Institute of Technology,
Ladkrabang, Bangkok, Thailand in 2002 and
2007, respectively. He is currently a lecturer in digital electronics. He teaches the product
design engineering and microcontroller
programming with its applications. He is a co-founder of the Rehab and Robotics Lab, Biomedical Enginnering,
Rangsit University. His researches focus on robotic arm, haptic device,
microcontroller and control system.
Manas Sangworasil received the M.E. and
D.E. degrees in telecommunication engineering from Tokai University, Hiratsuka,
Japan, in 1990 and 1977, respectively. He
obtained his B.Eng. in electronic engineering from King Mongkut's Institute of Technology,
Ladkrabang, Bangkok, Thailand, in 1973,
where he was a key person including director of computer research and service centre, head
of department of electronics engineering,
director of postgraduate research studies, and chief of electronics research centre. He is currently an associate professor in signal and
image processing at division of biomedical engineering, department of
physics, Rangsit University. Before that, he was an associate professor in electronic engineering, King Mongkut's Institute of Technology,
Ladkrabang. His research interests include electrocardiogram analysis,
signal and image processing.
Takenobu Matsuura received the M.E. and
D.E. degrees in electrical engineering from
Tokai University, Hiratsuka, Japan, in 1973 and 1976, respectively. From 1988 to 1989, he
stayed as a visiting professor at the University
of Essex, Colchester, England, United Kingdom. He is currently a professor in signal
and image processing at division of
biomedical engineering, department of physics, Rangsit University, Thailand. He is a
former professor at the department of electrical and electronic
engineering, Tokai University, Japan. His research interests include camera calibration, pattern recognition, image processing and signal
processing.
International Journal of Electronics and Electrical Engineering Vol. 4, No. 3, June 2016
©2016 Int. J. Electron. Electr. Eng. 252