implementation of service dominant …680130/fulltext01.pdffigure.5.12. customer‘s information...
TRANSCRIPT
1
ALIF ADITYA SUWANDARU 900403-T291
IMPLEMENTATION OF SERVICE DOMINANT LOGIC IN PUBLIC
TRANSPORT (Case Study: Lampung Province)
Business Administration Master‘s Thesis
30 ETCS
Term : Spring 2013 Supervisor : Samuel Sebathu
i
APPROVAL
ii
DECLARATION
Hereby, I declare that the work described in this thesis is, except those which at
legally referred and stated in stated in references, entirely my original work and
has not been submitted as an exercise for a degree at this or any other
university.
Yogyakarta, December 3rd, 2013
Alif Aditya Suwandaru
iii
ACKNOWLEDGMENT
In the name of Allah, the Most Gracious and the Most Merciful. Alhamdulillah,
all praises to Allah for the strengths and blessing in completing this thesis.
Thanks to Allah, because of Him I had the best opportunity to study in MSTT
UGM Indonesia and Karlstad University, Sweden.
I would like to express my warmest gratitude for my beloved family, especially
for my mother and my father. Thank you for all dedication, supports, advices
and love for me. I‘ll always love you. For my sisters, Galuh Hesti Wulandari and
Rully Novira Elvandari you are my spirit. For Ministry of Education and
Ministry of Transportation Indonesia, I would like to give my highest
appreciation and thankfulness for the scholarship during I studied in both
country, Indonesia and Sweden. I would say thanks very much for Lars
Haglund and Samuel Sebhatuin Karlstad University Sweden, who had taught
me patiently and always give me challenges to finish this study. My special
thanks also for my second family in Sweden, Mbak Lina and Jan Lundström,
Ana and Urban, Yani and Andrew, Sherly and Morgan, Camelia and Stefan,
Irine and Martin, and Evan Justin. Thank you for sharing, care, help and love
during my days in Sweden. For my beloved friends in the same house, same
class and same university in Sweden, Agung, Muchlis, Tri, Rini, Ade and Kudus,
thank you very much for everything that we‘ve been through in Råtorpsvagen
28. For My MSTT friends, Mas Nafiq, Faiz Agung, Nanda, Irfan , arif cdx,
Afriyanti, Mieke, Helmi and Heru, you are incredible. I would be grateful for
having great friends since i came to Yogyakarta, Ais, Ashari, Ucok, Yoko, Tata,
Sintya, Ayu and Hana, thank you for your support and best wishes for me.
My best tribute to Prof. Dr. Ir. Siti Malkhamah, M.Sc who had given me advice
and support as supervisor in MSTT UGM. And also high appreciation I give to
Ir. H. Wardhani Sartono, M.Sc., and Ir. Latif Budi Supama, M.Sc., Ph.D., as
examiners of my thesis and for Mr. Latif Budi Supama i would say thanks you
very much for your kindness. Thank you very much to Mr. Prof. Ir.
SigitPriyanto, M.Sc., Ph.D as a Head of MSTT UGM who had given me an
opportunity to study here. And also for all staff in MSTT UGM, mbak Emi,
mbak Dina, mbak Nuning, mas Darto, i should say thank you very much.
Regrettably, but inevitably, the following list of names will be incomplete, and I
hope that those who are missing will forgive me, and will still accept my sincere
appreciation of their influence on my work. Thank you.
iv
Yogyakarta, December 3rd, 2013
Alif Aditya Suwandaru
DEDICATION
In the name of Allah, the Most Gracious and the Most Merciful
“Which God favor that you deny” (Ar-Rahman:13)
And I wish..
That i will be the one who always being grateful for any favor that YOU give to
me
For that .. I dedicate this thesis to you ..
My god, my Lord Allah SWT and his messenger Prophet Muhammad SAW..
I dedicate to my parents.. As a sign of my love ..
And for all my family and my friends .. As the sign my love for you all..
From me
Alif Aditya Suwandaru
v
TABLE OF CONTENTS
APPROVAL ...............................................................................................................i
DECLARATION ...................................................................................................... ii
ACKNOWLEDGMENT ......................................................................................... iii
DEDICATION ..........................................................................................................iv
TABLE OF CONTENTS........................................................................................... v
LIST OF FIGURES ............................................................................................... viii
LIST OF TABLES ..................................................................................................... x
ABSTRACT..............................................................................................................xi
CHAPTER I INTRODUCTION ................................................................................ 1
A. Background ....................................................................................................... 1
B. Research Objectives .......................................................................................... 3
C. Research Questions ........................................................................................... 3
D. Research Scope ................................................................................................. 4
E. Limitation .......................................................................................................... 4
F. Research Benefits .............................................................................................. 4
G. Writing Structure .............................................................................................. 5
CHAPTER II LITERATURE REVIEW ................................................................... 7
A. General .............................................................................................................. 7
B. Sustainable ........................................................................................................ 8
C. Public Transport Integration ........................................................................... 10
D. Market Orientation in Public Transport .......................................................... 14
E. Type of Research ............................................................................................. 18
1. Qualitative Research .................................................................................... 18
2. Case Study ................................................................................................... 19
CHAPTER III THEORITICAL FRAMEWORK .................................................... 22
A. From GD-Logic to SD-Logic.......................................................................... 22
1. Co-Creation .................................................................................................. 22
2. Resources Integration .................................................................................. 23
B. Service Innovation .......................................................................................... 24
C. Public Transportation ...................................................................................... 26
1. From Old Public Transport to New Public Transport.................................. 26
vi
2. Buss Rapid Transit ....................................................................................... 28
D. Value Creation On Public Transport............................................................... 29
E. Sustainable for Public Transportation Business Model .................................. 31
F. Contract and Stakeholder Relationship ........................................................... 32
1. Contract ........................................................................................................ 32
2. Stakeholder Relationship ............................................................................. 34
G. Summary ......................................................................................................... 36
CHAPTER IV RESEARCH METHODOLOGY .................................................... 39
A. General ............................................................................................................ 39
B. Collecting Data................................................................................................ 40
C. Analysis Method ............................................................................................. 42
D. Validity and Reliability ................................................................................... 42
CHAPTER V RESULTS AND DISCUSSION ....................................................... 44
A. Introduction ..................................................................................................... 44
B. The Description of Public Transportation in Lampung Province ................... 44
1. Trans Bandar Lampung ............................................................................... 44
2. Public Transportation in Bandar Lampung before BRT .............................. 47
3. Regency and Province Bus .......................................................................... 49
4. ORGANDA ................................................................................................. 51
5. DISHUB and PEMPROV ............................................................................ 53
C. Performance Measure on Sustainable Public Transport ................................. 54
1. Transit service aspects ................................................................................. 55
2. Summary on Performance Measure ............................................................. 62
D. Creating Public Transportation Based on Service Dominant Logic ............... 63
1. Co-Creating Public Transport Provision...................................................... 63
2. The Role of Service Provider ....................................................................... 65
3. Value Creation Process of Public Transport Operators ............................... 67
4. Innovating Sustainable Public Transport ..................................................... 71
E. Preventing Trans Bandar Lampung From Collapse ........................................ 74
1. Engaging Stakeholders in Public Transport Business ................................. 74
2. Creating Robust Engagement ...................................................................... 76
F. Reflection to Zurich and Freiburg ................................................................... 80
CHAPTER VI CONCLUSION AND CONTRIBUTION....................................... 83
A. Conclusion ...................................................................................................... 83
B. Contribution .................................................................................................... 84
C. Future Research ............................................................................................... 84

vii
REFERENCES ........................................................................................................ 85
viii
LIST OF FIGURES
Figure.2.1. The four pillars of sustainable urban transportation ...................... 11
Figure.3.1. your customer, your competitor, your company ............................. 24
Figure.3.2. Value creation framework (dimensions and levels) for public transit
30
Figure.3.3. The Relationship of Stakeholders in Public Transport .................. 36
Figure.4.1. Research methodology framework ................................................... 46
Figure.5.1. Trans Bandar Lampung ...................................................................... 49
Figure.5.2. Trans Bandar Lampung Routes ......................................................... 50
Figure.5.3. Old public transportation in Bandar Lampung (Angkot) .............. 51
Figure.5.4. DAMRI ................................................................................................. 52
Figure.5.5. Province and Regency Bus Route in Lampung Province .............. 54
Figure.5.6. Customer‘s satisfaction about performance of public transportation
in Lampung Province .......................................................................... 58
Figure.5.7. Customer‘s perception about service coverage area of Trans Bandar
Lampung to residence area ................................................................. 59
Figure.5.8. Customer‘s desire about service up and down passengers on Trans
Bandar Lampung .................................................................................. 60
Figure.5.9. Customer‘s perception about headway on Public Transportation Bus
on Lampung Province ......................................................................... 61
Figure.5.10. Customer‘s perception punctuality of Public Transport in Lampung
................................................................................................................
................................................................................................................ 62
Figure.5.11. Customer‘s satisfaction with hospitality of Trans Bandar Lampung
employee ................................................................................................ 63
Figure.5.12. Customer‘s information about departure schedule of bus .......... 64
Figure.5.13. Customer‘s opinion about fare on Trans Bandar Lampung ........ 65
ix
Figure.5.14. Customer‘s satisfaction on Trans Bandar Lampung .................... 67
Figure.5.15. Bandar Lampung citizen choice between Trans Bandar Lampung
and Old Public Transportation (Angkot) .......................................... 69
Figure.5.16. Building a competitive service advantage....................................... 69
Figure.5.17. Customer‘s reason to use Trans Bandar Lampung ....................... 71
Figure.5.18. Trans Bandar Lampung ticket revenue .......................................... 73
Figure.5.19. Customer‘s opinion about the necessary of permanent shelter .. 76
Figure.5.20. Customer‘s satisfaction about service extension ―mini cinema‖ on
the Boat .............................................................................................. 77
Figure.5.21. Stakeholders relationship in Regency and province Bus in
Lampung Province ............................................................................. 79
x
LIST OF TABLES
Table.2.1. Main Characteristics of Public Transit System ................................. 15
Table.2.2. Characteristic of each type of case study ........................................... 22
Table.3.1. Comparison G-D Logic vs S-D Logic in Public Transport ............ 27
Table.4.1. The necessary data from relevant Institutes ...................................... 45
Table.5.1. The Number of Province Buses in Lampung Province .................. 53
Table.5.2. Performance Measure on Public Transportation On Lampung
Province.................................................................................................................... 66
xi
ABSTRACT
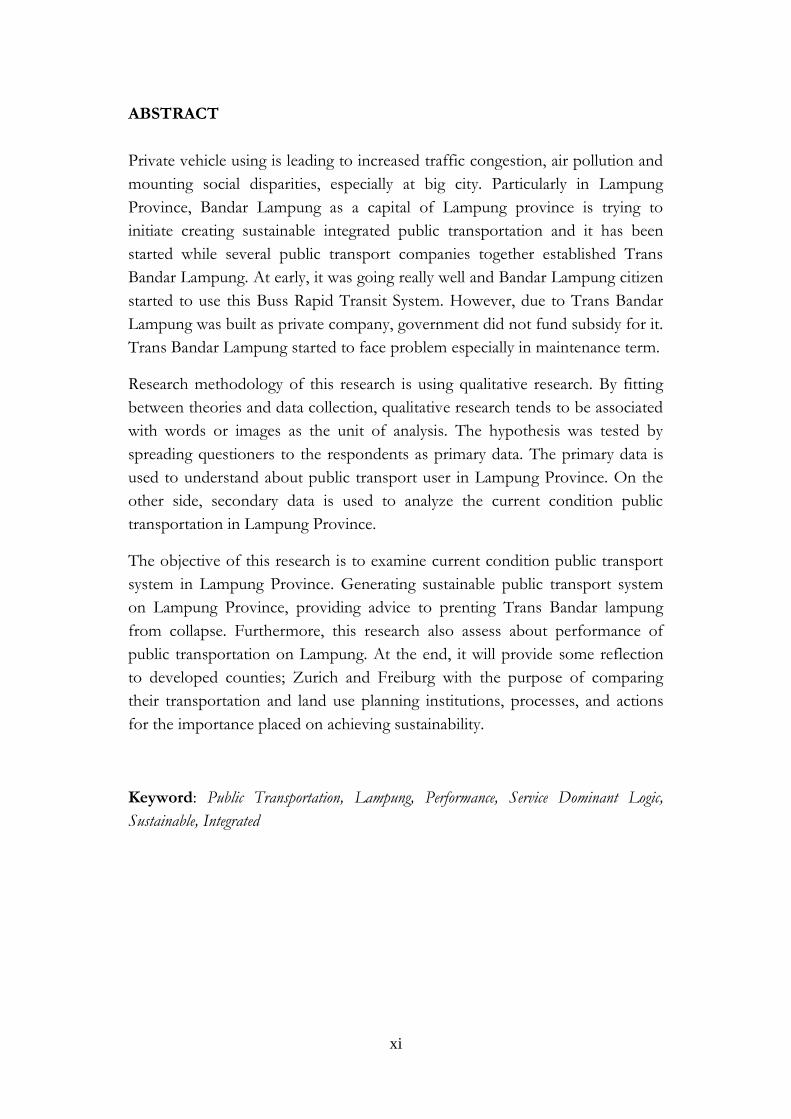
Private vehicle using is leading to increased traffic congestion, air pollution and
mounting social disparities, especially at big city. Particularly in Lampung
Province, Bandar Lampung as a capital of Lampung province is trying to
initiate creating sustainable integrated public transportation and it has been
started while several public transport companies together established Trans
Bandar Lampung. At early, it was going really well and Bandar Lampung citizen
started to use this Buss Rapid Transit System. However, due to Trans Bandar
Lampung was built as private company, government did not fund subsidy for it.
Trans Bandar Lampung started to face problem especially in maintenance term.
Research methodology of this research is using qualitative research. By fitting
between theories and data collection, qualitative research tends to be associated
with words or images as the unit of analysis. The hypothesis was tested by
spreading questioners to the respondents as primary data. The primary data is
used to understand about public transport user in Lampung Province. On the
other side, secondary data is used to analyze the current condition public
transportation in Lampung Province.
The objective of this research is to examine current condition public transport
system in Lampung Province. Generating sustainable public transport system
on Lampung Province, providing advice to prenting Trans Bandar lampung
from collapse. Furthermore, this research also assess about performance of
public transportation on Lampung. At the end, it will provide some reflection
to developed counties; Zurich and Freiburg with the purpose of comparing
their transportation and land use planning institutions, processes, and actions
for the importance placed on achieving sustainability.
Keyword: Public Transportation, Lampung, Performance, Service Dominant Logic,
Sustainable, Integrated
1
CHAPTER I INTRODUCTION
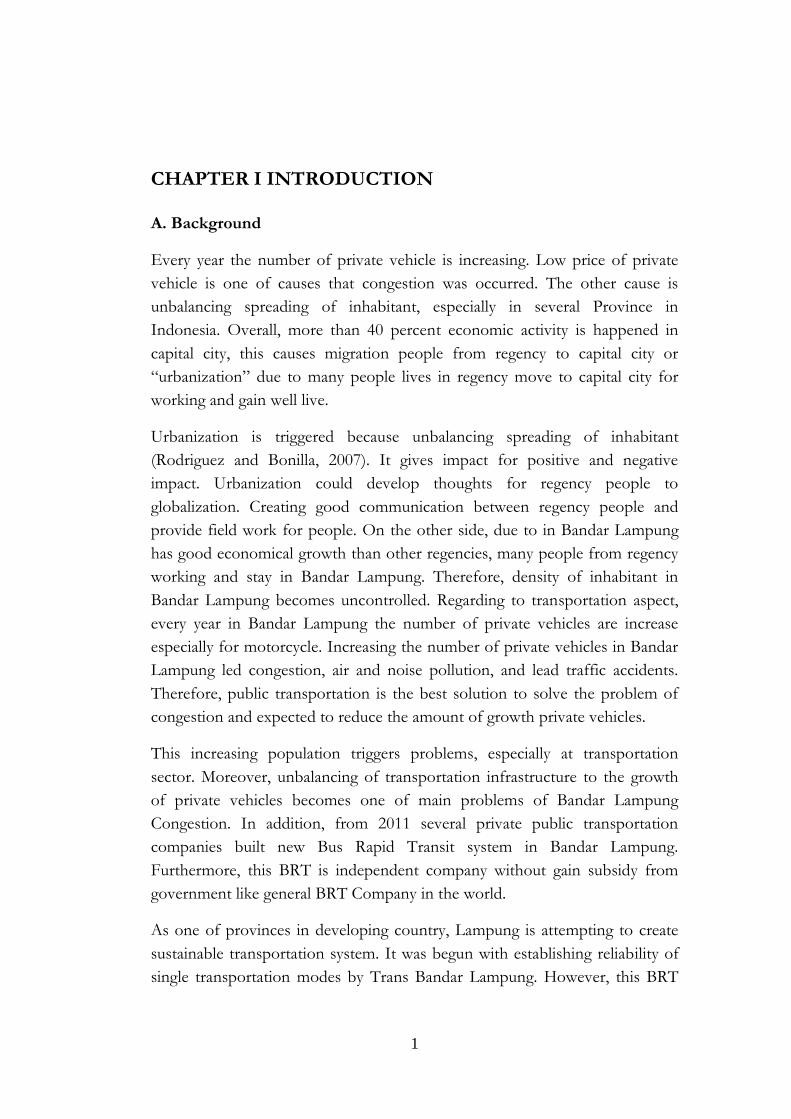
A. Background
Every year the number of private vehicle is increasing. Low price of private
vehicle is one of causes that congestion was occurred. The other cause is
unbalancing spreading of inhabitant, especially in several Province in
Indonesia. Overall, more than 40 percent economic activity is happened in
capital city, this causes migration people from regency to capital city or
―urbanization‖ due to many people lives in regency move to capital city for
working and gain well live.
Urbanization is triggered because unbalancing spreading of inhabitant
(Rodriguez and Bonilla, 2007). It gives impact for positive and negative
impact. Urbanization could develop thoughts for regency people to
globalization. Creating good communication between regency people and
provide field work for people. On the other side, due to in Bandar Lampung
has good economical growth than other regencies, many people from regency
working and stay in Bandar Lampung. Therefore, density of inhabitant in
Bandar Lampung becomes uncontrolled. Regarding to transportation aspect,
every year in Bandar Lampung the number of private vehicles are increase
especially for motorcycle. Increasing the number of private vehicles in Bandar
Lampung led congestion, air and noise pollution, and lead traffic accidents.
Therefore, public transportation is the best solution to solve the problem of
congestion and expected to reduce the amount of growth private vehicles.
This increasing population triggers problems, especially at transportation
sector. Moreover, unbalancing of transportation infrastructure to the growth
of private vehicles becomes one of main problems of Bandar Lampung
Congestion. In addition, from 2011 several private public transportation
companies built new Bus Rapid Transit system in Bandar Lampung.
Furthermore, this BRT is independent company without gain subsidy from
government like general BRT Company in the world.
As one of provinces in developing country, Lampung is attempting to create
sustainable transportation system. It was begun with establishing reliability of
single transportation modes by Trans Bandar Lampung. However, this BRT
2
could not solve transportation problems in Bandar Lampung. The traffic jam
is increasing significantly due to people still buy private vehicles. In addition,
this BRT does not have a special lane on the road so that road capacity to be
narrowed. Another problem is due to this BRT does not gain subsidy from
government nowadays this BRT almost bankrupt. Furthermore, many their
buses were taken by bank because they could not afford to pay credit of bus
purchasing.
On the other side Lampung Province already had Regency Bus and Province
Bus which served people inside province or between Lampung to another
Province for instance Jakarta. The Regency Bus operates from one terminal to
another, in medium distance within in the Province. And The Province Bus
operates from one terminal to another, in medium distance within in the
Country. Moreover, these Regency and province Bus were operated of several
private companies and Government. Damri is company which was built by
government to serve people in Public Transport in Regency and Province
Area. Furthermore, one of interesting issue in this problem is when private
companies on Regency and Province Bus still could compete to Damri even
though they do not obtain subsidy from Government. This model ought to be
implemented by BRT Company which did not obtain subsidy from
Government. In addition, BRT could not be sustainable like other private
Company in Regency and Province Bus which in same condition (did not
obtain subsidy).
In addition this research will have some reflection to public transportation
systems; Zurich and Freiburg which have been developed their system
properly. Zurich becoming the centre of conurbation where many working
places are located in the town and the suburbs are mostly residential areas the
traffic may soon become a problem and needs a clear traffic policy. And finally
they could create tram (one of transportation modes) being lifestyle at among
Zurich citizen. And Freiburg is another city which has the growth in
availability of cars yet the growth of public transport passenger and bicycle
trips were increase. The council of Freiburg implemented restriction from cars
which means Restricted auto use has been achieved through mechanisms such
as pedestrianization of the city centre, area-wide traffic calming schemes (such
as a citywide speed limit of 30 km/h in residential areas) and more difficult,
expensive parking.
3
Sustainable is not about threat analysis; sustainable is about systems analysis.
Specifically, it is about how environmental, economic, and social systems
interact to their mutual advantage or disadvantage at various space-based
scales of operation (Transportation Research Board, 1997). This aim of
research is how Trans Bandar Lampung is almost collapse without subsidy
from government when on the other side Regency and Province Bus still
survive with independence fund by their selves. Furthermore, this research is
to address about analyzing current condition and suggesting creating
sustainable public transportation in Lampung Province to attract more
passengers or customers to use public transport which adapted from value
configuration spaces theories from Gebauer et.al 2010. It also concerning
about, creating sustainable public transportation by service innovation,
transformation transportation in old system which concerning on Goods
Dominant logic (G-D logic) into Service Dominant Logic (S-D logic).
B. Research Objectives
The research objectives of this thesis are:
1. To discover how people in Lampung Province receive Public
Transport Service.
2. To conduct explorative study and analyzing performance on Public
Transport in Lampung Province.
3. To understand how ―Service Dominant Logic‖ as new conception of
business model could be implemented on Public Transportation.
4. To analyze and providing recommendation for saving Trans Bandar
Lampung.
5. To provide the reflection the public transportation system in Zurich
and Freiburg to Lampung Province.
C. Research Questions
According to explanation from background on above and also research
objectives, this research concentrates on the phenomena which occur on
public transportation in Lampung Province. Several question emerging on this
research:
4
1. How is the general description of public transportation in Lampung
Province (the current condition of Regency and province bus,
particularly on city public transportation)?
2. What indicators are needed to measure performance from sustainable
public transport technically?
3. How to create public transportation in Lampung Province which is
based on ―Service Dominant Logic‖?
4. What is the strategy to Trans Bandar Lampung which shall to be
implied for avoiding Trans Bandar Lampung from collapse?
5. How Zurich and Freiburg can be a reflection on public transportation
system in Lampung Province?
D. Research Scope
This research will focus on creating sustainable Public Transport System in
Lampung Province. It will analyze and elaborate about current public
transport system in Lampung and how to develop it into sustainable public
transport system based on value configuration spaces, in addition about
performance measure in creating sustainable public transportation and to
further provide reflection to Zurich and Freiburg.
E. Limitation
This research studies about analyzing and suggesting about creating sustainable
public transport in Lampung Province and reflection to developed cities which
have succeeded on implementation of creating sustainable public
transportation; Freiburg and Zurich. Research implemented in Freiburg and
Zurich using literature study. Data about public transportation in Lampung
Province is obtained from internet, newspapers and private/public documents
which have been released.
F. Research Benefits
This research is expected could provide advantage such:
5
1. Improving knowledge and understanding at service and market
orientation of public transportation in creating sustainable integrated
public transportation system in Indonesia especially in Lampung
Province.
2. The result that has been obtained could be used as consideration at
planning and creating of public transportation in creating sustainable
integrated public transportation system on the future.
G. Writing Structure
Chapter 1: Introduction
This chapter will explain about research background, research purpose,
research questions, scope of work, and writing structure. This part only discuss
about general points in this research.
Chapter 2: Literature Review
Literature review based itself on the results of previous research relevant to
the issues being studied by researchers. The results of previous studies are
used as a reference to determine the subject matter, the direction and purpose
of the study.
Chapter 3: Theoretical Framework
This chapter will discuss about all of research theories, which are divided into
Service Innovation Service innovation on public transport, Sustainable Public
Transport and Value Configuration, Value creation in public transport.
Chapter 4: Methodology
Methodological chapter will discuss about research methodology, which
consist of qualitative research explanation, case study, collecting data methods,
analysis methods, research process, and limitation of the research.
Chapter 5: Result and Discussion
This chapter is analyzing the findings based on literatures and theories, which
will conclude other theories that will be used as conclusions and be considered
as a new strategy for creating sustainable public transport.
6
Chapter 6: Conclusion
Conclusion is the summary of researcher obtained after doing research on that
case. In this part is also will be written suggestions about strategies that could
be implied on the future.
7
CHAPTER II LITERATURE REVIEW
A. General
Nowadays, transportation movement has an important role in developments
in a particular area. Transportation needs is a pattern activities in the land-use
system that requires movement to support those needs. Therefore,
transportation infrastructure should be planned as possible to avoid
complications traffic in the future.
The understanding of transportation which was proposed by Nasution (1996)
interpreted as the movement of goods and people from place of origin to the
destination. Thus, with these activities then there are three things which the
charge transported, the availability of vehicles as a means of transportation,
and the presence of road that can be passed. Motion the process of moving
from place of origin, where the activities transport to the destination begins
and where the activity is terminated. Moreover, with the movement of goods
and people, then transport is one sector that can support economic activity
(the promoting sector) and service providers (the servicing sector) for the
development of economy. Another understanding of transportation was
proposed by Susilo (1999) who argued that transportation is the movement of
people's behavior in space, either in bringing himself and carrying goods.
Additionally, Tamin (1997) revealed that, transport infrastructure has two
important roles, namely as a tool to direct development in urban areas and the
infrastructure for the movement of people or property arising from the
activities in the urban areas. By looking at the two roles conveyed above, the
first role is often used by planner‘s developers to develop their Regency
territory in accordance with the plan.
Therefore, transportation has strong links with economy, where an area that
has good facilities and infrastructure will support the economic activities of
the area. However, if the activity increases, the economy would lead to high
movement area so that they can lead to problems of transportation. As
expressed by Tamin (1997) that economic growth has linkages with transport,
as a result of the economic growth increases a person's mobility and
movement also needs to be increase exceeds the available capacity of transport
infrastructure.
8
B. Sustainable
Sustainable transport is an enormously complex and dynamic subject. If we
achieve a sustainable transport sector and reduce national greenhouse gas
emissions, government intervention will be necessary. The institution and
professional engineers have an obligation to contribute and help government
and community work towards more sustainable transport systems and
outcomes.
The necessity of addressing serious environmental challenges makes the
already complex business of transportation planning extremely difficult.
Designing corridors, streets and thoroughfares to provide safe movement and
access to people and goods, by cost-effective means, involves application of
management and technology to resolve many social, economic and political
forces. Add to this delicate balance a number of pressing environmental
concerns, such as impacts of air pollution on human health, global climate
change and destruction of land ecosystems, poses a challenge that stretches
human ingenuity and organizational capability (Homer Dixon, 2001).
The urban population in the developing world is close to 50% and growing
rapidly. In the developed world, which already has a 75% urban population,
designing sustainable transportation systems is considered one of the most
pressing issues faced by modern cities (Hall, 1998). Of particular issues is the
rapid growth of sprawling, low-density suburbs where commuters, especially
those travelling across town, rely largely on automobile use. Vehicle emissions,
congestion and auto dependency conspire to reduce quality of life in many
cities.
There can be little doubt that certain urban forms are more ‗efficient‘ in terms
of the level of automobile usage (often measured in terms of vehicle-km
travelled, VKT), energy use, atmospheric emissions, travel cost and land use.
Studies of Toronto, for example, have consistently found that per household
VKT, emissions and annualized travel costs all increase as residential locations
suburbanize (Miller and Ibrahim, 1998; Miller et al., 2004). Conversely, there is
little to no evidence worldwide that current patterns of urban growth
(characterized by low-density suburban ‗sprawl‘ and increasing auto
dependency) are sustainable in the long run. Indeed, the most likely prognosis
for the future under a ‗business as usual‘ scenario is increasingly dysfunctional
9
cities, involving ever-increasing congestion, loss of quality of life, and, most
likely as a result, decreasing economic productivity and competitiveness (for an
early discussion of the ‗pathology‘ of large, auto-dependent cities, see
Mumford, 1961).
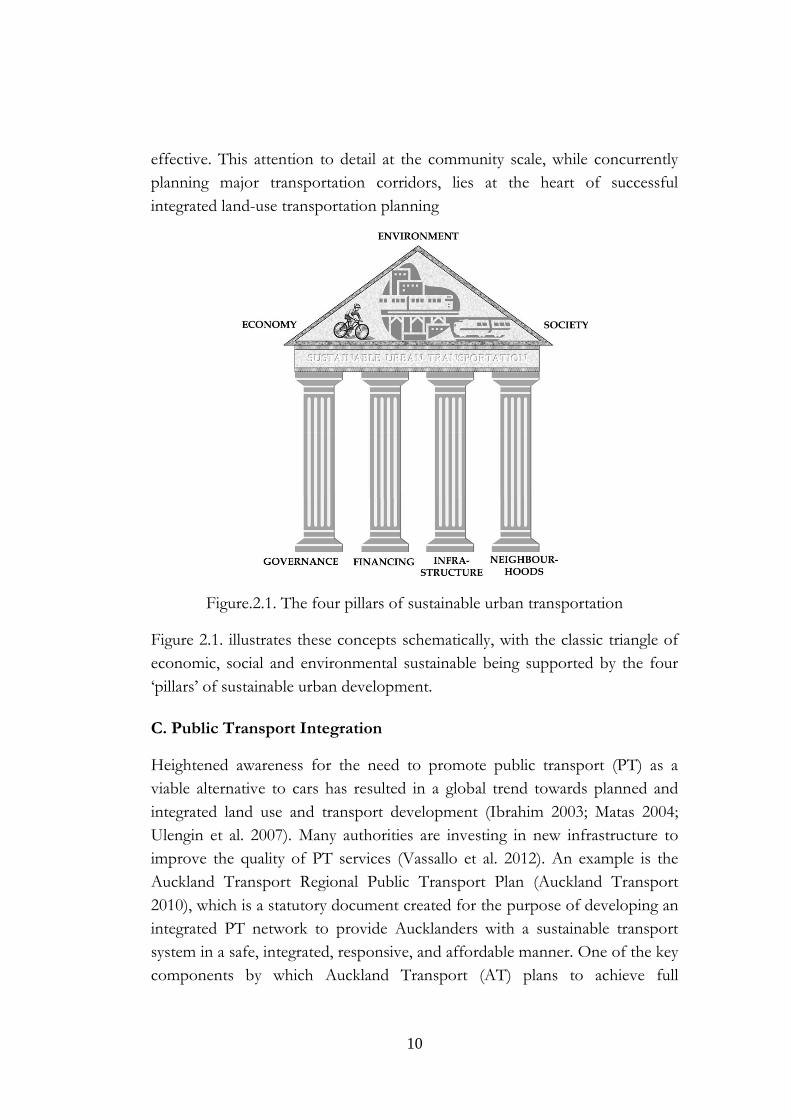
There are 4 pillars related to the sustainable urban transportation. The first
pillar is a matter of governance. The urban planner or transportation official
understanding the need for sustainable transportation and wishing to do
something about it may likely be unable to do so. In most cases, such
authorities probably do not have the mandate, responsibility, power or support
to make decisions that are consistent with sustainable development. Perhaps
the most common problem is the division in responsibly between
transportation authorities and land-use planners. The key question is raised
about what are the characteristics of an ideal governing body for integrated
land-use transportation planning.
As it is argued, for the third pillar, that major infrastructure investment is
required, and then a prerequisite step is the creation of a stable funding
mechanism. Several different means of financing capital investments and long-
term maintenance are reviewed.
Given how unsustainable are current transportation systems, it is inevitable
that major infrastructure investments must be made to correct this. Several
authors have argued that it is expedient to make more effective use of current
infrastructure rather than building a new (Gillen, 1996; Rietveld and Bruinsma,
1998). This is a reasonable position if continuation of the status quo is the
objective. But the continuation of current conditions whereby in many urban
Regencys 75% of trips, or more, are made by gasoline-fuelled automobiles is
inconsistent with global sustainable. Whether the solution is greater use of less
environmentally damaging modes of transport or a change in automobile
technology either way involves significant long-term infrastructure
investments.
There is accompanied by actions at the local scale. There are also many local
policies and small scale investments that might improve the attractiveness of
walking, cycling and transit use. Although there is contention in the literature,
these local actions may potentially boost ridership on more environmentally
sustainable transportation modes, ensuring that major investments are cost
10
effective. This attention to detail at the community scale, while concurrently
planning major transportation corridors, lies at the heart of successful
integrated land-use transportation planning
Figure.2.1. The four pillars of sustainable urban transportation
Figure 2.1. illustrates these concepts schematically, with the classic triangle of
economic, social and environmental sustainable being supported by the four
‗pillars‘ of sustainable urban development.
C. Public Transport Integration
Heightened awareness for the need to promote public transport (PT) as a
viable alternative to cars has resulted in a global trend towards planned and
integrated land use and transport development (Ibrahim 2003; Matas 2004;
Ulengin et al. 2007). Many authorities are investing in new infrastructure to
improve the quality of PT services (Vassallo et al. 2012). An example is the
Auckland Transport Regional Public Transport Plan (Auckland Transport
2010), which is a statutory document created for the purpose of developing an
integrated PT network to provide Aucklanders with a sustainable transport
system in a safe, integrated, responsive, and affordable manner. One of the key
components by which Auckland Transport (AT) plans to achieve full

11
integration of the network is through facilitation of intermodal and intramodal
transfers.
The aim of an integrated multimodal transport system is to provide transit
users with a ―wide spectrum‖ of destination choices and also with convenient,
accessible, comfortable, safe, speedy, and affordable transport system while
supporting future demand (Ibrahim 2003; Luk and Olszewski 2003; Ulengin et
al. 2007). With an integrated transport system, transit users do not board a
single line, but a whole system (Clever 1997). One of the key components in
achieving an user-friendly integrated transport system is to develop ―seamless‖
transfers (Luk and Olszewski 2003). Easy transfers provide transit users with
access into the entire public transport network, thus making transfers a benefit
rather than something to be avoided (Maxwell 2003). Hutchinson (2009)
discusses that for urban journeys, commuters are willing to use transfer routes
given integration among operators. Integration reduces the cost of transfers
for users, which increases the attractiveness of PT (Hidalgo 2009).
One of characteristics on public transit system is the location for transfer. The
main purpose of transfer centers is to facilitate links among PT services. In
Developed country, construction of transfer centers has been used as an
important measure for development of multimodal integration to promote PT
use (Vassallo et al. 2012). Some literature (Clever 1997; Vassallo et al. 2012)
has illustrated the importance of strategic location of transfer centers to reduce
the exchange time for travelers transferring from one transport mode to the
next. A study by Currie and Willis (1998) suggested that physical integration of
terminals is a key factor in facilitating transfers between terminals. The study
noted that although some of the surveyed stations and bus stops were in close
proximity to each other, transfers among these stations could not be classified
as being ―planned‖ since the stops were separate from the station area.
Physical integration of terminals needs to be designed from a planning and
management level (Currie and Willis 1998).
Well-designed and appropriate location of transfer centers were shown to
benefit the surrounding community by creating opportunity for development
(Volinski and Page 2006). Involvement of the community during the design
phase instigates the transfer center to be perceived as a symbol of pride for the
community. Security provisions at the center provide a safe environment for
the surrounding area (Volinski and Page 2006).
12
1. Network Integration
Routes are required to be connected from a network perspective to allow
transit users to access a wider range of destinations. Planning connections, as
such, will facilitate transfer to be perceived as a benefit rather than something
to be avoided (Clever 1997). Proper integration of a multimodal transport
system will reduce wasteful duplication of route services and, thus, improve
the utilization of resources (Ibrahim 2003).
2. Integrated Timed-Transfer
The aim of integrated timed-transfers is to interconnect the multimodal PT
network such that the transfer times are minimized (Clever 1997; Maxwell
1999). This is achieved by operators synchronizing their scheduled routes to
develop a pulsed hub network (Becker and Spielberg 1999). Since the
performance of timed-transfer is dependent on schedule reliability,
implementation improves the overall reliability of the transport system
(Maxwell 2003). Routes and scheduling are required to be designed
simultaneously (Becker and Spielberg 1999).
3. Integrated Connection for Transfers
Terminals are required to be physically connected for the transfers among
them to be considered as being ―planned‖ (Currie and Willis 1998). Integration
between terminals has been defined as sheltered walkways between terminals,
security measures at connected walkways, and information provisions such as
signage providing guidance between the connected terminals, a map of the
local street area, and the locations of connected walkways (Currie and Willis
1998; Ibrahim 2003; Luk and Olszewski 2003).
4. Information Integration
Transfers are perceived as being barriers to using PT, and, therefore, suitable
information is required to make connections easy and convenient (Grotenhuis
et al. 2007). An integrated information system is essential to facilitate urban
and interurban multimodal trip planning (Zografos et al. 2008). With many
advanced PT information systems available, real-time information can be
made accessible directly to the transit user en route (Zhang et al. 2011). Such
an information system can assist transit users with pre-planning transfers and
13
then providing guidance en route, thereby reducing the chances of missed
connections and providing travel support (Grotenhuis et al. 2007; Zhang et al.
2011).
5. Fare and Ticketing Integration
A common global approach in the development of an integrated multimodal
transport system has been fare and ticketing system integration (Luk and
Olszewski 2003; Matas 2004; Garcia and Azan 2005; Hidalgo 2009). Fare
system integration of a multimodal PT network has been shown to facilitate
―seamless‖ transfers and thus encourage the use of transfer routes (Sharaby
and Shiftan 2012). A simple user-friendly integration, such as smart cards, can
improve the efficiency of boarding and egressing (Luk and Olszewski 2003;
Blythe 2004).
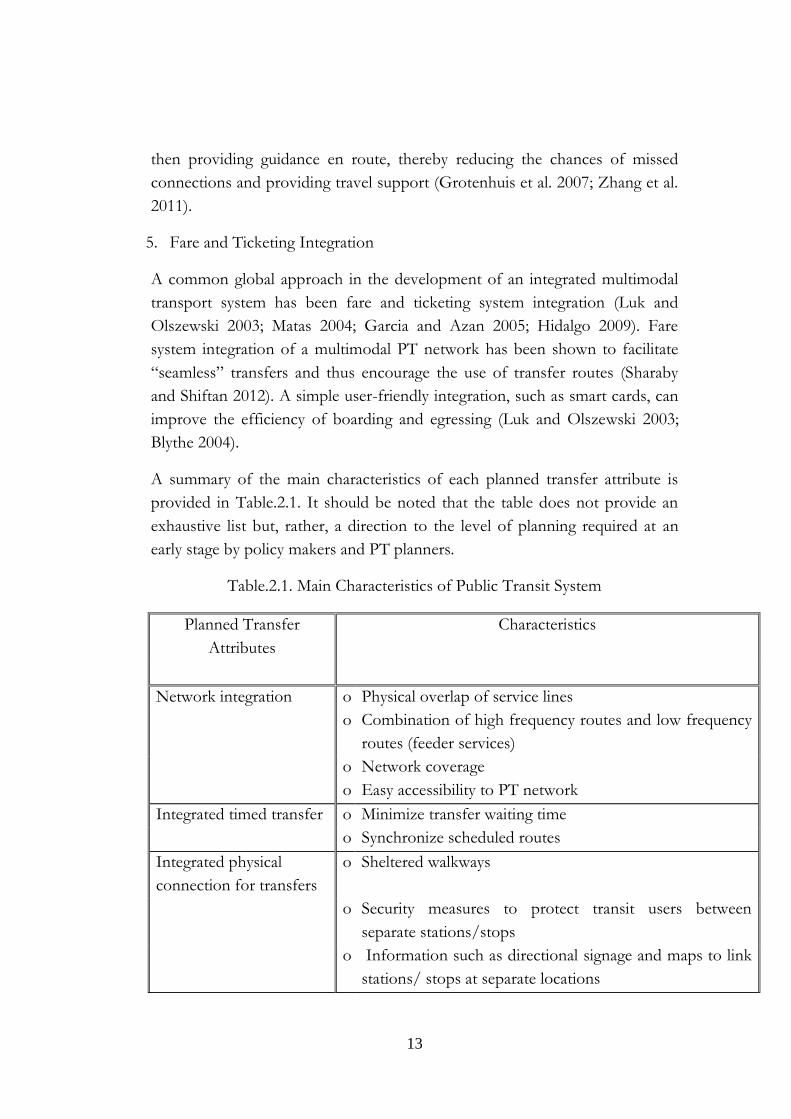
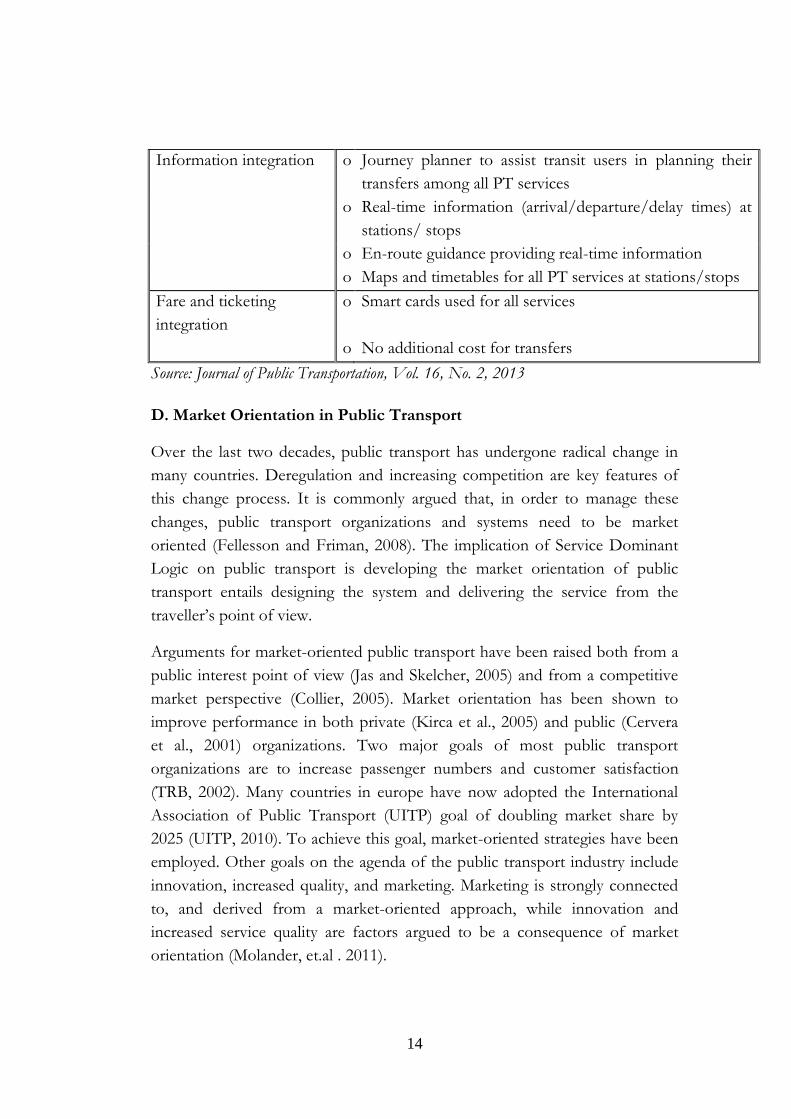
A summary of the main characteristics of each planned transfer attribute is
provided in Table.2.1. It should be noted that the table does not provide an
exhaustive list but, rather, a direction to the level of planning required at an
early stage by policy makers and PT planners.
Table.2.1. Main Characteristics of Public Transit System
Planned Transfer
Attributes
Characteristics
Network integration o Physical overlap of service lines
o Combination of high frequency routes and low frequency
routes (feeder services)
o Network coverage
o Easy accessibility to PT network
Integrated timed transfer o Minimize transfer waiting time
o Synchronize scheduled routes
Integrated physical
connection for transfers
o Sheltered walkways
o Security measures to protect transit users between
separate stations/stops
o Information such as directional signage and maps to link
stations/ stops at separate locations
14
Information integration o Journey planner to assist transit users in planning their
transfers among all PT services
o Real-time information (arrival/departure/delay times) at
stations/ stops
o En-route guidance providing real-time information
o Maps and timetables for all PT services at stations/stops
Fare and ticketing
integration
o Smart cards used for all services
o No additional cost for transfers
Source: Journal of Public Transportation, Vol. 16, No. 2, 2013
D. Market Orientation in Public Transport
Over the last two decades, public transport has undergone radical change in
many countries. Deregulation and increasing competition are key features of
this change process. It is commonly argued that, in order to manage these
changes, public transport organizations and systems need to be market
oriented (Fellesson and Friman, 2008). The implication of Service Dominant
Logic on public transport is developing the market orientation of public
transport entails designing the system and delivering the service from the
traveller‘s point of view.
Arguments for market-oriented public transport have been raised both from a
public interest point of view (Jas and Skelcher, 2005) and from a competitive
market perspective (Collier, 2005). Market orientation has been shown to
improve performance in both private (Kirca et al., 2005) and public (Cervera
et al., 2001) organizations. Two major goals of most public transport
organizations are to increase passenger numbers and customer satisfaction
(TRB, 2002). Many countries in europe have now adopted the International
Association of Public Transport (UITP) goal of doubling market share by
2025 (UITP, 2010). To achieve this goal, market-oriented strategies have been
employed. Other goals on the agenda of the public transport industry include
innovation, increased quality, and marketing. Marketing is strongly connected
to, and derived from a market-oriented approach, while innovation and
increased service quality are factors argued to be a consequence of market
orientation (Molander, et.al . 2011).
15
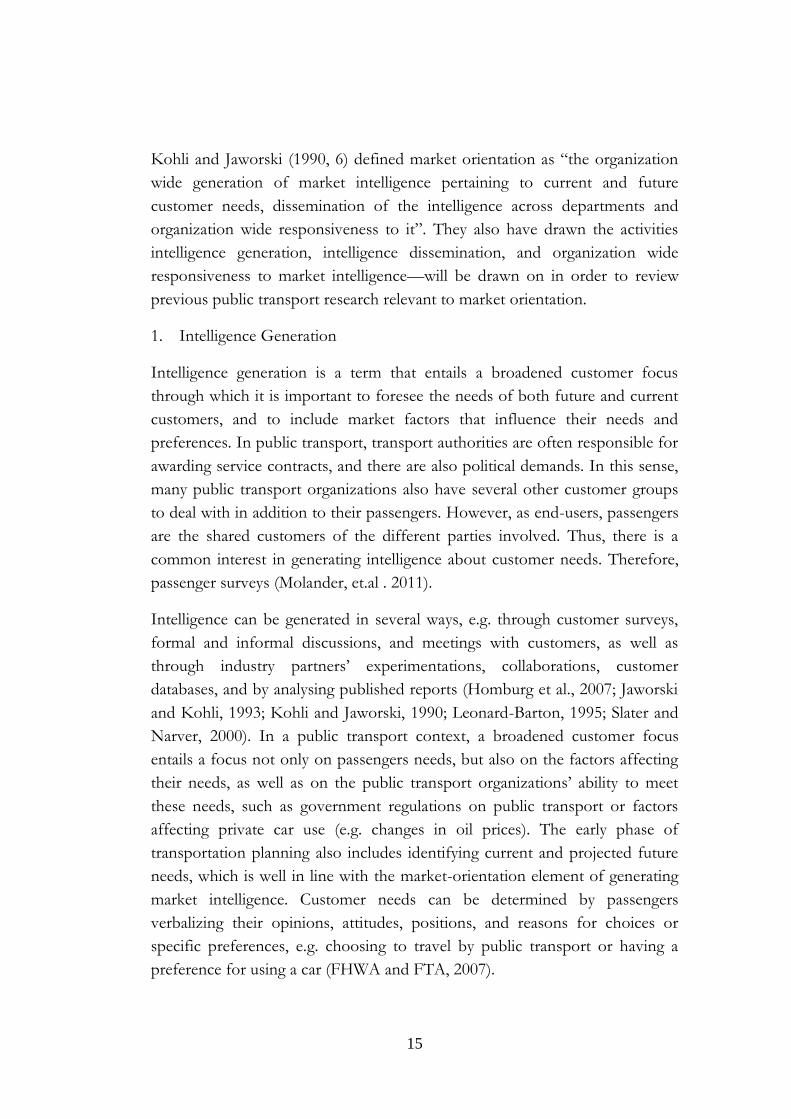
Kohli and Jaworski (1990, 6) defined market orientation as ―the organization
wide generation of market intelligence pertaining to current and future
customer needs, dissemination of the intelligence across departments and
organization wide responsiveness to it‖. They also have drawn the activities
intelligence generation, intelligence dissemination, and organization wide
responsiveness to market intelligence—will be drawn on in order to review
previous public transport research relevant to market orientation.
1. Intelligence Generation
Intelligence generation is a term that entails a broadened customer focus
through which it is important to foresee the needs of both future and current
customers, and to include market factors that influence their needs and
preferences. In public transport, transport authorities are often responsible for
awarding service contracts, and there are also political demands. In this sense,
many public transport organizations also have several other customer groups
to deal with in addition to their passengers. However, as end-users, passengers
are the shared customers of the different parties involved. Thus, there is a
common interest in generating intelligence about customer needs. Therefore,
passenger surveys (Molander, et.al . 2011).
Intelligence can be generated in several ways, e.g. through customer surveys,
formal and informal discussions, and meetings with customers, as well as
through industry partners‘ experimentations, collaborations, customer
databases, and by analysing published reports (Homburg et al., 2007; Jaworski
and Kohli, 1993; Kohli and Jaworski, 1990; Leonard-Barton, 1995; Slater and
Narver, 2000). In a public transport context, a broadened customer focus
entails a focus not only on passengers needs, but also on the factors affecting
their needs, as well as on the public transport organizations‘ ability to meet
these needs, such as government regulations on public transport or factors
affecting private car use (e.g. changes in oil prices). The early phase of
transportation planning also includes identifying current and projected future
needs, which is well in line with the market-orientation element of generating
market intelligence. Customer needs can be determined by passengers
verbalizing their opinions, attitudes, positions, and reasons for choices or
specific preferences, e.g. choosing to travel by public transport or having a
preference for using a car (FHWA and FTA, 2007).
16
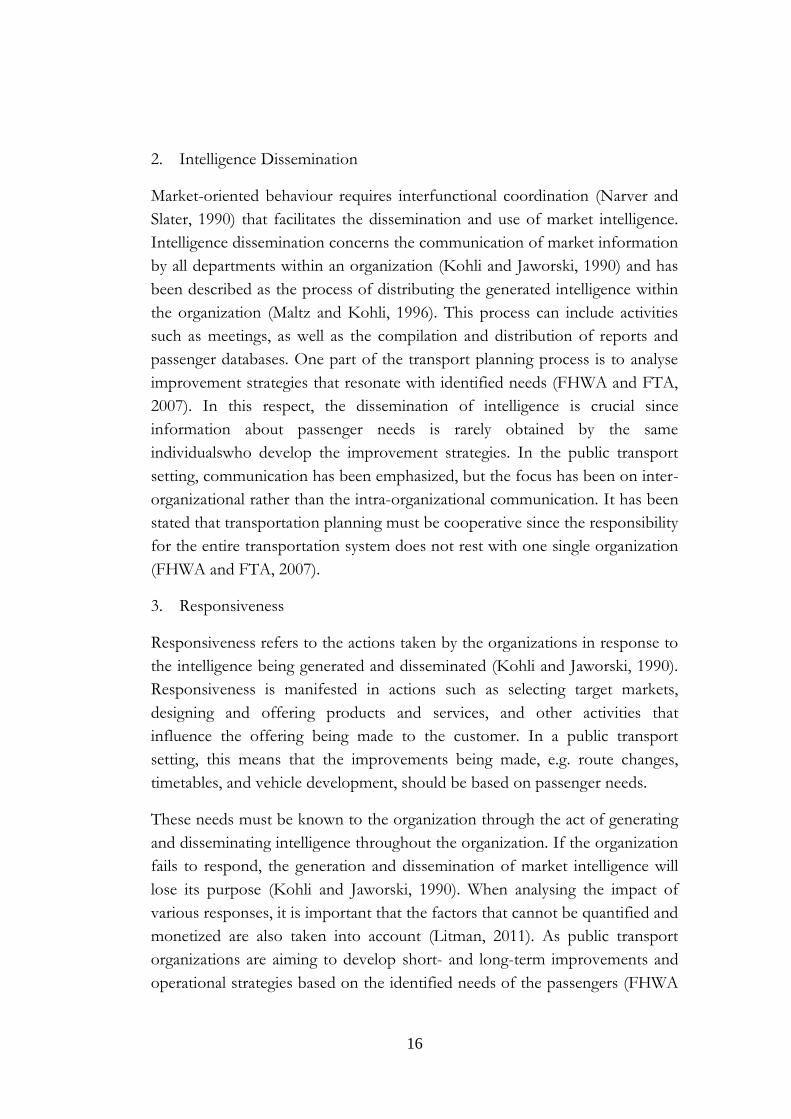
2. Intelligence Dissemination
Market-oriented behaviour requires interfunctional coordination (Narver and
Slater, 1990) that facilitates the dissemination and use of market intelligence.
Intelligence dissemination concerns the communication of market information
by all departments within an organization (Kohli and Jaworski, 1990) and has
been described as the process of distributing the generated intelligence within
the organization (Maltz and Kohli, 1996). This process can include activities
such as meetings, as well as the compilation and distribution of reports and
passenger databases. One part of the transport planning process is to analyse
improvement strategies that resonate with identified needs (FHWA and FTA,
2007). In this respect, the dissemination of intelligence is crucial since
information about passenger needs is rarely obtained by the same
individualswho develop the improvement strategies. In the public transport
setting, communication has been emphasized, but the focus has been on inter-
organizational rather than the intra-organizational communication. It has been
stated that transportation planning must be cooperative since the responsibility
for the entire transportation system does not rest with one single organization
(FHWA and FTA, 2007).
3. Responsiveness
Responsiveness refers to the actions taken by the organizations in response to
the intelligence being generated and disseminated (Kohli and Jaworski, 1990).
Responsiveness is manifested in actions such as selecting target markets,
designing and offering products and services, and other activities that
influence the offering being made to the customer. In a public transport
setting, this means that the improvements being made, e.g. route changes,
timetables, and vehicle development, should be based on passenger needs.
These needs must be known to the organization through the act of generating
and disseminating intelligence throughout the organization. If the organization
fails to respond, the generation and dissemination of market intelligence will
lose its purpose (Kohli and Jaworski, 1990). When analysing the impact of
various responses, it is important that the factors that cannot be quantified and
monetized are also taken into account (Litman, 2011). As public transport
organizations are aiming to develop short- and long-term improvements and
operational strategies based on the identified needs of the passengers (FHWA
17
and FTA, 2007), the essence of the market orientation concept has, to some
extent, been acknowledged within the industry.
However, the extent to which this approach has been adopted and
implemented, both in theory and practice, as well as whether or not the
organizations have the proper knowledge and tools to pursue such an
approach, is unclear. Finally, it should be noted that responsiveness concerns
the organizational level. Responses on an aggregated level, e.g. the elasticity of
travel demand, are covered neither in the market orientation literature nor in
the present review.
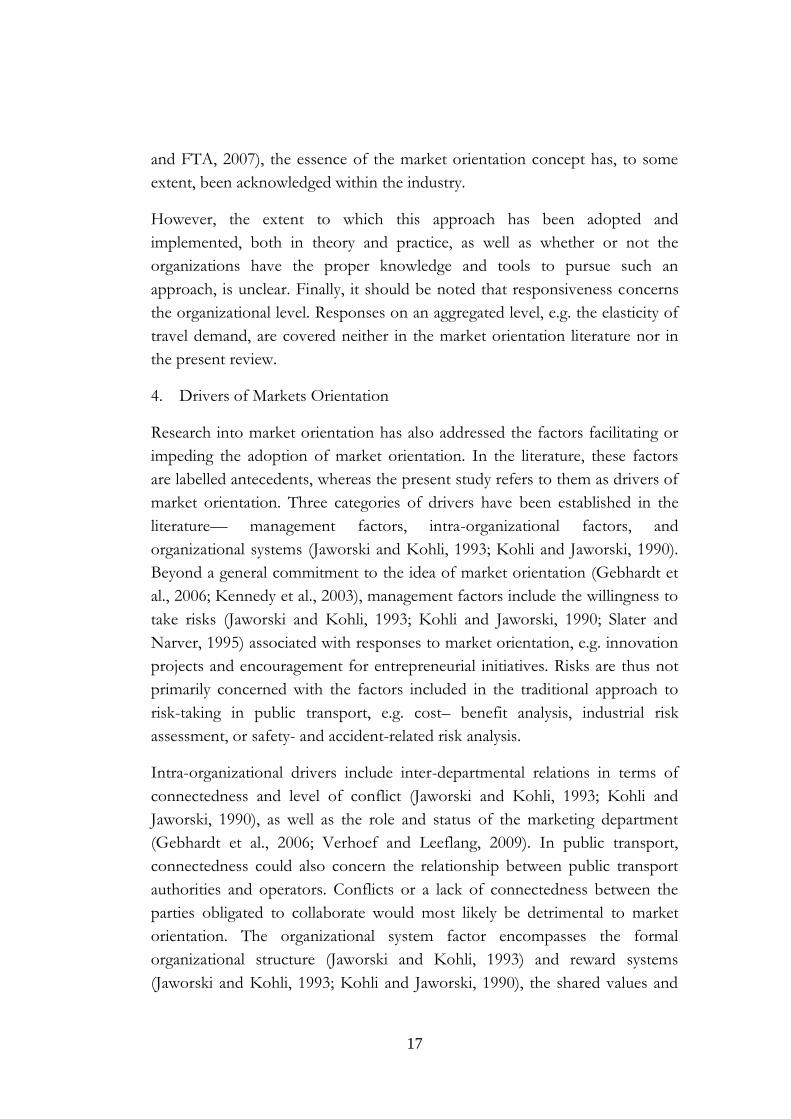
4. Drivers of Markets Orientation
Research into market orientation has also addressed the factors facilitating or
impeding the adoption of market orientation. In the literature, these factors
are labelled antecedents, whereas the present study refers to them as drivers of
market orientation. Three categories of drivers have been established in the
literature— management factors, intra-organizational factors, and
organizational systems (Jaworski and Kohli, 1993; Kohli and Jaworski, 1990).
Beyond a general commitment to the idea of market orientation (Gebhardt et
al., 2006; Kennedy et al., 2003), management factors include the willingness to
take risks (Jaworski and Kohli, 1993; Kohli and Jaworski, 1990; Slater and
Narver, 1995) associated with responses to market orientation, e.g. innovation
projects and encouragement for entrepreneurial initiatives. Risks are thus not
primarily concerned with the factors included in the traditional approach to
risk-taking in public transport, e.g. cost– benefit analysis, industrial risk
assessment, or safety- and accident-related risk analysis.
Intra-organizational drivers include inter-departmental relations in terms of
connectedness and level of conflict (Jaworski and Kohli, 1993; Kohli and
Jaworski, 1990), as well as the role and status of the marketing department
(Gebhardt et al., 2006; Verhoef and Leeflang, 2009). In public transport,
connectedness could also concern the relationship between public transport
authorities and operators. Conflicts or a lack of connectedness between the
parties obligated to collaborate would most likely be detrimental to market
orientation. The organizational system factor encompasses the formal
organizational structure (Jaworski and Kohli, 1993) and reward systems
(Jaworski and Kohli, 1993; Kohli and Jaworski, 1990), the shared values and
18
cultural aspects (Deshpande´ and Webster, 1989; Gebhardt et al., 2006), and
the learning capabilities of the organization (Brady and Cronin, 2001; Slater
and Narver, 1995; Sinkula et al., 1997). Rewards systems can be used within a
public transport organization, but also in performance-based quality contracts
between PT organizations (Hensher and Stanley, 2003).
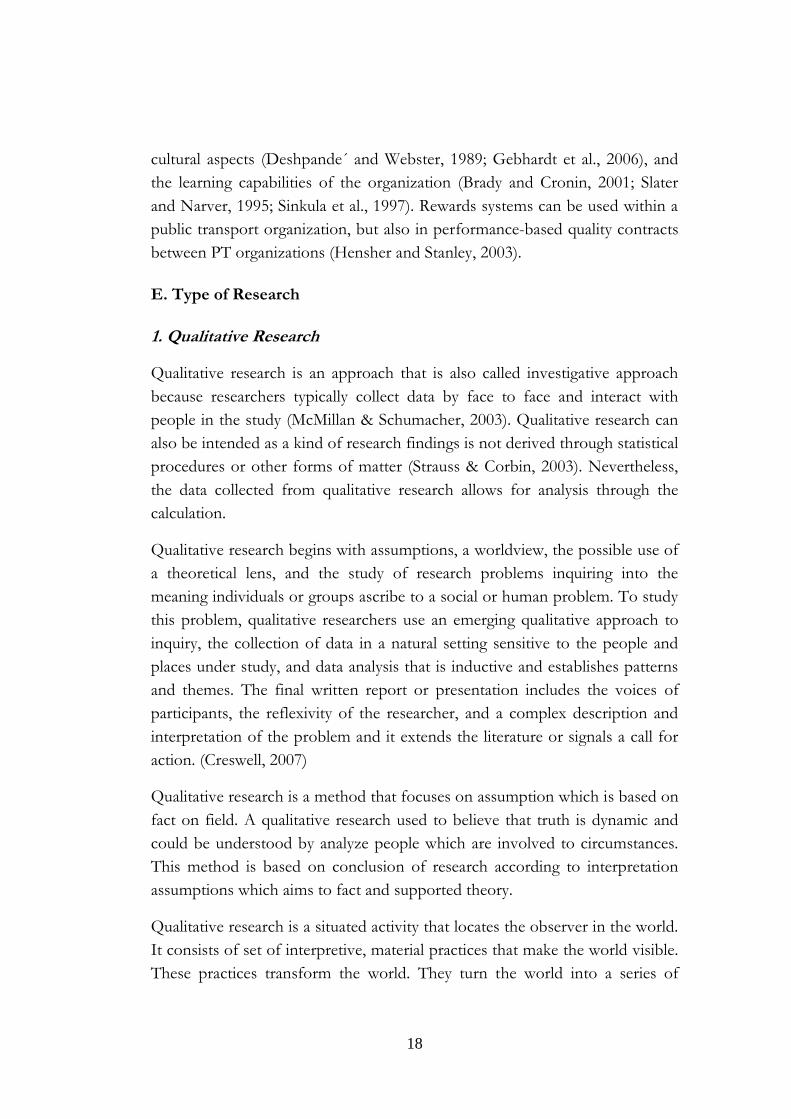
E. Type of Research
1. Qualitative Research
Qualitative research is an approach that is also called investigative approach
because researchers typically collect data by face to face and interact with
people in the study (McMillan & Schumacher, 2003). Qualitative research can
also be intended as a kind of research findings is not derived through statistical
procedures or other forms of matter (Strauss & Corbin, 2003). Nevertheless,
the data collected from qualitative research allows for analysis through the
calculation.
Qualitative research begins with assumptions, a worldview, the possible use of
a theoretical lens, and the study of research problems inquiring into the
meaning individuals or groups ascribe to a social or human problem. To study
this problem, qualitative researchers use an emerging qualitative approach to
inquiry, the collection of data in a natural setting sensitive to the people and
places under study, and data analysis that is inductive and establishes patterns
and themes. The final written report or presentation includes the voices of
participants, the reflexivity of the researcher, and a complex description and
interpretation of the problem and it extends the literature or signals a call for
action. (Creswell, 2007)
Qualitative research is a method that focuses on assumption which is based on
fact on field. A qualitative research used to believe that truth is dynamic and
could be understood by analyze people which are involved to circumstances.
This method is based on conclusion of research according to interpretation
assumptions which aims to fact and supported theory.
Qualitative research is a situated activity that locates the observer in the world.
It consists of set of interpretive, material practices that make the world visible.
These practices transform the world. They turn the world into a series of
19
representations, including field notes, interviews, conversations, photographs,
recordings and memos to the self. At this level, qualitative research involves an
interpretive, naturalistic approach to the world. This means that qualitative
researchers study things in their natural settings, attempting to make sense of,
or interpret, phenomena in terms of the meanings people bring to them.
(Adapted from Denzin & Lincoln, 2005, p. 3).
From the above definition shows some keywords in qualitative research,
namely: process, inductive quality, phenomena and assumption. This research
is using qualitative research for methodological discussion and analysis of
empirical study. The process in this research is emphasizing on qualitative
research. Due to it is carrying out of study researcher focused on process than
on the end result. The aim of this qualitative approach is to explore
phenomena, and process public transport in Lampung Province.
2. Case Study
Generally, case study is one of steps on qualitative research. According to
Creswell (2007), case study research is a qualitative approach in which the
investigator explores a bounded system (case) or multiple bounded systems
(cases) over time, through detailed, in-depth data collection involving multiple
sources of information (for example, observations, interviews, audiovisual
material, and documents and reports), and reports a case description and case-
based themes. A case study can be considered a methodology, strategy of
inquiry, or research strategy. It involves the study of an issue through specific
cases. In case studies emphasis is placed on the exploration and description.
Different types of case studies exist. The characteristics of the case can
determine what type of case it is. For example cases can involve different sizes
ranging from one individual to large groups, programs, or even activities.
Another characteristic that determines the type of case is the intent of the
case. According to Creswell (2007), three variations exist in terms of intent:
the single instrumental case study, the collective or multiple case studies, and
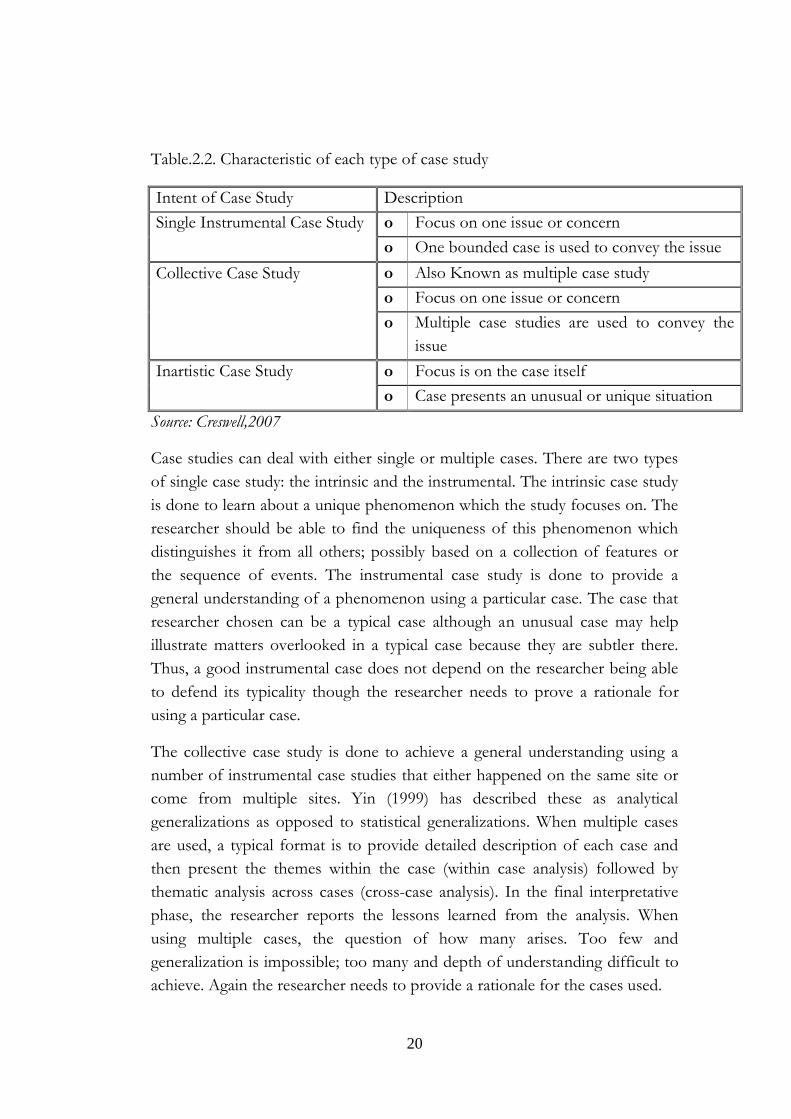
the intrinsic case study. Table.2.2. provides a chart explaining the
characteristics of each type of case study.
20
Table.2.2. Characteristic of each type of case study
Intent of Case Study Description
Single Instrumental Case Study o Focus on one issue or concern
o One bounded case is used to convey the issue
Collective Case Study o Also Known as multiple case study
o Focus on one issue or concern
o Multiple case studies are used to convey the
issue
Inartistic Case Study o Focus is on the case itself
o Case presents an unusual or unique situation
Source: Creswell,2007
Case studies can deal with either single or multiple cases. There are two types
of single case study: the intrinsic and the instrumental. The intrinsic case study
is done to learn about a unique phenomenon which the study focuses on. The
researcher should be able to find the uniqueness of this phenomenon which
distinguishes it from all others; possibly based on a collection of features or
the sequence of events. The instrumental case study is done to provide a
general understanding of a phenomenon using a particular case. The case that
researcher chosen can be a typical case although an unusual case may help
illustrate matters overlooked in a typical case because they are subtler there.
Thus, a good instrumental case does not depend on the researcher being able
to defend its typicality though the researcher needs to prove a rationale for
using a particular case.
The collective case study is done to achieve a general understanding using a
number of instrumental case studies that either happened on the same site or
come from multiple sites. Yin (1999) has described these as analytical
generalizations as opposed to statistical generalizations. When multiple cases
are used, a typical format is to provide detailed description of each case and
then present the themes within the case (within case analysis) followed by
thematic analysis across cases (cross-case analysis). In the final interpretative
phase, the researcher reports the lessons learned from the analysis. When
using multiple cases, the question of how many arises. Too few and
generalization is impossible; too many and depth of understanding difficult to
achieve. Again the researcher needs to provide a rationale for the cases used.
21
From case study research, this study will take raising transportation problems
in Bandar Lampung. BRT was emerging as new public transport in Bandar
Lampung has taken attention from the citizen. Moreover, same with its
emergence, while Trans Bandar Lampung is almost bankrupt become public
concerning about its sustainable. This study is collective case study, which is
take and analysis more than one case to be compared. One phenomenon case
is as reference to other which is able to be primary aim of research study.
22
CHAPTER III THEORITICAL FRAMEWORK
A. From GD-Logic to SD-Logic
1. Co-Creation
In G-D logic, ―value is created by the company and delivered in the market,
usually through ex-change of goods and money. From this perspective the
roles of ‗‗producers‘‘ and ‗‗consumers‘‘ are different, and value creation is
often thought of as a series of activities performed by the firm (Vargo et al
2008). The firm should set all decision variables at a level that enables it
to maximize the profit from the sale of output which acquire value during the
design and manufacturing process (Vargo and Lusch 2004 ). Ideally, in G-D
logic, output is tangible, produced separate from the interference of
customers, standardizable, and capable of being inventoried until sold, all to
enable maximum efficiency in operations (Vargo and Akaka 2009)‖ cited from
(Mekonen et.al.2012).
In addition, in industrial value creation, customers were seen as destroying the
value which producers had created for them. Accounting systems emerging at
that time thus ‗wrote down‘ the value of what was acquired to zero over a
shorter or longer ‗depreciation‘ period. The end user in this scheme equals the
‗final‘ customer. For producers, industrial value was ‗realized‘ in the
transaction which joined and separated them from customers. Value here
equaled the price which the customer paid: ‗in competitive terms, value is the
amount buyers are willing to pay for what a firm provides them‘ (Porter, 1985:
38); or, ‗value is what customers are willing to pay‘ (Porter, 1985: 3).
―Vargo & Lusch (2008) distinguished G-D logic and S-D logic in business
relationships. G-D logic is essentially based on the traditional view that
business transactions involve the value that is embedded in units of output
through the use of the so-called operand resources. In contrast, S-D logic is
primarily concerned with the value that is co-created with customers during
service interactions through the use of the so-called operant resources
(knowledge and skills).
S-D logic establishes the primacy of operant resources (those that act upon
other resources to create benefit), such as competences, over operand
23
resources (those resources which must be acted on to be beneficial), such
as natural resources, goods, and money (Vargo and Lusch 2004; cited in
Vargo and Akaka 2009). That is, operant resources, such as knowledge and
skills, are the underlying source of value. In addition, S-D logic argues that
value-creating resources are not confined to the firm; customers, suppliers,
and other stakeholders also constitute operant resources and contribute to
value creation (Vargo and Akaka 2009).
According to Vargo et al. (2008), value is co-created through the combined
efforts of firms, employees, customers, stockholders, government agencies,
and other entities related to any given exchange, but are always determined by
the beneficiary. Co-creation of value inherently requires participation of more
than one service system, and it is through integration and application of
resources made available through exchange that value is created. The process
of co-creating value is driven by value-in-use, but mediated and monitored by
value in-exchange. It means, co-creation of value has been used to convey the
customer‘s collaborative role in value creation while mere customer
participation in the development of a firm‘s offering (e.g., design, assembly,
self-service), has been identified as coproduction in S-D logic (Vargo and
Akaka 2009)‖ cited from (Mekonen et.al.2012).
Customers in this alternative view create value, they do not destroy it. Value is
not simply ‗added,‘ but is mutually ‗created‘ and ‗re-created‘ among actors with
different values. These multiple values are ‗reconciled‘ or ‗combined‘
(Hampden-Turner, 1990: 2 and 3).
2. Resources Integration
―Core to developing a general theory of markets, service-dominance (S-D)
logic suggests that service is the fundamental basis of exchange (Vargo and
Lusch 2004). In turn, service provision implies the ongoing combination of
resources, through integration and their application (Vargo and Lusch, 2010).
Resource integration plays a vital role in the co-creation of value through
resource integrators or actors. Integration requires processes and forms of
collaboration. The co-creation of value is portrayed in S-D logic as the
outcome of resource integration‖ cited from (Mekonen et.al.2012).
24
By integrating resources, service systems develop new value propositions for
customer and supports new value co-creation by the customers. According to
(Vargo et al. 2008 p.153), value is created by ―economic actors who exchange
a variety of resources that go beyond goods and money‖.
B. Service Innovation
Edvardsson et al. (2010) defined service innovation as a number of ways from
a narrow view of being concerned with the ―idea generation‖ portion of the
New Service Development (NSD) process. Service innovation is created
through service design. Service design is a form of architecture that involves
processes rather than bricks and mortar (Edvardsson, 1997). The idea is to
design high quality cars into the service system from the outset, to consider
and respond to customers' expectations in designing each element of the
service (Edvardsson, 1997). The quality of virtually any service depends on
how well myriad elements function together in the same service process to
meet customers' expectations (Edvardsson, 1997). Fa'iz Gallouj and livier
Weinstein (1997) state that there are five models of innovations which are:
radical innovation; improvement innovation; incremental innovation; ad-hoc
innovation and re-combinative innovation.
According to Gronroos (2010), a service is an activity or series of activities of
a more or less intangible nature that normally, but not necessarily, take place in
interaction between the customer and service employees and/or physical
resources or goods and/or systems of the service provider, which are provided
as solutions to customer problems. In addition, From Edvardsson et al. (2010)
an innovation is aimed at producing some kind of benefit for both the
customer and the organization, e.g. profits, growth, increased customer loyalty
or the creation of a new business.
For developing or producing the innovation, the competitive advantage
diagram could be as based to create new improvement of business, it shows in
figure 3.1.
25
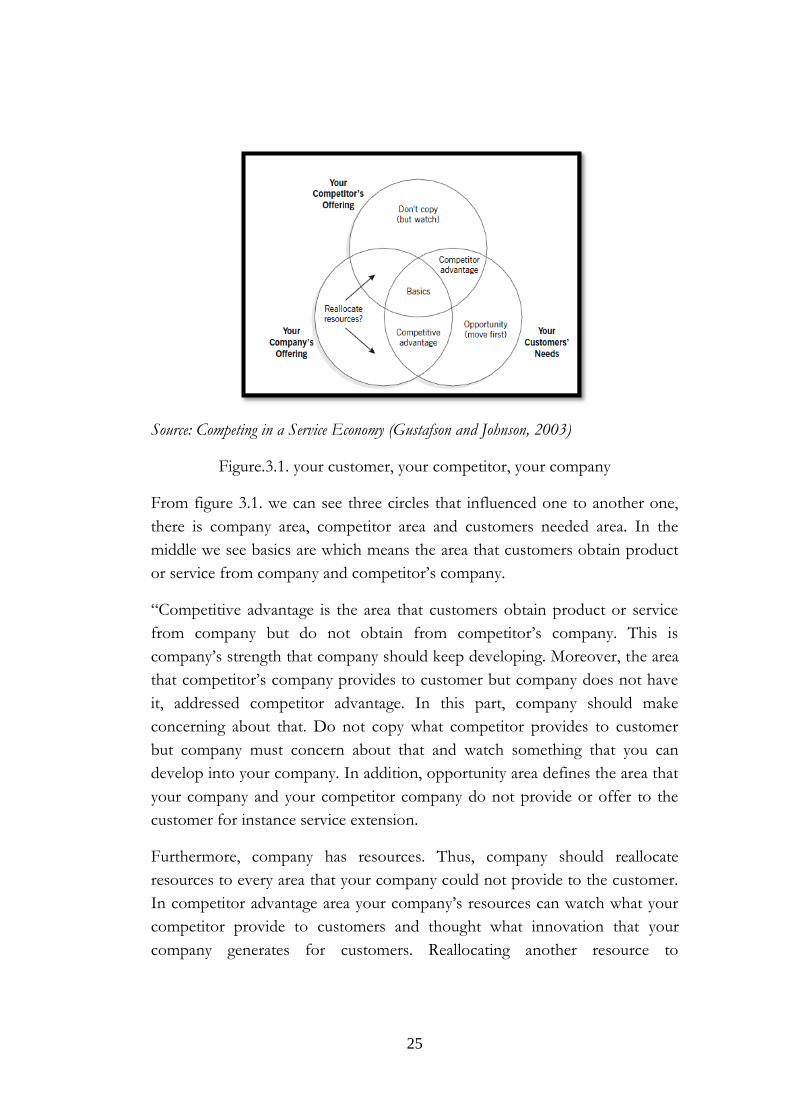
Source: Competing in a Service Economy (Gustafson and Johnson, 2003)
Figure.3.1. your customer, your competitor, your company
From figure 3.1. we can see three circles that influenced one to another one,
there is company area, competitor area and customers needed area. In the
middle we see basics are which means the area that customers obtain product
or service from company and competitor‘s company.
―Competitive advantage is the area that customers obtain product or service
from company but do not obtain from competitor‘s company. This is
company‘s strength that company should keep developing. Moreover, the area
that competitor‘s company provides to customer but company does not have
it, addressed competitor advantage. In this part, company should make
concerning about that. Do not copy what competitor provides to customer
but company must concern about that and watch something that you can
develop into your company. In addition, opportunity area defines the area that
your company and your competitor company do not provide or offer to the
customer for instance service extension.
Furthermore, company has resources. Thus, company should reallocate
resources to every area that your company could not provide to the customer.
In competitor advantage area your company‘s resources can watch what your
competitor provide to customers and thought what innovation that your
company generates for customers. Reallocating another resource to
26
opportunity area your company should make some new innovation in that area
by your company resources integrations‖ cited from (Suwandaru, 2012).
C. Public Transportation
1. From Old Public Transport to New Public Transport
Public transportation has a vital role in the transportation system of an area
and it also helps to minimize traffic congestion and other traffic-related
externalities. With good public transportation system, it provides good impact,
for instance could control growing of private vehicles. Within using systematic
(integrated) public transportation system, passengers will feel that it makes
their life is easier. From Lovelock et al (1987), customers of public-transport
systems have traditionally been considered as passive consumers rather than as
active participants in the value-creating process. It means, the role of
customers as passive customers which only receive value from public
transportation with conventional thought that public transportation operators
creates value in exchange , for instance; variety of ticket service, improving
frontline service and punctuality traffic service (Knutsson, 2003; Hensher and
Reyes, 2000). In conventional thoughts, Public Transportation was defined as
―public good‖ with natural monopoly, which function through an internal cost
orientation rather than an external market orientation (Kunneke, 1999). Public
transport has thus followed conventional ―goods-dominant logic‖ (G-D logic),
whereby transportation services are seen as a form of logistic good and
customers act as passive consumers of that good (Lovelock et al., 1987;
Hensher, 2003).
From conceptual of Service Dominant Logic (S-D Logic) which customer as
center of service, value in public transport is co-created with customers as
value in use (Vargo and Lusch, 2004, 2008) in the customers‘ own context.
From this conceptual, services becomes different value from different
perspective of every customers. In S-D Logic, when customers co-creation
experience as new value for them is the central of value definition. In addition,
Moreover, S-D logic implies that a variety of co-creation experiences will
result from heterogeneous interactions, which effectively leads to the
personalization of the co-creation experience in using public transport
(Gebauer et al, 2010).
27
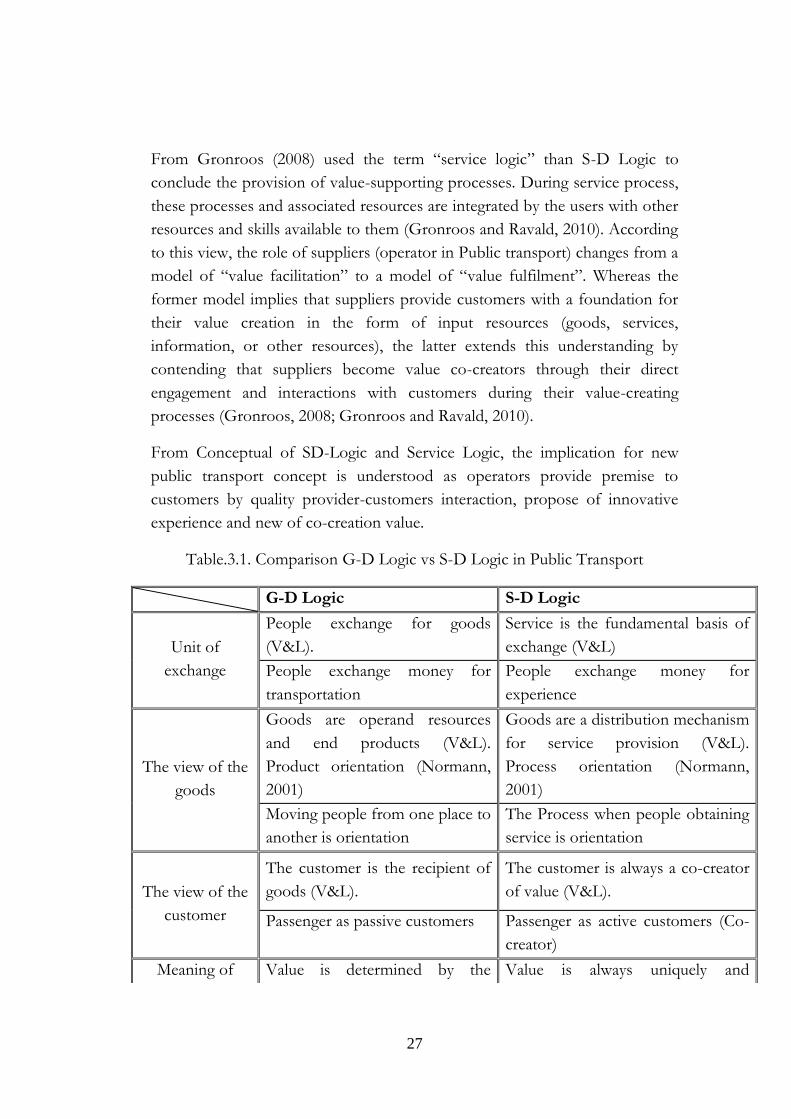
From Gronroos (2008) used the term ―service logic‖ than S-D Logic to
conclude the provision of value-supporting processes. During service process,
these processes and associated resources are integrated by the users with other
resources and skills available to them (Gronroos and Ravald, 2010). According
to this view, the role of suppliers (operator in Public transport) changes from a
model of ―value facilitation‖ to a model of ―value fulfilment‖. Whereas the
former model implies that suppliers provide customers with a foundation for
their value creation in the form of input resources (goods, services,
information, or other resources), the latter extends this understanding by
contending that suppliers become value co-creators through their direct
engagement and interactions with customers during their value-creating
processes (Gronroos, 2008; Gronroos and Ravald, 2010).
From Conceptual of SD-Logic and Service Logic, the implication for new
public transport concept is understood as operators provide premise to
customers by quality provider-customers interaction, propose of innovative
experience and new of co-creation value.
Table.3.1. Comparison G-D Logic vs S-D Logic in Public Transport
G-D Logic S-D Logic
Unit of
exchange
People exchange for goods
(V&L).
Service is the fundamental basis of
exchange (V&L)
People exchange money for
transportation
People exchange money for
experience
The view of the
goods
Goods are operand resources
and end products (V&L).
Product orientation (Normann,
2001)
Goods are a distribution mechanism
for service provision (V&L).
Process orientation (Normann,
2001)
Moving people from one place to
another is orientation
The Process when people obtaining
service is orientation
The view of the
customer
The customer is the recipient of
goods (V&L).
The customer is always a co-creator
of value (V&L).
Passenger as passive customers Passenger as active customers (Co-
creator)
Meaning of Value is determined by the Value is always uniquely and
28
value producer and embedded in the
operand resource (V&L).
phenomenological determined by
the beneficiary (V&L).
Value is determined by the
operator
Value is determined by the operator
and customers
Source: Analysis, 2013
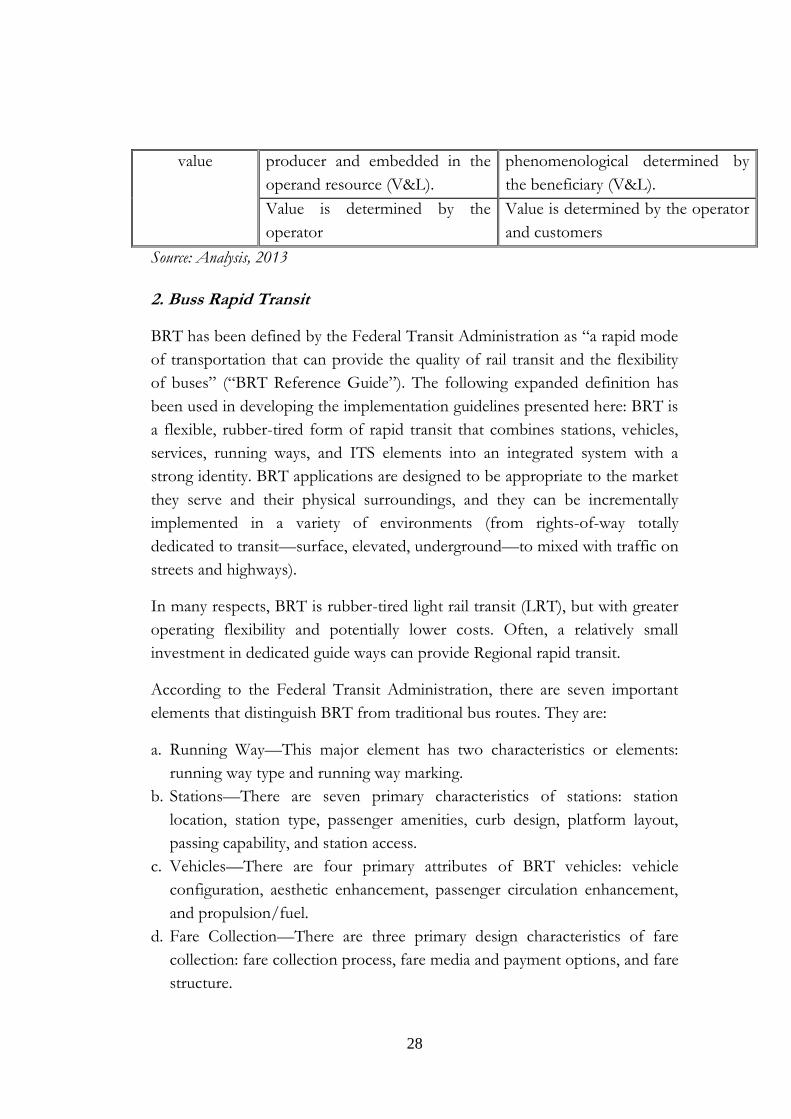
2. Buss Rapid Transit
BRT has been defined by the Federal Transit Administration as ―a rapid mode
of transportation that can provide the quality of rail transit and the flexibility
of buses‖ (―BRT Reference Guide‖). The following expanded definition has
been used in developing the implementation guidelines presented here: BRT is
a flexible, rubber-tired form of rapid transit that combines stations, vehicles,
services, running ways, and ITS elements into an integrated system with a
strong identity. BRT applications are designed to be appropriate to the market
they serve and their physical surroundings, and they can be incrementally
implemented in a variety of environments (from rights-of-way totally
dedicated to transit—surface, elevated, underground—to mixed with traffic on
streets and highways).
In many respects, BRT is rubber-tired light rail transit (LRT), but with greater
operating flexibility and potentially lower costs. Often, a relatively small
investment in dedicated guide ways can provide Regional rapid transit.
According to the Federal Transit Administration, there are seven important
elements that distinguish BRT from traditional bus routes. They are:
a. Running Way—This major element has two characteristics or elements:
running way type and running way marking.
b. Stations—There are seven primary characteristics of stations: station
location, station type, passenger amenities, curb design, platform layout,
passing capability, and station access.
c. Vehicles—There are four primary attributes of BRT vehicles: vehicle
configuration, aesthetic enhancement, passenger circulation enhancement,
and propulsion/fuel.
d. Fare Collection—There are three primary design characteristics of fare
collection: fare collection process, fare media and payment options, and fare
structure.
29
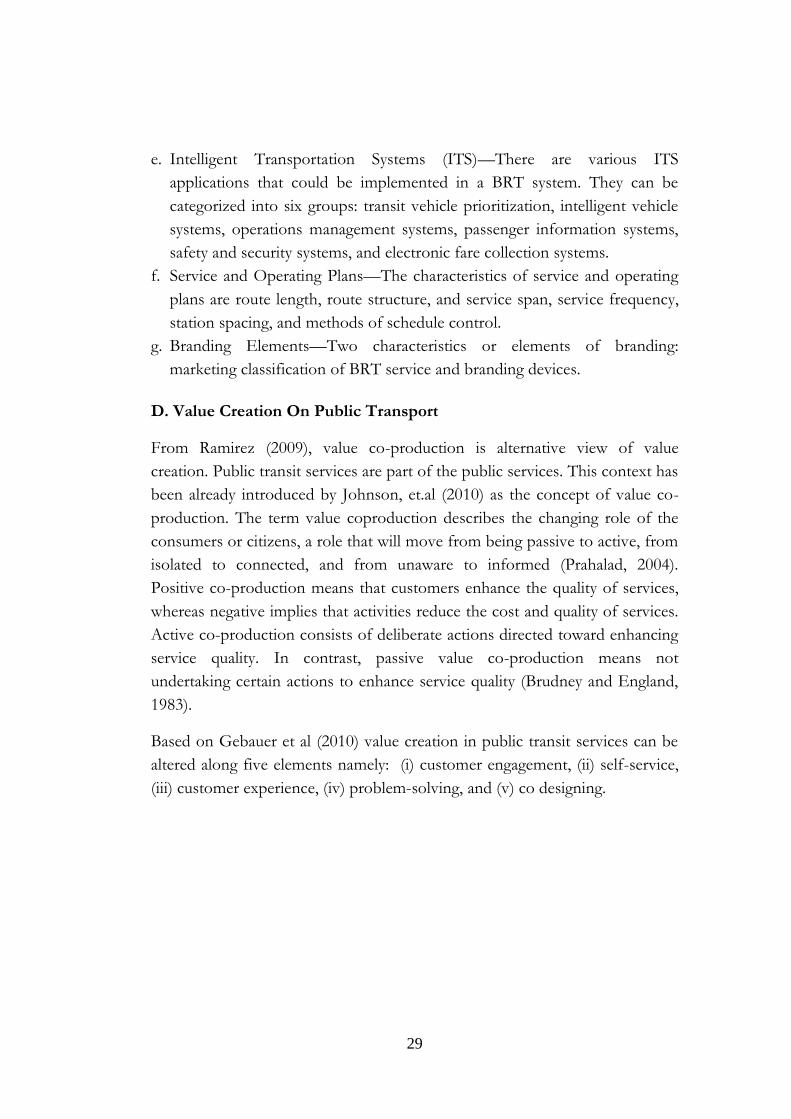
e. Intelligent Transportation Systems (ITS)—There are various ITS
applications that could be implemented in a BRT system. They can be
categorized into six groups: transit vehicle prioritization, intelligent vehicle
systems, operations management systems, passenger information systems,
safety and security systems, and electronic fare collection systems.
f. Service and Operating Plans—The characteristics of service and operating
plans are route length, route structure, and service span, service frequency,
station spacing, and methods of schedule control.
g. Branding Elements—Two characteristics or elements of branding:
marketing classification of BRT service and branding devices.
D. Value Creation On Public Transport
From Ramirez (2009), value co-production is alternative view of value
creation. Public transit services are part of the public services. This context has
been already introduced by Johnson, et.al (2010) as the concept of value co-
production. The term value coproduction describes the changing role of the
consumers or citizens, a role that will move from being passive to active, from
isolated to connected, and from unaware to informed (Prahalad, 2004).
Positive co-production means that customers enhance the quality of services,
whereas negative implies that activities reduce the cost and quality of services.
Active co-production consists of deliberate actions directed toward enhancing
service quality. In contrast, passive value co-production means not
undertaking certain actions to enhance service quality (Brudney and England,
1983).
Based on Gebauer et al (2010) value creation in public transit services can be
altered along five elements namely: (i) customer engagement, (ii) self-service,
(iii) customer experience, (iv) problem-solving, and (v) co designing.

30
Source:Gebauer et al, 2010
Figure.3.2. Value creation framework (dimensions and levels) for public transit
services.
For understanding, customer engagement meant to see and attracting
customer through advertising that involve and activate the recepients of the
promotional message (Prahalad, 2004). Communicating with public is one of
efforts to engage customers. By interaction with customer will create benefit
interaction between operator and customers. As positive feedback, operator
will increase the services and customers will receive more good services. Self
service is services from provider (e.g. internet, mobile phones, computer
terminals, or ticketing machines) for customers to order without make any
direct interaction with the employees of provider (Mauer et.al. 2000).
In addition, Self-services do not stop after buying and paying tickets, but
appear also by using public transit service. Customer experience means could
embed memorable experiences for customers when using services of provider
(Mauer et.al., 2000). Johnson et al., 2010 stated that customer experience starts
with an integrated public and individual transport network (Buses, Trams or
Trains). Problem solving is related to the literature on service recovery, which
related co-repairing value (i.e., service recovery) (Andreassen, 1999).
31
Furthermore, customers could solve their problems by themselves with using
information service which is provided by operator. Co-design of services
covers aspects such as creating new value creation ideas in collaboration with
customer‘s or engaging customers into the market launch of new service,
tickets, and travel cards (Johnson et al., 2010). Moreover, those five elements
of value creation in public transportation could fuse in to value configuration
spaces in public transportation.
E. Sustainable for Public Transportation Business Model
Sustainable is main important key to driver for innovations. New products,
services, and processes are not limited area for sustainable. To really fulfill the
ambitious goals for a sustainable development, innovations should aim to re-
invent the way value is created. Re-inventing value creation relates to the
concept of value creation and its underlying foundation through the service-
dominant logic (Vargo & Lusch, 2008). Value creation is conceptualized as
consisting of different parties (beside ―customer‖ and ―provider‖), who are
both resource integrators and beneficiaries in the creating of value creation.
Both parties are involved in networks of actors or service systems (Vargo &
Lusch, 2011) embedded in a social context (Edvardsson et al, 2010).
―According Enquist and Edvarsson (2008) there are five principles for
sustainable value based service business. These are: the principle of strong
values drives customer value; CSR as a strategy for sustainable service
business; service experience for co-creating value; value based service brand
and service leadership for living the values.
The above five principles explain how to generate a good sustainable for a
company. The dynamics of values may be expressed in various ways in
providing customer strong corporate values, energy and direction to business
development. In addition it helps to develop a sense of social and
environmental responsibility that stimulates production, consumption, energy
conservation which in return contributes to the profitability in a long term
perspective. The principles of value based service brand and service leadership
are about understanding brands of what a company stands to secure
sustainable. Values based company also needs a strong values based
leadership‖ cited from (Suwandaru, 2012).
32
Based on Gebauer et al (2010) innovating sustainable public Transport (SPT)
based on sustainable and value configuration space occurs through five stages,
namely: (1) ‗establishing reliability of single transportation modes‘, (2)
‗integration of the mode of transport‘, (3) ‗Regional integration‘, (4) ‗service
extension‘, and (5) ‗individual mobility‘.
1. The first stage aims at establishing reliability of single transportation
modes. Reliability includes punctuality, travel comfort, and equally
important safety issues related with using public transit services.
2. The second stage entails the integration of the different means of
transportation—such as trains, buses, ferries, inter-urban trains, and
trams—by coordinating timetables, destinations, and pricing systems.
These changes ensured enhanced connections for commuters among
the different modes of transportation. For example, trains leave
regularly every half hour, and these departures are synchronized with
buses and other trains.
3. The third stage involves Regional integration, sought to integrate the
level of urban, local to the Regional level, including city busses,
Regional trains, or international high-speed trains connecting major
cities.
4. The fourth stage refers to the extension of services by embedding
transportation services into a wide range of value-added services in
order to create comprehensive customer experiences for socializing,
shopping, and entertainment.
5. The fifth stage changes the traditional public-transport focus on
collective mobility towards a view to enhancing individual mobility.
This included the provision of ‗park & rail‘ services, car and bicycle
hire, and mobility services.
F. Contract and Stakeholder Relationship
1. Contract
Contracts is a communication tool for the transmission of information from
one party to the other, thus reducing uncertainty and risk by stating each
33
party‘s contribution to the relationship and/or the requirements of accepted
practice in a given business setting (Williamson, 1975; Roxenhall, 1999;
Malhotra and Murnighan, 2002; Roxenhall and Ghauri, 2004). based on
Camen et al (2011) stated that Contract as a tool for the transmission of
information from one party to the other, reducing uncertainty and risk by
stating contribution of each party‘s to the relationship, and/ or meeting the
requirements of accepted practice in a given business setting. Otherwise from
Frankel et al (1996) argued that if there is complementary governance rules
about prerequisite in contract, therefore contract has less importance.
In general, formal written contracts have three main roles:
a. To bind parties together;
b. To specify the content of the transaction;
c. Used for interpretations of aspects that are not obvious; and
d. To provide evidence of the nature of the agreement and its enforcement
(Blomqvist et al., 2005).
Furthermore, the contract helps by
a. Acting as a communication tool for the transmission of information from
one party to the other;
b. Reducing uncertainty and risk by stating each party‘s contribution to
relationship;
c. Meeting requirements of accepted practice in a driven business setting;
d. Stabilizing future proceedings with external actors.
On the other hand, contract has role as standard of service quality or
performance measurement. From Neely et al. (1995, p. 80) defined
―performance measurement‖ as ―the process of quantifying the efficiency and
effectiveness of action‖. In addition, According Carolina Camen (2011)
Controlling of service quality is important because the contractors are
responsible for and must guarantee a certain quality level to the final user of
the service (i.e. the customer; in this case the travelers). Contracts could be
used as a tool to manage quality of service by including service quality
prerequisites in contracts.
34
As mentioned in above, Controlling of Service quality is difficult to be
managed so then contracts can be used as a tool to manage it. If we failed to
use contract role so decrease of service quality will be occurred.
According E. Wistrich (1998) Contracting has became importance tool in
present day public sector management. It is seen as a method of instituting a
principal relationship and overcoming the problems of self interested behavior
in public bureaucracies. According Boston (1996 cited in E. Wistrich 1998) the
objectives of service are set by principals, either politicians, government, or
senior managers and the agents carry out the operations. Contract relationship
allows the term of the work to be set out and the performance subsequently
monitored. It is a tool well suited to a government which wishes to restrict its
role in operations to purchasing and allow competition for service delivery
among service providers (Self 1993 cited in E. Wistrich 1998).
Contracts generate equality position of all parties in rights and duties in
business relationship also in legal relationship. According Hardern (1992 cited
in E. Wistrich 1998) contracts is a device for clarifying respecting rights and
duties in an agreement between person and organization in a process of
exchange. Further, Macneil (1980 cited in E. Wistrich 1998) states that the
contract is a discrete or classical one written for business purposes involving
the purchase and supply of goods or services, outlined in a legal document and
enforceable by the court of law. Implications of contracts as a legal document
is each party could make a legal claim/legal accusation if other party did not
fulfill their duties.
2. Stakeholder Relationship
Based on Freeman (1984), a stakeholder in an organization is any group or
individual who can affect or is affected by the achievement or the
organization‘s objectives. Regarding to public transport definition,
‗organization‘ that was mentioned is refers to the public transport industry.
Stakeholder identification refers to recognition of organization‘s ―interest
groups‖; these groups are those, in which the organization has an interest
or/and those who have an interest in the organization. Stakeholder
identification is a key issue in stakeholder management: not only it helps the
organization to identify its interest groups but it also helps to explain why
35
managers should consider certain groups as stakeholders. The importance lies
in recognizing those groups who have an affect or are affected by the
organization – either directly or indirectly. (Preble 2005) Noteworthy, in the
identification process, is that a corporation should possess an attitude that the
interests of all stakeholders are of intrinsic value and are worth consideration
(Donaldson and Preston 1995).
Clarkson (1995), whose identification typology is commonly referred to in the
literature (Frooman 1999, Mitchell et al. 1997, Preble 2005), categorizes
stakeholders into primary and secondary. He identifies stakeholders by their
interest in the organization, despite of whether the corporation has any
corresponding interest in them. According to Clarkson, the primary
stakeholders are the ones, which are crucial for the company‘s survival:
shareholders and investors, employees, customers, and suppliers, together with
public stakeholders, which are for example the government and communities.
The secondary stakeholders are those who affect or are affected by, influence
or are influenced by the corporation but are not necessary for its survival nor
engaged in direct transactions with the organization. These can be for example
the media, or special interest groups like environmental or civic organizations.
(Clarkson 1995).
Enquist et al (2005) also doing research about stake holders relationship on
public transport in Sweden. They argued that the Swedish public transport
system can be viewed as a value-creating stakeholder network, with four main
actors/stakeholders operating in a public–private partnership. They defined
four main actors who involved in public transport industry in Sweden:
a. The principals (the politicians in the political system that is ultimately
responsible for the Swedish public transport system);
b. The PTA in each county (which act as the system integrators);
c. Private operators (who are the subcontractors that provide the service
delivery); and
d. The citizen customers (who are the passengers on the public transport
system and political constituents in their interactions with the principals).
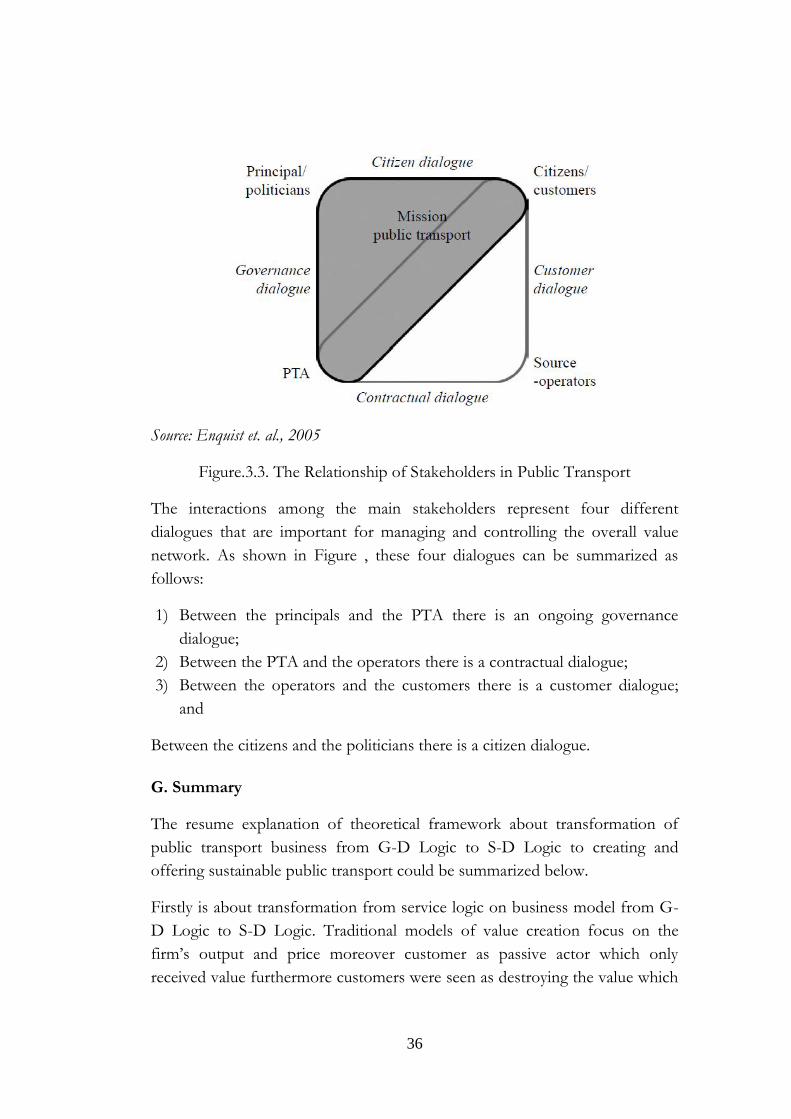
36
Source: Enquist et. al., 2005
Figure.3.3. The Relationship of Stakeholders in Public Transport
The interactions among the main stakeholders represent four different
dialogues that are important for managing and controlling the overall value
network. As shown in Figure , these four dialogues can be summarized as
follows:
1) Between the principals and the PTA there is an ongoing governance
dialogue;
2) Between the PTA and the operators there is a contractual dialogue;
3) Between the operators and the customers there is a customer dialogue;
and
Between the citizens and the politicians there is a citizen dialogue.
G. Summary
The resume explanation of theoretical framework about transformation of
public transport business from G-D Logic to S-D Logic to creating and
offering sustainable public transport could be summarized below.
Firstly is about transformation from service logic on business model from G-
D Logic to S-D Logic. Traditional models of value creation focus on the
firm‘s output and price moreover customer as passive actor which only
received value furthermore customers were seen as destroying the value which
37
producers had created for them. Yet, in other alternative perspective, one
representation of S-D Logic which value is created by co-creation between the
company and customer. To further, in S-D Logic perspective, resource
integration has vital role in creating value. By integrating resources, service
systems develop new value propositions for customer and supports new value
co-creation by the customers.
Regarding to service innovation, from Gronroos (2010), a service is an activity
or series of activities of a more or less intangible nature that normally, but not
necessarily, take place in interaction between the customer and service
employees and/or physical resources or goods and/or systems of the service
provider, which are provided as solutions to customer problems. In addition,
From Edvardsson et al. (2010) an innovation is aimed at producing some kind
of benefit for both the customer and the organization, e.g. profits, growth,
increased customer loyalty or the creation of a new business.
Secondly is regarding about evolving of transport business model from old
perspective (G-D Logic) to new perspective model (S-D Logic). On public
transport business, BRT represent of this transformation, from old public
transportation being Bus Rapid Transit has scheduled itinerary. On old
business, customers of public-transport systems have traditionally been
considered as passive consumers rather than as active participants in the value-
creating process (Lovelock et al, 1987). However, Gebauer et al (2010) stated
that, S-D logic implies that a variety of co-creation experiences will result from
heterogeneous interactions, which effectively leads to the personalization of
the co-creation experience in using public transport.
Thirdly is concerning about value creation on Public transport based on
Gebauer et al (2010) value creation in public transit services can be altered
along five elements. For understanding, customer engagement meant to see
and attracting customer through advertising that involve and activate the
recipients of the promotional message (Prahalad, 2004). Self service is services
from provider (e.g. internet, mobile phones, computer terminals, or ticketing
machines) for customers to order without make any direct interaction with the
employees of provider (Mauer et.al., 2000). Customer experience means could
embed memorable experiences for customers when using services of provider
(Mauer et.al., 2000). Problem solving is related to the literature on service
recovery, which related co-repairing value (i.e., service recovery) (Andreassen,
38
1999). Co-design of services covers aspects such as creating new value creation
ideas in collaboration with customer‘s or engaging customers into the market
launch of new service, tickets, and travel cards (Johnson et al., 2010). From
creating value creation on public transport, it could be used for continuing to
construct sustainable public transport.
The last is engaging stakeholders in public transport business, in engaging
stakeholders needs tool which is called contract. Camen et al (2011) stated that
Contract as a tool for the transmission of information from one party to the
other, reducing uncertainty and risk by stating contribution of each party‘s to
the relationship, and/ or meeting the requirements of accepted practice in a
given business setting, furthermore with clear contract could be as measure
tool for quality service.
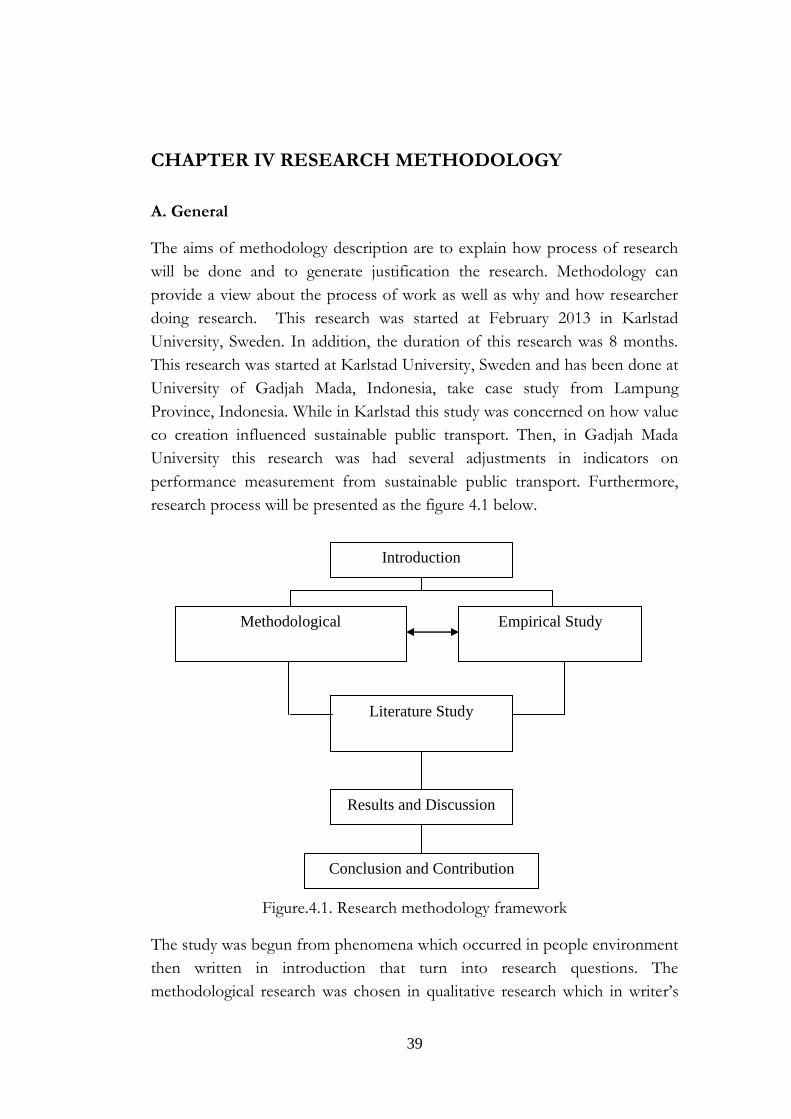
39
CHAPTER IV RESEARCH METHODOLOGY
A. General
The aims of methodology description are to explain how process of research
will be done and to generate justification the research. Methodology can
provide a view about the process of work as well as why and how researcher
doing research. This research was started at February 2013 in Karlstad
University, Sweden. In addition, the duration of this research was 8 months.
This research was started at Karlstad University, Sweden and has been done at
University of Gadjah Mada, Indonesia, take case study from Lampung
Province, Indonesia. While in Karlstad this study was concerned on how value
co creation influenced sustainable public transport. Then, in Gadjah Mada
University this research was had several adjustments in indicators on
performance measurement from sustainable public transport. Furthermore,
research process will be presented as the figure 4.1 below.
Figure.4.1. Research methodology framework
The study was begun from phenomena which occurred in people environment
then written in introduction that turn into research questions. The
methodological research was chosen in qualitative research which in writer‘s
Introduction
Empirical Study
Literature Study
Results and Discussion
Methodological
Conclusion and Contribution
40
point of view is appropriate for this research. Literature review has been
chosen by writer was considered as suitable theories for figure out the
phenomena which has been chosen by writer. In addition, literature review
gradually builds up knowledge about the research ideas. In Analysis, literature
review and methodological will face empirical study which was interpretation
of current condition. Furthermore, in discussion would obtain conclusion and
advice for figuring out problems that has been chosen by researcher.
B. Collecting Data
Data collection is devoted phase to gathering the data for the research and
organizing it, so that it can be properly analyzed. Data Collection is an
important aspect of any type of research study. Inaccurate data collection can
impact the results of a study and ultimately lead to invalid results. Data
collection methods for impact evaluation vary along a continuum. At the one
end of this continuum are quantitative methods and at the other end of the
continuum are qualitative methods for data collections. Data collection
method which is used on this study is qualitative type.
Those are two kinds of data, Primary and secondary. Primary data means
original data that has been collected specially for the purpose in mind. It
means somebody collect data from original or the real condition on the field.
Primary data has not been published yet and is more reliable, authentic and
objective. Secondary data is the data has been already collected by and readily
available from another source. The secondary data might be obtained from
many sources, including literature, industry surveys, complications from
computerized databases and information systems and computerized or
mathematical models of environmental processes. Secondary data could be
less valid but it is importance is still here due to difficulty to obtain primary
data. The most common sources of data collection in qualitative research are
interviews, observations, and review of documents.
This paper will use primary and secondary data; document studies (secondary
data) and key informant as primary source data for collecting data methods for
this research. Key informant is the author‘s relative who is working in
transport province department in Lampung province. Communication went
through by email and skype application. Furthermore, the secondary data was
taken from informant, for instance number of Regency buses. Literature and
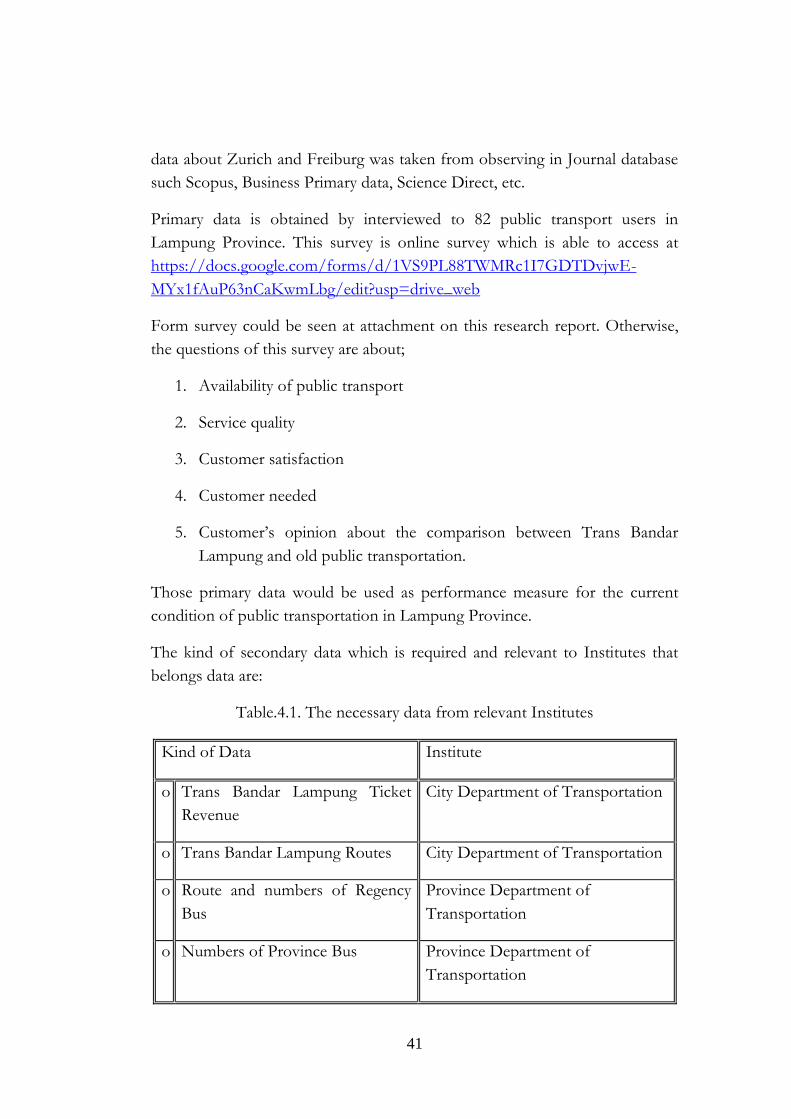
41
data about Zurich and Freiburg was taken from observing in Journal database
such Scopus, Business Primary data, Science Direct, etc.
Primary data is obtained by interviewed to 82 public transport users in
Lampung Province. This survey is online survey which is able to access at
https://docs.google.com/forms/d/1VS9PL88TWMRc1I7GDTDvjwE-
MYx1fAuP63nCaKwmLbg/edit?usp=drive_web
Form survey could be seen at attachment on this research report. Otherwise,
the questions of this survey are about;
1. Availability of public transport
2. Service quality
3. Customer satisfaction
4. Customer needed
5. Customer‘s opinion about the comparison between Trans Bandar
Lampung and old public transportation.
Those primary data would be used as performance measure for the current
condition of public transportation in Lampung Province.
The kind of secondary data which is required and relevant to Institutes that
belongs data are:
Table.4.1. The necessary data from relevant Institutes
Kind of Data Institute
o Trans Bandar Lampung Ticket
Revenue
City Department of Transportation
o Trans Bandar Lampung Routes City Department of Transportation
o Route and numbers of Regency
Bus
Province Department of
Transportation
o Numbers of Province Bus Province Department of
Transportation
42
Secondary data is necessary for:
1. To study at citizen‘s interest to Trans Bandar Lampung.
2. To understand that the routes has good accessibility for citizen.
3. To study that regency bus has provided transportation service in every
area in Lampung Province.
4. To figure out the existence of Province Bus on Lampung Province.
C. Analysis Method
The best preparation for conducting case study analysis is to have a general
analytic strategy which is relying on theoretical propositions, rival explanations
and case descriptions. This research will analyze using pattern to create
explanation that display the data from the individual case according to some
uniform framework and the analysis of the entire selection of word tables
enabled the study to draw cross-case conclusions about the intervention
centers and their outcomes.
After obtaining data and information required the researcher conducted
organizing data and information, as well as perform detailed description of the
case and its context. Furthermore, by construction of pattern matching
displays and matrices, patterns and themes will be sought. The goal is to build
a logical chain of evidence and to construct a theoretically and conceptually
coherent explanations and looking for the negative evidence.
D. Validity and Reliability
In order to obtain research results of quality two concepts are highly relevant
and commonly applied – validity (construct, external, and internal) and
reliability. For establishing trustworthiness and credibility on this research that
used a several different source (official document, report, scientific paper) this
paper explains evidences by proving and explaining the source of data
collection, references. And identification about Lampung Province will be
showed at results and discussion. It can‘t be denied that reliability as
demonstrating that the operations of a study-such as the data collection
43
procedures-can be repeated, with the same results. From this statement, the
author argues that repeating or replication should be possible as reliability
requirement since the establishment of the framework about sustainable
integrated public transport system in Lampung which is reflection to Zurich
and Freiburg.

44
CHAPTER V RESULTS AND DISCUSSION
A. Introduction
In this chapter will answer to research questions on introduction chapter. In
this part will explain about description public transportation in Lampung
Province, particularly in Bandar Lampung City as city capital in Lampung
Province, performance indicator on Sustainable public transportation, creating
public transportation based on Service Dominant Logic and furthermore
strategy for saving Trans Bandar Lampung.
B. The Description of Public Transportation in Lampung Province
1. Trans Bandar Lampung
Trans Bandar Lampung is Bus Rapid Transit (BRT) system in Bandar
Lampung, Indonesia. Trans Bandar Lampung Consortium is managed by PT
Trans Bandar Lampung (PT TBL), which is a combination of 37 public
transport companies in Bandar Lampung. Trans Bandar Lampung
transportation system connects the city area within a considerable distance.
Trans Bandar Lampung absolute and operated by the private sector is the first
in Indonesia. In addition, the payment system of Trans Bandar Lampung is
still using conventional means to pay for ticketing on the bus.
Since officially introduced to the public by the Mayor of Bandar Lampung
Bandar Lampung on 26 September 2011, Trans Bandar Lampung is the first
urban transport with the BRT concept in Bandar Lampung. At the beginning
of the operation, Trans Bandar Lampung tested for 4 days at 14 to 17
November 2011 and formally operates on December 19, 2011. The meeting
continued with the agreement made in the form of a Memorandum of
Understanding (MoU) between the Government of Bandar Lampung with PT.
Trans Trans Bandar Lampung Bandar Lampung for operation in December
2011. In the MoU stipulated obligations and rights of the Government as a
regulator of Bandar Lampung and PT. Trans Bandar Lampung as operator.
Starting with only 40 buses (purchased purely consortium) and served two
corridors, namely: Rajabasa-Sukaraja routes and route KORPRI-Sukaraja,
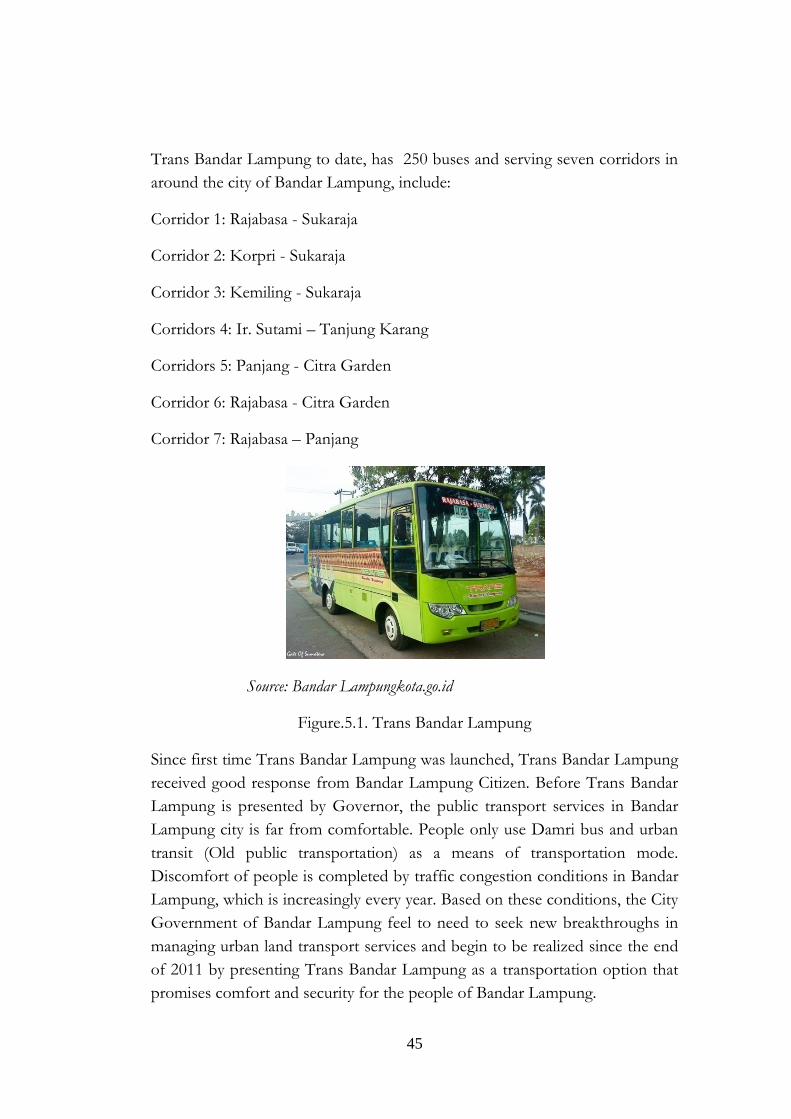
45
Trans Bandar Lampung to date, has 250 buses and serving seven corridors in
around the city of Bandar Lampung, include:
Corridor 1: Rajabasa - Sukaraja
Corridor 2: Korpri - Sukaraja
Corridor 3: Kemiling - Sukaraja
Corridors 4: Ir. Sutami – Tanjung Karang
Corridors 5: Panjang - Citra Garden
Corridor 6: Rajabasa - Citra Garden
Corridor 7: Rajabasa – Panjang
Source: Bandar Lampungkota.go.id
Figure.5.1. Trans Bandar Lampung
Since first time Trans Bandar Lampung was launched, Trans Bandar Lampung
received good response from Bandar Lampung Citizen. Before Trans Bandar
Lampung is presented by Governor, the public transport services in Bandar
Lampung city is far from comfortable. People only use Damri bus and urban
transit (Old public transportation) as a means of transportation mode.
Discomfort of people is completed by traffic congestion conditions in Bandar
Lampung, which is increasingly every year. Based on these conditions, the City
Government of Bandar Lampung feel to need to seek new breakthroughs in
managing urban land transport services and begin to be realized since the end
of 2011 by presenting Trans Bandar Lampung as a transportation option that
promises comfort and security for the people of Bandar Lampung.
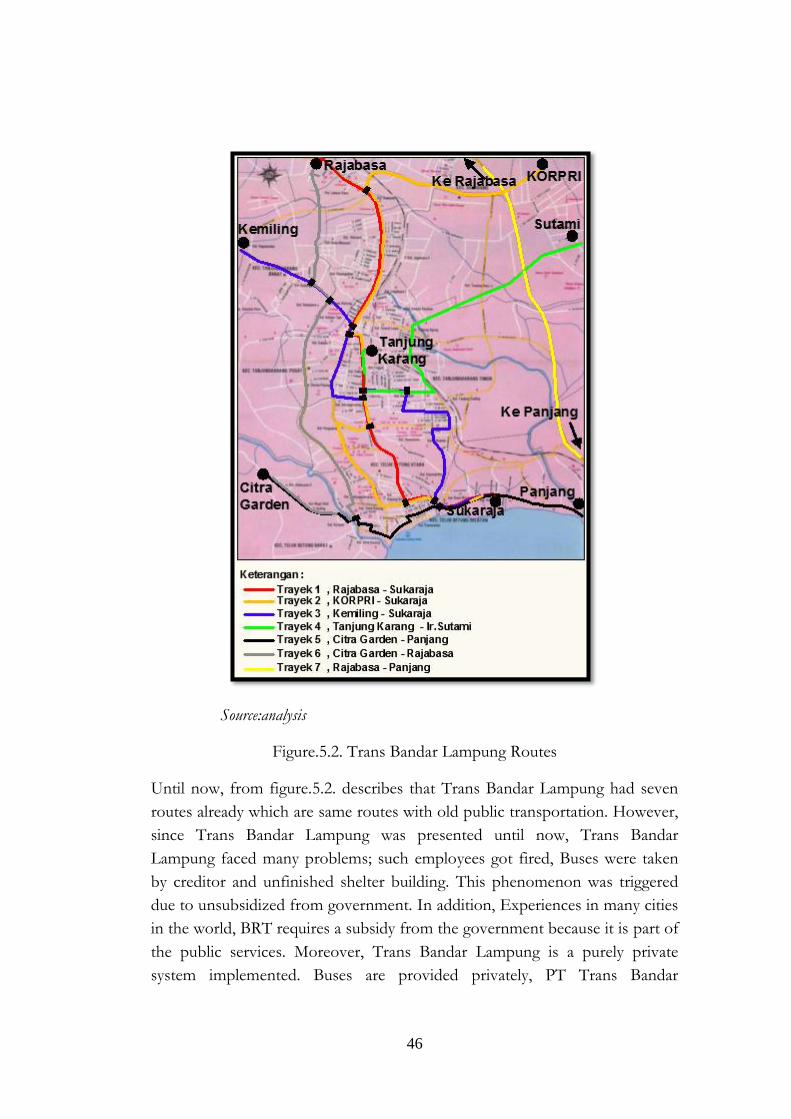
46
Source:analysis
Figure.5.2. Trans Bandar Lampung Routes
Until now, from figure.5.2. describes that Trans Bandar Lampung had seven
routes already which are same routes with old public transportation. However,
since Trans Bandar Lampung was presented until now, Trans Bandar
Lampung faced many problems; such employees got fired, Buses were taken
by creditor and unfinished shelter building. This phenomenon was triggered
due to unsubsidized from government. In addition, Experiences in many cities
in the world, BRT requires a subsidy from the government because it is part of
the public services. Moreover, Trans Bandar Lampung is a purely private
system implemented. Buses are provided privately, PT Trans Bandar
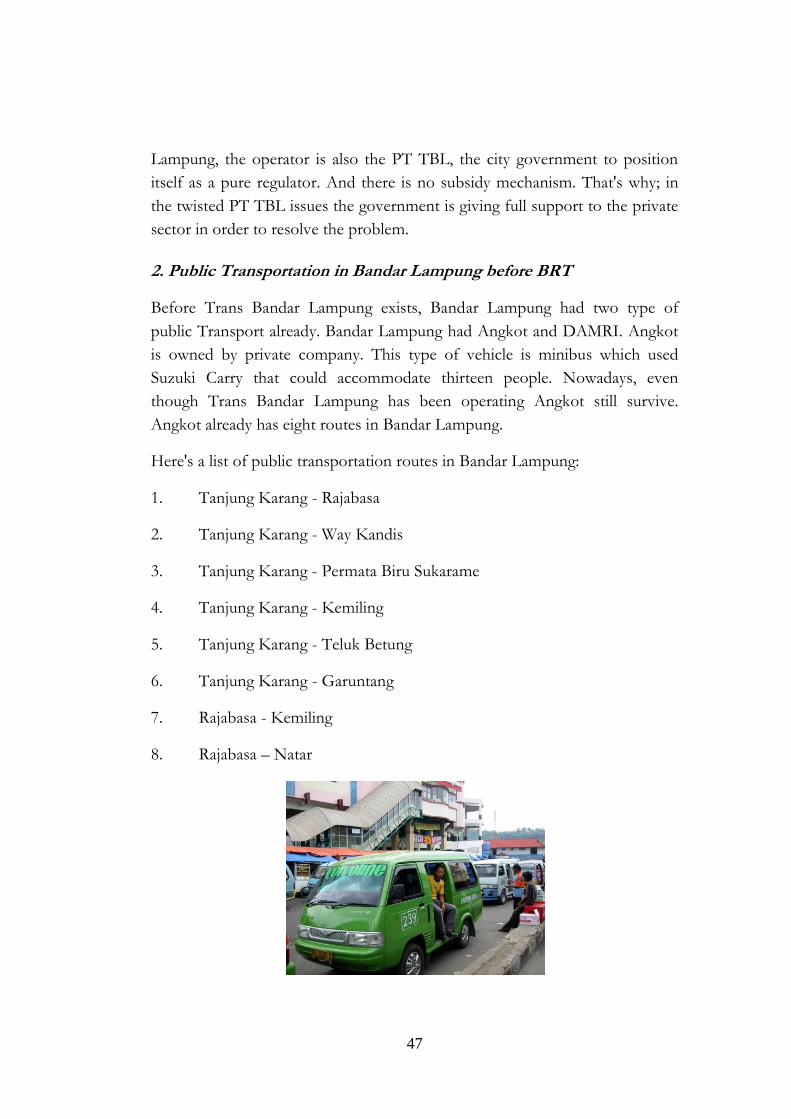
47
Lampung, the operator is also the PT TBL, the city government to position
itself as a pure regulator. And there is no subsidy mechanism. That's why; in
the twisted PT TBL issues the government is giving full support to the private
sector in order to resolve the problem.
2. Public Transportation in Bandar Lampung before BRT
Before Trans Bandar Lampung exists, Bandar Lampung had two type of
public Transport already. Bandar Lampung had Angkot and DAMRI. Angkot
is owned by private company. This type of vehicle is minibus which used
Suzuki Carry that could accommodate thirteen people. Nowadays, even
though Trans Bandar Lampung has been operating Angkot still survive.
Angkot already has eight routes in Bandar Lampung.
Here's a list of public transportation routes in Bandar Lampung:
1. Tanjung Karang - Rajabasa
2. Tanjung Karang - Way Kandis
3. Tanjung Karang - Permata Biru Sukarame
4. Tanjung Karang - Kemiling
5. Tanjung Karang - Teluk Betung
6. Tanjung Karang - Garuntang
7. Rajabasa - Kemiling
8. Rajabasa – Natar
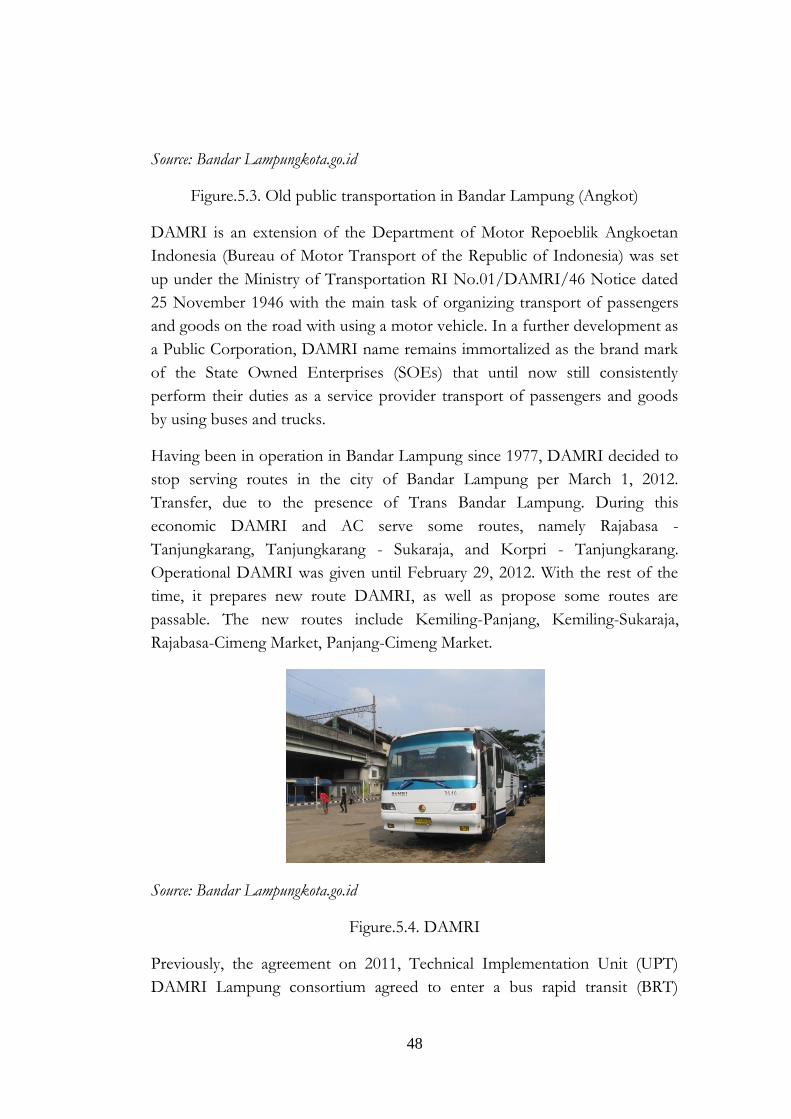
48
Source: Bandar Lampungkota.go.id
Figure.5.3. Old public transportation in Bandar Lampung (Angkot)
DAMRI is an extension of the Department of Motor Repoeblik Angkoetan
Indonesia (Bureau of Motor Transport of the Republic of Indonesia) was set
up under the Ministry of Transportation RI No.01/DAMRI/46 Notice dated
25 November 1946 with the main task of organizing transport of passengers
and goods on the road with using a motor vehicle. In a further development as
a Public Corporation, DAMRI name remains immortalized as the brand mark
of the State Owned Enterprises (SOEs) that until now still consistently
perform their duties as a service provider transport of passengers and goods
by using buses and trucks.
Having been in operation in Bandar Lampung since 1977, DAMRI decided to
stop serving routes in the city of Bandar Lampung per March 1, 2012.
Transfer, due to the presence of Trans Bandar Lampung. During this
economic DAMRI and AC serve some routes, namely Rajabasa -
Tanjungkarang, Tanjungkarang - Sukaraja, and Korpri - Tanjungkarang.
Operational DAMRI was given until February 29, 2012. With the rest of the
time, it prepares new route DAMRI, as well as propose some routes are
passable. The new routes include Kemiling-Panjang, Kemiling-Sukaraja,
Rajabasa-Cimeng Market, Panjang-Cimeng Market.
Source: Bandar Lampungkota.go.id
Figure.5.4. DAMRI
Previously, the agreement on 2011, Technical Implementation Unit (UPT)
DAMRI Lampung consortium agreed to enter a bus rapid transit (BRT)
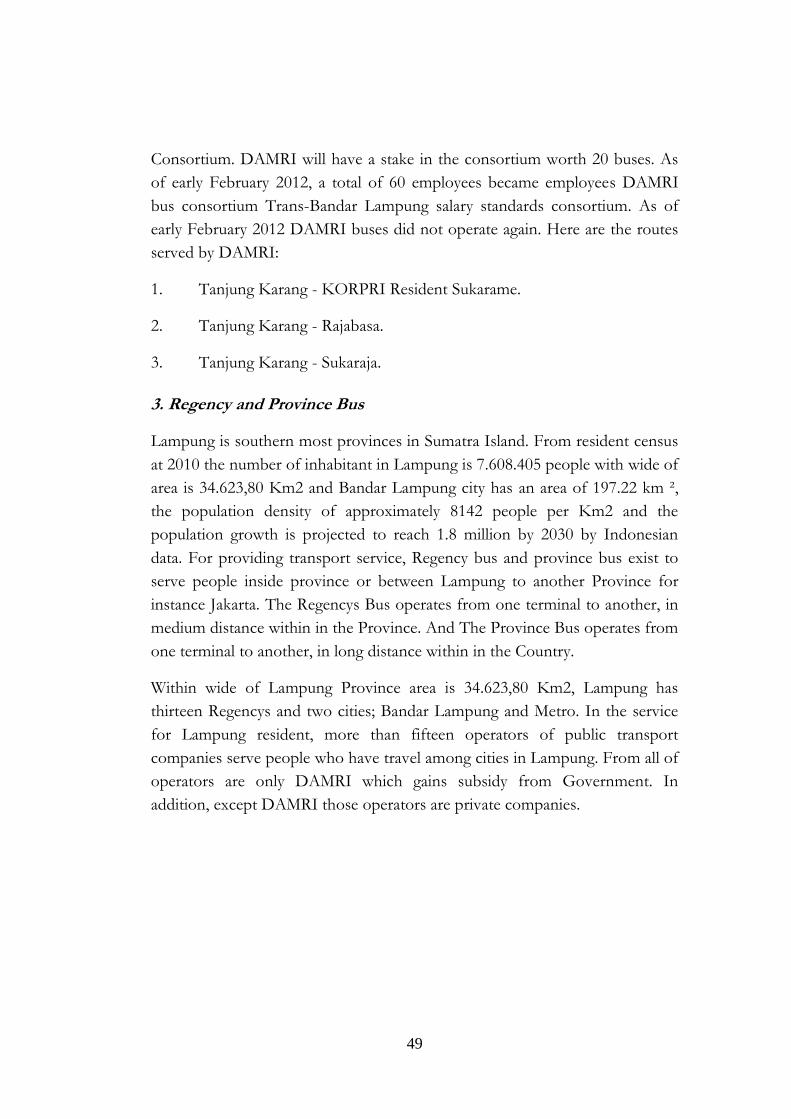
49
Consortium. DAMRI will have a stake in the consortium worth 20 buses. As
of early February 2012, a total of 60 employees became employees DAMRI
bus consortium Trans-Bandar Lampung salary standards consortium. As of
early February 2012 DAMRI buses did not operate again. Here are the routes
served by DAMRI:
1. Tanjung Karang - KORPRI Resident Sukarame.
2. Tanjung Karang - Rajabasa.
3. Tanjung Karang - Sukaraja.
3. Regency and Province Bus
Lampung is southern most provinces in Sumatra Island. From resident census
at 2010 the number of inhabitant in Lampung is 7.608.405 people with wide of
area is 34.623,80 Km2 and Bandar Lampung city has an area of 197.22 km ²,
the population density of approximately 8142 people per Km2 and the
population growth is projected to reach 1.8 million by 2030 by Indonesian
data. For providing transport service, Regency bus and province bus exist to
serve people inside province or between Lampung to another Province for
instance Jakarta. The Regencys Bus operates from one terminal to another, in
medium distance within in the Province. And The Province Bus operates from
one terminal to another, in long distance within in the Country.
Within wide of Lampung Province area is 34.623,80 Km2, Lampung has
thirteen Regencys and two cities; Bandar Lampung and Metro. In the service
for Lampung resident, more than fifteen operators of public transport
companies serve people who have travel among cities in Lampung. From all of
operators are only DAMRI which gains subsidy from Government. In
addition, except DAMRI those operators are private companies.
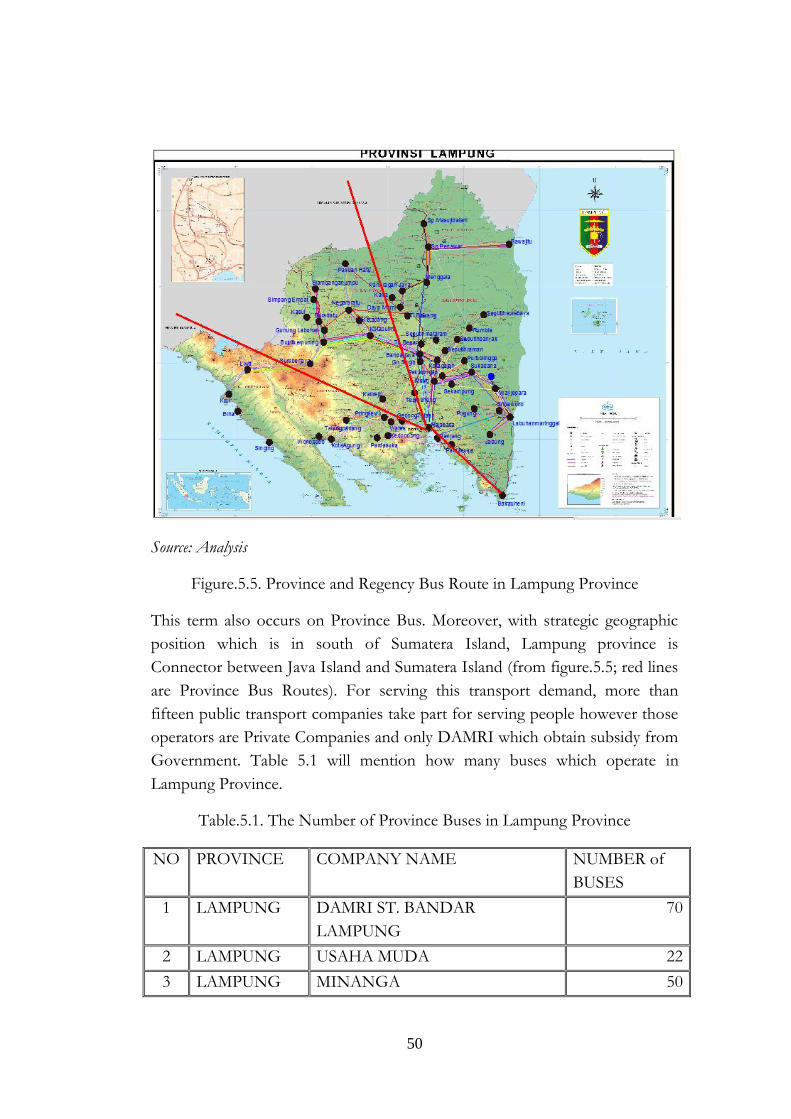
50
Source: Analysis
Figure.5.5. Province and Regency Bus Route in Lampung Province
This term also occurs on Province Bus. Moreover, with strategic geographic
position which is in south of Sumatera Island, Lampung province is
Connector between Java Island and Sumatera Island (from figure.5.5; red lines
are Province Bus Routes). For serving this transport demand, more than
fifteen public transport companies take part for serving people however those
operators are Private Companies and only DAMRI which obtain subsidy from
Government. Table 5.1 will mention how many buses which operate in
Lampung Province.
Table.5.1. The Number of Province Buses in Lampung Province
NO PROVINCE COMPANY NAME NUMBER of
BUSES
1 LAMPUNG DAMRI ST. BANDAR
LAMPUNG
70
2 LAMPUNG USAHA MUDA 22
3 LAMPUNG MINANGA 50
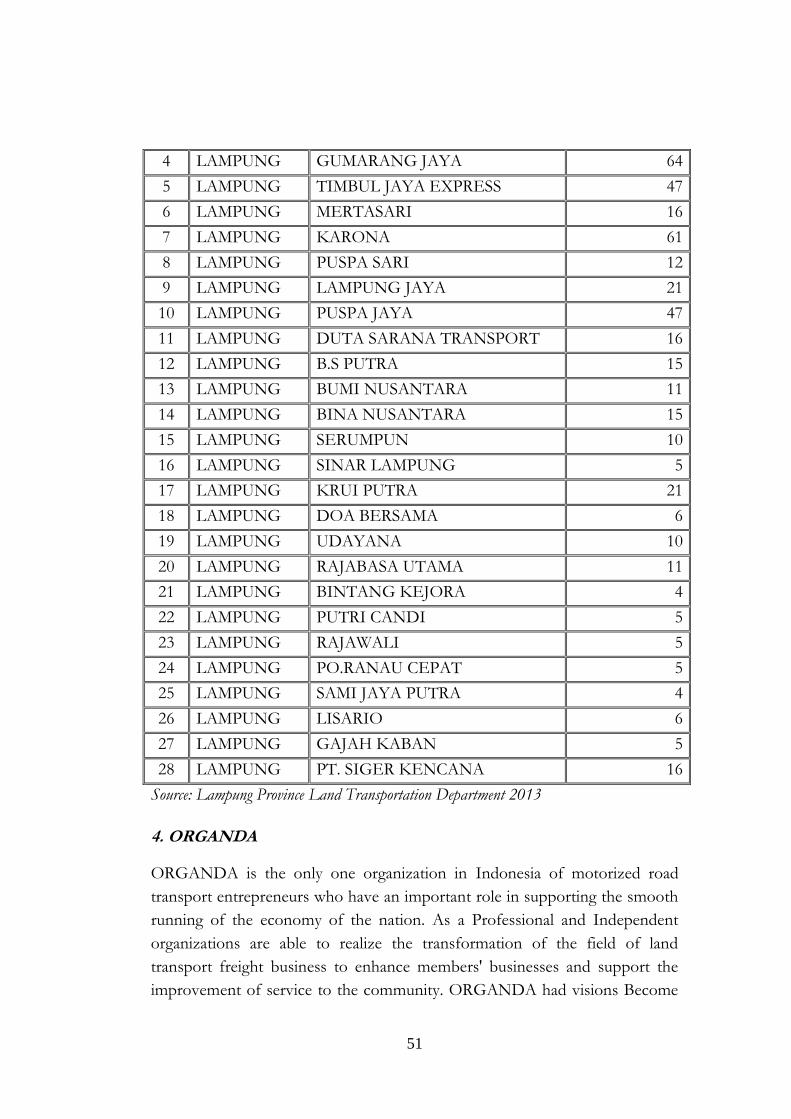
51
4 LAMPUNG GUMARANG JAYA 64
5 LAMPUNG TIMBUL JAYA EXPRESS 47
6 LAMPUNG MERTASARI 16
7 LAMPUNG KARONA 61
8 LAMPUNG PUSPA SARI 12
9 LAMPUNG LAMPUNG JAYA 21
10 LAMPUNG PUSPA JAYA 47
11 LAMPUNG DUTA SARANA TRANSPORT 16
12 LAMPUNG B.S PUTRA 15
13 LAMPUNG BUMI NUSANTARA 11
14 LAMPUNG BINA NUSANTARA 15
15 LAMPUNG SERUMPUN 10
16 LAMPUNG SINAR LAMPUNG 5
17 LAMPUNG KRUI PUTRA 21
18 LAMPUNG DOA BERSAMA 6
19 LAMPUNG UDAYANA 10
20 LAMPUNG RAJABASA UTAMA 11
21 LAMPUNG BINTANG KEJORA 4
22 LAMPUNG PUTRI CANDI 5
23 LAMPUNG RAJAWALI 5
24 LAMPUNG PO.RANAU CEPAT 5
25 LAMPUNG SAMI JAYA PUTRA 4
26 LAMPUNG LISARIO 6
27 LAMPUNG GAJAH KABAN 5
28 LAMPUNG PT. SIGER KENCANA 16
Source: Lampung Province Land Transportation Department 2013
4. ORGANDA
ORGANDA is the only one organization in Indonesia of motorized road
transport entrepreneurs who have an important role in supporting the smooth
running of the economy of the nation. As a Professional and Independent
organizations are able to realize the transformation of the field of land
transport freight business to enhance members' businesses and support the
improvement of service to the community. ORGANDA had visions Become

52
a professional Organizations and Independent and able to realize the
transformation of land transportation business areas to enhance members'
businesses and support the improvement of service to people.
ORGANDA was first established on June 30, 1962 at Malang, a merger of
organizations - employers' existing transportation, including: the United
Employers Association Autobus Indonesia (IPPOSI), Indonesia's National
Transportation Organization (ORPENI), Federation of Association of
Indonesian truck (FEGAPRI), Joint Land Transportation Veterans Indonesia
(GANDAVETRI).
ORGANDA is a professional organization that is the container of the
National Transport Entrepreneurs on the Road Motor shaped unity
throughout the territory of the Republic of Indonesia. ORGANDA members
are entrepreneurs land transport on the road that runs one type of road
transport business based on licensing and legal resident of the territory of the
Republic of Indonesia. This organization aims to foster and develop the skills
and professionalism of its members, towards the realization of road transport
businesses in Indonesia are strong, effective, efficient, innovative and highly
competitive.
ORGANDA has important role in transport business in Indonesia. Their role
is as connector between Operator and Regulator (Government). On the other
means, ORGANDA is as a channel from operator that had aspiration for
Governor. Beside as channel between Operator and Government,
ORGANDA has a role for connecting among internal operators. Based on
regulation in ORGANDA, ORGANDA has obligation;
1) For the channel, championing the aspirations and developing members in
an effort to achieve organizational goals.
2) Actively participate in the success of national development as a driver of
the economy of the nation.
3) As a means of communication with the Government, Institution of
Representatives, socio-political organizations and other civic
organizations.
4) To protect, preserve, and provide advocacy and legal protection for the
survival of member businesses.
53
5) As the representative body of world motor transport on the road, both in
the State and outside the State.
5. DISHUB and PEMPROV
In Indonesia, the regulator of every laws and transport regulation in Indonesia
is Ministry of Transportation. Due to Indonesia Country has many provinces,
Ministry of Transportation has ―agencies‖ or ―branches‖ in every provinces
and cities in Indonesia. Ministry of transportation which has authority in city is
Dishub and Pemprov which has authority in Province. The role of
government organization is responsible for managing the security, safety, and
comfortable of people in the field of traffic and transportation. Dishub has a
role as Public Transport Authority for public transport on Bandar Lampung
City and has obligation to rule them such as: determine the amount of
transport vehicles, determine the tariff, establish the routes, carrying capacity,
and has obligation to work together and cooperate with the stakeholders, in
order to create a good transport for customers. In addition, Pemprov has same
obligation and right but in different territory which means public transport in
Lampung Province.
Every public transport companies which wants to take a part become operator
in public transport business in Lampung or Bandar Lampung must has
permission from Dishub or Pemprov as Public Transport Authority in Bandar
Lampung City and Lampung Province. It is stipulated in the Regulation of
Lampung Province Governor number 7 of 1986 ―Transport companies that
serve routes between cities between Regencys in the Province Level II Level I
Lampung both the operation of the vehicle type bus or car passenger cars
must have permission route‖. Furthermore, requirements for obtaining route
permit has been arranged such as:
a. To obtain route permit:
i. Already had Petition submitted to the Governor cq. Bureau Bina
Sarana Regional Economic Development. Letter requests must be
sufficient by stamp regulations.
ii. Letter of request made by the Governor determined Regional Head.
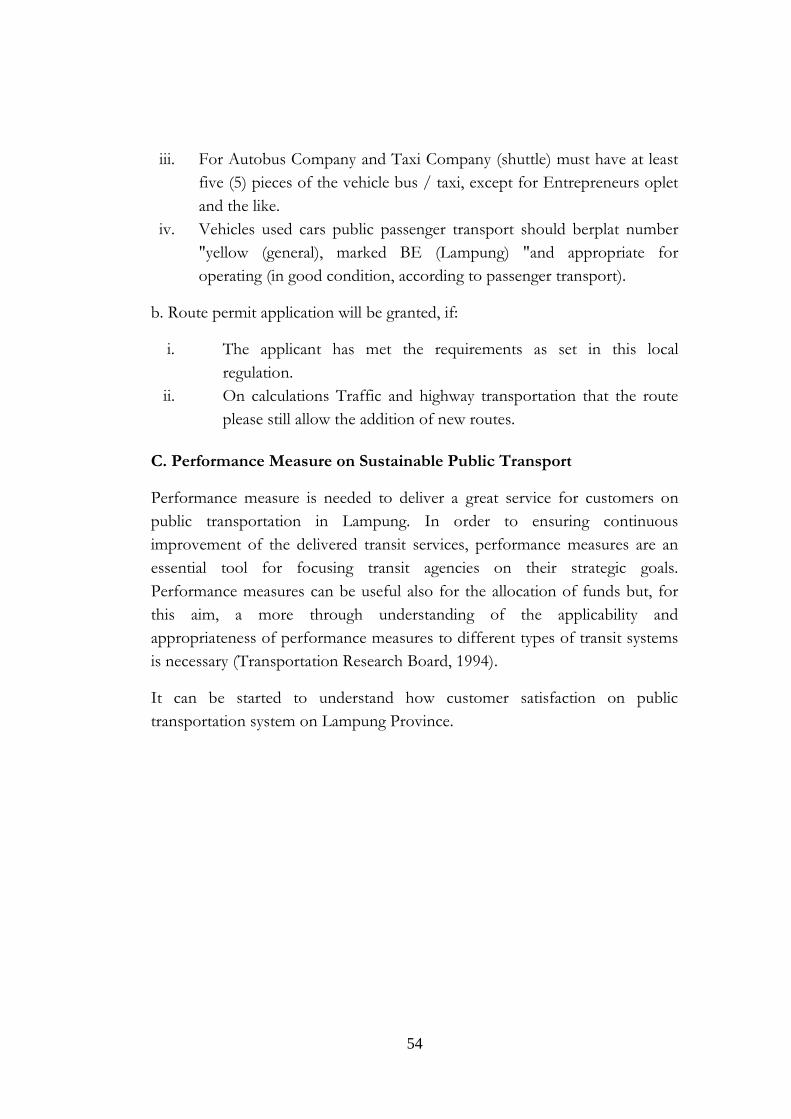
54
iii. For Autobus Company and Taxi Company (shuttle) must have at least
five (5) pieces of the vehicle bus / taxi, except for Entrepreneurs oplet
and the like.
iv. Vehicles used cars public passenger transport should berplat number
"yellow (general), marked BE (Lampung) "and appropriate for
operating (in good condition, according to passenger transport).
b. Route permit application will be granted, if:
i. The applicant has met the requirements as set in this local
regulation.
ii. On calculations Traffic and highway transportation that the route
please still allow the addition of new routes.
C. Performance Measure on Sustainable Public Transport
Performance measure is needed to deliver a great service for customers on
public transportation in Lampung. In order to ensuring continuous
improvement of the delivered transit services, performance measures are an
essential tool for focusing transit agencies on their strategic goals.
Performance measures can be useful also for the allocation of funds but, for
this aim, a more through understanding of the applicability and
appropriateness of performance measures to different types of transit systems
is necessary (Transportation Research Board, 1994).
It can be started to understand how customer satisfaction on public
transportation system on Lampung Province.
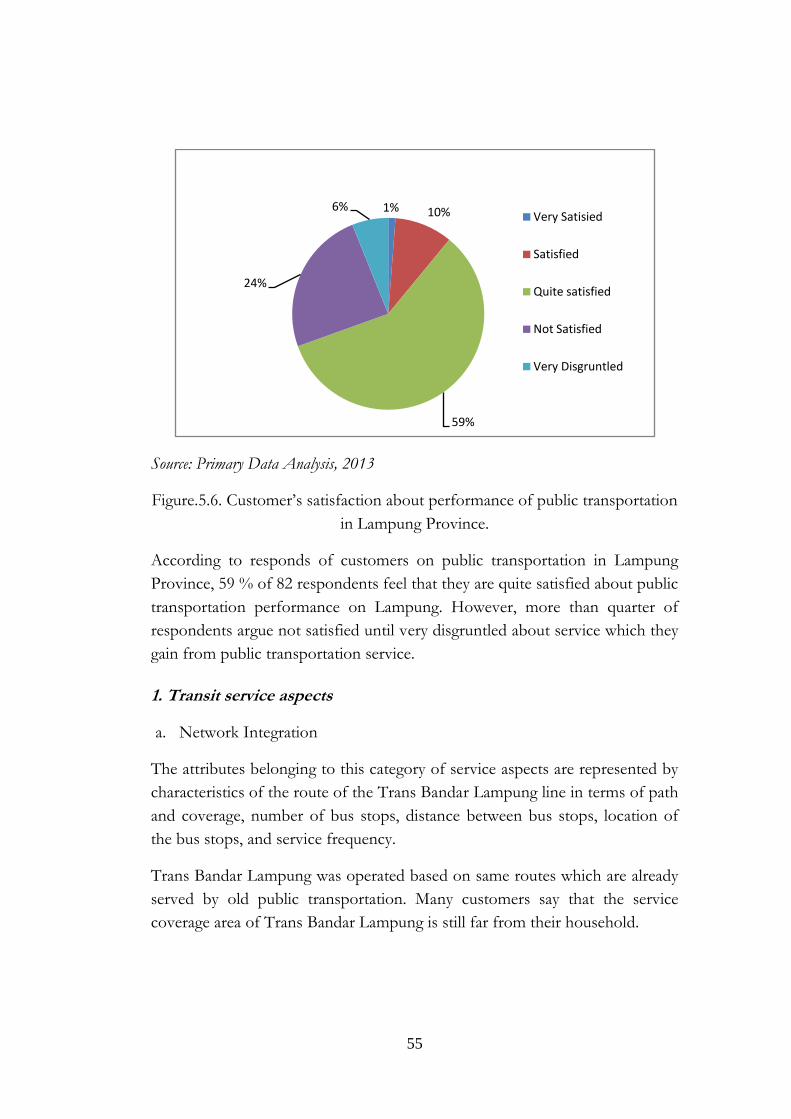
55
Source: Primary Data Analysis, 2013
Figure.5.6. Customer‘s satisfaction about performance of public transportation
in Lampung Province.
According to responds of customers on public transportation in Lampung
Province, 59 % of 82 respondents feel that they are quite satisfied about public
transportation performance on Lampung. However, more than quarter of
respondents argue not satisfied until very disgruntled about service which they
gain from public transportation service.
1. Transit service aspects
a. Network Integration
The attributes belonging to this category of service aspects are represented by
characteristics of the route of the Trans Bandar Lampung line in terms of path
and coverage, number of bus stops, distance between bus stops, location of
the bus stops, and service frequency.
Trans Bandar Lampung was operated based on same routes which are already
served by old public transportation. Many customers say that the service
coverage area of Trans Bandar Lampung is still far from their household.
1% 10%
59%
24%
6%Very Satisied
Satisfied
Quite satisfied
Not Satisfied
Very Disgruntled
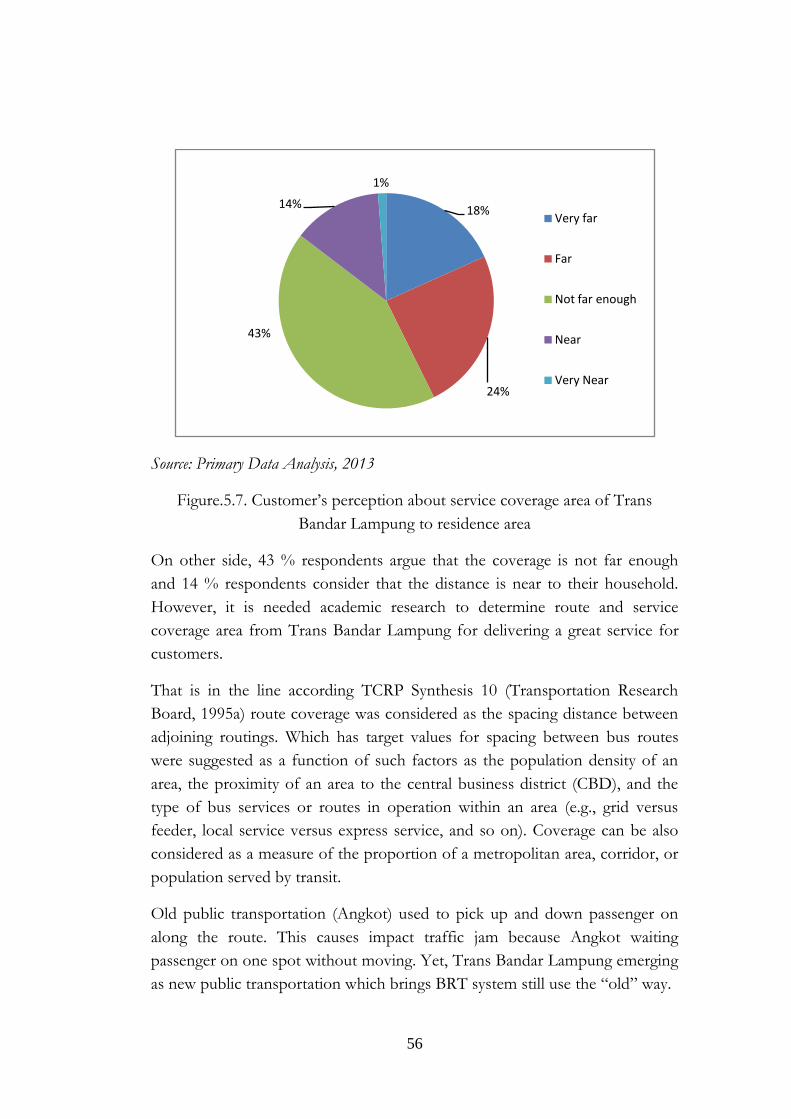
56
Source: Primary Data Analysis, 2013
Figure.5.7. Customer‘s perception about service coverage area of Trans
Bandar Lampung to residence area
On other side, 43 % respondents argue that the coverage is not far enough
and 14 % respondents consider that the distance is near to their household.
However, it is needed academic research to determine route and service
coverage area from Trans Bandar Lampung for delivering a great service for
customers.
That is in the line according TCRP Synthesis 10 (Transportation Research
Board, 1995a) route coverage was considered as the spacing distance between
adjoining routings. Which has target values for spacing between bus routes
were suggested as a function of such factors as the population density of an
area, the proximity of an area to the central business district (CBD), and the
type of bus services or routes in operation within an area (e.g., grid versus
feeder, local service versus express service, and so on). Coverage can be also
considered as a measure of the proportion of a metropolitan area, corridor, or
population served by transit.
Old public transportation (Angkot) used to pick up and down passenger on
along the route. This causes impact traffic jam because Angkot waiting
passenger on one spot without moving. Yet, Trans Bandar Lampung emerging
as new public transportation which brings BRT system still use the ―old‖ way.
18%
24%
43%
14%
1%
Very far
Far
Not far enough
Near
Very Near
57
Source: Primary Data Analysis, 2013
Figure.5.8. Customer‘s desire about service up and down passengers on Trans
Bandar Lampung
However, from figure above 65 % respondents want to be picked up and
down on shelter which has been determined. Many of them argue that that is
how BRT should be operated.
Among service characteristics, headway is the most distinctive aspect. Service
frequency measures how often Bus service is provided. It is an important
factor in one‘s decision to use transit; in fact, the more frequent the service,
the shorter the waiting time when a bus, and the greater the flexibility that
customers have in selecting travel times.
65%
35%
Pick up and Down passanger on Shelter
Pick up and Down passanger along the Bus Route
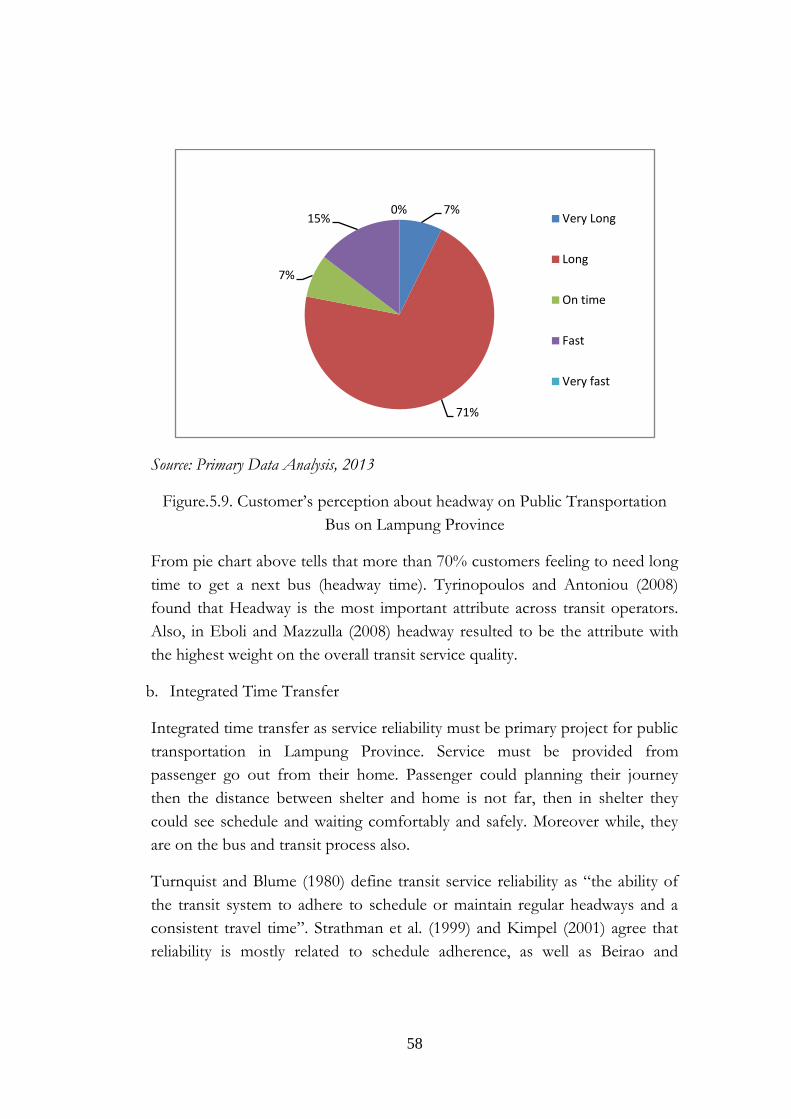
58
Source: Primary Data Analysis, 2013
Figure.5.9. Customer‘s perception about headway on Public Transportation
Bus on Lampung Province
From pie chart above tells that more than 70% customers feeling to need long
time to get a next bus (headway time). Tyrinopoulos and Antoniou (2008)
found that Headway is the most important attribute across transit operators.
Also, in Eboli and Mazzulla (2008) headway resulted to be the attribute with
the highest weight on the overall transit service quality.
b. Integrated Time Transfer
Integrated time transfer as service reliability must be primary project for public
transportation in Lampung Province. Service must be provided from
passenger go out from their home. Passenger could planning their journey
then the distance between shelter and home is not far, then in shelter they
could see schedule and waiting comfortably and safely. Moreover while, they
are on the bus and transit process also.
Turnquist and Blume (1980) define transit service reliability as ―the ability of
the transit system to adhere to schedule or maintain regular headways and a
consistent travel time‖. Strathman et al. (1999) and Kimpel (2001) agree that
reliability is mostly related to schedule adherence, as well as Beirao and
7%
71%
7%
15%0%
Very Long
Long
On time
Fast
Very fast
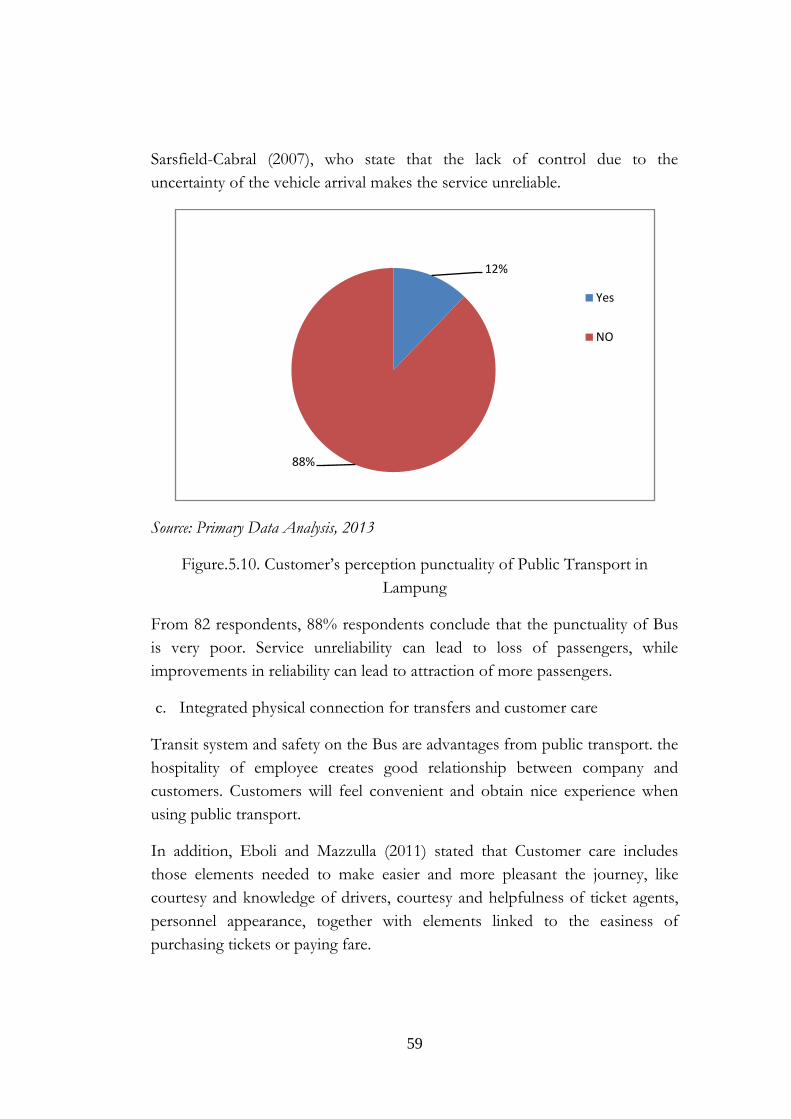
59
Sarsfield-Cabral (2007), who state that the lack of control due to the
uncertainty of the vehicle arrival makes the service unreliable.
Source: Primary Data Analysis, 2013
Figure.5.10. Customer‘s perception punctuality of Public Transport in
Lampung
From 82 respondents, 88% respondents conclude that the punctuality of Bus
is very poor. Service unreliability can lead to loss of passengers, while
improvements in reliability can lead to attraction of more passengers.
c. Integrated physical connection for transfers and customer care
Transit system and safety on the Bus are advantages from public transport. the
hospitality of employee creates good relationship between company and
customers. Customers will feel convenient and obtain nice experience when
using public transport.
In addition, Eboli and Mazzulla (2011) stated that Customer care includes
those elements needed to make easier and more pleasant the journey, like
courtesy and knowledge of drivers, courtesy and helpfulness of ticket agents,
personnel appearance, together with elements linked to the easiness of
purchasing tickets or paying fare.
12%
88%
Yes
NO
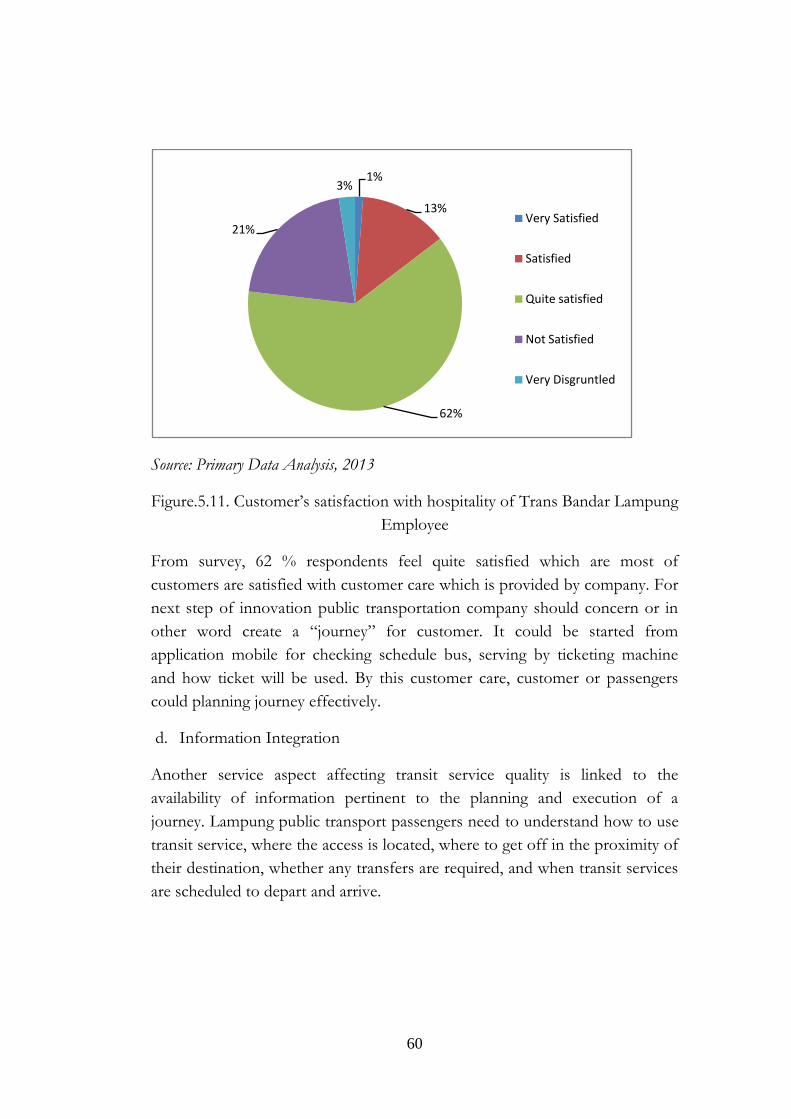
60
Source: Primary Data Analysis, 2013
Figure.5.11. Customer‘s satisfaction with hospitality of Trans Bandar Lampung
Employee
From survey, 62 % respondents feel quite satisfied which are most of
customers are satisfied with customer care which is provided by company. For
next step of innovation public transportation company should concern or in
other word create a ―journey‖ for customer. It could be started from
application mobile for checking schedule bus, serving by ticketing machine
and how ticket will be used. By this customer care, customer or passengers
could planning journey effectively.
d. Information Integration
Another service aspect affecting transit service quality is linked to the
availability of information pertinent to the planning and execution of a
journey. Lampung public transport passengers need to understand how to use
transit service, where the access is located, where to get off in the proximity of
their destination, whether any transfers are required, and when transit services
are scheduled to depart and arrive.
1%
13%
62%
21%
3%
Very Satisfied
Satisfied
Quite satisfied
Not Satisfied
Very Disgruntled
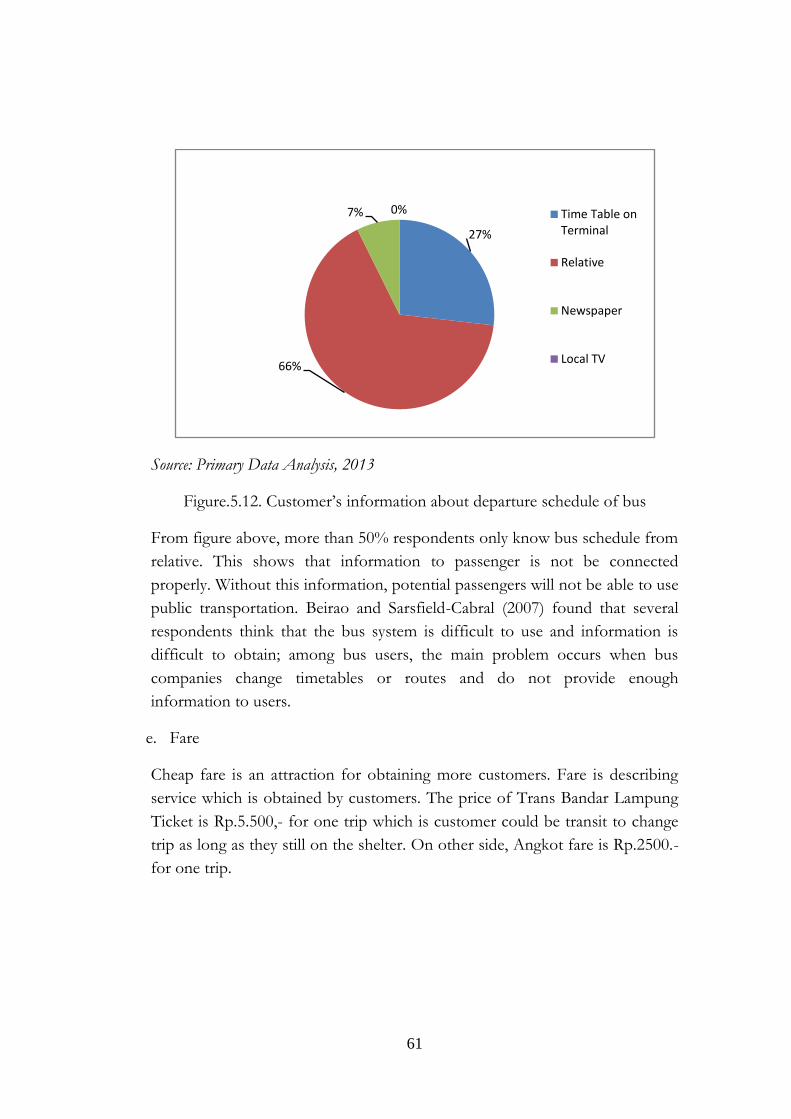
61
Source: Primary Data Analysis, 2013
Figure.5.12. Customer‘s information about departure schedule of bus
From figure above, more than 50% respondents only know bus schedule from
relative. This shows that information to passenger is not be connected
properly. Without this information, potential passengers will not be able to use
public transportation. Beirao and Sarsfield-Cabral (2007) found that several
respondents think that the bus system is difficult to use and information is
difficult to obtain; among bus users, the main problem occurs when bus
companies change timetables or routes and do not provide enough
information to users.
e. Fare
Cheap fare is an attraction for obtaining more customers. Fare is describing
service which is obtained by customers. The price of Trans Bandar Lampung
Ticket is Rp.5.500,- for one trip which is customer could be transit to change
trip as long as they still on the shelter. On other side, Angkot fare is Rp.2500.-
for one trip.
27%
66%
7% 0% Time Table on Terminal
Relative
Newspaper
Local TV
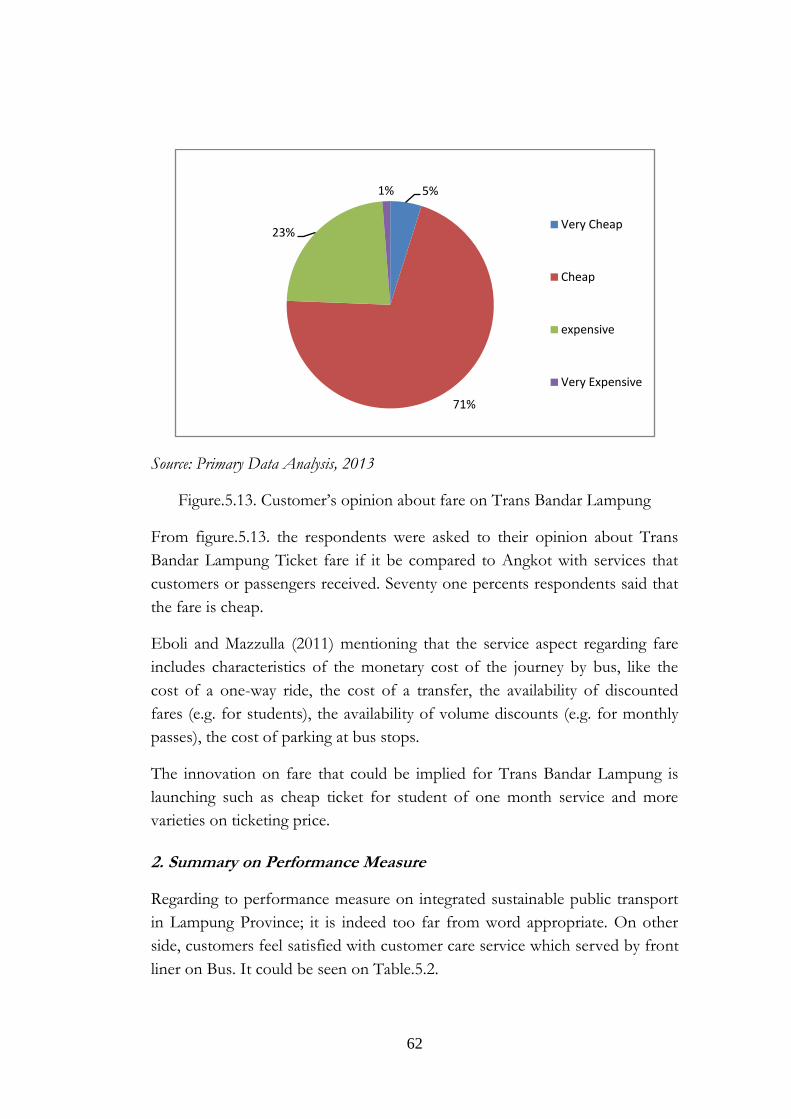
62
Source: Primary Data Analysis, 2013
Figure.5.13. Customer‘s opinion about fare on Trans Bandar Lampung
From figure.5.13. the respondents were asked to their opinion about Trans
Bandar Lampung Ticket fare if it be compared to Angkot with services that
customers or passengers received. Seventy one percents respondents said that
the fare is cheap.
Eboli and Mazzulla (2011) mentioning that the service aspect regarding fare
includes characteristics of the monetary cost of the journey by bus, like the
cost of a one-way ride, the cost of a transfer, the availability of discounted
fares (e.g. for students), the availability of volume discounts (e.g. for monthly
passes), the cost of parking at bus stops.
The innovation on fare that could be implied for Trans Bandar Lampung is
launching such as cheap ticket for student of one month service and more
varieties on ticketing price.
2. Summary on Performance Measure
Regarding to performance measure on integrated sustainable public transport
in Lampung Province; it is indeed too far from word appropriate. On other
side, customers feel satisfied with customer care service which served by front
liner on Bus. It could be seen on Table.5.2.
5%
71%
23%
1%
Very Cheap
Cheap
expensive
Very Expensive
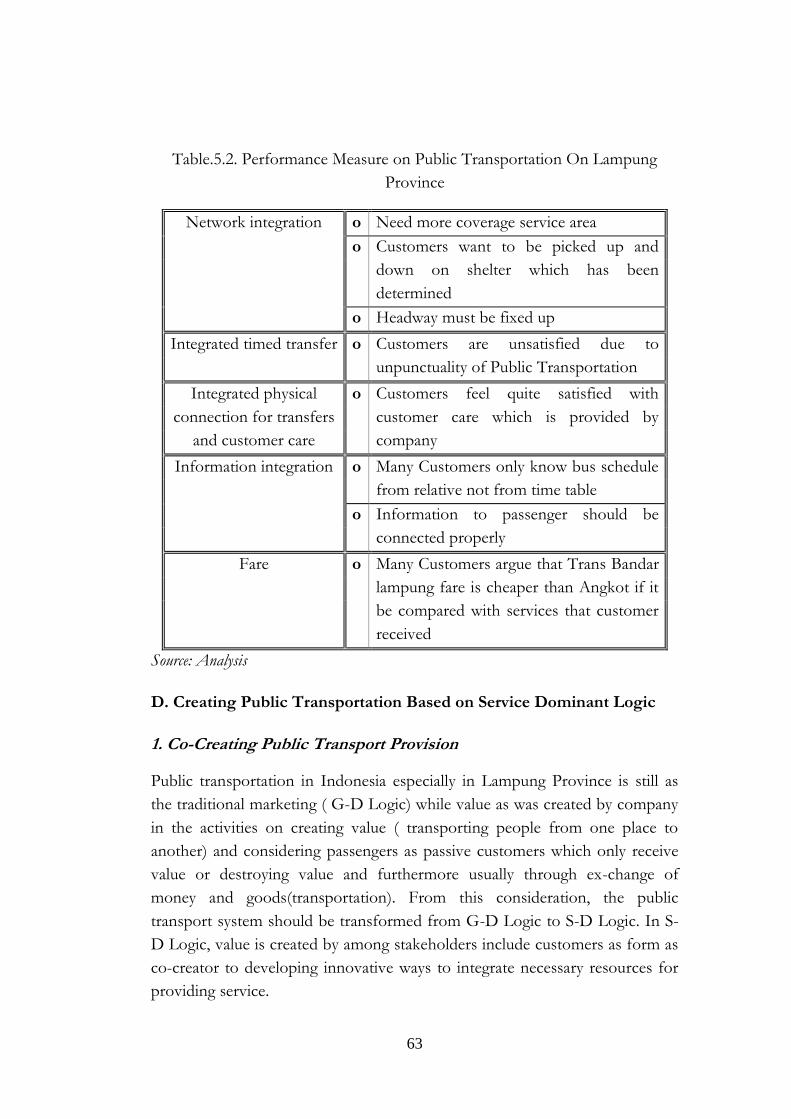
63
Table.5.2. Performance Measure on Public Transportation On Lampung
Province
Network integration o Need more coverage service area
o Customers want to be picked up and
down on shelter which has been
determined
o Headway must be fixed up
Integrated timed transfer o Customers are unsatisfied due to
unpunctuality of Public Transportation
Integrated physical
connection for transfers
and customer care
o Customers feel quite satisfied with
customer care which is provided by
company
Information integration o Many Customers only know bus schedule
from relative not from time table
o Information to passenger should be
connected properly
Fare o Many Customers argue that Trans Bandar
lampung fare is cheaper than Angkot if it
be compared with services that customer
received
Source: Analysis
D. Creating Public Transportation Based on Service Dominant Logic
1. Co-Creating Public Transport Provision
Public transportation in Indonesia especially in Lampung Province is still as
the traditional marketing ( G-D Logic) while value as was created by company
in the activities on creating value ( transporting people from one place to
another) and considering passengers as passive customers which only receive
value or destroying value and furthermore usually through ex-change of
money and goods(transportation). From this consideration, the public
transport system should be transformed from G-D Logic to S-D Logic. In S-
D Logic, value is created by among stakeholders include customers as form as
co-creator to developing innovative ways to integrate necessary resources for
providing service.
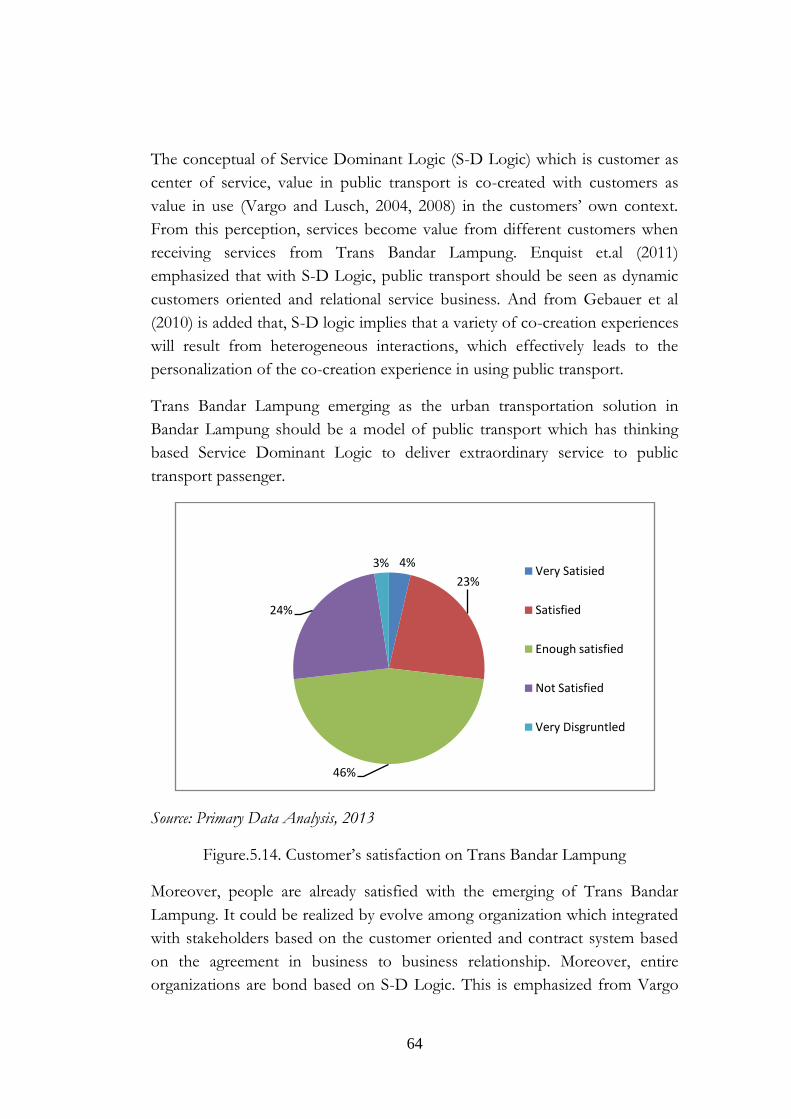
64
The conceptual of Service Dominant Logic (S-D Logic) which is customer as
center of service, value in public transport is co-created with customers as
value in use (Vargo and Lusch, 2004, 2008) in the customers‘ own context.
From this perception, services become value from different customers when
receiving services from Trans Bandar Lampung. Enquist et.al (2011)
emphasized that with S-D Logic, public transport should be seen as dynamic
customers oriented and relational service business. And from Gebauer et al
(2010) is added that, S-D logic implies that a variety of co-creation experiences
will result from heterogeneous interactions, which effectively leads to the
personalization of the co-creation experience in using public transport.
Trans Bandar Lampung emerging as the urban transportation solution in
Bandar Lampung should be a model of public transport which has thinking
based Service Dominant Logic to deliver extraordinary service to public
transport passenger.
Source: Primary Data Analysis, 2013
Figure.5.14. Customer‘s satisfaction on Trans Bandar Lampung
Moreover, people are already satisfied with the emerging of Trans Bandar
Lampung. It could be realized by evolve among organization which integrated
with stakeholders based on the customer oriented and contract system based
on the agreement in business to business relationship. Moreover, entire
organizations are bond based on S-D Logic. This is emphasized from Vargo
4%
23%
46%
24%
3%Very Satisied
Satisfied
Enough satisfied
Not Satisfied
Very Disgruntled
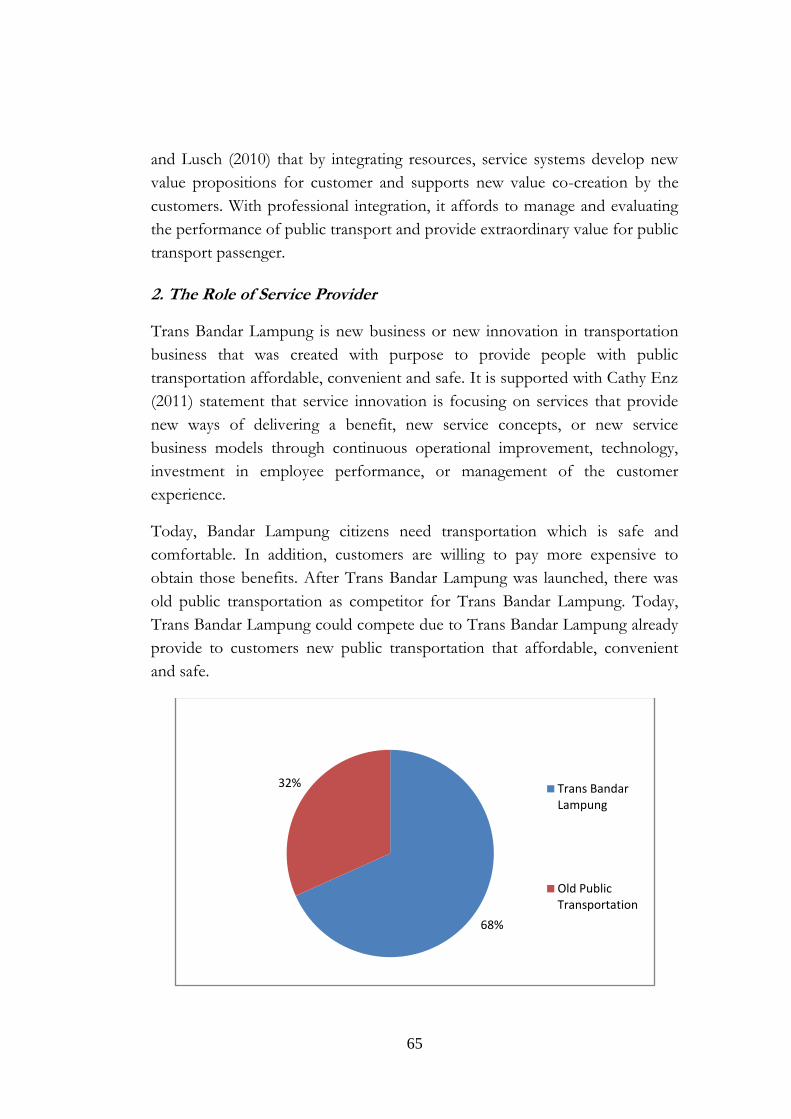
65
and Lusch (2010) that by integrating resources, service systems develop new
value propositions for customer and supports new value co-creation by the
customers. With professional integration, it affords to manage and evaluating
the performance of public transport and provide extraordinary value for public
transport passenger.
2. The Role of Service Provider
Trans Bandar Lampung is new business or new innovation in transportation
business that was created with purpose to provide people with public
transportation affordable, convenient and safe. It is supported with Cathy Enz
(2011) statement that service innovation is focusing on services that provide
new ways of delivering a benefit, new service concepts, or new service
business models through continuous operational improvement, technology,
investment in employee performance, or management of the customer
experience.
Today, Bandar Lampung citizens need transportation which is safe and
comfortable. In addition, customers are willing to pay more expensive to
obtain those benefits. After Trans Bandar Lampung was launched, there was
old public transportation as competitor for Trans Bandar Lampung. Today,
Trans Bandar Lampung could compete due to Trans Bandar Lampung already
provide to customers new public transportation that affordable, convenient
and safe.
68%
32% Trans Bandar Lampung
Old Public Transportation
66
Source: Primary Data Analysis, 2013
Figure.5.15. Bandar Lampung citizen choice between Trans Bandar Lampung
and Old Public Transportation (Angkot)
It is already proven at figure.5.15. that 68 % respondents choose Trans Bandar
Lampung than Angkot. It happened because Trans Bandar Lampung provides
new experience which is not given by old public transportation such as
comfortable and safe.
From Johnson and Gustafson (2003), to create service advantage, there
are three main parts which influence each others. The figure.5.16 will
elaborate how to create service advantage.
Source: Competing in a Service Economy (Gustafson and Johnson, 2003)
Figure.5.16. Building a competitive service advantage
―Trans Bandar Lampung already stays focused on providing public
transportation which safe, comfortable and affordable has a good link
activities, good at resources allocating to concern at competitor advantage and
a good built culture. Trans Bandar Lampung should realize that certain ways
of doing business such as treating employees with respect and building
customer relationship. Therefore, employee could deliver excellent
customer service, employee could understand the central role they play
determining a company‘s performance. One point apart good built culture
to make good relationship with customer is good customer interaction.
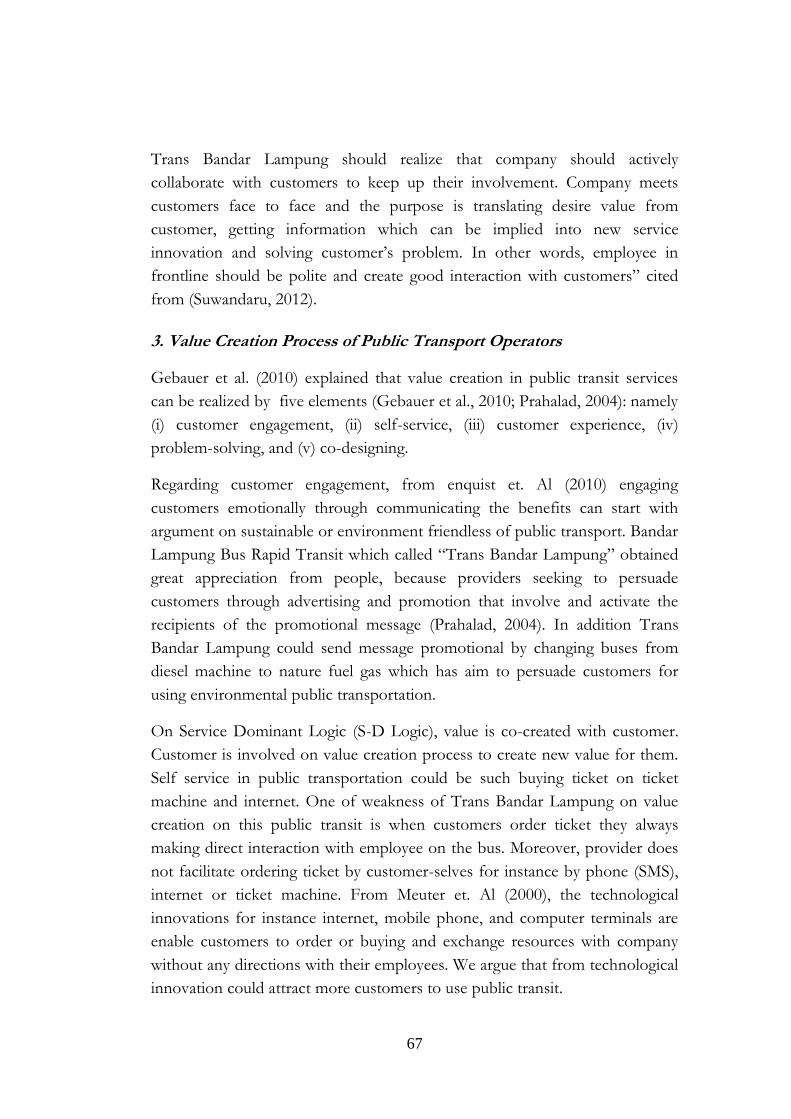
67
Trans Bandar Lampung should realize that company should actively
collaborate with customers to keep up their involvement. Company meets
customers face to face and the purpose is translating desire value from
customer, getting information which can be implied into new service
innovation and solving customer‘s problem. In other words, employee in
frontline should be polite and create good interaction with customers‖ cited
from (Suwandaru, 2012).
3. Value Creation Process of Public Transport Operators
Gebauer et al. (2010) explained that value creation in public transit services
can be realized by five elements (Gebauer et al., 2010; Prahalad, 2004): namely
(i) customer engagement, (ii) self-service, (iii) customer experience, (iv)
problem-solving, and (v) co-designing.
Regarding customer engagement, from enquist et. Al (2010) engaging
customers emotionally through communicating the benefits can start with
argument on sustainable or environment friendless of public transport. Bandar
Lampung Bus Rapid Transit which called ―Trans Bandar Lampung‖ obtained
great appreciation from people, because providers seeking to persuade
customers through advertising and promotion that involve and activate the
recipients of the promotional message (Prahalad, 2004). In addition Trans
Bandar Lampung could send message promotional by changing buses from
diesel machine to nature fuel gas which has aim to persuade customers for
using environmental public transportation.
On Service Dominant Logic (S-D Logic), value is co-created with customer.
Customer is involved on value creation process to create new value for them.
Self service in public transportation could be such buying ticket on ticket
machine and internet. One of weakness of Trans Bandar Lampung on value
creation on this public transit is when customers order ticket they always
making direct interaction with employee on the bus. Moreover, provider does
not facilitate ordering ticket by customer-selves for instance by phone (SMS),
internet or ticket machine. From Meuter et. Al (2000), the technological
innovations for instance internet, mobile phone, and computer terminals are
enable customers to order or buying and exchange resources with company
without any directions with their employees. We argue that from technological
innovation could attract more customers to use public transit.
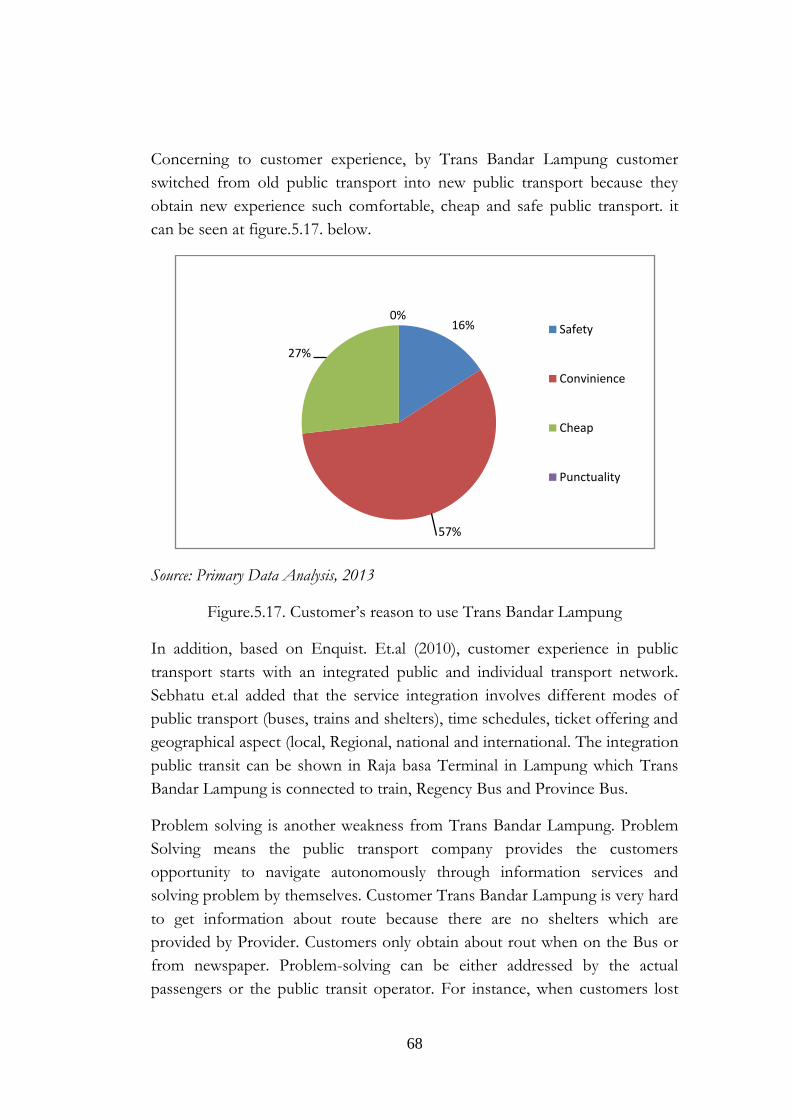
68
Concerning to customer experience, by Trans Bandar Lampung customer
switched from old public transport into new public transport because they
obtain new experience such comfortable, cheap and safe public transport. it
can be seen at figure.5.17. below.
Source: Primary Data Analysis, 2013
Figure.5.17. Customer‘s reason to use Trans Bandar Lampung
In addition, based on Enquist. Et.al (2010), customer experience in public
transport starts with an integrated public and individual transport network.
Sebhatu et.al added that the service integration involves different modes of
public transport (buses, trains and shelters), time schedules, ticket offering and
geographical aspect (local, Regional, national and international. The integration
public transit can be shown in Raja basa Terminal in Lampung which Trans
Bandar Lampung is connected to train, Regency Bus and Province Bus.
Problem solving is another weakness from Trans Bandar Lampung. Problem
Solving means the public transport company provides the customers
opportunity to navigate autonomously through information services and
solving problem by themselves. Customer Trans Bandar Lampung is very hard
to get information about route because there are no shelters which are
provided by Provider. Customers only obtain about rout when on the Bus or
from newspaper. Problem-solving can be either addressed by the actual
passengers or the public transit operator. For instance, when customers lost
16%
57%
27%
0%Safety
Convinience
Cheap
Punctuality
69
their belonging, they do not know where is the place which they could
complain about their lose belonging.
Regarding to Co-Designing, Co-design of services covers aspects such as
creating new value creation ideas in collaboration with customers or engaging
customers in the market launch of new service, tickets, and travel cards
(Johnson et al., 2010). In Trans Bandar Lampung customers are not involved
in co-design of service, thus customers are as passive consumers.
Customers in Trans Bandar Lampung are passive; only receive existing service
without engaging interaction with service provider by front liner. According to
Vargo and Lusch, (2006) service in S-D logic is the application of
competences (knowledge and skills) by one entity for the benefit of another.
In old public transportation (G-D logic) view, the purpose is service ex-change
which embedded values into product or service.
Trans Bandar Lampung obtained great appreciation from people, because
providers seeking to persuade customers through advertising and promotion
that involve and activate the recipients of the promotional message (Prahalad,
2004). With Trans Bandar Lampung customer switched from old public
transport into new public transport because they obtain new experience such
comfortable, cheap and safe public transport. The interest of public to Trans
Bandar Lampung could be seen at Figure.5.7 below as from ticketing revenue
on Trans Bandar Lampung.
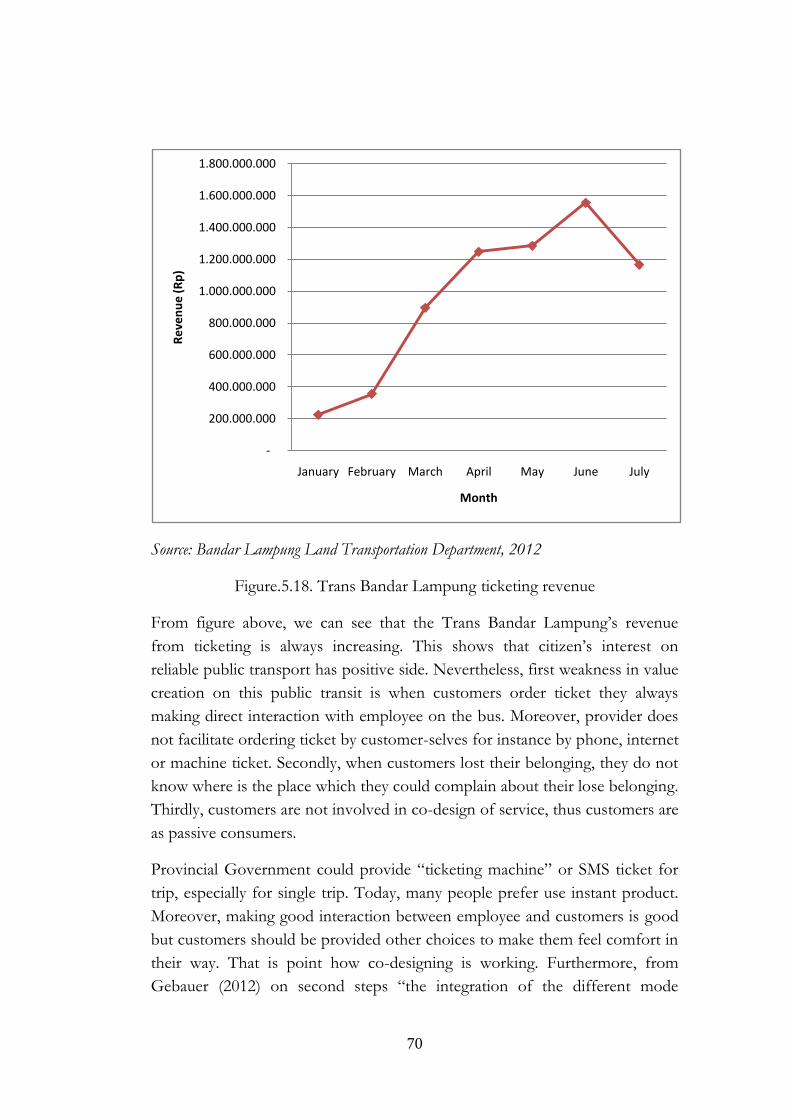
70
Source: Bandar Lampung Land Transportation Department, 2012
Figure.5.18. Trans Bandar Lampung ticketing revenue
From figure above, we can see that the Trans Bandar Lampung‘s revenue
from ticketing is always increasing. This shows that citizen‘s interest on
reliable public transport has positive side. Nevertheless, first weakness in value
creation on this public transit is when customers order ticket they always
making direct interaction with employee on the bus. Moreover, provider does
not facilitate ordering ticket by customer-selves for instance by phone, internet
or machine ticket. Secondly, when customers lost their belonging, they do not
know where is the place which they could complain about their lose belonging.
Thirdly, customers are not involved in co-design of service, thus customers are
as passive consumers.
Provincial Government could provide ―ticketing machine‖ or SMS ticket for
trip, especially for single trip. Today, many people prefer use instant product.
Moreover, making good interaction between employee and customers is good
but customers should be provided other choices to make them feel comfort in
their way. That is point how co-designing is working. Furthermore, from
Gebauer (2012) on second steps ―the integration of the different mode
-
200.000.000
400.000.000
600.000.000
800.000.000
1.000.000.000
1.200.000.000
1.400.000.000
1.600.000.000
1.800.000.000
January February March April May June July
Re
ven
ue
(R
p)
Month
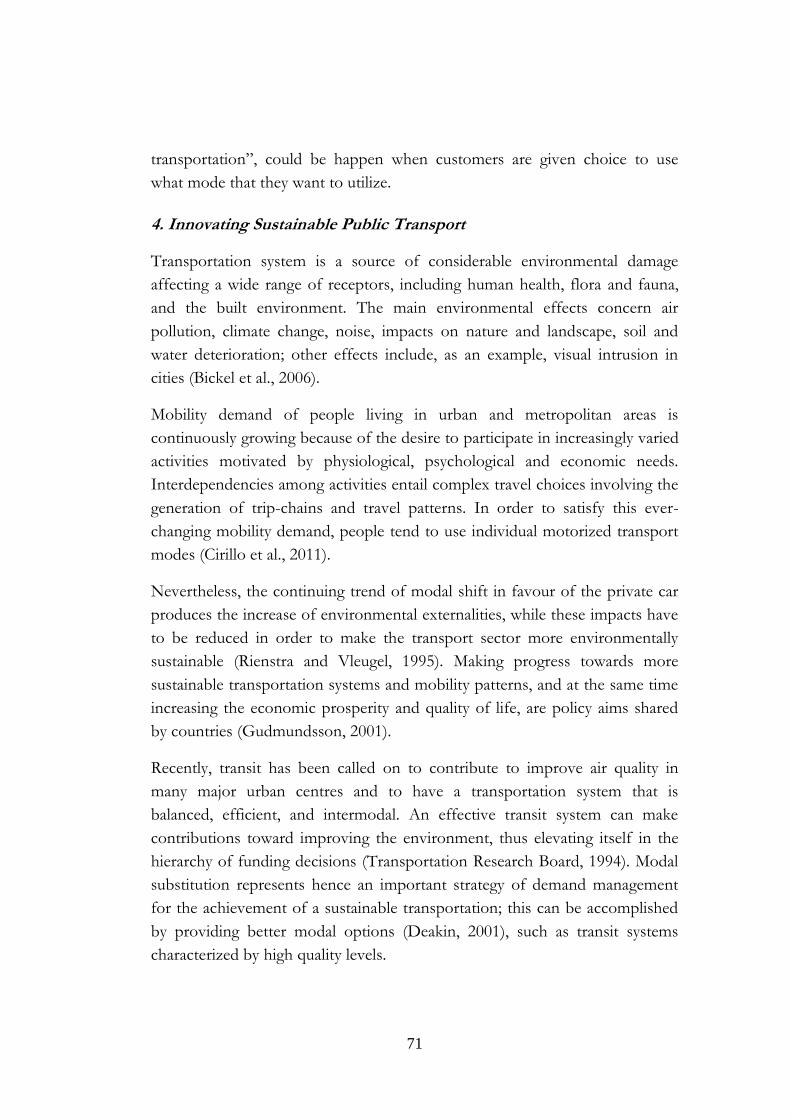
71
transportation‖, could be happen when customers are given choice to use
what mode that they want to utilize.
4. Innovating Sustainable Public Transport
Transportation system is a source of considerable environmental damage
affecting a wide range of receptors, including human health, flora and fauna,
and the built environment. The main environmental effects concern air
pollution, climate change, noise, impacts on nature and landscape, soil and
water deterioration; other effects include, as an example, visual intrusion in
cities (Bickel et al., 2006).
Mobility demand of people living in urban and metropolitan areas is
continuously growing because of the desire to participate in increasingly varied
activities motivated by physiological, psychological and economic needs.
Interdependencies among activities entail complex travel choices involving the
generation of trip-chains and travel patterns. In order to satisfy this ever-
changing mobility demand, people tend to use individual motorized transport
modes (Cirillo et al., 2011).
Nevertheless, the continuing trend of modal shift in favour of the private car
produces the increase of environmental externalities, while these impacts have
to be reduced in order to make the transport sector more environmentally
sustainable (Rienstra and Vleugel, 1995). Making progress towards more
sustainable transportation systems and mobility patterns, and at the same time
increasing the economic prosperity and quality of life, are policy aims shared
by countries (Gudmundsson, 2001).
Recently, transit has been called on to contribute to improve air quality in
many major urban centres and to have a transportation system that is
balanced, efficient, and intermodal. An effective transit system can make
contributions toward improving the environment, thus elevating itself in the
hierarchy of funding decisions (Transportation Research Board, 1994). Modal
substitution represents hence an important strategy of demand management
for the achievement of a sustainable transportation; this can be accomplished
by providing better modal options (Deakin, 2001), such as transit systems
characterized by high quality levels.
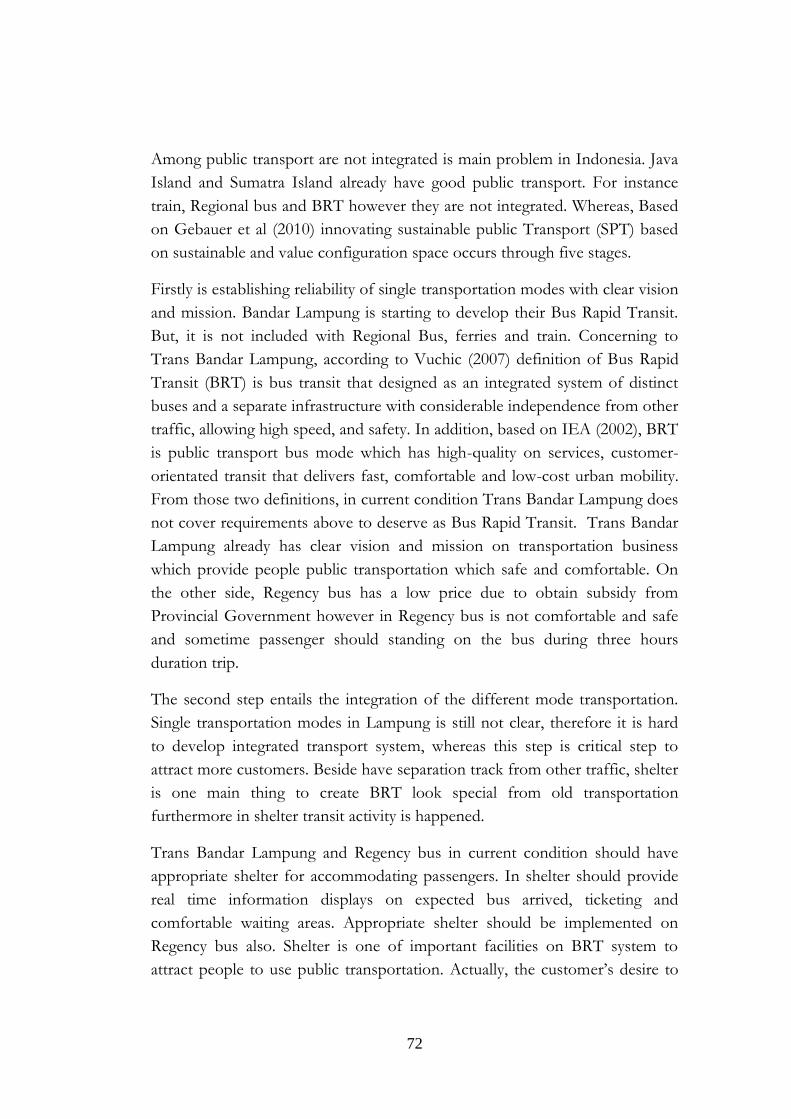
72
Among public transport are not integrated is main problem in Indonesia. Java
Island and Sumatra Island already have good public transport. For instance
train, Regional bus and BRT however they are not integrated. Whereas, Based
on Gebauer et al (2010) innovating sustainable public Transport (SPT) based
on sustainable and value configuration space occurs through five stages.
Firstly is establishing reliability of single transportation modes with clear vision
and mission. Bandar Lampung is starting to develop their Bus Rapid Transit.
But, it is not included with Regional Bus, ferries and train. Concerning to
Trans Bandar Lampung, according to Vuchic (2007) definition of Bus Rapid
Transit (BRT) is bus transit that designed as an integrated system of distinct
buses and a separate infrastructure with considerable independence from other
traffic, allowing high speed, and safety. In addition, based on IEA (2002), BRT
is public transport bus mode which has high-quality on services, customer-
orientated transit that delivers fast, comfortable and low-cost urban mobility.
From those two definitions, in current condition Trans Bandar Lampung does
not cover requirements above to deserve as Bus Rapid Transit. Trans Bandar
Lampung already has clear vision and mission on transportation business
which provide people public transportation which safe and comfortable. On
the other side, Regency bus has a low price due to obtain subsidy from
Provincial Government however in Regency bus is not comfortable and safe
and sometime passenger should standing on the bus during three hours
duration trip.
The second step entails the integration of the different mode transportation.
Single transportation modes in Lampung is still not clear, therefore it is hard
to develop integrated transport system, whereas this step is critical step to
attract more customers. Beside have separation track from other traffic, shelter
is one main thing to create BRT look special from old transportation
furthermore in shelter transit activity is happened.
Trans Bandar Lampung and Regency bus in current condition should have
appropriate shelter for accommodating passengers. In shelter should provide
real time information displays on expected bus arrived, ticketing and
comfortable waiting areas. Appropriate shelter should be implemented on
Regency bus also. Shelter is one of important facilities on BRT system to
attract people to use public transportation. Actually, the customer‘s desire to
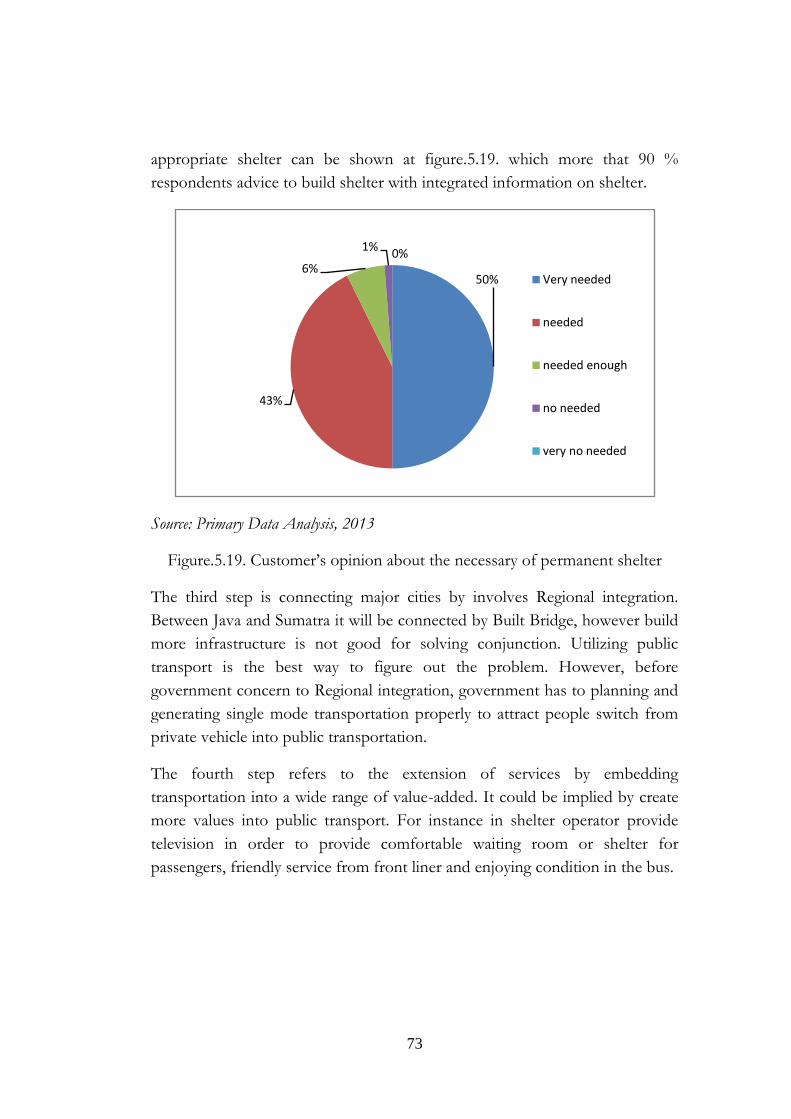
73
appropriate shelter can be shown at figure.5.19. which more that 90 %
respondents advice to build shelter with integrated information on shelter.
Source: Primary Data Analysis, 2013
Figure.5.19. Customer‘s opinion about the necessary of permanent shelter
The third step is connecting major cities by involves Regional integration.
Between Java and Sumatra it will be connected by Built Bridge, however build
more infrastructure is not good for solving conjunction. Utilizing public
transport is the best way to figure out the problem. However, before
government concern to Regional integration, government has to planning and
generating single mode transportation properly to attract people switch from
private vehicle into public transportation.
The fourth step refers to the extension of services by embedding
transportation into a wide range of value-added. It could be implied by create
more values into public transport. For instance in shelter operator provide
television in order to provide comfortable waiting room or shelter for
passengers, friendly service from front liner and enjoying condition in the bus.
50%
43%
6%
1%0%
Very needed
needed
needed enough
no needed
very no needed
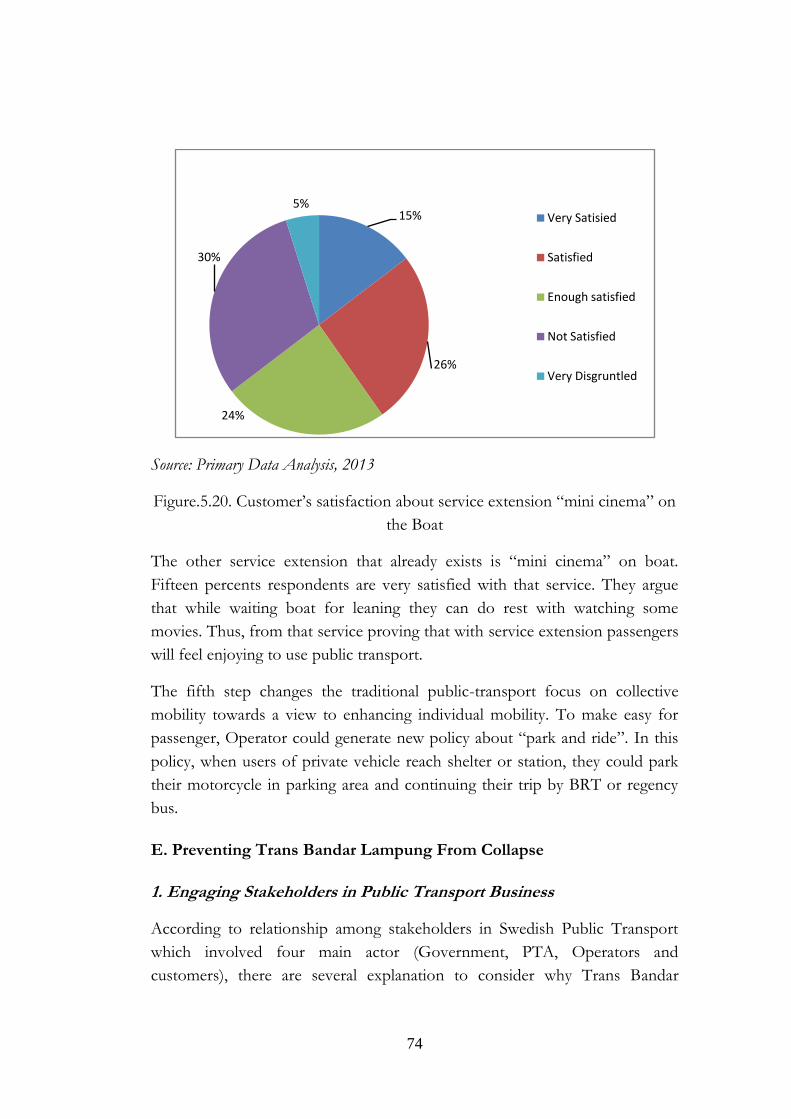
74
Source: Primary Data Analysis, 2013
Figure.5.20. Customer‘s satisfaction about service extension ―mini cinema‖ on
the Boat
The other service extension that already exists is ―mini cinema‖ on boat.
Fifteen percents respondents are very satisfied with that service. They argue
that while waiting boat for leaning they can do rest with watching some
movies. Thus, from that service proving that with service extension passengers
will feel enjoying to use public transport.
The fifth step changes the traditional public-transport focus on collective
mobility towards a view to enhancing individual mobility. To make easy for
passenger, Operator could generate new policy about ―park and ride‖. In this
policy, when users of private vehicle reach shelter or station, they could park
their motorcycle in parking area and continuing their trip by BRT or regency
bus.
E. Preventing Trans Bandar Lampung From Collapse
1. Engaging Stakeholders in Public Transport Business
According to relationship among stakeholders in Swedish Public Transport
which involved four main actor (Government, PTA, Operators and
customers), there are several explanation to consider why Trans Bandar
15%
26%
24%
30%
5%Very Satisied
Satisfied
Enough satisfied
Not Satisfied
Very Disgruntled
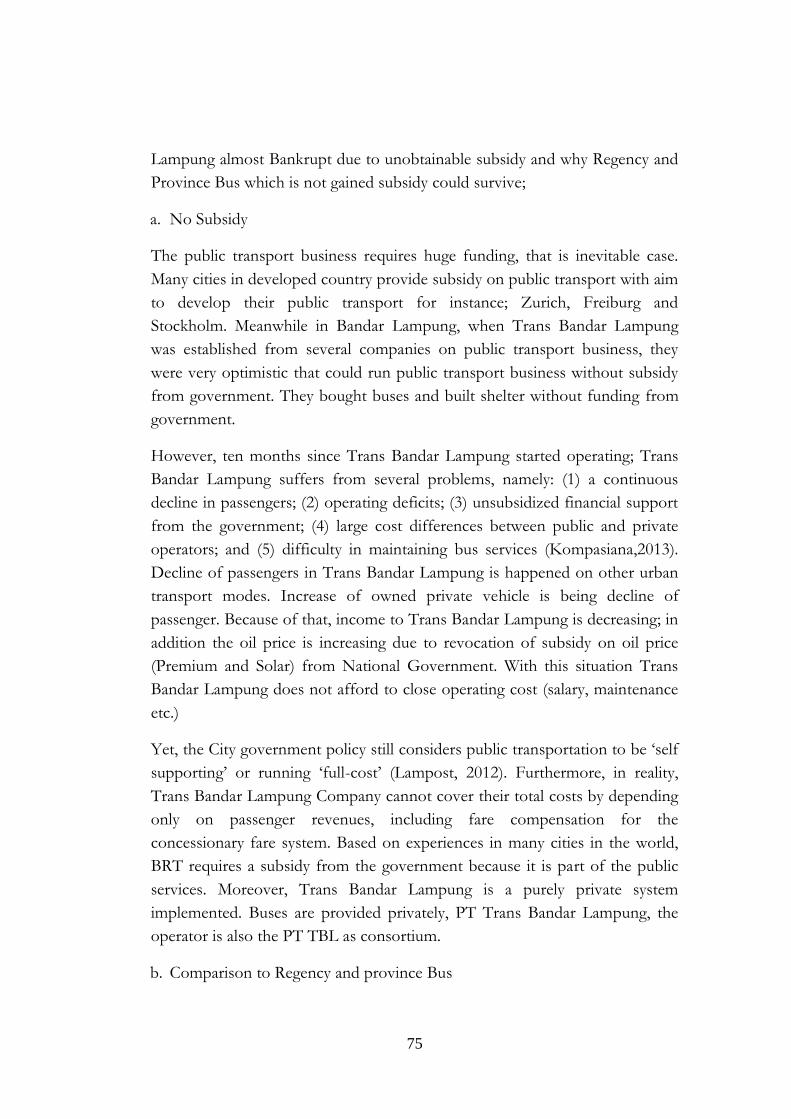
75
Lampung almost Bankrupt due to unobtainable subsidy and why Regency and
Province Bus which is not gained subsidy could survive;
a. No Subsidy
The public transport business requires huge funding, that is inevitable case.
Many cities in developed country provide subsidy on public transport with aim
to develop their public transport for instance; Zurich, Freiburg and
Stockholm. Meanwhile in Bandar Lampung, when Trans Bandar Lampung
was established from several companies on public transport business, they
were very optimistic that could run public transport business without subsidy
from government. They bought buses and built shelter without funding from
government.
However, ten months since Trans Bandar Lampung started operating; Trans
Bandar Lampung suffers from several problems, namely: (1) a continuous
decline in passengers; (2) operating deficits; (3) unsubsidized financial support
from the government; (4) large cost differences between public and private
operators; and (5) difficulty in maintaining bus services (Kompasiana,2013).
Decline of passengers in Trans Bandar Lampung is happened on other urban
transport modes. Increase of owned private vehicle is being decline of
passenger. Because of that, income to Trans Bandar Lampung is decreasing; in
addition the oil price is increasing due to revocation of subsidy on oil price
(Premium and Solar) from National Government. With this situation Trans
Bandar Lampung does not afford to close operating cost (salary, maintenance
etc.)
Yet, the City government policy still considers public transportation to be ‗self
supporting‘ or running ‗full-cost‘ (Lampost, 2012). Furthermore, in reality,
Trans Bandar Lampung Company cannot cover their total costs by depending
only on passenger revenues, including fare compensation for the
concessionary fare system. Based on experiences in many cities in the world,
BRT requires a subsidy from the government because it is part of the public
services. Moreover, Trans Bandar Lampung is a purely private system
implemented. Buses are provided privately, PT Trans Bandar Lampung, the
operator is also the PT TBL as consortium.
b. Comparison to Regency and province Bus
76
Meanwhile in Regency Bus, there are also many privately owned buses that
provide adequate local bus services and play an important role in providing
transport facilities in their areas (Regency). More than ten operators in public
transportation provide service and only one which received subsidy from
Government. Yet, this condition (without subsidy) they could still survive, it is
very contradiction to public transport relationship which have been claimed by
Enquist et.al (2010).
Source: Analysis (adapted from Enquist et.al 2010)
Figure.5.21. Stakeholders relationship in Regency and province Bus in
Lampung Province
From Figure 5.21 is explained that on Public Transport in Lampung Province
in Regency and Province area could still survive and proving service to
customer without subsidy. Operators still afford to close operating cost from
ticket price even though while in servicing to customer has been decreasing
service because many old buses still operating. Actually, this occur due to long
distance. Urban citizen utilize motorcycle in their activity because it is very
easy to buy motorcycle. The increasing of motorcycle growth is main problem
why Trans Bandar Lampung is almost bankrupt despite Trans Bandar
Lampung‘s tracks which serve customers are same with Old public
transportation‘s area. In Regency and Province Bus, every operator had very
little problem to motorcycle because of long distance between cities.
2. Creating Robust Engagement
As the first BRT system in Lampung province, Trans Bandar Lampung could
be saved by strengthen engagement bond in public transport business. It could
be started from campaign about the right transportation should be, how to
create a better transportation, the right culture about driving, and it should be
77
done continuously. In current condition, transportation in Bandar Lampung
seems to have lost interest in how to be a good user in highway. If every
citizen could promote public transport gets rid of their personal egoism, the
ideal public transport will be more easily realized. Furthermore, regulations
have been made is always violated and ignored by the society, either by the
operator or the customers but there are no hard punishment for them.
From the psychological side, if the promote campaigns for ideal
transportation could be successes, it will be eventually be able to change the
way of society views on public transport. Nowadays, people assume that using
public transport is very uncomfortable, slow, unpunctuality, etc. all
stakeholders must be united to be able to remove this paradigm, and gradually
improving the existing system toward a better transportation.
Organda as Indonesian joint organization in public transport has been less
effective in carrying out its duties as a unifying public transport. In the internal
communication between operators, Organda had a very important role, yet on
the field their performance to be stagnant and not move forward from their
duties and functions. Actually, Organda also be capable of being a connector
among stakeholders. Operators and Dishub as key element in this engagement
should be embraced and invited to work together to create the right
engagement.
To safe Trans Bandar Lampung, it will be needed to create strong engagement.
This is an engagement between transport operators and owners, who stayed
under the joint organization. This internal engagement created a way to unite
the operators and vehicle owners into an organization, and make them would
to comply with the rules made by the organizations. Trans Bandar Lampung
should be taken to Government and create Joint Organization as operator to
control the management.
This is going to happen if Trans Bandar Lampung and the government are
willing to improve their relationship as stakeholders. They should work with
share the same views on public transport progress. From Sohail et. al. (2001),
partnering between two parties is not discrete but involves a continuous
process. Surely there will be differences of opinion among stakeholders
sometimes, but that is the process. Sohail claimed that there is a need to
remain vigilant to carefully crafting principles and practices that create a
78
supportive and credible environment, involving the right stakeholders in the
right roles, and blending social and institutional dimensions of poverty
reduction with the economic and financial gains of all partners.
When Joint organization has been established, Government with Dishub is
now only has a role as the regulator. They still have an authority to remind and
warn Joint Organization if something goes wrong, because Dishub is a
representative government in public transport. They also charge of making
policies and rules, as well as overseeing Trans Bandar Lampung performance.
Dishub no longer need to oversee the operators because this task has been
delegated to Joint Organization, who will report to them if the operators make
any break in rules. This strategy will provide benefits for both sides. Dishub
will easier in carrying out their duties as Regulator, and Joint Organization also
has a new function in this business. Moreover, Operators also do not have to
waste their time to ask the permit and recommendation from different
organizations. They just need to take the permit from Joint Organization, and
it will much more efficient in application process.
By this engagement will bring some benefits for among stakeholders. First is
easier to manage operators because the order is come from one authority.
Second, it could create an integrated transport system. Furthermore, it will also
give effect to the service quality that will be received by users because clear
contract between PTA and operator. Moreover, the importance concern in
transit service quality is passengers‘ point of view.
a. Public Private Partnership
From Jamil and Neumaker (2010) Public-Private Partnership is a variation of
privatisation in which parts of a service run solely by the public sector are
provided through a partnership between the government and at least one
private company. In addition, from Jamil at 2008 can be added that in general,
the government pays for the provision and maintenance of public facilities and
services. They appear in the expenditure group of the public household. When
a public facility is being announced as a PPP, the provider is responsible for
the maintenance of the facility and provision of service. The property rights
remain with the state. When the contract expires, the government has to buy
back the facility.
79
One way government to bond Trans Bandar Lampung is by PPP. To create
successful implementation of transport infrastructure in Bandar Lampung
between Government and Trans Bandar Lampung requires a strong
coordinated and integrated effort of the public and private sectors, given the
complexity of the involved processes. The Government is responsible for the
regulatory action that takes place across the entire life cycle of the project,
including the definition of the delivery model, the selection of the service
provider, the specification of the contract and its monitoring.
It should be regulation and objectives from Trans Bandar Lampung and
Government. Regulation can also be described in terms of a regulatory system
or can be represented as regulatory intervention, which Brown, Stern,
Tenenbaum & Gencer (2006) defines ―.as the combination of institutions,
laws, and processes that, taken together, enable a government to exercise
formal and informal control over the operating and investment decisions of
enterprises that supply infrastructure services. They also defined identify two
basic dimensions of the regulatory system, namely regulatory governance and
regulatory substance;
From Brown, Stern, Tenenbaum & Gencer,( 2006) regulatory governance
refers to the institutional and legal design of the regulatory system and the
framework within which decisions are made. Regulatory substance is the
content of regulation. It is the actual decisions, whether explicit or implicit,
made by the specified regulatory entity or other entities within the
government, along with the rationale for the decisions.
From above definition, it will be clear what is role between Government and
Trans Bandar Lampung whether the create bond between of them. The main
duty of the Government is the control of prices and service quality. Moreover,
the intervention of the Government is expected to be oriented towards
assuring that the market outcome is as close as possible to the one that would
be achieved in a fully competitive environment. Since the Government should
ensure the best possible use of limited public resources and must guarantee
that the project adds economic value to the society and minimal politic
conflict.
80
F. Reflection to Zurich and Freiburg
Good system of public transit should be balanced with good policy. Zurich
and Freiburg which have been developed their system properly. Zurich
becoming the centre of conurbation where many working places are located in
the town and the suburbs are mostly residential areas the traffic may soon
become a problem and needs a clear traffic policy. And finally they could
create tram (one of transportation modes) being lifestyle at among Zurich
citizen.
From Butler and Nash (2010) Public support is the most critical element of
implementing any government program. Public support is particularly
important for a transit priority program because effective transit priority
programs create winners (public transit) and losers (other roadway users). In
Zurich, the public took an active role in forcing the city administration to
implement transit priority more comprehensively and more boldly than would
have been possible without strong public support.
In addition, the improvements of transit priority affect many departments. In
Zurich, two task forces, one at the political level (Executive Council) and one
at the department level (Working Party) addressed this issue. The department-
level committee developed detailed implementation plans and the political-
level committee focuses on overall strategy and implementation (Butler and
Nash, 2010).
To create strong public transit system, every stakeholders that has power to
decisive a regulation should be bounded. Moreover, on political side should
create a regulation which supports public transit in Lampung. In
implementation, at departement-level has obligation to operate and manage
public transit system to be more attractive for citizen.
Furthermore, Zurich already implemented excellent public transit furthermore
their system is being ―main plan‖ for every country in the world which had
plan for creating public transit system. In addition to this basic transit service,
there are several complementary programs that cities can implement to further
support and improve the transit system. Zurich concentrated on land use in its
center city. Zurich focused on improving its urbanity by reducing parking and
traffic and using the freed-up space to speed up transit, create pedestrian
81
zones, provide space for public events, and create a lively and entertaining
downtown.
In order to reach the objectives of the transport strategy, an improvement of
the suburban connections was needed. Improving Regional transportation by
investing in the commuter rail system and carefully coordinating transit service
was critical to the success of the city‘s transit priority program in Zurich. This
is a new system empowers the city to promote public transit as a better
alternative than driving and reject demands for increasing space for private
vehicles. Moreover, for integrating system, it is now possible to travel on all
public transports of the Regency with the same ticket.
Freiburg is another city which has the growth in availability of cars yet the
growth of public transport passenger and bicycle trips were increase. The
council of Freiburg implemented restriction from cars which means Restricted
auto use has been achieved through mechanisms such as pedestrianization of
the city centre, area-wide traffic calming schemes (such as a citywide speed
limit of 30 km/h in residential areas) and more difficult, expensive parking.
Freiburg is famous with up-date policies about transport sustainable. From
Buehler and Pucher (2011), Freiburg‘s first integrated transport plan had
inadvertently laid the foundation for the changes to come. Although still
focusing on car use, the plan recommended preserving and potentially
expanding the streetcar network. Freiburg‘s first integrated bicycling network
plan and a new car-free pedestrian zone in the center of old town. Freiburg‘s
second integrated transport plan focused on environmental protection and
sustainable development. The new plan favored public transport and
promoting bicycling and walking for short trips over the automobile and called
for the integration of transport and land-use planning.
For complementing these policies, Freiburg release policy about restriction
area for car using. And also issue policy about parking. The aim of Freiburg
Government is to reduce car use. The city combines disincentives to car use in
the town center and residential neighborhoods with improvement of arterials
that have been widened or altered in various ways to increase their carrying
capacity (City of Freiburg 2008; Gutzmer 2006).
82
Launch regulation to force private vehicle users to get more space in town is
one way to reduce traffic jam. Bandar Lampung as a capital city on Lampung
Province could make restrictied area on one of place in sub-district Tanjung
Karang to being market place. In this area, only non-motorized vehicle which
can be allowed to pass this area. With this policy will have many advantages,
such a new of market center and a new tour place for tourist.
Despite, created policies about sustainable transport, Freiburg also improve
their public transportation. Light rail, Regional rail, and bus services and
timetables are fully integrated in Freiburg. Real-time information is provided
by digital displays at rail stations, light rail stops, and key bus stops (City of
Freiburg 2008; ZRF 2003, 2008). Both light rail and bus services are faster and
more reliable because of traffic signal priority, with lights turning green for
oncoming trains and buses at key intersections. And this improvement was
complemented with attractive ticket and pricing.
For implementation, Government could create good public transit system as
first step. Furthermore, this should be supported by policies which compound
private vehicles users, such as generating policies that system of highway is
hard for private vehicles to turn around,; create city centre which has policies
that private vehicle could not go through it; and also launching high ticketing
price.
83
CHAPTER VI CONCLUSION AND CONTRIBUTION
A. Conclusion
1. The description of public transportation in Bandar Lampung is more than
30 years; Bandar Lampung citizen was provided service by old public
transportation. Then, since 2011, several owners of public transport
companies in Bandar Lampung built Trans Bandar Lampung to provide
public transport service. Old public transportation already had 8 routes,
the when Trans Bandar Lampung was established they competed each
other in same routes.
2. Regarding to performance measure on integrated sustainable public
transport in Lampung Province; it is indeed too far from word
appropriate. Firstly, on network integration is still lack of coverage service
area. Concerning on integrated timed transfer many customers are
unsatisfied due to unpunctuality of Public Transportation. However, on
customer care already had heart space on customers because customer
feel satisfied on this stage. In fact, many customers only know bus
schedule from relative. This shows that information to passenger is not be
connected properly. And the last on fare price, Many Customers argue
that Trans Bandar lampung fare is cheaper than Angkot if it be compared
with services that customers received.
3. The conceptual of Service Dominant Logic (S-D Logic) which is customer
as center of service, Trans Bandar Lampung emerging as the urban
transportation solution in Bandar Lampung should be a model of public
transport which has thinking based Service Dominant Logic to deliver
extraordinary service to public transport passenger. Furthermore, S-D
Logic is a new breakthrough in market orientation. In fact, Trans Bandar
Lampung already attract more customers than old public transportation
providing public transportation which cheap, safe and comfortable.
4. Public private partnership is one path to bond Trans Bandar Lampung
and Government. Government has to create clear contract. And
government could fund short or long time contract. It depends on
problem and circumstances that will be faced. And plans should be
flexible and adaptable over time to changing conditions. If it could be
implemented then it would be one step closer to create sustainable public
transport in Lampung Province.
84
5. The lesson that could be taken from Zurich and Freiburgh is to create
sustainable public transport system should be balancing between public
transit system and good policy. Public transit system must be help
passenger to reach every place in one area. In addition, there is strong
policies which supports to public transit system itself.
B. Contribution
In this research, the authors had desire to provide suggestion on how to create
integrated sustainable transport system in Bandar Lampung. The expectation is
every stakeholder understands about problems which occur in Lampung
province particularly in Bandar Lampung City. To further, with collaboration
from every stakeholder, sustainable of integrated transport system is not
impossible to be implied.
C. Future Research
This research has covered how to created integrated sustainable public
transport from creating value creation in single mode to integrated mode. To
further research since this has reflection to Zurich and Freiburg need to
observe how to value creation network has been created in there and created
integrated with railway because Lampung Province also had railroad system.
85
REFERENCES
Ada apa dengan BRT (2013). Trans Bandar Lampung. Available:
http://lampost.co/berita/ada-apa-dengan-brt [2013-05-21].
Bo Enquist, (2011), ‗Value in context for Public Transport‘, lecturer material,
Karlstad University, Sweden.
BRT dilego (2013). Bandar Lampung News. Available: http://www.Bandar
Lampungnews.com/index.php?k=politik&i=14504
Walikota%20Deadline%20Sebulan,%20BRT%20Segera%20Dilego [2013-05-
21].
Carmona, Miguel (2010)‖ The regulatory function in public-private
partnerships for the provision of transport infrastructure‖. Research in
Transportation Economics vol.30. pp. 110-125, 2010.
CCAP 2005; Dalkmann and Brannigan 2007; VTPI 2007; Gallagher, et al.
2007; Bomberg, et al. 2008; Mayors Climate Protection Center
Chowdury, Subeh. & Ceder, Avishai (2013). Definition
Of Palnned and Unplanned Tranasfer of Public Transport Service and User
Decisions to Use Routes with Transfers; Journal of Public Transportation,
Vol. 16, No. 2. New Zealand.
Cresswell J. (2002). Research Design: Qualitative, Quantitative, and Mixed Methods
Approaches
Dishub (2013). DepHub. Available: http://www.dephub.go.id/read/liputan-
khusus/15338l [2013-05-21].
Eboli, Laura. & Mazzulla, Gabriella, (2009). Performance indicators for an
objective measure of public transport quality. European Transport. University of
Calabria
Eisenkopf, A. & Knorr, A. ―Engaging the Private Sector in Transportation
Infrastructure – The Role of Public-Private-Partnerships‖,Germany.
86
Enquist, B., Johnson, M. & Camén, C. (2005). Contractual Governance for
Sustainable Service, Qualitative Research in Accounting & Management, 2 (1). pp.
29-53.
Enz,C.A., (2011). Improving the Guest Experience through Service Innovation: Ideas and
Principles for the Hospitality Industry , (3),. 1-15,
Freeman, R.E. (1984). Strategic Management: A Stakeholder Approach, Prentice-
Hall, Englewood Cliffs, NJ.
Greenwood M. (2007). Stakeholder Engagement: Beyond the Myth of
Corporate Responsibility, Journal of Business Ethics, Volume 74, Number 4, 315-
327, Springer 2007
Gustafsson, A & Johnson, M.(2003). Competing In Service Economy: How ToCreate
a Competitive Advantage Through Service Development and Innovation. Michigan
Grönroos, C. (2000). Service Management and Marketing. New York, John Wiley
and Sons.
Heiko, G, Mikael, J, & Bo, E 2010, 'Value co-creation as a determinant of
success in public transport services: A study of the Swiss Federal Railway
operator (SBB)', Managing Service Quality, 20, 6, pp. 511-530, Business
Source Premier, EBSCOhost, viewed 15 November 2011.
Heiko, G, Mikael, J, & Bo, E 2010, ‗Sustainability and Innovating Value-
Configuration Spaces for Innovative Public Transit Services ―Insights from public
transport services in industrialized and newly-industrialized countrie”, The Business of
Social and Environmental Innovation Conference 2011,Cape Town, South
Africa.
IEA (International Energy Agency). (2002), ―Bus Systems For The Future,
Achieving Sustainable Transport Worldwide‖, IEA Publication, Paris, France.
Indonesian Data (2013). Sensus Penduduk Indonesia Tahun 2010. Available:
http://indonesiadata.co.id/main/index.php/jumlah-penduduk [2013-05-21].
87
Jamil, Sarah. (2008)‖ The miscellaneous desirability of Public-Private
Partnerships and an approach to design an appropriate constitution‖ pp. 1-25,
Freiburg.
Jansen and Denis 1999; McKinsey 2007; NAO 2007
Ministry of Transportation & Ministry of Environment Republic of Indonesia;
Indonesian Country Report on Environmentally Sustainable Transport
Implementation
Newman, W.G. & Kenworthy, J.R. (1995) ―The land use-transport
connection‖. Land Use Policy, Vol. 13, No. 1, pp. 1-22, 1996
Overview of Qualitative Methods (2013). Qualitative Methods. Available:
http://www.nsf.gov/pubs/1997/nsf97153/chap_3.htm [2013-05-21].
Permasalahan BRT Di Lampung (2013). Trans Bandar Lampung. Available:
http://www.instran.org/index.php/in/ruang-berita/depan/25-front-
page/2500-permasalahan-brt-di-bandar-Lampung- [2013-05-21].
Ralph Buehler & John Pucher (2011): Sustainable Transport in Freiburg:
Lessons
from Germany's Environmental Capital, International Journal of Sustainable
Transportation, 5:1, 43-70
Robèrt and Jonsson 2006; Burbank 2008; Leather 2009
Sohail M., Mitlin D., & Maunder D. (2001). Improving Access and Quality of Public
Transport Services Through Partnerships, Loughborough University
Sakai, Hiroki & Shoji, Kenichi. (2010)‖ The effect of governmental subsidies
and the contractual model on the publicly-owned bus sector in Japan‖ vol.29.
pp. 60-71, 2010.
88
Tantangan BRT Lampung (2013). Trans Bandar Lampung. Available:
http://peristiwa.kompasiana.com/Regional/2013/01/10/tantangan-brt-di-
bandar-Lampung-518171.html [2013-05-21].
Taylor & Francis Group; Transport Reviews Vol 25, No 4, 393-414; The
Pillars of Sustainable Urban Transportation; 2005
The Freiburg- Riesefeld Project: Urban expansion and public transport (2013).
Available: http://www.eltis.org [2013-05-21]
The Institution of Engineers Australia; Sustainable Energy Transport
Taskforce Report; 1999
Trans Bandar Lampung (2013). Trans Bandar Lampung. Available:
http://Bandar Lampungkota.go.id/?page_id=481#comment-23718 [2013-01-
09].
Vargo, S.L. & Lusch, R.F. (2004), Evolving to a New Dominant Logic for
Marketing, Journal of Marketing, [Online], 68(1), 1–17.
Vargo, S. L. & Lusch, R. F. (2004). Evolving to a new dominant logic for marketing.
Journal of Marketing, 68 (1) 1-17
Vuchic, Vukan.R (2007), ―Urban Transit Systems and Technology‖, John
Wiley & Sons, Inc.
Yin, R.K. (ed.)(2003). Case Study Research: design and Methods. USA: SAGE
Publications, Inc.