implementation of network performance analysis …
TRANSCRIPT

IMPLEMENTATION OF NETWORK PERFORMANCE ANALYSIS FOR
MANET BY USING NS2
NUR AZIRAH BINTI AHMAD TARMIZI
BACHELOR OF COMPUTER SCIENCE (COMPUTER NETWORK
SECURITY) WITH HONOURS
UNIVERSITI SULTAN ZAINAL ABIDIN
2020

i
DECLARATION
I hereby declare that this report is based on my original work except for quotations
and citations, which have been duly acknowledged. I also declare that it has not been
previously or concurrently submitted for any other degree at University Sultan Zainal
Abidin or other institutions.
Name: NUR AZIRAH BINTI AHMAD TARMIZI
Date: …………………………………….

ii
CONFIRMATION
This is to confirm that:
The research conducted and the writing of this report was under my supervision.
Name: DR. AZNIDA HAYATI BINTI ZAKARIA @ MOHAMAD
Date: ………………………………………

iii
DEDICATION
Praise to Allah, the Most Gracious and the Most Merciful. Alhamdulillah, for
blessing me and giving me the opportunity to go through and complete this final year
project entitled Implementation of Network Performance Analysis for MANET by
Using NS2.
Firstly, my greatest appreciation to my family especially my beloved mother
and father who always gives me advices and for being supportive throughout this
project. Next, I would like to take this opportunity to express my heartiest
appreciation and gratitude to my experienced supervisor, Dr. Aznida Hayati Binti
Zakaria @ Mohamad for the encouragement, guidance, comments, motivation and
also support. Without her continuous support, this project could not be completed as
presented here. Thank you.
In addition, I would like to thank the panels during my final year project, Dr.
Wan Nor Syuhadah Binti Wan Nik, Dr. Nor Aida Binti Mahiddin and Dr Zarina for
all supportive words, guidance, advices as well as fresh ideas during the development
of this project until the end. Thank you.
To Faculty of Informatics and Computing, and all lecturers in this faculty, I
would like to thank everyone for the opportunity for me to be exposed and explore
as a degree student with this project. Last but not least, I would take this chance to
thank my fellow friends for kind and supportive words, and helping hands during the
completion of this project.

iv
ABSTRACT
Network performance analysis are significant in the network security and management.
Network performance analysis refers to the study on the events, taking place through
the network with the aim of maintaining a secure and firm network. Nowadays, the
breakneck growth of network size, resources and distances involved has gradually
increase the complexity of the network traffic and network behavior. The network
management has become entangled with the network congestion and to ensure IP
network smoothly and safely operated. Hence, this study is to propose an
implementation of network performance analysis for MANET by using NS2. Network
simulator tool are used to study the robust nature of network by theoretically replicate
an actual network on the computer to be studied, so as to have the prior warning of
failures or problems and to improve them. This simulator tool collects, analyze, specify
the network protocol and simulating the network environment to be tested. Apart from
that, this tool also conveys easy-to-understand visual analysis by utilize a trace file to
replay the network simulation using animation to get a precise analysis and network
traffic monitoring. Main contributions are to implement the system, which mainly
includes network flow collection, transmission, storage, analysis and the visual display
of the network traffic. Therefore, performance analysis is a great essential to network
security.

v
ABSTRAK
Analisis prestasi rangkaian adalah penting dalam keselamatan rangkaian dan
pengurusan. Analisis prestasi rangkaian merujuk kepada kajian mengenai kejadian yang
berlaku dalam rangkaian bertujuan mengekalkan rangkaian yang selamat dan kukuh.
Pada masa kini, pertumbuhan jaringan yang pesat, sumber dan jarak rangkaian yang
terlibat secara beransur-ansur meningkatkan kerumitan lalu lintas rangkaian dan
tingkah laku rangkaian. Pengurusan rangkaian telah terikat dengan kesesakan rangkaian
dan bagi memastikan rangkaian IP lancar dan selamat dikendalikan. Oleh itu, kajian ini
adalah untuk mencadangkan pelaksanaan analisis prestasi MANET dengan
menggunakan simulator NS2. Alat simulator rangkaian digunakan untuk mengkaji sifat
rangkaian yang teguh dengan secara teori meniru rangkaian sebenar pada komputer
yang akan dikaji, bagi mendapatkan amaran atau kegagalan awal dan memperbaikinya.
Alat simulator ini mengumpul, menganalisis, menentukan protokol rangkaian dan
mensimulasikan persekitaran rangkaian untuk diuji. Selain itu, alat ini juga
menyampaikan analisis visual yang mudah difahami dengan menggunakan fail jejak
untuk memainkan semula simulasi rangkaian menggunakan animasi untuk
mendapatkan analisis yang tepat dan pemantauan trafik rangkaian. Sumbangan utama
adalah untuk melaksanakan sistem ini, yang terutama termasuk pengumpulan aliran,
penghantaran, penyimpanan, analisa dan paparan visual trafik rangkaian. Oleh itu,
analisis prestasi ini adalah penting untuk keselamatan rangkaian.

vi
CONTENTS
DECLARATION ........................................................................................................... i
CONFIRMATION ....................................................................................................... ii
DEDICATION ............................................................................................................. iii
ABSTRACT ................................................................................................................. iv
ABSTRAK ...................................................................................................................... v
CONTENTS ................................................................................................................. vi
LIST OF TABLES ....................................................................................................... x
LIST OF FIGURES .................................................................................................... xi
LIST OF ABBREVIATIONS .................................................................................. xiii
LIST OF APPENDICES .......................................................................................... xiv
CHAPTER 1 ................................................................................................................. 1
INTRODUCTION ........................................................................................................ 1
1.1 Background ......................................................................................................... 1
1.1.1 MANET ................................................................................................... 3
1.1.2 MANET routing protocol ........................................................................ 3
1.2 Problem Statement .............................................................................................. 6
1.3 Objectives ........................................................................................................... 7
1.4 Scopes ................................................................................................................. 7

vii
1.5 Limitation of work .............................................................................................. 7
1.6 Report structure ................................................................................................... 8
CHAPTER 2 ................................................................................................................. 9
LITERATURE REVIEW ........................................................................................... 9
2.1 Introduction ......................................................................................................... 9
2.2 Network ............................................................................................................. 10
2.3 Network performance analysis ......................................................................... 11
2.4 NS2 ................................................................................................................... 12
2.5 Linux Operating System ................................................................................... 13
2.6 Existing System ................................................................................................ 14
2.7 Comparison between routing protocols for MANET ....................................... 19
2.8 Comparison between simulation tools used in MANET .................................. 22
2.9 Overview of the Project and Research .............................................................. 24
2.10 Summary ........................................................................................................... 27
CHAPTER 3 ............................................................................................................... 28
METHODOLOGY .................................................................................................... 28
3.1 Introduction ....................................................................................................... 28
3.2 Framework ........................................................................................................ 29
3.3 Flowchart .......................................................................................................... 31
3.4 Performance metrics ......................................................................................... 33

viii
3.5 Proof of Concept ............................................................................................... 33
3.6 Hardware and Software requirement ................................................................ 35
3.7 Summary ........................................................................................................... 36
CHAPTER 4 ............................................................................................................... 37
IMPLEMENTATION AND RESULT ..................................................................... 37
4.1 Introduction ....................................................................................................... 37
4.2 Configuration and testing .................................................................................. 37
4.2.1 Installation of Ubuntu 16.04 ...................................................................... 37
4.2.2 Installation and configuration of NS2........................................................ 39
4.2.3 Simulation environment............................................................................. 42
4.3 Simulation ......................................................................................................... 44
4.3.1 Tcl script (test.tcl) File ............................................................................... 44
4.3.2 Configuration of NS2 simulation tool. ...................................................... 45
4.3.3 Simulation of DSDV Routing Protocol ..................................................... 48
4.3.4 Simulation of AODV Routing Protocol .................................................... 49
4.3.5 Simulation of DSR Routing Protocol ........................................................ 51
4.4 Result ................................................................................................................ 53
4.4.1 Calculation of performance based on trace file ......................................... 53
4.4.1.1 Average throughput ............................................................................ 53
4.4.1.2 Packet Delivery Ratio ......................................................................... 54
4.4.1.3 Average End-to-end delay .................................................................. 56

ix
4.5 Summary ........................................................................................................... 57
CHAPTER 5 ............................................................................................................... 58
CONCLUSION .......................................................................................................... 58
5.1 Introduction ....................................................................................................... 58
5.2 Project Finalization and Contribution ............................................................... 58
5.3 Constraints ........................................................................................................ 59
5.4 Future work ....................................................................................................... 59
5.5 Summary ........................................................................................................... 60
REFERENCES ........................................................................................................... 61

x
LIST OF TABLES
TABLE TITLE PAGE
2.1 Comparison table of Routing Protocol used in previous studies 19
2.2 Comparison table of Simulation tools implemented in previous
project and research
22
2.3 Comparison table of project and research 24
3.1 List of hardware used 35
3.2 List of software used 35
4.1 Simulation environment and parameter 42

xi
LIST OF FIGURES
FIGURE TITLE PAGE
1.1 Categorization of MANET routing protocol 4
2.1 Network Management Model 12
2.2 Architecture of NS2 13
3.1 Framework of Network performance analysis of small
organization using NS2
29
3.2 Flowchart of network performance analysis 32
3.3 Install NS2 and NAM 33
3.4 Input Tcl script in NS2 34
3.5 Install and run NAM 34
4.1 Ubuntu 16.04 downloaded from website 38
4.2 Installation of Ubuntu 38
4.3 Extraction of ns-allinone-2.35.tar.gz 39
4.4 NS2 successfully installed 40
4.5 Execute command to check the installation of NS2 41
4.6 Execution of Tcl script 45
4.7 Trace file created 45
4.8 NAM file created 46
4.9 Interface of NAM 46
4.10 Network animation 47
4.11 Simulation of DSDV routing protocol for 10 nodes 48
4.12 Simulation of DSDV routing protocol for 25 nodes 48

xii
4.13 Simulation of DSDV routing protocol for 50 nodes 49
4.14 Simulation of AODV routing protocol for 10 nodes 49
4.15 Simulation of AODV routing protocol for 25 nodes 50
4.16 Simulation of AODV routing protocol for 50 nodes 50
4.17 Simulation of DSR routing protocol for 10 nodes 51
4.18 Simulation of DSR routing protocol for 25 nodes 51
4.19 Simulation of DSR routing protocol for 50 nodes 52
4.20 Graph of Average Throughput against number of nodes in
speed 5m/s
54
4.21 Graph of Packet Delivery Ratio against number of nodes in
speed 5m/s
55
4.22 Graph of Average End-to-end Delay against number of nodes
in speed 5m/s
56

xiii
LIST OF ABBREVIATIONS
NS2 Network Simulation Version 2
NAM Network Animation
IPv4 Internet Protocol version 4
IPv6 Internet Protocol version 6
UDP User Datagram Protocol
TCP Transmission Control Protocol
FTP File Transfer Protocol
IEEE Institute of Electrical and Electronics Engineers
QoS Quality of service
CBR Constant bit rate
WSN Wireless Sensor Network
DSDV Destination-Sequenced Distance-Vector routing protocol
MANET Mobile ad hoc network
AODV Ad Hoc On-Demand Distance Vector
PLR Packet Loss Ratio
DSR Dynamic Source Routing

xiv
LIST OF APPENDICES
APPENDIX TITLE PAGE
A Gantt Chart (FYP 1) 65
B Gantt Chart (FYP 2) 66

1
CHAPTER 1
INTRODUCTION
1.1 Background
In this golden era of technology, the Internet has become a major part of life and
people have an increasing reliance on the Internet to carry out task in daily life. The
Internet can be defined as a massive network of networks. Network is a collection of
computers and other devices that can send and receive data from one to another, more
or less in real time (Elliotte Rusty Harold, 2013). Besides, the Internet plays a significant
role as one of the most effective and efficient medium of communication between one
individual to another individual in the world. During this dynamic technological
revolution, the Internet also plays a very vital role as a resource of education and
learning. With that being said, network usage is increasing dynamically from time to
time with an application that user can use for access. A good management of network
are necessary for smooth and efficient use as the future of Network management is
becoming more challenging every second.
Network management and security are among the most significant and exciting
technological innovations that have taken place in the last few decades. While the exact

2
pattern of future network development cannot be predicted, their development will
continue, and they will have a decisive impact on important walks of life such as
business, government, sciences, industry, the arts and entertainment. In particular,
computer networks underpin almost every aspect of corporate communications; it is
important that they are appropriately designed, operate at their optimal efficiency, and
are secure.
Next, network monitoring is an oversight of a computer network using
specialized management software tools to ensure the availability and overall
performance of computers and network services. The tool let admins monitor access,
routers, slow or failing components, firewalls, core switches, client systems, and server
performance among other network data. The International Organization for Standards
(ISO) has created a network management model which is the areas of network
management such as performance management and analysis, fault management,
configuration management, accounting management and security management (James
F. Kurose, Keith W. Ross., 1999).
Therefore, in this project, the implementation of performance analysis for
MANET was studied and focused purposefully narrow for small organization with
application of Network Simulation Version 2 (NS2). According to Michael E. Whitman
in Management of Information Security Third Edition, small organization have 10 to
100 computers and have little in the way of formal policy, planning, or security
measures. NS2 is an open-source event-driven simulator designed specifically for
research in computer communication networks. This tool imitates the working of a
computer network where in simulators, the computer network is typically modeled with
devices and traffic and the performance is analyzed. NS2 come with support for the
protocols in use today, such as IPv4, IPv6, UDP, and TCP. It is an important foundation

3
for network traffic feature summary, network security assessment, anomalous behavior
analysis, intrusion detection and protection.
1.1.1 MANET
Mobile Ad Hoc Network (MANET) can be defined as a collection of multi-hop mobile
devices which are self-organized and self-configured that forms a communication
network. This Ad hoc network consists of host interconnected by routers without a fixed
infrastructure and can be arranged dynamically. Over the past few years, ad hoc has
rapidly grown its interest as the availability of wireless communication devices that
works in industrial, scientific and medical (ISM) bands. Core vision of MANET is to
support robust and efficient operation in wireless networks by joining routing
functionalities at each mobile node.
In MANET, in order to support mobile computing, a mobile host must be able
to communicate with other mobile hosts which may not lie within its radio transmission
range. Hence routing protocols will need to perform four important functions which is
determination of network topology, maintaining network connectivity, transmission
scheduling and channel assignment, and packet routing. Routing protocols in MANETs
were developed based on the design goals of minimal control overhead, minimal
processing overhead, multi hop routing capability, dynamic topology maintenance and
loop prevention (Royer E.M., Toh C, 1999).
1.1.2 MANET routing protocol
In this part, MANET routing protocol such as DSDV, AODV and TORA will be
described briefly to be studied in our simulation. Firstly, these routing protocol can be
categorized into reactive and proactive and hybrid protocol as shown in Figure 1.1.

4
Figure 1.1: Categorization of MANET routing protocol
Reactive also known as on-demand driven reactive protocol. This protocol does not
start routing route on itself, instead it waits until a request was made when a source node
asks for finding a route. As a node wants to send packet to another node, reactive
protocols search for the route in on-demand basis and thus establish a connection for
transmission and receive of the packet. For route searching, this protocol uses flooding
strategy of request message through global broadcast to discover the destination on-
demand.
On the other hand, in proactive routing, each node continuously maintains a single
or multiple routing table that are regularly updated between pair of nodes. Each node
will send a broadcasting message to all the other nodes in the network in order to spot
the changes in their network topology. The route creation and maintenance are
established through some combination of periodic and event-triggered routing updates
derived from distance-vector and link-state method. Both of these routing protocols
have their own pros and contras that can be tested and analyzed from its performance
metrics. In this project, the focus is on DSDV as reactive routing protocol and AODV
and DSR as proactive protocol.

5
i. Destination Sequenced Distance Vector (DSDV)
DSDV is a hop-by-hop distance vector routing protocol requiring each node
to periodically broadcast routing updates based on the idea of classical
Bellman-Ford Routing algorithm (Perkins C.E. and Bhagwat P, 1994). Each
node maintains a routing table listing the “next hop” for each reachable
destination, number of hops to reach destination and the sequence number
assigned by destination node. The sequence number is used to distinguish
stale routes from new ones and thus avoid loop formation. The stations
periodically transmit their routing tables to their immediate neighbors. A
station also transmits its routing table if a significant change has occurred
in its table from the last update sent. So, the update is both time-driven and
event-driven. The routing table updates can be sent in two ways: a “full
dump” or an “incremental” update.
ii. Ad-hoc On-demand Distance Vector (AODV)
AODV is a combination of on-demand and distance vector i.e. hop- to-hop
routing methodology (Perkins C.E. and Royer E.M, 1998). When a node
needs to know a route to a specific destination it creates a ROUTE
REQUEST which is forwarded by intermediate nodes which also create a
reverse route for itself for destination. When the request reaches a node with
route to destination it creates again a REPLY which contains the number of
hops that are require to reach the destination. All nodes that participate in
forwarding this reply to the source node create a forward route to
destination. This route created from each node from source to destination is
a hop-by-hop state and not the entire route as in source routing.

6
iii. Dynamic Source Routing (DSR)
DSR comes under the reactive routing protocol category same as AODV,
as it has the capability to discover the route from source to destination only
when it is required. This routing protocol uses a process called “Route
Discovery Mechanism” which capable of discovering the route for data
packets from source node to destination nodes by using intermediate nodes.
In proactive routing protocols such as DSDV, no separate table is
maintained, requiring each node to periodically broadcast routing updates.
However, in DSR, this process of separately sending a “Re-Request” packet
from destination to source makes it easier for the sender to send the data
packets on fixed path rather than sending it on multiple paths to check for
total distance.
1.2 Problem Statement
Problem statement of this project are:
i. The breakneck growth of network size, resources and distances involved has
gradually increase the complexity of the network traffic and network behavior.
ii. The network management become entangled with the network congestion and
to ensure IP network smoothly and safely operated.
iii. All communication network is exposed to challenges such as natural disaster,
attack and human mistake.
iv. Not all small organization has a professional and experts to provide this ability.

7
1.3 Objectives
There are three main objectives to develop this project include:
i. To study the simulation model to monitor the network performance for wireless
network in small organization.
ii. To design the simulation model that can analyze the behavior of existing and
proposed for wireless network in small organization under different scenario.
iii. To implement the simulation model that can act as framework to simulate
challenges such as natural disaster, attack and human mistake and the
corresponding effects of the network under the induced challenge.
1.4 Scopes
This propose study involve two parties which are administrator and system.
1.4.1 Scope of user
Administrator can monitor the traffic of network through performance
management in term of the capacity, traffic, throughput and response time by
using the simulation.
1.4.2 Scope of system
Configuration of NS2 tool can manage the performance of network by
quantify, measure, report, analyze and control performance.
1.5 Limitation of work
There is some limitation in this project which is:
i. This simulation work on a limited operating system such as Linux, UNIX and a
few older versions of Windows (XP, Vista). In this project, Ubuntu OS is used
with Linux-based.

8
ii. This simulation dependant to internet connection to be monitor in real-time
mode only.
1.6 Report structure
This thesis consists of five chapters. The first chapter focuses on the project background,
problem statements, objectives, scopes of project and limitation of work. Chapter two
is a review of all related study regarding to this project. In chapter three, the
methodology was discussed including the methods and techniques used for the
development of this project. In this chapter, the expected results also were discussed
through the data model and design. In the fourth chapter, implementation and testing
processes that has been run in this project were explained in detail. In the last chapter,
conclusion and final results are presented.

9
CHAPTER 2
LITERATURE REVIEW
2.1 Introduction
Before the implementation of the proposed project, a sufficient research on the
published literature related to this topic has been done. In this chapter, the
summarization of literature reviews related to this project was discussed. The literature
review is a text of a trusted paper such as journal, article and book that include current
knowledge about theoretical and methodological contribution. Main purpose of the
literature review is to identify research methods and strategies that should be apply in
this project. The information from these previous studies and research will be discussed
in this chapter. Therefore, the literature review is carried out to be used as references
and as an inspiration in developing the proposed simulation.
There are two main fields that have been investigated in this part which are
useful for the implementation of the proposed project. The main areas are to study the
Network and Network Performance Analysis. The purpose of the research will be
defined and the concepts which have been helpful in understanding technologies used
in development of proposed application, have been collected.

10
In order to find a problem and disconnections in the network for any
organizations that may disturbing the performance of network, an appropriate
administration and management will be performed. This administration of network will
capture the whole performance of the network and maintain any possible connections.
If any failure happens in the network, an urgent monitoring and maintaining will be
needed.
2.2 Network
A network is the interconnection of a set of devices capable of communication
(Behrouz A. Forouzan, 2012). Based on this definition from Data Communication and
Networking Fifth Edition book, the computers, servers, mainframes, network devices,
peripherals, or other devices connected to one another to permit the transmission of data
and information. The evolution of network through the years have been changed from
a simple connection between a few computers to a connection of computers in many
networks. An amazing example of a network is the Internet, which connects millions of
individuals all over the world. This dynamic change of complex network demanding
for having a rich of performance analysis and management. The connections can be
established through wired and wireless. Wired connection requires a copper wire or
fibre optic cable as a transmission medium to allow data sending and receiving. For
wireless transmission, data signal travels through electromagnetic waves. In this project,
a wireless network was used as a traffic scenario to be administer and analyse.
The IEEE 802.11 standards specify two operating modes which is infrastructure
mode and ad hoc mode. Infrastructure mode is used to connect computers with wireless
network adapters, also known as wireless clients, to an existing wired network with the
help from wireless router or access point. Ad hoc mode is used to connect wireless
clients directly together, without the need for a wireless router or access point. An ad

11
hoc network consists of up to 9 wireless clients, which send their data directly to each
other.
2.3 Network performance analysis
In this part, some previous proposed model for performance analysis will be
discussed. Network performance can be defined as the overall quality of service (QoS)
provided by a network while the network performance analysis is a complete set of
processes and tools that can be used to quantitatively and qualitatively analyse network
performance. Basically, it is the use of network data to unpack performance trends. By
conducting a performance analysis, we can understand why the network is performing
the way it is. The network performance can be analysed by measuring a few parameters
such as bandwidth usage, throughput, latency and jitter.
Bandwidth can be defined as arrange of frequencies that can be transmitted by
a particular system or medium (Jorge L. Olenewa,2012). Throughput is the rate of data
that can be transferred from one place to another in a period of time. Next, latency is
the delay between the sender and the receiver decoding it, this is mainly a function of
the signals travel time, and processing time at any nodes the information traverses while
jitter is variation in packet delay at the receiving end of the information. Each of these
types of parameters behaves differently on different conditions of the network. Hence
the performance analysis is a must task to know its behaviour and work in that
environment accordingly. The factors like node mobility, network size, control
overhead and traffic intensity along with inherent characteristics of networks may result
in unpredictable variations in the overall network performance.
In the previous project, Morris Sloman have proposed a new model for network
monitoring which modifies the event management. In the mentioned model, event and

12
status have been produced for the administrator to be able to analyse the network
performance. Figure 2.1, presents the design of the proposed network.
Figure 2.1: Network Management Model
2.4 NS2
NS-2 is an open source network simulator which runs on different platforms that are
UNIX (or Linux), Windows, and Mac systems. NS-2 is widely exploited to simulate the
various network components and protocols such as routing, TCP, UDP, FTP and traffic
sources like CBR over wired and wireless networks. Principally, NS2 provides a way
to specify such network protocols, and also simulate their corresponding behaviours.
Owing to its flexibility and modular nature, the NS-2 has gained profound admiration
in the networking research community areas. The most recent version of NS-2 is NS-
2.35.
NS-2 simulator facilitates integration of the different types of technologies and
tools. NS-2 is implemented using both the oTCL (object Tool Command Language) and
C++ languages. It exploits TCL/C++ interface, called as TclCl to allow interaction
between the oTCL and C++. By Employing NS-2 simulator the AWK script can be

13
exploited to process the trace files. The Ns-2 simulator incorporates diverse tools such
as Network Animator (NAM) and X-Graph. The architecture of NS2 are as shown in
Figure 2.2.
Figure 2.2: Architecture of NS2
2.5 Linux Operating System
Linux is an open source operating system that is distributed by Red Hat
Enterprise under GNU General Public Licence. This operating system gives freedom to
user to run the program for any purpose, to study how the program works, and change
it to make it do what you wish. It also allows the redistribution of copies or distribute
copies of own modified versions to others. The advantage is security characteristic of
Linux much stronger than Windows (Nandhini, U., Nivetha, B. and Shobana, D., 2016).
Moreover, this operating system is more powerful and unique compared with
other operating system such as Windows and Macintosh (Hussain A. Alhassan and Dr
Christian Bach, 2014). Linux is user-friendly when it comes to application codes writing

14
through an accessing network which make it suit this project. NS2 are the most
compatible in Ubuntu Linux operating system. Ubuntu consist of two different versions
which is the server and desktop. Desktop version are mostly used in this project since it
has better performer for network performance analysis.
2.6 Existing System
In this part of the chapter, the previously researches to the proposed network
performance analysis was studied and will be discussed. For every mentioned paper,
some explanations along with its advantages and disadvantages will be discussed in
order to providing some familiarities and understanding regarding these previous
studies.
2.6.1 Design and Simulation of Wireless Sensor Network in NS2
This paper presented a study of how to design and implement Wireless Sensor Network
(WSN) in NS2. WSN consists of spatially distributed autonomous sensors to monitor
physical or environmental conditions such as temperature, sound, vibration, pressure
and humidity. The capabilities of sensor nodes in WSN are so wide and can be different
as the simple sensor nodes may monitor a single physical phenomenon while more
complicated devices might combine many different sensing techniques. The diversity
of application in WSN makes it important for the simulation to study the dynamic nature
of this network. NS2 were used in this research paper by implementing the sensing and
tracing techniques on 20 nodes with DSDV routing protocol. Sensing technique was
used to gather information about a physical object or process, including the occurrence
of events. Tracing is done to capture all packets that are receive, dropped and sent in
the network. The advantage of this study is the nature and variety behaviour of WSN
can be study and analysed as the calculation of average end-to-end delay and total

15
energy consumed was recorded. However, this study is complicated to any novice and
students since the information recorded was not represented with any visual
representation. Thus, it is hard for nonprofessional to understand and conduct this
project.
2.6.2 Analysis of Node Velocity Effects in MANET Routing Protocols using
Network Simulator (NS3)
In this paper, Lakshman Naik L., R. U. Khan and R. B. Mishra proposed a study to
make an analysis of MANET routing protocols in the aspect of node velocity effects by
using Network Simulator version 3 (NS3). Based on their research, in ad-hoc networks,
routing protocols suggest communication between routers and prompt them to select
routes between a source and a destination. For choosing a router, it is performed by the
routing algorithms. In this paper, the researchers used network simulator-3 to simulate
comparative performance analysis of three MANET routing protocols. The routing
protocols tested are AODV (Ad-hoc On-Demand Distance Vector Routing), DSDV
(Destination Sequenced Distance Vector Routing) and OLSR (Optimized Link State
Routing). In this study, they analysed performance comparisons of these routing
protocols using different performance metrics such as throughput, packet delivery ratio,
end to end delay and packet loss. However, performance of the routing protocols
depends on various factors like, size of the network, no. of source connections,
transmission power, node speed and Wi-Fi rate. Thus, the researcher stated that for
additional experiments, it could be carried out by increasing higher node speeds along
with increasing of related factors.

16
2.6.3 To Analyse & Compare AODV, DSR and DSDV Routing Protocol for
MANET
The main purpose of this study is to carry out the performance analysis to make a
comparative evaluation for AODV, DSR and DSDV routing protocol for MANET
environment. The common measures were used for the comparison of performance for
these protocols such as the throughput, delay and packet loss. The advantage of this
studies is the evaluation of performance and behaviour of each of these routing
protocols was conducted with NS2 simulation tool which can visually presents the
overall performance. This simulation study helps to understand the behaviour of AODV,
DSR and DSDV routing protocols setup over NS2 simulator using application traffic
CBR analysing their actions with respect to the parameters of quality of services.
2.6.4 Application and Performance Analysis of DSDV Routing Protocol in Ad-
Hoc Wireless Sensor Network with Help of NS2 Knowledge
The purpose of this paper is to evaluate performance of DSDV routing protocol in
wireless sensor network (WSN) scales regarding the End-to-End delay and throughput
PDR with mobility factor. Routing protocols are a critical aspect to performance in
mobile wireless networks and play crucial role in determining network performance in
terms of packet delivery fraction, end-to-end delay and packet loss. Destination-
sequenced distance vector (DSDV) protocol is a proactive protocol depending n routing
tables which are maintained at each node. The routing protocol should detect and
maintain optimal route(s) between source and destination nodes. In this paper, they
presented the application of DSDV in WSN as extend to their previous study to the
design and implementation the details of the DSDV routing protocol in MANET using
the NS2 network simulator.

17
2.6.5 Performance Analysis of Wired, Wireless and Optical Network using NS2
In this paper, wired, wireless and optical networks have been analysed and implemented
using network simulator tool NS2. A systematic simulation-based performance analysis
of wired, wireless and optical networks using distance vector routing protocol has been
carried out. Analysis of the performance of these networks on the basis of three metrics
which are the Packet delivery ratio, end to end delay, throughput using NS2 simulation
has been undertaken.
2.6.6 Simulation Analysis of Routing Protocols in Hybrid wireless network
In this paper, a simulation Analysis of Routing Protocols in Hybrid wireless network
was carried out. A wireless hybrid network which are the integration of wireless ad hoc
network and wireless infrastructure network is recognized as superior option for next
generation wireless networks. Such network focuses to support of continuous
transmission with strong Quality of Service (QoS). In hybrid networks, the way to
guarantee quality of service (QoS) remains a hot problem, where it is observed that due
to the direct adoption of QoS based reservation resource routing for MANET, hybrid
networks inherit problems of resource reservation and invalid racing conditions. The
article presents the working of two Ad-Hoc routing protocols (DSDV and AODV+) in
hybrid systems in relation with different network complexities. It is observed that both
protocols performed indistinguishably to the extent of the throughput. For jitter, PLR
and PDR, the AODV+ performed superior to DSDV; except for the intricacy situation
of system, while DSDV performed ineffectively.

18
2.6.7 Performance analysis and comparison of the DSDV, AODV and OLSR
routing protocols under VANETs
In this paper, the researcher investigate on how three state-of-the-art Mobile Ad-Hoc
Network (MANET) routing protocols which is Ad-hoc On-Demand Distance Vector
(AODV), Optimized Link State Routing (OLSR) and Destination-Sequenced Distance-
Vector (DSDV) behave over the IEEE 802.11p/WAVE stack, which has recently been
specified for Vehicular Ad-hoc Networks (VANETs). This research was based on
Network Simulation version 3 (NS3) and BonnMotion simulations to evaluate Packet
Delivery Rate, Goodput, Routing Overhead and End-to-End Delay for different
trajectories, average speeds, and network densities. The advantage of this paper is that
the researcher focusing on assessing and readapting the service routing protocols used
in MANETs (Mobile Ad-Hoc Networks) for VANETs, showing reasonable
performance under certain network density and nodes speed conditions.
2.6.8 MANET Routing Protocols Evaluation: AODV, DSR and DSDV
Perspective
This paper presents the performance comparison between Dynamic Source Routing
(DSR), Ad hoc on demand distance Vector Routing (AODV) as reactive routing
protocols and Destination Sequenced Distance Vector (DSDV) as a proactive routing
protocol to precisely determine which protocol is more effective. Network Simulator
(NS) version 2.35 was used to simulate and evaluate the performance of these protocols
in terms of the packet delivery ratio, average throughput, average end-to-end delay, and
packet loss ratio with respect to the variable number of nodes.

19
2.7 Comparison between routing protocols for MANET
Table 2.1: Comparison table of routing protocols used in previous studies
Parameters TORA
(Temporally
Ordered
Routing
Algorithms)
AODV (Ad-hoc
on-demand
distance vector)
DSR (Dynamic Source
Routing)
DSDV
(Destination
Sequence
Distance
Vector)
DYMO
(Dynamic
MANET On-
Demand)
CSGR (Cluster
Switch
Gateway
Routing)
Routing
approaches
Reactive Reactive Reactive Proactive Reactive Proactive
Route
selection/
Protocol
Type
Link Reversal Shortest and
updated path
Shortest and updated path Link State Unicast multipath
routes
Shortest path

20
Routing table Directed
Acyclic Graph
(DAG)
Maintain a node
table which is
the next hop
routing
information for
the destination
nodes is stored
The route is created only when
it is required and the nodes
utilize the route cache
information efficiently to
reduce the overhead and
collision.
Node maintain
a complete
address to
each
destination
Route address,
Route Prefix,
Route Sequence
Number, Route
NextHop
Interface/
Address, Route
Forwarding,
Route Broken
Maintain a
routing table that
used to
determine the
next hop to
reach the
destination
Route Single Multiple Multiple Single Multipath Simple and
multiple route
Routing
structure
Flat Flat Flat Flat Flat Hierarchical

21
Route
maintenance
Link reversal
and Route
repair
Nodes maintain
Sequence
Number and
Broadcast ID
Process
1. Hop by hop
acknowledgement
2. End to end
acknowledgement
Nodes
maintain a
routing table
Performs route
discovery for the
destination when
receive RERR
message
Nodes maintain
a routing table
which is used to
determine the
next hop to
reach the
destinations
Limitations Overhead in
large network
consume a
large
bandwidth
Multiple Route
Reply packets in
response to a
single Route
Request packet
can lead to eavy
control overhead
Scalability problems due to the
source routing and flooding
High
overhead, does
not support
multipath
routing
Increasing the
size of the routing
packets
Nodes will
spending a lot of
time converging
to a cluster head
if the cluster
head is changed
frequently

22
2.8 Comparison between simulation tools used in MANET
Table 2.2: Comparison table of simulation tools implemented in previous project and research
Simulator Ns2 Ns3 OMNeT++ OPNET
Type Open Source Open Source Open Source Commercial Network
Simulator
Language C++, OTCl C++, Python C++ C(C++)
Environment
• Discrete event
simulator that provides
substantial support
for simulation of TCP,
routing and multicast
protocol over wired
and wireless networks.
• Discrete- event
network
simulator
• Support
parallel
simulations
• Eclipse based simulation
IDE used for designing,
running and evaluating
simulations.
• Can be used for modeling
of multiprocessors,
distributed hardware
• Support the modeling
of communication
networks and
distributed systems
• Both behavior and
performance of
modeled systems can

23
systems and performance
evaluation of complex
software systems.
be analyzed by
performing discrete
event simulations
Platforms Windows, Linux Windows, Linux, Mac
OS
Windows, Unix-based, Mac OS Hewlett-Packard, Solaris
Network
Support Type
Wired Network, Wireless Ad-
Hoc mode, Wireless Sensor
Network
Wired Network,
Wireless Network,
Wireless Sensor
Network
Wired Network, Wireless
Managed mode
Simulate entire heterogeneous
network with various protocols

24
2.9 Overview of the Project and Research
Table 2.3: Comparison table of project and research
Author/Year Project Name Simulation
tools
Routing
protocol
Disadvantage of studies
Genita G. and Biswaraj S.
(2015)
Design and Simulation of
Wireless Sensor Network in
NS2
NS2 DSDV The calculation of average energy consumption
and average end-to-end delay was not
represented with any visual representation.
Thus, it is hard for nonprofessional to
understand and conduct this project.
Lakshman Naik L., R. U.
Khan and R. B. Mishra
(2016)
Analysis of Node Velocity
Effects in MANET Routing
Protocols using Network
Simulator (NS3)
NS3 AODV,
DSDV and
OLSR
The experiments were not carried out by
increasing higher node speeds along with
increasing of associated factors.

25
Sonia and Joy K. S.
(2016)
To Analyse & Compare AODV,
DSR and DSDV Routing
Protocol for MANET
NS2 AODV,
DSR and
DSDV
The experiments were carried out specifically
for 23 nodes in MANET only. The simulation
might not be suitable for scalable network.
Mohammed Zaid Ghawy
and Dr. Maher Ali Al –
Sanabani
(2017)
Application and Performance
Analysis of DSDV Routing
Protocol in Ad-Hoc Wireless
Sensor Network with Help of
NS2 Knowledge
NS2 DSDV Many packets dropped occur because IEEE
802.15.4 not enabled large packets transmission
as the routing protocol DSDV cause full dump
packets to routes update,
Jyoti and Himanshi Saini
(2017)
Performance Analysis of Wired,
Wireless and Optical Network
using NS2
NS2 DSDV Parameter tested and compared for each
network is limited and need to be done for a
large range of applications in different
scenarios.
K. H. Mohammadani, S.
Abbasi, N. A. Memon,, Z.
Simulation Analysis of Routing
Protocols in Hybrid wireless
network
NS2 DSDV,
AODV+
There is no selection of homogenous routing
protocols and heterogeneous routing protocols
for hybrid network.

26
A. Bhutto, I. R. Memon
(2018)
Eduardo E. A. S.,
Guilherme dos S., Mario
A and Max M. S.
(2018)
Performance analysis and
comparison of the DSDV,
AODV and OLSR routing
protocols under VANETs
NS3 and
BonnMotion
DSDV,
AODV and
OLSR
The analyse of performance of these protocols
was not tested for more realistic vehicular
communication scenarios with traffic lights,
stop signs, double tracks, roundabouts, speed
bumps, and divided highways.
Fahad Taha AL-Dhief,
Naseer Sabri, M.S. Salim,
S. Fouad, S. A. Aljunid
(2018)
MANET Routing Protocols
Evaluation: AODV, DSR and
DSDV Perspective
NS2.35 AODV,
DSR and
DSDV
The performance analysis tested is not suitable
for hybrid wireless network.

27
2.10 Summary
This chapter provides an overview related to the concept of the existing system.
Literature review helps in determining whether the technology has been studied before
or not. The various approach and techniques used helps in generate a better of project
research in the future. The research in this literature review is done to avoid identical
production of idea.

28
CHAPTER 3
METHODOLOGY
3.1 Introduction
This chapter reports the approach or model development and application of a
comprehensive framework taken in the development of project, application or
implementation of the study. Methodology is a systematic way to solve the research
problem by applying technique, algorithm or method. This chapter contains specific
procedures or techniques used to identify, select, process, and analyze information
about network performance analysis in small organization by using NS2. The selection
of the most suitable as suitable methodology for methodology is chaotic enough because
the project might not complete on the right schedule or the project might completely
fail because the developer might be lost guidance in order to complete the project
development. All the phases involved during this project will be detailed.
According to the project, methodology shown in this chapter are the flowchart
and framework that was build referring to the objectives stated in 1.3. Firstly, to study
the simulation to monitor the network performance for DSDV, AODV and DSR routing
protocol in small organization. Secondly, to design the simulation that can analyze the

29
behavior of existing and proposed network for DSDV, AODV and DSR routing
protocol in small organization under different scenario. Lastly, to implement the
simulation that can act as framework to simulate challenges such as natural disaster,
attack and human mistake and the corresponding effects of the network under the
induced challenge. This project will be focused on network performance analysis.
3.2 Framework
This part will be discussed and focused on simulation of framework. Simulation is the
operation of modelling a process or system from the real-world situation over a period
of time. Thus, in this project, network for small organization was simulate and can be
shown in Figure 3.1.
Figure 3.1: Framework of Network performance analysis of small organization using
NS2
Model a network
traffic of small
organization
Develop network
simulation model
using NS2
Performance
analysis and
evaluate the
simulation
Satisfy? Communicate
Result and
discussion
Network performance analysis of small organization using NS2
No
Yes

30
Figure 3.1 shows the framework of this project. Firstly, a network for network traffic
that suit for small organization are modelled and was scripted with Tcl script. Next, a
network simulation model was develop using NS2. The simulation was tested and
evaluate to see if the user is satisfied enough with the performance analyse from the
simulation. If the user is satisfied, a result and discussion can be done. If not, a
communication session needed to make an improvement in the network model. The
simulation can be done again until the user is satisfied with the performance analyse in
this project.

31
3.3 Flowchart
Flowchart is a type of diagram that represents a workflow or process. In this part,
flowchart can also be defined as a diagrammatic representation of an algorithm, a step-
by-step approach in network performance analysis in small organization by using NS2.
Figure 3.1 shows the flowchart for network performance analysis in small
organization using NS2. This simulation involved user as the client and the NS2 server
itself. In this project, NS2 and NAM was installed in Ubuntu Linux operating system
before start the simulation. Firstly, after the installation complete, Tcl script was
uploaded to be read and simulate in NS2. The Tcl script uploaded was edited according
to the requirement of the network to be tested. Secondly, the Tcl script will be executed
and network was scanned in NS2. Thirdly, a trace file will be automatically saved as
the output after being simulated in NS2. Next, the NAM will present a visual simulation
of traffic in the network tested. After that, the trace file produced was analyse in an
analyser such as Perl. Then, the analysed result was output to be studied and a graph
was plotted from the result. Lastly, the evaluation of result from simulation was done
by the user and to decide if the user is satisfied with the current network performance
analysis. If the user is satisfied, the final report can be written. If not, the work will be
repeat by input the modified Tcl script for improvement of network performance until
the user is satisfied.

32
Figure 3.2: Flowchart of network performance analysis

33
3.4 Performance metrics
The performance metrics used in this proposed project are as follows:
1. Average Throughput (TP): It is the measure of total information conveyed in a unit
of time (Nayak and Sinha, 2016).
𝑇𝑃 = 𝑁𝑢𝑚𝑏𝑒𝑟 𝑜𝑓 𝑏𝑦𝑡𝑒𝑠 𝑟𝑒𝑐𝑒𝑖𝑣𝑒𝑑 ∗ 8 ∗ 𝑆𝑖𝑚𝑢𝑙𝑎𝑡𝑖𝑜𝑛 𝑡𝑖𝑚𝑒 ∗ 1000𝑘𝑏𝑝𝑠
2. Packet delivery ratio (PDR): It is the percentage of application layer packets
successfully received to the aggregate sent (Chaubey et al. 2015).
𝑃𝐷𝑅 (%) = ∑ 𝑁𝑢𝑚𝑏𝑒𝑟 𝑜𝑓 𝑝𝑎𝑐𝑘𝑒𝑡 𝑟𝑒𝑐𝑒𝑖𝑣𝑒𝑑
∑ 𝑁𝑢𝑚𝑏𝑒𝑟 𝑜𝑓 𝑝𝑎𝑐𝑘𝑒𝑡 𝑠𝑒𝑛𝑡∗ 100
3. End-to-end delay (e2e delay)
𝑒2𝑒 𝑑𝑒𝑙𝑎𝑦 = ∑(𝑝𝑎𝑐𝑘𝑒𝑡 𝑎𝑟𝑟𝑖𝑣𝑒𝑑 𝑡𝑖𝑚𝑒 − 𝑝𝑎𝑐𝑘𝑒𝑡 𝑠𝑒𝑛𝑑 𝑡𝑖𝑚𝑒)
∑ 𝑁𝑢𝑚𝑏𝑒𝑟 𝑜𝑓 𝑐𝑜𝑛𝑛𝑒𝑐𝑡𝑖𝑜𝑛
3.5 Proof of Concept
Figure 3.3: Install NS2 and NAM

34
Figure 3.4: Input Tcl script in NS2
Figure 3.5: Install and run NAM

35
3.6 Hardware and Software requirement
Hardware and software are important things to ensure the successful of this project.
Thus, these hardware and software has its own role and function in the completion of
each steps. The details on hardware and software are as shown in Table 3.1 and 3.2
below.
Hardware Description
Laptop Processor: Intel® Core™ i5-6200U CPU @ 2.30
GHz
RAM: 8 GB
Operating system: Ubuntu 16.04
Table 3.1: List of hardware used
Software Description
Ubuntu 16.04 Mainly used operating system and act as server
Windows 2010 Used operating system for documentation of report
NS2 Simulation used to simulate network tested
NAM An animation tool which is employed to view the network
simulation trace data. It supports topology layout, level
packet animation, and various data inspection tools.
awk Analyser of trace file produced by NS2
XGraph, MATLAB Plot graph for better understanding and pattern observation
in performance analysis
Microsoft Office 2016 Platform for documentation and presentation slides
Google Chrome and
Mozilla Firefox
Browser to run system and do research and related studies
about project
Table 3.2: List of software used

36
3.7 Summary
In this chapter, the methodology of this project is explained. The flow of this project is
being shown in the framework and detailed view of how the whole system works is
display on the data model. Therefore, the requirements of the project are being shown
in perfect order and can carry out the minimum error.

37
CHAPTER 4
IMPLEMENTATION AND RESULT
4.1 Introduction
Implementation and result are one of the most important phases to simulate the
configuration of network in this project. This phase must be done before a project is
fully utilized. In this chapter, the step by step configurations and installation will be
covered thoroughly to accomplish the objective of this project. The operating system
which is Ubuntu 16.04 are specifically used in this implementation and testing phased.
Besides, this chapter will discuss and shows the result generated by NS2.
4.2 Configuration and testing
4.2.1 Installation of Ubuntu 16.04
The operating system that is best for NS2 is Ubuntu 16.04 compared to
Windows 10. Thus, the steps below show the installation of Ubuntu 16.04.

38
Figure 4.1 shows the first step which is to download Ubuntu 16.04.6 LTS 64-bit
PC (AMD64) desktop image version from the link. Ubuntu 16.04 is the most compatible
version for NS2.
Link: https://releases.ubuntu.com/16.04/
Figure 4.1: Ubuntu 16.04 downloaded from website
Figure 4.2 shows the second step which is to install Ubuntu 16.04 LTS to work
dually boot with Windows 10. Set up server name and other information
Figure 4.2: Installation of Ubuntu 16.04

39
4.2.2 Installation and configuration of NS2
In this section, the installation and configuration of NS2 in Ubuntu 16.04. the
first step is to download NS2.35 by downloading folder ns-allinone-2.35 from the link
Link: https://sourceforge.net/projects/nsnam/files/allinone/ns-allinone-2.35/ns-
allinone-2.35.tar.gz/download
Figure 4.3 shows the second step which is the process of how the extraction of
the downloaded file ns-allinone-2.35.tar.gz in terminal to desktop
Figure 4.3: Extraction of ns-allinone-2.35.tar.gz
Thirdly, download essential packages for NS2 by using these commands in terminal
window
i. sudo apt-get update
ii. sudo apt-get dist-upgrade
iii. sudo apt-get update
iv. sudo apt-get gcc
v. sudo apt-get install build-essential autoconf automake
vi. sudo apt-get install tcl8.5-dev
vii. sudo apt-get install perl xgraph libxt-dev libx11-dev libxmu-dev

40
Next, enter directory of the extracted file previously and install NS2 with command
below
i. cd Desktop/ns-allinone-2.35
ii. ./install
The following lines will show that the NS2 are successfully installed as shown in Figure
4.4 below.
Figure 4.4: NS2 successfully installed
After the installation are completed, type the following command in terminal to
open a text editor.
gedit ~/.bashrc

41
Then save and close the text editor with the following command.
source ~/.bashrc
Next step is to close the previous terminal window and start a new one. Change directory
to ns2.35 and validate ns2.35 by executing the following command.
i. cd ns-2.35
ii. ./validate
The eighth step is check if the installation is successful and NS2 is working right by
using the following command as shown in Figure 4.5. If it shows % after the execution,
thus the installation is successful.
Figure 4.5: Execute command to check the installation of NS2

42
4.2.3 Simulation environment
In order to evaluate the three MANET routing protocol, we can compare the
quantitative performance metrics while conducting these experimental evaluations.
These performance metrics must measure the fitness and performance of the routing
protocol. Some of the metrics are included and explained in section 3.4 in Chapter 3. In
this project, NS2 is used as the simulation tool to compare these mobile adhoc routing
protocols. The parameters are utilized for simulation scenario and can be summarized
as shown in Table 4.1 below.
Parameter Value
Topology Random
Number of nodes 10,25,50
PAN coordinator location Random
Area of simulation 500m x 500m wide
Simulation time 300s
Speed 5ms
Pause time 0s
Mobility Model RWP
Traffic type Constant Bit Rate (CBR)
Connection rate 0.05 to 4 packets per second
Routing protocol DSDV, AODV, DSR
Radio-propagation model TwoRayGround
Interface queue type DropTail/PriQueue
Maximum packet in queue 150
Network interface type Phy/WirelessPhy/802_15_4

43
MAC type Mac/802_15_4
Antenna type OmniAntenna
Bandwidth 10 Mbps
Table 4.1 Simulation environment and parameter
Table 4.1 shows the parameter of the simulation carried out in this project. In
this simulation, nodes are divided into three types which is 10, 25 and 50 (human,
vehicle and helicopter respectively) and each type of these nodes have different speed.
These heterogenous nodes move randomly on 500m x 500m area of field. The reason
for using an area of 500m x 500m is because the area simulation the actual size of real
MANET environment. For the mobility model set in this simulation, the Random
Waypoint Mobility Model (RWP) is used. It is a popular model for simulations, because
of its varied availability and simplicity. According to this model, a node stays at one
location or point for certain periods (pause time). This pause time is induced whenever
the node changes either speed or direction.

44
4.3 Simulation
4.3.1 Tcl script (test.tcl) File
test.tcl is a Tcl script used to execute the simulation in NS2 and this file is the
most crucial in the configuration of MANET routing protocol in NS2. This test.tcl file
represents the main function of the simulations that consist of channel type used, radio-
propagation model and network interface used, MAC type, interface queue type,
simulation time, declaration of number of nodes, speed of mobility and set the area of
the simulation area.
Algorithm 1: Simulation Environment
The declaration can be changed according to simulation environment. As an
example, the number of nodes can be adjusted to 10, 25 and 50 nodes as mentioned in
the simulation parameter in section 4.2.3 previously. The simulation time limit and area
are fixed during the whole simulation.

45
4.3.2 Configuration of NS2 simulation tool.
The step below shows the configuration of NS2 and MANET routing protocol
in NS2.
Figure 4.6 shows the first step which is to execute the Tcl script test.tcl as
mentioned in previous section by using the following command
ns test.tcl
Figure 4.6: Execution of Tcl script
Figure 4.7 and Figure 4.8 shows the trace file and NAM file created respectively.
After the Tcl script is executed in NS2, trace file (test.tr) and NAM file (test.nam) will
be created in the same directory.
Figure 4.7: Trace file created

46
Figure 4.8: NAM file created
Thirdly, simulate the network by using NAM. Change directory to NAM file
and type the following command to run .nam file created before.
i. cd nam-1.15
ii. ./nam /home/azirah/Download/test
The following interface windows will pop up and show the simulation of
MANET routing protocols in NS2 with the help of NAM. Figure 4.9 shows the
interface of NAM after the created NAM file is executed. At the same time, the
animation of network as shown in Figure 4.10 will be produced.
Figure 4.9: Interface of NAM

47
Figure 4.10: Network animation

48
4.3.3 Simulation of DSDV Routing Protocol
Figure 4.11: Simulation of DSDV routing protocol for 10 nodes
Figure 4.12: Simulation of DSDV routing protocol for 25 nodes

49
Figure 4.13: Simulation of DSDV routing protocol for 50 nodes
4.3.4 Simulation of AODV Routing Protocol
Figure 4.14: Simulation of AODV routing protocol for 10 nodes

50
Figure 4.15: Simulation of AODV routing protocol for 25 nodes
Figure 4.16: Simulation of AODV routing protocol for 50 nodes

51
4.3.5 Simulation of DSR Routing Protocol
Figure 4.17: Simulation of DSR routing protocol for 10 nodes
Figure 4.18: Simulation of DSR routing protocol for 25 nodes

52
Figure 4.19: Simulation of DSR routing protocol for 50 nodes

53
4.4 Result
The suitability of the MANET routing protocol is decided on the basis of the
performance parameters. In this project, three parameters are used for analyzing the
performance of MANET routing protocol; Packet Delivery Ratio, Average End to End
Delay and Throughput. For evaluated the results, there is a formula that gives the
specific answer as mentioned in Chapter 3.
4.4.1 Calculation of performance based on trace file
The main goal of this study is to evaluate the performance and behavior of each
routing protocol. After the execution of Tcl file in NS2, the trace file and NAM file are
produced for each test. By using the produced trace file, analyze it with AWK file to
calculate the parameters such as average throughput, Packet delivery ratio and average
end-to- end delay. Thus, the data calculated can be used to create a graph to give better
understanding of this project.
4.4.1.1 Average throughput
It is defined as the total number of the packet delivered over the total simulation
time. In this project, the throughput is compared to the number of nodes in speed 5 m/s.
Figure 4.20 shows the graph of Average Throughput against number of nodes in speed
5 m/s. After the data is calculated and recorded, the graph is plotted.

54
Figure 4.20: Graph of Average Throughput against number of nodes in speed 5 m/s
According to the simulation results obtained, Figure 4.20 shows the
performance results of the routing protocol in the average throughput. The performance
of DSDV is the highest in term of average throughput followed by AODV and DSR.
From Figure 4.20, we can see that the average throughput increases from the 10 nodes
to 25 nodes, however the performance for DSDV and DSR routing protocol decreases
as the nodes increase to 50. In network with high density, the performance is low
because many links break due to mobility, jeopardizing the maintenance of routing
table. As for AODV routing protocol, no significance difference recorded between the
performance as the number of nodes increases.
4.4.1.2 Packet Delivery Ratio
Packet delivery ratio is defined as the ratio of data packets received by the
destinations to those generated by the sources. In this project, the ratio is compared to
the number of nodes 10, 25 and 50 with speed 5 m/s.
635
640
645
650
655
660
665
670
675
680
685
690
10 25 50
Ave
rage
Th
rou
ghp
ut
(kb
ps)
Number of nodes
DSDV AODV DSR

55
Figure 4.21: Graph of Packet Delivery Ratio against number of nodes in speed 5 m/s
According to the simulation results obtained, Figure 4.20 shows the
performance results of the routing protocol in the packet delivery ratio where AODV
recorded much better performance than DSDV and DSR. It can be seen that AODV
routing protocol has received higher amount of data compared to DSDV and DSR as
the number of nodes increases from 10, 25 and 50. DSR obtained a slightly lower
percentage in Packet Delivery Ratio than AODV when the number of nodes increases.
However, DSDV has obtained the lowest percentage of Packet Delivery Ratio in speed
5 m/s. Thus, in term of percentage of Packet Delivery Ratio, AODV has obtained the
best performance.
95
95.5
96
96.5
97
97.5
98
98.5
99
99.5
100
10 25 50
Pac
ket
Del
iver
y R
atio
(%
)
Number of nodes
DSDV AODV DSR

56
4.4.1.3 Average End-to-end delay
Average End to End Delay is the average time taken by a data packet to reach
from source node to a destination node. It is the ratio of total delay to the number of
packets received.
Figure 4.22: Graph of Average End-to-end Delay against number of nodes in speed 5
m/s
According to the simulation results obtained, Figure 4.20 shows the
performance results of the routing protocol in the average end-to-end delay. The lower
the average end-to-end delay, the better the performance of routing protocol as the
number of node increase. The performance of DSDV is the highest after DSR in node
10 and 25. However, as the node is increase to 50, the average end-to-end delay has
increase rapidly from 267.5 m/s to 276.615 m/s for DSDV due to link breaks which
may increase the average end-to-end delay for the packets to transmit from source to
destination. In this simulation, DSR shows an opposite performance compared to
DSDV as it has lower average end-to-end delay compared to DSDV. However, as the
260
262
264
266
268
270
272
274
276
278
10 25 50
Ave
rage
En
d-t
o-e
nd
Del
ay (
m/s
)
Number of nodes
DSDV AODV DSR

57
node increased to 50, the average end-to-end delay for DSR decreased. AODV shows
the best performance as it has obtained the lowest average end-to-end delay compared
to the other two routing protocol.
4.5 Summary
In this chapter, implementation and testing of the project were explained. The
implementation phase involved the simulation installation before testing of the network
simulator tool. Other than that, in testing phase, the three routing protocols which is
DSDV, AODV and DSR were experimented and the results were recorded. Both phased
has been done successfully and the results are also shown briefly.

58
CHAPTER 5
CONCLUSION
5.1 Introduction
This chapter discussed about the project constraints, challenges while handling
the project and conclusion of this whole project. Moreover, improvements for future
work are proposed and summarized in this part to provide a smoother and more efficient
use as the future of Network management is becoming more challenging every second.
In project constraint, the challenges and limitation of project will be studied.
5.2 Project Finalization and Contribution
Mobile ad hoc network (MANET) provide a rapid deployment because it does
not depend on a fixed infrastructure (infrastructureless). Thus, the simulation of
MANET is important and helpful in giving better understanding on how it is operated
in real world. MANET also known to be advantageous to users that are residing in a
restricted situation and disaster area where applying wired network would be ineffective
and impractical. In this project, the implementation of performance analysis by using
network simulation NS2 is proposed to cover for the impracticality and to improve a
better quality of service (QoS) in routing.

59
Therefore, routing protocol of MANET which is DSDV, AODV and DSR was
proposed to analyse its performance in simulation rather than in actual world. The
results for each of the simulation are recorded and shown in previous chapter. The
analysis of performance is evaluated with average throughput, packet delivery ratio and
average end-to-end delay of MANET routing protocols mentioned by varying its speed
and number of nodes on NS2.
5.3 Constraints
Throughout the whole development of this project, there are several challenges
and limitation occurred before the whole project are completed and successful. In the
early stage of deployment of NS2, the problem faced is unstable connection of internet
which has delayed the installation process. This installation process must be done
perfectly so that the simulation will run smoothly without any error or lagging. Other
than that, another difficulty faced was adjusting and running the NS2 in a few versions
of Ubuntu operating system. Variety of Ubuntu operating system versions were
installed to match with NS2 file, and discovered that only Ubuntu 16.04 LTS can
support NS2.35 with stable and run the simulation without any problem. However, after
a few testing and experiment, all these problems can be resolve.
5.4 Future work
There are several improvements that can be made for the future work which can
be benefit for better efficiency and performance for this project. Firstly, the simulation
can be done by covering larger scale and area. By changing to larger scale and area, the
number of network loads can be increase in MANET simulation environment.
Secondly, this simulation should not only restrict for MANET only, but it must also be
used in VANET, wireless mesh network and other network for improving the

60
performance to provide better quality of service (QoS). Lastly, this simulation can have
various mobility model that the nodes can move with different speed and pause time in
the simulation area in the future work.
5.5 Summary
In this chapter, the contributions of the project and the challenges faces
throughout the entire development process is concluded. Moreover, the future work
pinpointed in this chapter could possibly be helpful for the users in the future. Besides,
the simulation of MANET environment by using NS2 is one of the network simulators
used by the researcher that could give better understanding and concept on how
MANET operated in real world. The implementation of MANET in real world requires
high cost, manpower and takes longer time to be developed. Therefore, this simulation
project is employed to cope with these problems operatively.

61
REFERENCES
1. Elliotte R. H., (2013), Java Network Programming Fourth Edition. pp.26.
2. James F. K. and Keith W. R., (1999), Computer Networking Sixth Edition. pp. 52.
3. Behrouz A. F., (2012), Data Communication and Networking Fifth Edition. pp. 7-
17.
4. Royer E.M. and Toh C., (1999), A review of current routing protocols for adhoc
mobile wireless networks., IEEE personal communications, pp. 46–56.
5. Perkins C.E and Bhagwat P., (1994), Highly dynamic Destination-Sequenced
Distance-Vector Routing (DSDV) for Mobile Computers, SIGCOMM ACM, pp.
234-245.
6. Perkins C.E. and Royer E.M, (1998) Ad-hoc, “On-demand Distance Vector
Routing, draft-ietf-manet-aodv-02.txt.
7. Jorge L. O., (2012). Guide to Wireless Communication Third Edition. pp. 18-56.
8. Whitman, M. E. and Mattord, H. J. (2010). Management of Information Security
Third Edition. pp. 171.
9. Sloman, M. (ed.), (1994), Networks and Distributed Systems Management,
Addison Wesley Longman Publishing Co., Inc., Boston, MA, USA.
10. Nandhini, U., Nivetha, B. and Shobana, D. (2016). An Analysis of Linux Operating
System. International Journal of Trend in Research and Development, Volume 3(1),
ISSN:2394-9333.
11. Hussain A. A. and Dr. Christian Bach. (2014). Operating System and Decision
Making. ASEE 2014 Zone I Conference. pp. 80-85.
12. Genita G. and Biswaraj Sen, (2015), “Design and Simulation of Wireless Sensor
Network in NS2”, International Journal of Computer Applications (0975 – 8887),
Volume 113 No. 16.

62
13. Naik, L., U., R., & B., R. (2016). Analysis of Node Velocity Effects in MANET
Routing Protocols using Network Simulator (NS3). International Journal of
Computer Applications, 144(4), 1–5. https://doi.org/10.5120/ijca2016910225
14. Singh, J. (2016). To Analyze & Compare AODV, DSR and DSDV Routing
Protocol for MANET. 5(12), 3414–3417.
15. Mohammed, B., Ghawy, Z., Ali, M., & Sanabani, A. L. (2017). Routing Protocol
in Ad-Hoc Wireless Sensor. 17(1).
16. Pandey, S., & Tyagi, V. (2013). Performance Analysis of Wired and Wireless
Network using NS2 Simulator. International Journal of Computer Applications
(IJCA), 72(21), 38–44. https://doi.org/10.5120/12669-9404
17. Analysis, S., Protocols, R., & Science, E. (2018). S u r j s s. 50(001), 165–170.
18. Nayak, P. and P. Sinha, (2016). “Analysis of Random Way Point and Random
Walk Mobility Model for Reactive Routing Protocols for MANET Using Netsim
Simulator.” Proceedings - AIMS 2015, 3rd International Conference on Artificial
Intelligence, Modelling and Simulation 427–32.
19. Marcotte, R. J. and E. Olson, (2016). “Adaptive Forward Error Correction with
Adjustable-Latency QoS for Robotic Networks.” Proceedings - IEEE
International Conference on Robotics and Automation 2016–June:5283–88.
20. Kumar, S., G. S. Agrawal, and S. K. Sharma, (2017). “Impact of Mobility on
MANETs Routing Protocols Using Group Mobility Model.” International Journal
of Wireless and Microwave Technologies 7(2):1–12. Retrieved (http://www.mecs-
press.org/ijwmt/ijwmt-v7-n2/v7n2-1.html).
21. Chaubey, N., A. Aggarwal, S. Gandhi, and K. A. Jani. (2015). “Performance
Analysis of TSDRP and AODV Routing Protocol under Black Hole Attacks in

63
MANETs by Varying Network Size.” International Conference on Advanced
Computing and Communication Technologies, ACCT 2015:320–24.

64
APPENDIX

65
A) Gantt Chart (FYP 1)
Activity/Week 1 2 3 4 5 6 7 8 9 10 11 12 13 14 15
1. FYP briefing by KPP
2. Discussion and selection of the proposal topic
3. Project title proposal
4. Details on project background, problem statement, objectives,
scope and limitation
5. Detail on Literature Review
6. Proposal progress presentation and panel’s evaluation
7. Correction on proposal
8. Framework discussion
9. Configuration of NS2
10. Draft proposal submission
11. Correction on proposal
12. Discussion and preparation of project presentation
13. Conference of project presentation
14. Final presentation and panel’s evaluation
15. Final report submission and supervisor’s evaluation

66
B) Gantt Chart (FYP 2)
Activity/Week 1 2 3 4 5 6 7 8 9 10 11 12 13 14 15
1. Project meeting with supervisor
2. Project development
3. Proposal progress presentation & evaluation
4. Project development (continued)
5. Project testing
6. FYP Format Writing Workshop
7. Draft proposal submission
8. Correction on proposal
9. Discussion and preparation of project presentation
10. Conference of project presentation
11. Final presentation and panel’s evaluation
12. Final report submission and supervisor’s evaluation

67
Program code 1: AODV10nodes.tcl
set val(chan) Channel/WirelessChannel ;#Channel Type
set val(prop) Propagation/TwoRayGround ;# radio-propagation model
set val(netif) Phy/WirelessPhy ;# network interface type
set val(mac) Mac/802_11 ;# MAC type
set val(ifq) Queue/DropTail/PriQueue ;# interface queue type
set val(ll) LL ;# link layer type
set val(ant) Antenna/OmniAntenna ;# antenna model
set val(ifqlen) 50 ;# max packet in ifq
set val(nn) 10 ;# number of mobilenodes
set val(rp) AODV ;# routing protocol
set val(x) 500
set val(y) 500
set val(cbr-start) 5.0 ;# time of starting traffic emissions
# Initialize Global Variables
set ns_ [new Simulator]
set tracefd [open aodv50nodes.tr w]
$ns_ trace-all $tracefd
set namtrace [open aodv50nodes.nam w]
$ns_ namtrace-all-wireless $namtrace $val(x) $val(y)
# set up topography object
set topo [new Topography]
$topo load_flatgrid $val(x) $val(y)
# Create God
create-god $val(nn)
# New API to config node:
# 1. Create channel (or multiple-channels);
# 2. Specify channel in node-config (instead of channelType);
# 3. Create nodes for simulations.
# Create channel #1 and #2
set chan_1_ [new $val(chan)]
set chan_2_ [new $val(chan)]

68
# Create node(0) "attached" to channel #1
# configure node, please note the change below.
$ns_ node-config -adhocRouting $val(rp) \
-llType $val(ll) \
-macType $val(mac) \
-ifqType $val(ifq) \
-ifqLen $val(ifqlen) \
-antType $val(ant) \
-propType $val(prop) \
-phyType $val(netif) \
-topoInstance $topo \
-agentTrace ON \
-routerTrace ON \
-macTrace ON \
-movementTrace ON \
-channel $chan_1_
set node_(0) [$ns_ node]
set node_(1) [$ns_ node]
set node_(2) [$ns_ node]
# node_(1) can also be created with the same configuration, or with a different
# channel specified.
# Uncomment below two lines will create node_(1) with a different channel.
$ns_ node-config \
-channel $chan_2_
set node_(3) [$ns_ node]
set node_(4) [$ns_ node]
set node_(5) [$ns_ node]
set node_(6) [$ns_ node]
set node_(7) [$ns_ node]
set node_(8) [$ns_ node]
set node_(9) [$ns_ node]
$node_(0) random-motion 0
$node_(1) random-motion 0

69
$node_(2) random-motion 0
$node_(3) random-motion 0
$node_(4) random-motion 0
$node_(5) random-motion 0
$node_(6) random-motion 0
$node_(7) random-motion 0
$node_(8) random-motion 0
$node_(9) random-motion 0
for {set i 0} {$i < $val(nn)} {incr i} {
$ns_ initial_node_pos $node_($i) 20
}
#
# Provide initial (X,Y, for now Z=0) co-ordinates for mobilenodes
#
$node_(0) set X_ 10.0
$node_(0) set Y_ 20.0
$node_(0) set Z_ 0.0
$node_(1) set X_ 10.0
$node_(1) set Y_ 100.0
$node_(1) set Z_ 0.0
$node_(2) set X_ 25.0
$node_(2) set Y_ 180.0
$node_(2) set Z_ 0.0
$node_(3) set X_ 45.0
$node_(3) set Y_ 290.0
$node_(3) set Z_ 0.0
$node_(4) set X_ 90.0
$node_(4) set Y_ 20.0
$node_(4) set Z_ 0.0
$node_(5) set X_ 170.0
$node_(5) set Y_ 50.0
$node_(5) set Z_ 0.0

70
$node_(6) set X_ 100.0
$node_(6) set Y_ 140.0
$node_(6) set Z_ 0.0
$node_(7) set X_ 150.0
$node_(7) set Y_ 200.0
$node_(7) set Z_ 0.0
$node_(8) set X_ 230.0
$node_(8) set Y_ 90.0
$node_(8) set Z_ 0.0
$node_(9) set X_ 100.0
$node_(9) set Y_ 280.0
$node_(9) set Z_ 0.0
# Now produce some simple node movements
# Node_(1) starts to move towards node_(0)
#
$ns_ at 0.1 "$node_(1) setdest 100.0 100.0 25.0"
$ns_ at 0.1 "$node_(2) setdest 180.0 230.0 40.0"
$ns_ at 0.1 "$node_(3) setdest 120.0 200.0 68.0"
$ns_ at 0.1 "$node_(4) setdest 300.0 130.0 5.0"
$ns_ at 0.1 "$node_(5) setdest 190.0 170.0 15.0"
$ns_ at 0.1 "$node_(6) setdest 240.0 240.0 15.0"
$ns_ at 0.1 "$node_(7) setdest 120.0 160.0 75.0"
$ns_ at 0.1 "$node_(8) setdest 320.0 40.0 75.0"
$ns_ at 0.1 "$node_(9) setdest 140.0 340.0 75.0"
# Node_() then starts to move away from node_(0)
$ns_ at 20.0 "$node_(5) setdest 100.0 200.0 30.0"
$ns_ at 20.0 "$node_(6) setdest 200.0 120.0 75.0"
# Setup traffic flow between nodes
# TCP connections between node_(0) and node_(1)
set tcp [new Agent/TCP]

71
#$tcp set class_ 2
set sink [new Agent/TCPSink]
$ns_ attach-agent $node_(0) $tcp
$ns_ attach-agent $node_(1) $sink
$ns_ connect $tcp $sink
set ftp [new Application/FTP]
$ftp attach-agent $tcp
$ns_ at 3.0 "$ftp start"
set udp [new Agent/UDP]
set null [new Agent/Null]
$ns_ attach-agent $node_(0) $udp
$ns_ attach-agent $node_(2) $null
$ns_ connect $udp $null
set cbr [new Application/Traffic/CBR]
$cbr set packetSize_ 512
$cbr set rate_ 20Kb
$cbr attach-agent $udp
$ns_ at $val(cbr-start) "$cbr start"
#
# Tell nodes when the simulation ends
#
for {set i 0} {$i < $val(nn) } {incr i} {
$ns_ at 30.0 "$node_($i) reset";
}
$ns_ at 30.0 "stop"
$ns_ at 30.01 "puts \"NS EXITING...\" ; $ns_ halt"
proc stop {} {
global ns_ tracefd
$ns_ flush-trace
close $tracefd
}
puts "Starting Simulation..."
$ns_ run

72
Program code 2: throughput.awk
BEGIN {
recvdSize = 0
startTime = 400
stopTime = 0
}
{
event = $1
time = $2
node_id = $3
pkt_size = $8
level = $4
# Store start time
if ((level == "AGT" || level == "IFQ") && (event == "s") && pkt_size >= 512) {
if (time < startTime) {
startTime = time
}
}
# Update total received packets' size and store packets arrival time
if ((level == "AGT" || level == "IFQ") && (event == "r") && pkt_size >= 512) {
if (time > stopTime) {
stopTime = time
}
# Rip off the header
#hdr_size = pkt_size % 512
#pkt_size -= hdr_size
# Store received packet's size
recvdSize += pkt_size
}
}
END {
printf("Average Throughput[kbps] = %.2f\t\t StartTime=%.2f\tStopTime=%.2f\n",(recvdSize/(stopTime-startTime))*(8/1000),startTime,stopTime)
}
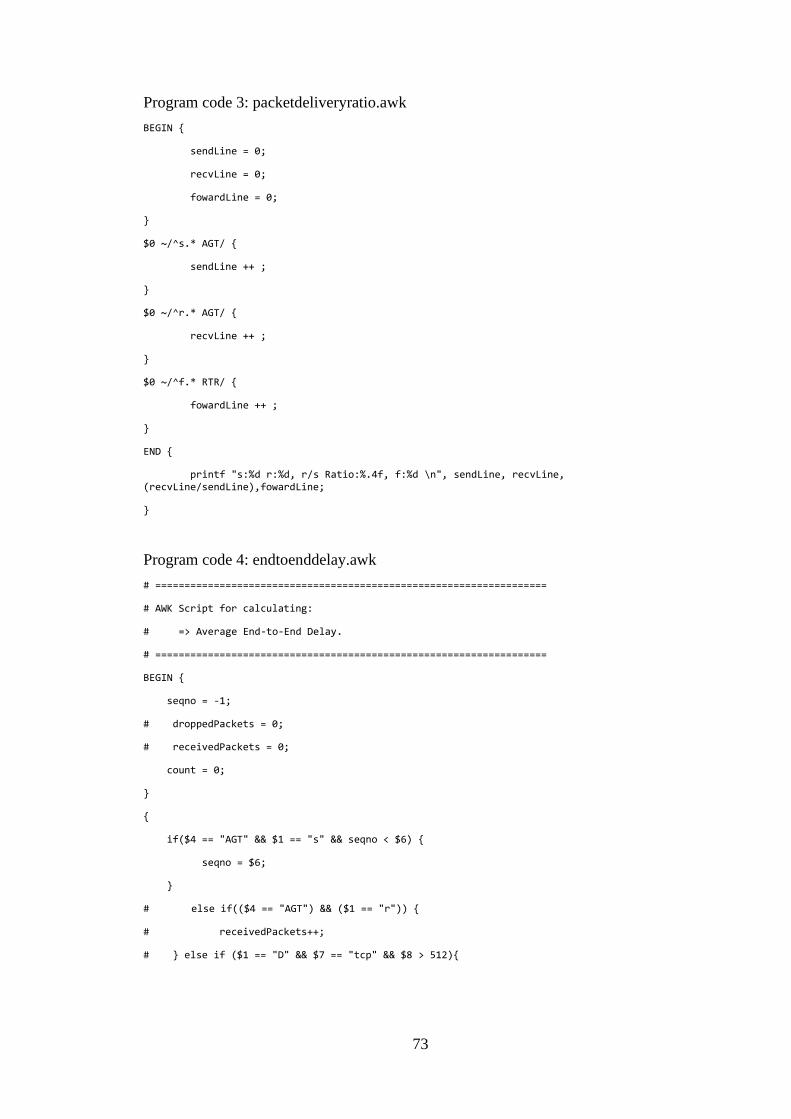
73
Program code 3: packetdeliveryratio.awk
BEGIN {
sendLine = 0;
recvLine = 0;
fowardLine = 0;
}
$0 ~/^s.* AGT/ {
sendLine ++ ;
}
$0 ~/^r.* AGT/ {
recvLine ++ ;
}
$0 ~/^f.* RTR/ {
fowardLine ++ ;
}
END {
printf "s:%d r:%d, r/s Ratio:%.4f, f:%d \n", sendLine, recvLine, (recvLine/sendLine),fowardLine;
}
Program code 4: endtoenddelay.awk
# ===================================================================
# AWK Script for calculating:
# => Average End-to-End Delay.
# ===================================================================
BEGIN {
seqno = -1;
# droppedPackets = 0;
# receivedPackets = 0;
count = 0;
}
{
if($4 == "AGT" && $1 == "s" && seqno < $6) {
seqno = $6;
}
# else if(($4 == "AGT") && ($1 == "r")) {
# receivedPackets++;
# } else if ($1 == "D" && $7 == "tcp" && $8 > 512){

74
# droppedPackets++;
# }
#end-to-end delay
if($4 == "AGT" && $1 == "s") {
start_time[$6] = $2;
} else if(($7 == "cbr") && ($1 == "r")) {
end_time[$6] = $2;
} else if($1 == "D" && $7 == "cbr") {
end_time[$6] = -1;
}
}
END {
for(i=0; i<=seqno; i++) {
if(end_time[i] > 0) {
delay[i] = end_time[i] - start_time[i];
count++;
}
else
{
delay[i] = -1;
}
}
for(i=0; i<=seqno; i++) {
if(delay[i] > 0) {
n_to_n_delay = n_to_n_delay + delay[i];
}
}
n_to_n_delay = n_to_n_delay/count;
print "\n";
# print "GeneratedPackets = " seqno+1;
# print "ReceivedPackets = " receivedPackets;
# print "Packet Delivery Ratio = " receivedPackets/(seqno+1)*100
#"%";
# print "Total Dropped Packets = " droppedPackets;
print "Average End-to-End Delay = " n_to_n_delay * 1000 " ms";
print "\n";
}