implementation of enterprise risk management as a tool for
TRANSCRIPT
Implementation of Enterprise Risk Management as a Tool for Improving Corporate
Governance within the Public Sector.
A Research Report
presented to the
In partial fulfilment of the
requirements for the
MASTERS DEGREE IN BUSINESS LEADERSHIP,
UNIVERSITY OF SOUTH AFRICA
by
M Truter
30 November 2007
brought to you by COREView metadata, citation and similar papers at core.ac.uk
provided by Unisa Institutional Repository
ii
ABSTRACT
This purpose of the research is to investigate the relationship between the implementation
of an Enterprise Risk Management (ERM) and corporate governance within the public
sector. Furthermore, the study focused on the role of internal audit in ERM implementation
as well as the relationship between ERM and risk communication. Questionnaires designed
to collect data were e-mailed to risk managers; internal auditors and senior managers.
The survey confirmed a positive association between the implementation of an ERM
framework and corporate governance as well as risk communication. The majority of
respondents further confirmed that corporate governance concerns were the main driving
force behind the implementation followed by the impact of HIV/AIDS on their respective
organisations. Of those surveyed 38% confirmed that their ERM process is embedded and
they have also created the position of chief risk officer or similar.
However, it is important to note that the role of internal audit in ERM implementation is not
fully integrated.
iii
DECLARATION
I hereby declare that this research report is my own work, except to the extent indicated in
the text and reference. It is being submitted in partial fulfilment for the degree of Master of
Business Leadership in the University of South Africa, Midrand
It has never been submitted before for any degree or examination in any other University.
………………………………………………..
Mark Truter
STUDENT NUMBER: 7079 256 9
………………….day of …………………………….2007

iv
DEDICATION
I would like to thank my wife, Lioba, and daughter, Nicola for the support, encouragement,
and sacrifice throughout my studies.
I would also like to thank my family members, and friends who encouraged me during this
time.
Finally to God be the glory….
v
ACKNOWLEDGEMENTS
I wish to express my sincere gratitude to the following:
• Professor Peet Venter for his support, guidance, and advice in preparing this report;
• Leonard Radzuma, Jo Pretorius and Adriaan Bekker for their assistance in reviewing
my dissertation;
• Xolisa Vitsha for his guidance in structuring my research methodology, editorial
suggestions and statistical analysis;
• Bernice McNeil for your professional editorial services;
• Robert Crawford, who assisted with reviewing my research questionnaire and
statistical analysis; and
• all research participants who made it possible for this research to be carried out.
vi
TABLE OF CONTENTS
ABSTRACT ........................................................................................................... ii
DECLARATION .................................................................................................... iii
DEDICATION ....................................................................................................... iv
ACKNOWLEDGEMENTS ..................................................................................... v
TABLE OF CONTENTS ....................................................................................... vi
1. CHAPTER 1- ORIENTATION ............................................................................... 1
1.1. INTRODUCTION ................................................................................................... 1
1.2. AUDIENCE ........................................................................................................... 1
1.3. STATEMENT OF THE PROBLEM ........................................................................ 2
1.4. RESEARCH OBJECTIVES ................................................................................... 5
1.5. CONTRIBUTION AND IMPORTANCE OF THE STUDY ...................................... 6
1.6. CLARIFICATION OF CONCEPTS ........................................................................ 6
1.7. DELIMITATION OF THE STUDY .......................................................................... 7
1.8. PLAN OF THE STUDY ......................................................................................... 8
2. CHAPTER 2: THEORETICAL FOUNDATION OF THE STUDY ......................... 10
2.1. INTRODUCTION ................................................................................................. 10
2.2. THE SOUTH AFRICAN CONSTITUTION ........................................................... 10
2.3. PFMA and MFMA ................................................................................................ 12
2.4. INTERNAL AUDIT ............................................................................................... 13
2.5. AUDIT COMMITTEE ........................................................................................... 14
2.6. KING II ................................................................................................................ 14
2.6.1. Discipline ............................................................................................................. 15
2.6.2. Transparency ...................................................................................................... 15
2.6.3. Independence ..................................................................................................... 15
2.6.4. Accountability ...................................................................................................... 15
2.6.5. Responsibility ...................................................................................................... 16
2.6.6. Fairness .............................................................................................................. 16
2.6.7. Social Responsibility ........................................................................................... 16
2.7. RISK MANAGEMENT ......................................................................................... 16
2.8. CONCLUSION .................................................................................................... 17
3. CHAPTER 3: LITERATURE REVIEW ................................................................. 18
3.1. INTRODUCTION ................................................................................................. 18
3.2. THE BOARD ....................................................................................................... 20
vii
3.3. THE ROLE OF MANAGEMENT AND THE CEO ................................................ 22
3.3.1. The Internal Environment .................................................................................... 25
3.3.2. Objective Setting/ Establish Goals and Context .................................................. 25
3.3.3. Event identification .............................................................................................. 26
3.3.4. Risk Assessments ............................................................................................... 27
3.3.5. Risk Responses- Determine the treatments for the risks .................................... 27
3.3.6. Control Activities ................................................................................................. 28
3.3.7. Information and communication .......................................................................... 28
3.3.8. Monitor and report on the effectiveness of risk treatments .................................. 29
3.4. THE ROLE OF THE INTERNAL AUDIT IN ERM ................................................ 30
3.5. RISK MANAGEMENT ......................................................................................... 33
3.6. THE ROLE OF THE CHIEF RISK OFFICER ...................................................... 35
3.7. CONCLUSION .................................................................................................... 35
4. CHAPTER 4: RESEARCH METHODOLOGY ..................................................... 37
4.1. INTRODUCTION ................................................................................................. 37
4.2. TARGET POPULATION ..................................................................................... 38
4.3. DATA COLLECTION ........................................................................................... 38
4.4. DATA ANALYSIS ................................................................................................ 38
4.5. THE INSTRUMENT OF MEASUREMENT .......................................................... 39
4.6. RESEARCH ETHICS .......................................................................................... 39
4.7. RESEARCH PROPOSITIONS ............................................................................ 40
4.8. ANALYSIS .......................................................................................................... 40
4.8.1. Descriptive Statistics ........................................................................................... 40
4.8.2. Inferential Statistics ............................................................................................. 41
4.8.3. Factor Analysis.................................................................................................... 41
4.8.4. Reliability Analysis .............................................................................................. 41
4.8.5. The Krusal– Wallis (K-W) Test ............................................................................ 41
4.8.6. The Mann-Whitney U Test .................................................................................. 41
4.9. REPORTING RESULTS ..................................................................................... 42
4.10. CONCLUSION .................................................................................................... 42
5. CHAPTER 5: RESEARCH RESULTS ................................................................. 43
5.1. INTRODUCTION ................................................................................................. 43
5.2. THE SAMPLE ..................................................................................................... 43
5.3. DESCRIPTIVE STATISTICS .............................................................................. 43
5.4. FACTOR AND RELIABILITY ANALYSIS ............................................................ 55
5.4.1. Factor Analysis.................................................................................................... 55
viii
5.4.2. Reliability Analysis .............................................................................................. 56
5.5. Variable Analysis ................................................................................................. 58
5.5.1. Krusal-Wallis Test ............................................................................................... 59
5.6. Research Proposition .......................................................................................... 65
5.6.1. Research Proposition 1 ....................................................................................... 65
5.6.2. Research Proposition 2 ....................................................................................... 66
5.6.3. Research Proposition 3 ....................................................................................... 67
5.7. CONCLUSION .................................................................................................... 68
6. CHAPTER 6: DISCUSSION, CONCLUSIONS AND RECOMMENDATIONS ..... 69
6.1. INTRODUCTION ................................................................................................. 69
6.2. TERMS OF REFERENCE .................................................................................. 69
6.3. FINDINGS ........................................................................................................... 70
6.4. LIMITATIONS OF THE STUDY .......................................................................... 72
6.5. RECOMMENDATIONS FOR FURTHER RESEARCH ....................................... 73
6.6. CONCLUSIONS .................................................................................................. 74
7. LIST OF REFERENCES ..................................................................................... 75
ANNEXURE 1 ..................................................................................................... 78
ANNEXURE 2 – RESEARCH QUESTIONNAIRE ............................................... 80
ANNEXURE 3 – RESEARCH RESULTS ............................................................ 87
ix
Table 1 - Corruption Barometer 4
Table 2- Risk Taxonomy 33
Table 3 - Number of years experience in your current designation 43
Table 4 - Total number of employees within your organisation 44
Table 5 - Number of employees who makeup the Risk Management Department 44
Table 6 - Status of ERM implementation 45
Table 8 - Creation of Chief Risk Officer Position or similar 46
Table 9 - Reporting line of the Chief Risk Officer 47
Table 10 - Reasons for implementing an ERM framework – Select topthree reasons .........................
Table 11 - Greatest risk facing your organisation? 49
Table 12 - Implementation of an ERM framework 50
Table 13 – The Role of the Board is to… 51
Table 14 - The role of Senior Management is to… 52
Table 15 - The role of internal audit in Enterprise Risk Management is to… 53
Table 16 - The implementation of an ERM framework has…. 55
Table 17 - The Role of the Board is to… 55
Table 18 - The role of Senior Management is to… 56
Table 19 - Internal Audit’s role in Enterprise Risk Management is to… 56
Table 20 - The implementation of an ERM framework has…. 57
Table 21 - The Role of the Board is to… 57
Table 22 - The role of Senior Management is to… 57
Table 23 - Internal Audit’s role in Enterprise Risk Management is to… 57
Table 24 - Kruskal-Wallis Test - Number of years experience... 59
Table 25 - Kruskal-Wallis Test - What is the total number of employees.... 61
Table 26 - : Mann-Whitney Test - How many employees in the Risk Dept.? 62
Table 27 - Mann-Whitney Test : ERM methodology implemented? 63
Table 28 - Proposition 1 – To investigate the relationship between ERM and Corporate
Governance 65
Table 29 - To investigate the relationship between ERM and Communication about risk
management throughout the organisation. 66
Table 30 - To investigate the relationship between the implementation of ERM and the Role
of the auditor 67
x
Figure 1 - Generation plant capacity and maximum demand 2
Figure 2 - An ERM and Governance Framwork 19
Figure 3 - COSO ERM Model 19
Figure 4 - Internal Audit role in ERM 19
Figure 5 - AS/NZS 4360:2004 Risk Management Model 19
Figure 6 - COSO ERM Model 23
Figure 7 - Risk Management Process 24
Figure 8 - FERMA Risk Management Process 24
Figure 9 - IIA ERM Model 31
MBL REP-P M Truter (7079 2569) Page 1 of 104
1. CHAPTER 1- ORIENTATION
1.1. INTRODUCTION
Over the past few years there have been numerous large-scale corporate failures
such as Enron and WorldCom. This has resulted in unprecedented corporate control
such as King II (in the text this was referred to as King II), the Public Finance
Management Act No. 1 of 1999 (PFMA) and the Municipal Finance Management Act
NO 56, 2003 (MFMA). These events have left boards and management teams
wondering what risk their organisations may face. The South African public sector
has not been exempt from numerous failures in both municipalities and government
departments, which have placed additional pressure on these departments to deliver
on their mandates of job creation, HIV and Aids treatment, economic growth and
safety and security. The importance of strong corporate governance within local,
provincial and public entities has been increasingly acknowledged.
Boards are custodians of corporate governance in organizations. They have overall
responsibility for ensuring that risks are effectively managed. In practice, the board
will delegate the operation of the risk management framework to the management
team. It is therefore imperative that the management team implement a strategy to
manage risk throughout the organisation. Enterprise Risk Management (ERM) is a
management tool to coordinate risk management throughout an organisation.
The primary purpose of this research is to investigate the relationship between the
implementation of an ERM strategy and the impact on corporate governance, and
the role of internal audit in such an implementation. The study will focus on local and
provincial, government, as well as public entities located within the Gauteng
province.
1.2. AUDIENCE
The research report will be of interest to the following group of readers:
MBL REP-P M Truter (7079 2569) Page 2 of 104
• Chief Risk Officers, risk managers, internal auditors and corporate
governance officials;
• senior and junior management within public sector and local and provincial
government;
• the public at large who are interested in ERM, corporate governance and
Internal Audit;
• academics, scholars or students who are interested in, or wish to conduct
research on ERM and corporate governance within local government and
public entities; and
• stakeholders who are in direct or indirect contact with public servants.
1.3. STATEMENT OF THE PROBLEM
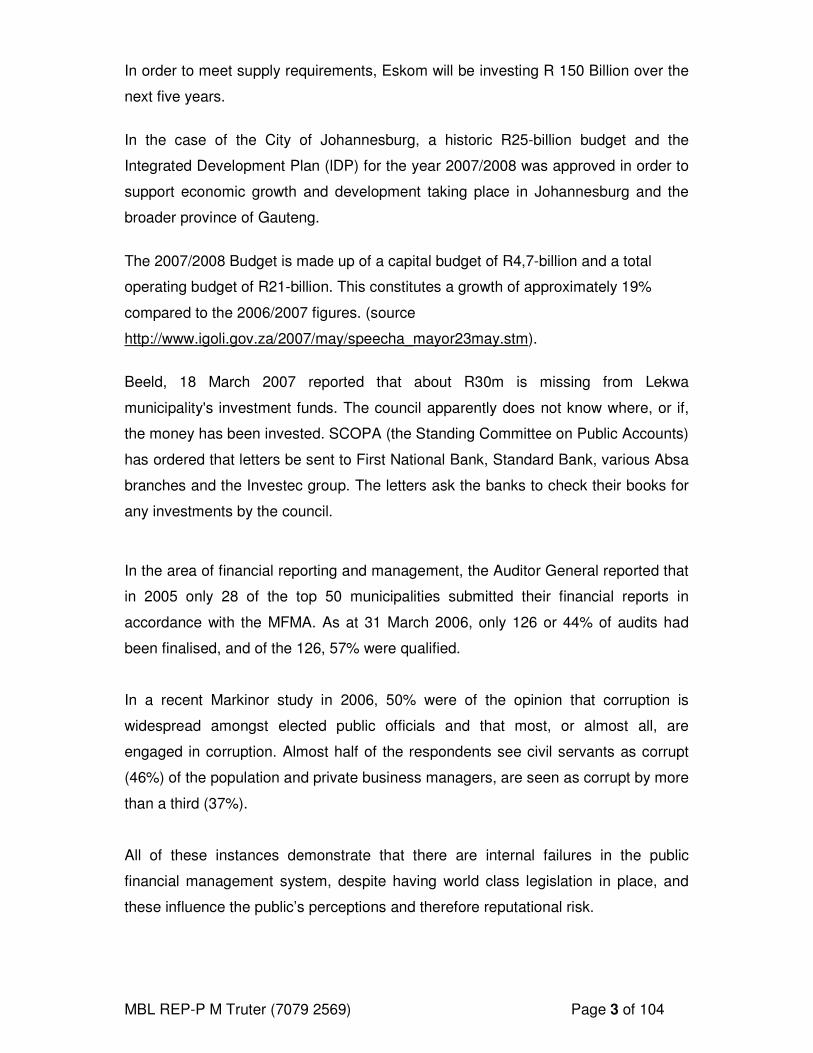
Following the peaceful political transformation in 1994, South Africa has enjoyed its
longest period of economic growth phase following the second world war. During this
period consumption of electricity by both commercial and residential users increased
dramatically as can be seen in Figure 1 below. This, among other things, was
indicative of an upsurge in economic growth, investment in development of public
infrastructure, which meant an increase in the public finances in the hands public
sector organizations.
Figure 1 - Generation plant capacity and maximum demand
Source: Eskom Annual Report 2007, Page 8
MBL REP-P M Truter (7079 2569) Page 3 of 104
In order to meet supply requirements, Eskom will be investing R 150 Billion over the
next five years.
In the case of the City of Johannesburg, a historic R25-billion budget and the
Integrated Development Plan (lDP) for the year 2007/2008 was approved in order to
support economic growth and development taking place in Johannesburg and the
broader province of Gauteng.
The 2007/2008 Budget is made up of a capital budget of R4,7-billion and a total
operating budget of R21-billion. This constitutes a growth of approximately 19%
compared to the 2006/2007 figures. (source
http://www.igoli.gov.za/2007/may/speecha_mayor23may.stm).
Beeld, 18 March 2007 reported that about R30m is missing from Lekwa
municipality's investment funds. The council apparently does not know where, or if,
the money has been invested. SCOPA (the Standing Committee on Public Accounts)
has ordered that letters be sent to First National Bank, Standard Bank, various Absa
branches and the Investec group. The letters ask the banks to check their books for
any investments by the council.
In the area of financial reporting and management, the Auditor General reported that
in 2005 only 28 of the top 50 municipalities submitted their financial reports in
accordance with the MFMA. As at 31 March 2006, only 126 or 44% of audits had
been finalised, and of the 126, 57% were qualified.
In a recent Markinor study in 2006, 50% were of the opinion that corruption is
widespread amongst elected public officials and that most, or almost all, are
engaged in corruption. Almost half of the respondents see civil servants as corrupt
(46%) of the population and private business managers, are seen as corrupt by more
than a third (37%).
All of these instances demonstrate that there are internal failures in the public
financial management system, despite having world class legislation in place, and
these influence the public’s perceptions and therefore reputational risk.
MBL REP-P M Truter (7079 2569) Page 4 of 104
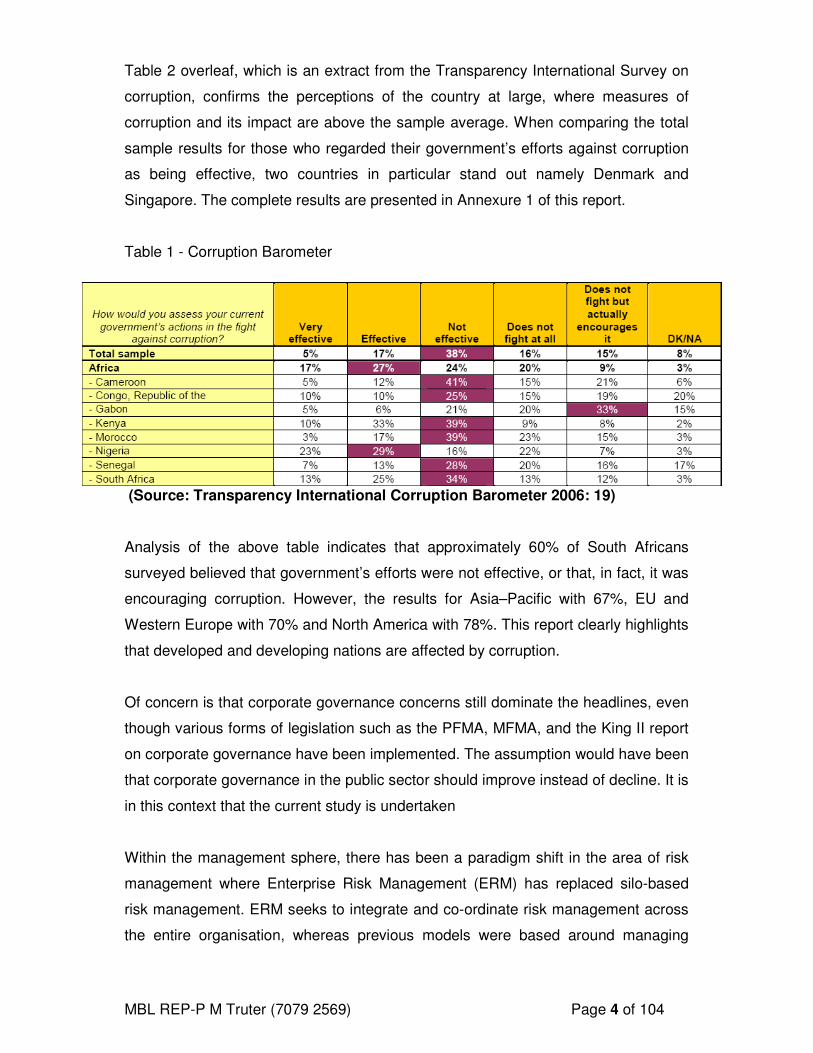
Table 2 overleaf, which is an extract from the Transparency International Survey on
corruption, confirms the perceptions of the country at large, where measures of
corruption and its impact are above the sample average. When comparing the total
sample results for those who regarded their government’s efforts against corruption
as being effective, two countries in particular stand out namely Denmark and
Singapore. The complete results are presented in Annexure 1 of this report.
Table 1 - Corruption Barometer
(Source: Transparency International Corruption Barometer 2006: 19)
Analysis of the above table indicates that approximately 60% of South Africans
surveyed believed that government’s efforts were not effective, or that, in fact, it was
encouraging corruption. However, the results for Asia–Pacific with 67%, EU and
Western Europe with 70% and North America with 78%. This report clearly highlights
that developed and developing nations are affected by corruption.
Of concern is that corporate governance concerns still dominate the headlines, even
though various forms of legislation such as the PFMA, MFMA, and the King II report
on corporate governance have been implemented. The assumption would have been
that corporate governance in the public sector should improve instead of decline. It is
in this context that the current study is undertaken
Within the management sphere, there has been a paradigm shift in the area of risk
management where Enterprise Risk Management (ERM) has replaced silo-based
risk management. ERM seeks to integrate and co-ordinate risk management across
the entire organisation, whereas previous models were based around managing
MBL REP-P M Truter (7079 2569) Page 5 of 104
risks within silos. ERM is interrelated with corporate governance in that it provides
the board with a comprehensive overview of the risks faced throughout the
organisation and control measures implemented both to eliminate and to mitigate
risk.
A similar paradigm shift took place in the area of internal audit, when in 2002 the
Institute for Internal Auditors (IIA) issued a position statement on The Role of Internal
Audit in Risk Management. The revised position statement reflected the impact of
various corporate scandals and role of internal audit in risk management. In terms of
this position statement, the role of internal audit in corporate governance is to
provide assurance to the board of directors on the adequacy and effectiveness of
internal controls, risk management, and governance processes within the
organisation.
The research problem is thus defined as:
The perceived relationship between ERM and corporate governance.
The perceived relationship between ERM and communication about risk
management within public sector organizations
The perceived relationship between the implementation of ERM and the role of
internal audit.
1.4. RESEARCH OBJECTIVES
The research objectives are:
a) to investigate the perceived relationship between ERM and Corporate
Governance;
b) to investigate the perceived relationship between ERM and Communication
about risk management; and
c) to investigate the perceived relationship between the implementation of
ERM and the role of the internal audit.
MBL REP-P M Truter (7079 2569) Page 6 of 104
1.5. CONTRIBUTION AND IMPORTANCE OF THE STUDY
Appreciably absent from a growing body of knowledge in the area of ERM, is a focus
of ERM in the public sector. Research has generally tended to focus on ERM and
competitive advantage; ERM and Balanced Scorecard; and ERM and Corporate
Strategy perspective.
The research will benefit local government and public sector entities that are
considering implementing an ERM framework and might be questioning the potential
benefits of such a programme. It will further provide a South African perspective on
the implementation of ERM and provide an overview of the regulatory and guideline
governance frameworks in existence. It will also assist internal auditors in their role
in implementing the framework and define roles that they can and cannot undertake,
to ensure their role is not compromised.
The boards of local government and public entities will also benefit as management
teams will implement and integrated risk management standard that is based on
international best practice.
Most importantly the communities, customers and stakeholders serviced by local
government and public entities will also benefit, because, at present corporate
governance failures in these departments are delaying the implementation of service
projects or resulting in the delivery of sub standard products.
1.6. CLARIFICATION OF CONCEPTS
“Enterprise risk management” is defined as a process, effected by an entity’s
board of directors, management and other personnel, applied in strategy setting and
across the enterprise, designed to identify potential events that may affect the entity,
and manage risks to be within its risk appetite, to provide reasonable assurance
regarding the achievement of entity objectives. (COSO, 2004:2)
“Risk” is defined as the variation of an actual outcome from expected outcome. Risk
therefore implies the presence of uncertainty. If this definition is accepted then the
MBL REP-P M Truter (7079 2569) Page 7 of 104
standard deviation is an appropriate measure of risk (Valsamakis, Vivian & du Toit,
2005,:27).
“Corporate Governance” is concerned with holding the balance between
economic and social goals and between individual and communal goals. The aim
is to align as nearly as possible the interests of individuals, corporations and
society. (King, 2002)
“Internal Auditing” is an independent objective assurance and consulting activity
designed to add value and improve an organisation’s operations. It helps an
organisation accomplish its objectives by bringing in a systematic disciplined
approach to evaluate and improve the effectiveness of risk management, control and
governance processes. (The Institute of Internal Auditors, 2004)
1.7. DELIMITATION OF THE STUDY
As a limited body of knowledge on ERM exists in the public sector, the study uses
the body of knowledge that currently focuses on the private sector as a basis, and
the applicability of the ERM frameworks within the public sector. The latter is used to
develop the items for the research instrument.
The study will only consider the relationship between the implementation of an ERM
framework and corporate governance within local government, provincial
government, and public entities located within the Gauteng Province. It will further
investigate the role of the board, senior management, and internal audit in the
implementation of such a framework.
The results of the survey will not be representative of all the South Africa local
governments, provincial governments and public entities, as the sampling frame
cannot be considered to be representative of the entire population.
MBL REP-P M Truter (7079 2569) Page 8 of 104
1.8. PLAN OF THE STUDY
Below is a plan of the study.
Chapter 2: Theoretical Foundation of the Study
This chapter contains an overview of corporate governance and legal framework
within the local government and public sector is presented. These include:
• the South African Constitution;
• the Municipal Finance Management Act No. 56 of 2003 (MFMA);
• the Public Finance Management Act, 1999 (Act No. 1 of 1999) (PFMA); and
• the King II guideline on corporate governance.
Chapter 3: Literature Review
Various models on ERM and corporate governance, will be presented, analsysed
and discussed. The models include:
• COSO 2 - Committee of Sponsoring Organisations of the Treadway
Commission. 2004 and AS/NZS 4360:2004 - Australian/New Zealand
Standard on Risk Management;
• an Integrated ERM and Corporate Governance Framework; and
• the IIA model detailing the role of internal audit in the area of ERM.
Various articles or concepts within the field of Enterprise Risk Management and
corporate governance will be presented.
Chapter 4: Research Methodology
A sample will be drawn from the population; a sample questionnaire will be
compiled, which will thereafter be tested. Data will then be gathered, analysed and
the reporting of results will be explained.
MBL REP-P M Truter (7079 2569) Page 9 of 104
Chapter 5: Research Results
The outcome of the research, based on the questionnaires distributed will be
explained and critically analysed. The results will be discussed in relation to the
hypotheses formulated. Relationships between variables will be examined.
Chapter 6: Discussion, Conclusions, and Recommendations
The results of the study will be discussed and conclusions will be drawn in relation
to the theory presented. The researcher will make recommendations based on the
outcome of the study, including limitations and possible suggestions as to how
similar studies should be approached.
MBL REP-P M Truter (7079 2569) Page 10 of 104
2. CHAPTER 2: THEORETICAL FOUNDATION OF THE STUDY
2.1. INTRODUCTION
“Our hope for the future depends on our resolution as a nation in dealing with
the scourge of corruption. Success will require an acceptance that, in many
respects, we are a sick society. It is perfectly correct to assert that all this was
spawned by apartheid. No amount of self-induced amnesia will change the
reality of history.” (Former President Nelson Mandela)
The irregularities highlighted in the problem statement, as well as the reports
reflecting perceptions of corruption, indicate that numerous risks exist within some
government departments. These irregularities present major challenges to the
authorities, board of directors, senior management, and internal audit within these
departments. The board and senior management, are expected to account for
contraventions in terms of corporate governance.
This chapter provides an overview of the regulatory frameworks aimed at
improving corporate governance and risk management within public administration.
These include the South African Constitution, PFMA, MFMA and the King II
guideline report on corporate governance.
2.2. THE SOUTH AFRICAN CONSTITUTION
Chapter 7 of the Constitution of the Republic of South Africa, 1996 provides for the
establishment of the local sphere of government. The objects of local government as
stipulated under subsection 1 of section 152 of Act 108 of 1996 of The Constitution
of the Republic of South Africa are as follows:
a) to provide democratic and accountable government for local communities;
b) to ensure the provision of services to communities in a sustainable manner;
c) to promote social and economic development;
d) to promote a safe and healthy environment; and
MBL REP-P M Truter (7079 2569) Page 11 of 104
e) to encourage the involvement of communities and community organisations in
matters of local government.
Section 195 of the Constitution provides an outline of the basic values and principles
governing public administration. These include:
a) promoting and maintaining a high standard of professional ethics;
b) accountability on the part of public administration;
c) promoting efficient, economic and effective use of resources; and
d) maximising human potential by cultivating good human resource management
and career development practices.
The Constitution serves as the cornerstone of the value system in South Africa. The
rights of all people are enshrined and the democratic values of human dignity,
equality, and freedom are affirmed. To build integrity and fight corruption a
comprehensive array of legislation has been enacted. Section 55 of the Constitution
states that the National Assembly must provide for mechanisms to maintain
oversight of any organ of the state.
Section 56 further states that the National Assembly or any of its Committees may:
a) summon any person to appear before it to give evidence on oath or
affirmation or to produce documents;
b) require any person or institution to report to it; and
c) compel, in terms of national legislation or its rules and orders, any person or
institution, to comply with summons or requirement in terms of the above.
The primary function of SCOPA is to consider and examine the reports of the Auditor
General and the financial statements of departments, parastatals or any state-funded
institution, that are tabled in parliament. On receipt of such reports, SCOPA, through
its clusters or subcommittee, categorises reports as set out below.
Category A includes qualified, disclaimer or adverse opinions. The Committee will
normally request a face-to-face interaction with the Accounting Officer of a particular
department or public entity. This interaction is in the form of a public hearing, which
is intended to gain a better understanding of issues that might lead to a disclaimer or
a qualification. Ideally, all departments and public entities whose annual reports fall
MBL REP-P M Truter (7079 2569) Page 12 of 104
into category A will be called for a hearing where the Committee will interact with the
officials in order to develop remedial action.
Category B includes unqualified reports. Members of the cluster can decide to call
the Accounting Officer before the Committee to explain some of the pertinent issues
identified.
Category C includes unqualified reports (clean audits). Here no interaction is
needed with the departments/entities concerned and the Committee will make a
resolution acknowledging the receipt of such reports.
2.3. PFMA and MFMA
Section 38 of the PFMA provides a legislative framework for managers to manage
their departments, focusing on these key elements in a flexible, innovative way, but
still holding them accountable. The accounting officer must ensure:
a) effective, efficient and transparent systems of financial, risk management and
internal control;
b) a system of internal audit under the control and direction of an audit
committee in terms of sections 76 and 77;
c) an appropriate procurement and provisioning system which is fair, equitable,
transparent, competitive and cost-effective; and
d) proper evaluation of capital projects prior to the final decision.
Gross negligence can result in criminal conviction, imprisonment, fine and personal
liability.
Similarly, Section 62 of the MFMA prescribes similar duties for accounting officers
who are responsible for managing the financial administration of the municipality and
must ensure:
a) that the resources of the municipality are used effectively, efficiently and
economically;
b) that full and proper records of the financial affairs of the municipality are kept
in accordance with any prescribed norms and standards;
c) that the municipality has and maintains effective, efficient and transparent
systems; and
MBL REP-P M Truter (7079 2569) Page 13 of 104
d) that unauthorised, irregular or fruitless and wasteful expenditure and other
losses are prevented.
The acts provide for the establishment and further defines the roles of two
governance bodies most notably internal audit and the audit committee.
2.4. INTERNAL AUDIT
Internal audit is one of the key role players in terms of corporate governance. The
Municipal Finance management Act (MFMA), Section 165 stipulates that each
municipality must have an internal audit department. The Act further stipulates that a
municipal internal audit unit must on an annual basis compile a risk-based internal
audit plan and internal audit programme. The internal audit must advise the
accounting officer and report to the audit committee on the implementation of the
plan and matters relating to:
• risk and risk management;
• loss control;
• internal audit;
• performance management;
• internal audit; and
• internal controls.
The objective of the internal audit is to provide assurance regarding the adequacy
and the effectives of internal controls, corporate governance, and risk management
within the municipality or its departments.
MBL REP-P M Truter (7079 2569) Page 14 of 104
2.5. AUDIT COMMITTEE
Section 166 of the MFMA and Sections 76 and 77 of the PFMA provide for the
creation of an audit committee, whose role is to function as an independent advisory
body to the municipal council, accounting officer, board of directors, management
staff, and political office bearers on matters relating to:
• risk management;
• accounting policies;
• internal controls and internal audits;
• accounting policies;
• effective governance; and
• compliance with the MFMA.
Sections 76 and 77 of the PFMA, National Treasury provide for the appointment and
function of both the internal audit and the audit committee.
2.6. KING II
King II outlines the characteristics of good corporate governance as being
discipline, transparency, independence, accountability responsibility, fairness, and
social responsibility. The King II report on Corporate Governance requires that risk
be treated in an integrated manner. The Board is responsible for:
• implementing a comprehensive set of control to ensure that risk identified
are mitigated so as to ensure the organisation achieves its objectives;
• setting risk tolerance, strategies and policies;
• considering the organisations risks how they’ve been identified; and
• assessing the effectiveness and corrective measures to be implemented.
King II (2002) outlines the characteristics of good corporate governance as set out
below:
MBL REP-P M Truter (7079 2569) Page 15 of 104
2.6.1. Discipline
Corporate discipline is a commitment by a company's senior management to
adhere to behaviour that is universally recognised and accepted as being correct
and proper. This encompasses a company's awareness of, and commitment to,
the underlying principles of good corporate governance, particularly at senior
management level. (King, 2002:10)
2.6.2. Transparency
Transparency is the ease with which an outsider is able to make a meaningful
analysis of a company's actions, its economic fundamentals, and the non-financial
aspects pertinent to that business. This is a measure of how good management is
at making the necessary information available in a candid, accurate, and timely
manner (King, 2002:10).
2.6.3. Independence
Independence is the extent to which a strong CEO or a large shareholder has put
mechanisms in place to minimise or avoid potential conflicts of interest that may
exist, such as dominance. These mechanisms range from the composition of the
board, to appointments to committees of the board, and to external parties such as
auditors. The decisions made and internal processes established should be
objective and should not allow for undue influence. (King, 2002:10)
2.6.4. Accountability
Individuals or groups in a company, who make decisions and take actions on
specific issues, need to be accountable for their decisions and actions.
Mechanisms must exist and be effective to allow for accountability. These
mechanisms provide investors with the means to query and assess the actions of
the board and its committees. (King, 2002:10).
MBL REP-P M Truter (7079 2569) Page 16 of 104
2.6.5. Responsibility
With regard to management, responsibility pertains to behaviour that allows for
corrective action and for penalising mismanagement. Responsible management
should, when necessary, put in place what it would take to set the company on the
right path. While the board is accountable to the company, it must act responsively
to, and with responsibility towards, all stakeholders of the company. (King, 2002:
11).
2.6.6. Fairness
The systems that exist within the company must be balanced in taking into account
all those who have an interest in the company and its future. The rights of various
groups have to be acknowledged and respected. For example, minority
shareholder interests must receive equal consideration to those of dominant
shareholders. (King, 2002:11).
2.6.7. Social Responsibility
A well-managed company or organisation will be aware of, and respond to, social
issues, placing high priority on ethical standards. A good corporate citizen is
increasingly seen as one who is non-discriminatory, non-exploitive, and
responsible with regard to environmental and human rights issues. A company is
likely to experience indirect economic benefits, such as improved productivity and
corporate reputation, by taking these factors into consideration. (King, 2002:11).
2.7. RISK MANAGEMENT
According to the IRMSA Code of Practice, corporate governance codes have an
expectation that an enterprise risk management framework will be developed within
an organisation. Because of the prevalence of high corporate profile failures,
investors and stakeholders do not want to be caught unawares. There is an
expectation that internal controls will be based on a thorough and comprehensive
process of risk management. This implies that all manner of business risks will be
identified, interpreted, and managed by the enterprise. (IRMSA Code of Practice,
2003:11)
MBL REP-P M Truter (7079 2569) Page 17 of 104
Corporate governance can, in part, be viewed as a company’s strategic response to
the need to assume prudent risks, appropriately mitigated, in exchange for
measurable rewards. Risk management is recognised as an integral part of sound
organisational management and is being promoted internationally and in South
Africa as good business practice applicable to the public and private sectors.
According to IRMSA” a consistent and uniform standard for enterprise risk
management is not available” (IRMSA et al., 2003:9). Research into the various
forms of ERM is presented in Chapter 3 of this report.
2.8. CONCLUSION
This chapter provided an overview of the regulatory framework within the South
African context with specific emphasis in the Public Finance Management Act and
Municipal Finance Management Act. The role of the Internal and Audit Committee as
provided by the aforementioned Acts, and also a discussion on the King II guideline
on Corporate Governance were presented.
MBL REP-P M Truter (7079 2569) Page 18 of 104
3. CHAPTER 3: LITERATURE REVIEW
3.1. INTRODUCTION
Following numerous corporate scandals, the reputation of the entire auditing
profession and the board’s role as the champion of corporate governance was called
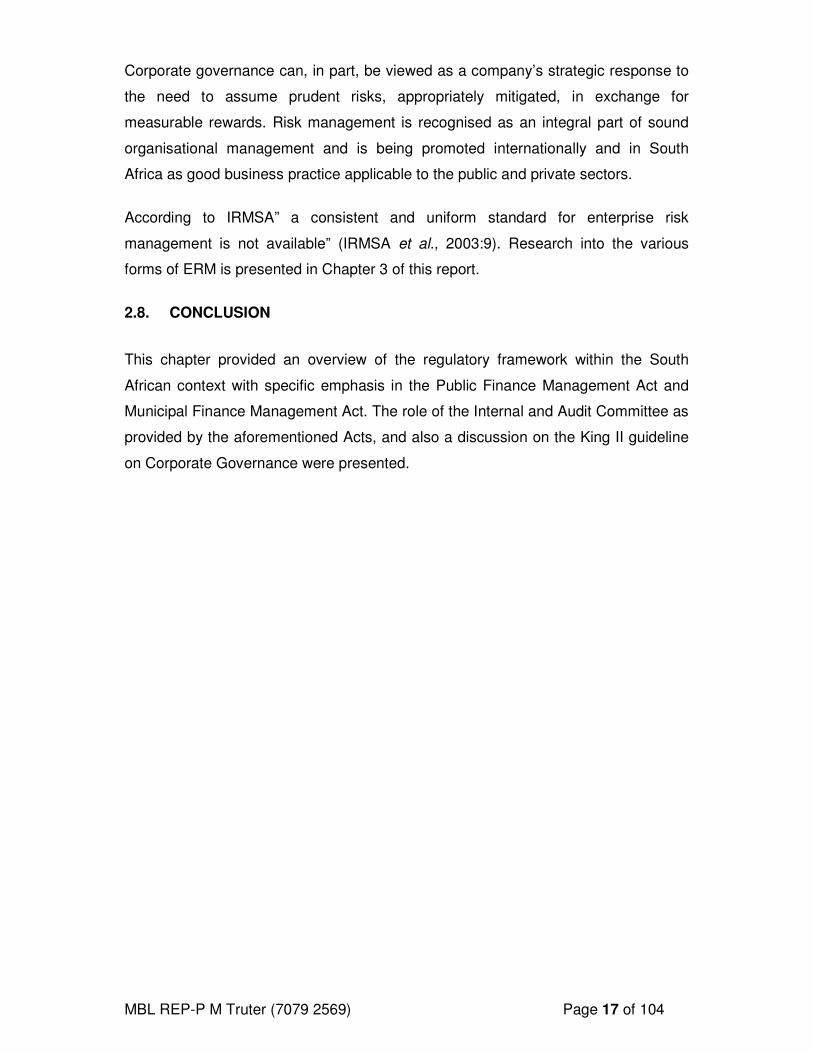
into question. There are a large number of ERM frameworks these include:
• COSO 2 – the Committee of Sponsoring Organisations of the Treadway
Commission. 2004;
• FERMA (The Federation of European Risk Management Associations) risk
framework;
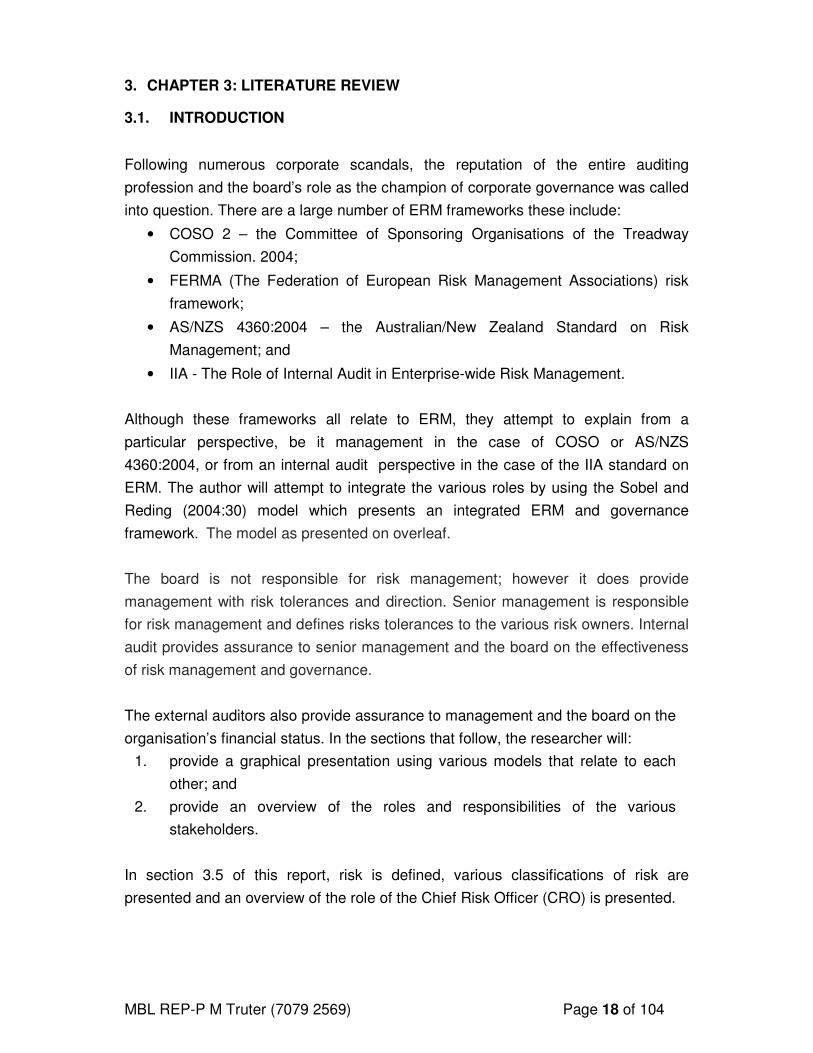
• AS/NZS 4360:2004 – the Australian/New Zealand Standard on Risk
Management; and
• IIA - The Role of Internal Audit in Enterprise-wide Risk Management.
Although these frameworks all relate to ERM, they attempt to explain from a
particular perspective, be it management in the case of COSO or AS/NZS
4360:2004, or from an internal audit perspective in the case of the IIA standard on
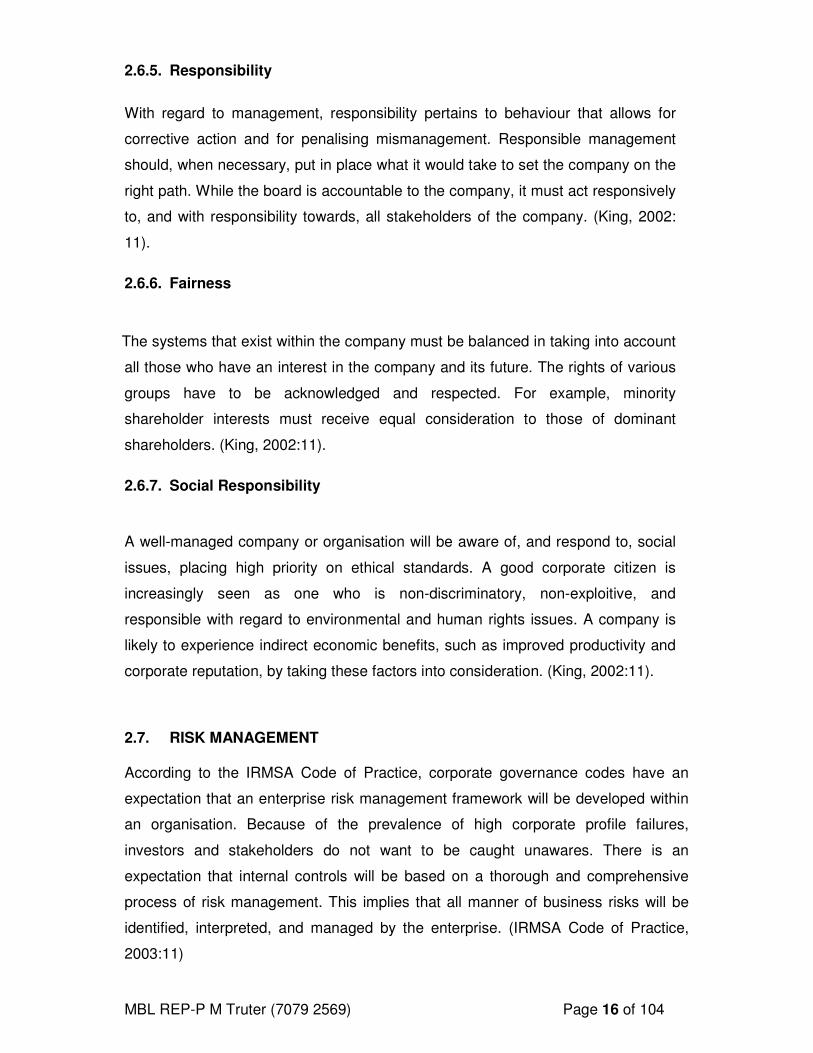
ERM. The author will attempt to integrate the various roles by using the Sobel and
Reding (2004:30) model which presents an integrated ERM and governance
framework. The model as presented on overleaf.
The board is not responsible for risk management; however it does provide
management with risk tolerances and direction. Senior management is responsible
for risk management and defines risks tolerances to the various risk owners. Internal
audit provides assurance to senior management and the board on the effectiveness
of risk management and governance.
The external auditors also provide assurance to management and the board on the
organisation’s financial status. In the sections that follow, the researcher will:
1. provide a graphical presentation using various models that relate to each
other; and
2. provide an overview of the roles and responsibilities of the various
stakeholders.
In section 3.5 of this report, risk is defined, various classifications of risk are
presented and an overview of the role of the Chief Risk Officer (CRO) is presented.
MBL REP-P M Truter (7079 2569) Page 19 of 104
Figure 2 - An ERM and Governance Framwork
Figure 3 - COSO ERM Model
Figure 4 - Internal Audit role in ERM
Source: COSO 2004:5 Source: IIA 2004:2
Figure 5 - AS/NZS 4360:2004 Risk Management Model
Source: AS/NZS 4360 (2004:9)
(Source Sobel and Reading, 2004:30)
MBL REP-P M Truter (7079 2569) Page 20 of 104
3.2. THE BOARD
The board is responsible for risk management within an organisation and should
ensure that recognised frameworks are implemented to make sure that risk are
assessed on an ongoing basis and control measures are in place to respond to the
risk identified. It is imperative both that a culture of risk management is cultivated
throughout the organisation and that the status on organisational performance is
managed via the risk and audit committee or similar. According to (Sobel et al.,
2004:31) the board should involve itself in the ERM process by providing direction,
authority and oversight to management. Various suggestions are listed below.
a) Contribute expertise, judgment, and professional scepticism to the strategic
planning process.
b) Define and communicate risk tolerance thresholds to senior management to
guide management’s decisions.
c) Assign authority to senior management to manage risks within the specified
tolerance levels.
d) Oversee the implementation of the company’s risk management process, and
monitor the process to ensure that it continuously operates effectively in the
best interests of the company’s stakeholders.
e) Ensure that management’s mix of performance indicators associated with
key risks is aligned properly with the company’s strategy and linked
appropriately to shareholder value.
f) The board should hold senior management accountable for keeping it
apprised of significant risks, taking appropriate actions to manage these
risks, and reporting risk management performance results.
Similar responsibilities of the board are also outlined by the King II Report (2002)
on Corporate Governance as discussed below.
a) Determine the company purpose and values.
b) Determine the strategy that will enable the organisation to achieve its
objectives.
c) Exercise leadership, integrity and judgement so as to achieve continuing
prosperity for the organisation.
MBL REP-P M Truter (7079 2569) Page 21 of 104
d) Ensure that sound processes, procedures and practices are in place that
protect the organisation’s assets and reputation.
e) Monitor and evaluate the implementation of strategies and policies,
management performance criteria and business plans.
f) Ensure that the company complies with all relevant laws, regulations and
codes of best business practice.
g) Ensure that the technology and systems used in the company are adequate
to run the business properly and for it to compete through the efficient use
of its assets, processes and human resources.
h) Identify key risk areas and key performance indicators of the business
enterprise in order for the company to generate economic profit.
i) Regularly assess its performance and effectiveness as a whole and that of
individual directors, including the chief executive officers.
The role of the board is similar in the case of public companies or enterprises.
However, in the case of local authorities, the mayoral committee or the executive
committee is responsible for corporate governance. They will similarly provide
strategic direction to the municipality, and will comply with all relevant laws and
regulations. The mayoral committee will similarly perform the duties as outlined in
the King II report on corporate governance.
MBL REP-P M Truter (7079 2569) Page 22 of 104
3.3. THE ROLE OF MANAGEMENT AND THE CEO
The board of directors assigns the responsibility for risk management to the CEO
and his/her senior management team. Senior Management are therefore charged
with implementing and maintaining the ERM framework. However, in the case of a
local authority the mayor and city manager will fulfil the roles of the Chairman and
CEO respectively.
The Mayor will oversee the running of the Mayoral Committee, whilst the City
Manager will be responsible for the running of the municipality and would be
responsible for implementing an ERM strategy. In the case of the Joburg Metro,
which has created separate Section 21 agencies such as Johannesburg City Parks,
the role for responsibility for implementation and monitoring can be delegated to the
respective managing directors.
COSO (2004:2) defines Enterprise Risk Management as a process, effected by an
entity’s board of directors, management and other personnel, applied in strategy
setting and across the enterprise, designed to identify potential events that may
affect the entity, and manage risks to be within its risk appetite, to provide
reasonable assurance regarding the achievement of entity objectives.
This definition reflects certain fundamental concepts. Enterprise Risk Management:
• is a process – it is a means to an end, not an end in itself;
• is effected by people – it's not merely policies, surveys and forms, but involves
people at every level of an organisation;
• is applied in strategy setting;
• is applied across the enterprise, at every level and unit, and includes taking
an entity-level portfolio view of risks;
• Is designed to identify events potentially affecting the entity and manage risk
within its risk appetite
• provides reasonable assurance to an entity's management and board; and
• is geared to the achievement of objectives in one or more separate but
overlapping categories.
MBL REP-P M Truter (7079 2569) Page 23 of 104
This definition shows that enterprise risk management is geared towards assisting
the entity in achieving its objectives.
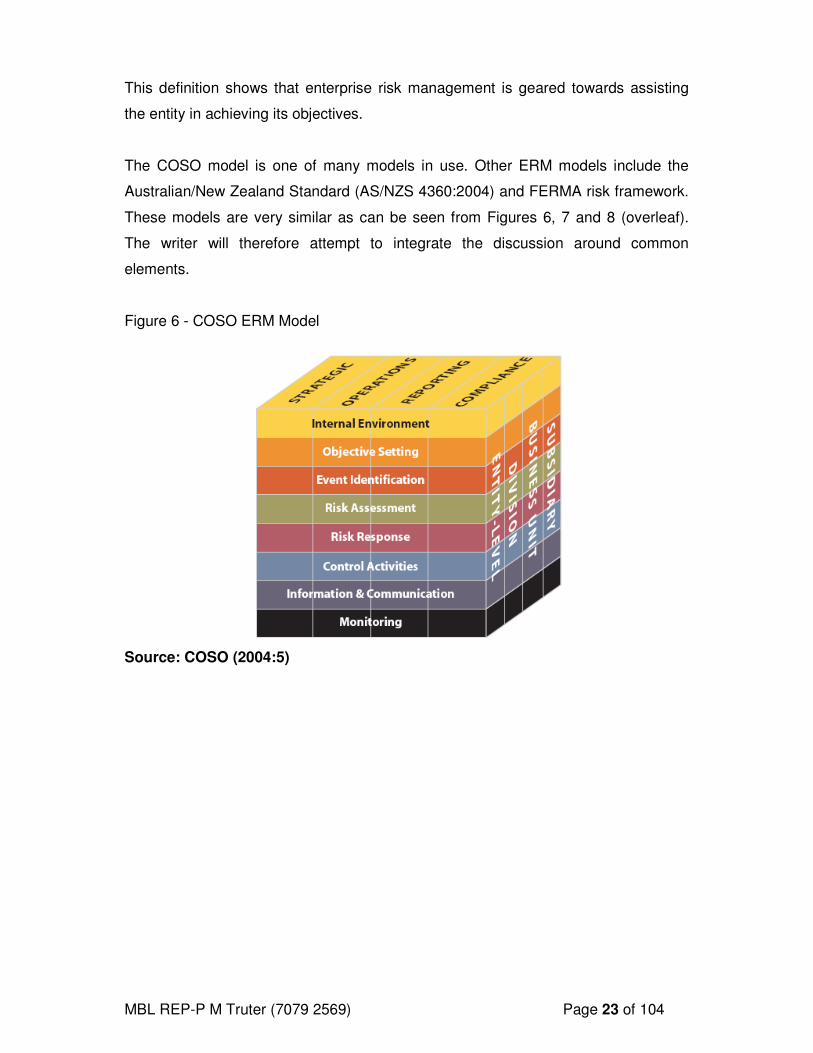
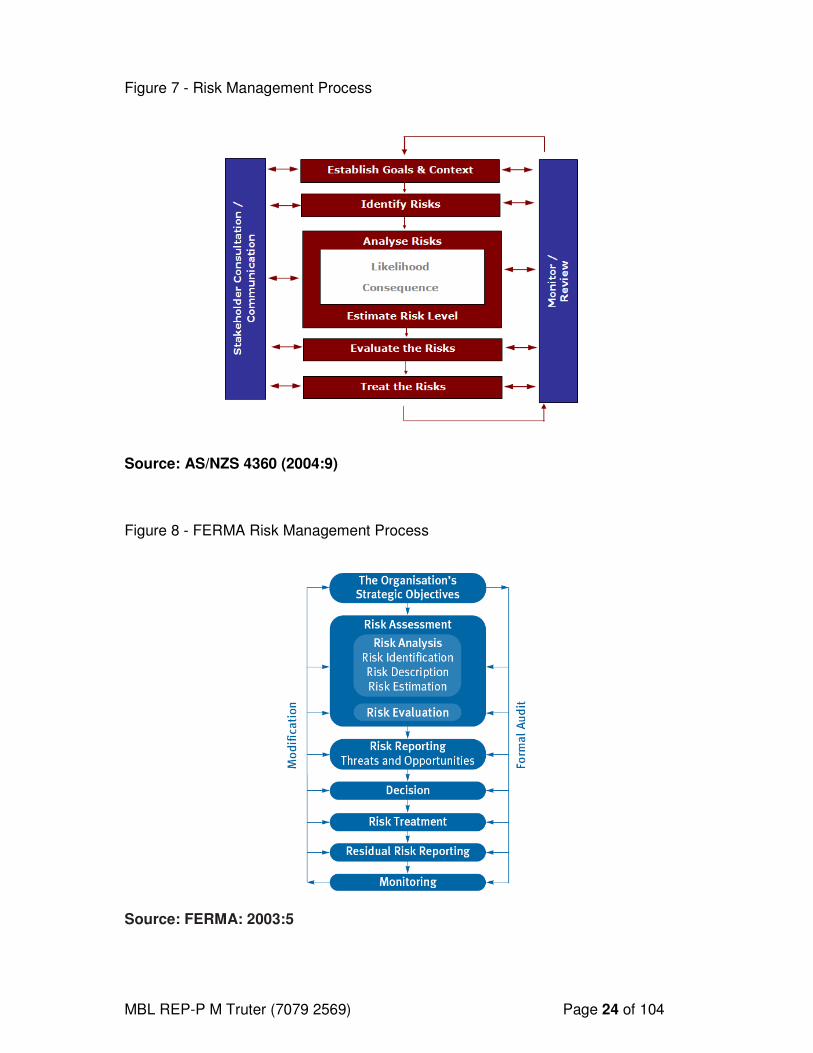
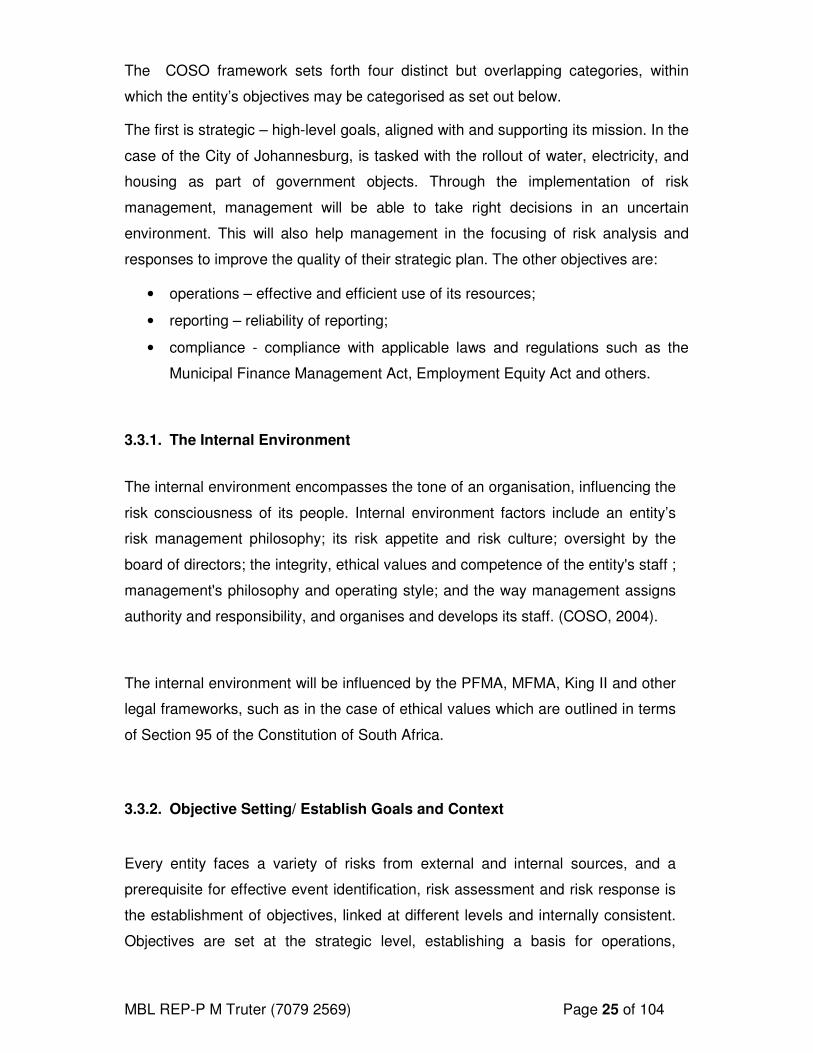
The COSO model is one of many models in use. Other ERM models include the
Australian/New Zealand Standard (AS/NZS 4360:2004) and FERMA risk framework.
These models are very similar as can be seen from Figures 6, 7 and 8 (overleaf).
The writer will therefore attempt to integrate the discussion around common
elements.
Figure 6 - COSO ERM Model
Source: COSO (2004:5)
MBL REP-P M Truter (7079 2569) Page 24 of 104
Figure 7 - Risk Management Process
Source: AS/NZS 4360 (2004:9)
Figure 8 - FERMA Risk Management Process
Source: FERMA: 2003:5
MBL REP-P M Truter (7079 2569) Page 25 of 104
The COSO framework sets forth four distinct but overlapping categories, within
which the entity’s objectives may be categorised as set out below.
The first is strategic – high-level goals, aligned with and supporting its mission. In the
case of the City of Johannesburg, is tasked with the rollout of water, electricity, and
housing as part of government objects. Through the implementation of risk
management, management will be able to take right decisions in an uncertain
environment. This will also help management in the focusing of risk analysis and
responses to improve the quality of their strategic plan. The other objectives are:
• operations – effective and efficient use of its resources;
• reporting – reliability of reporting;
• compliance - compliance with applicable laws and regulations such as the
Municipal Finance Management Act, Employment Equity Act and others.
3.3.1. The Internal Environment
The internal environment encompasses the tone of an organisation, influencing the
risk consciousness of its people. Internal environment factors include an entity’s
risk management philosophy; its risk appetite and risk culture; oversight by the
board of directors; the integrity, ethical values and competence of the entity's staff ;
management's philosophy and operating style; and the way management assigns
authority and responsibility, and organises and develops its staff. (COSO, 2004).
The internal environment will be influenced by the PFMA, MFMA, King II and other
legal frameworks, such as in the case of ethical values which are outlined in terms
of Section 95 of the Constitution of South Africa.
3.3.2. Objective Setting/ Establish Goals and Context
Every entity faces a variety of risks from external and internal sources, and a
prerequisite for effective event identification, risk assessment and risk response is
the establishment of objectives, linked at different levels and internally consistent.
Objectives are set at the strategic level, establishing a basis for operations,
MBL REP-P M Truter (7079 2569) Page 26 of 104
reporting and compliance objectives. Objectives are aligned with the entity’s risk
appetite, which drives risk tolerance levels for the entity’s activities. (COSO, 2004)
3.3.3. Event identification
Management identifies potential events affecting an entity’s ability to implement
strategy successfully and achieve objectives. Events with a potentially negative
impact represent risks, which require management’s assessment and response.
Events with a potentially positive impact may offset negative impacts or may even
represent opportunities. Management channels opportunities back into the strategy
and objective-setting processes. Various internal and external factors give rise to
events. When identifying potential events, management considers the full scope of
the organisation. Management considers the context within which the entity
operates and its risk tolerances. (COSO, 2004)
As the risk faced by a local authority and a public entity are very diverse, various
techniques can be used to identify risks. A systematised approach to risk
identification may be achieved by first considering what risks the organisation
faces at the macro and micro level. Macro identification is defined as the
identification of major risk that may have a significant impact (financial or
otherwise) on the organisation. Micro identification is focused on the sub risks in
the major risk class.(Valsamakis et al.,2005:27)
Macro identification can include insurance reviews which focus on perils such as
fire, natural perils such as earthquakes and crime including fraud, fidelity and theft.
Other forms of identification can also be based on legal requirements as in the
case of the Occupational Health and Safety Act 85 of 1993 as well as the
Municipal Finance Management Act which stipulate the appointment of Health and
Safety Representatives, or the submission of financial statements in the case of
the MFMA.
MBL REP-P M Truter (7079 2569) Page 27 of 104
3.3.4. Risk Assessments
Risk assessment allows an entity to evaluate the extent to which potential events
might have an impact on achievement of objectives. Management should assess
events from two perspectives − likelihood and impact − and normally uses a
combination of qualitative and quantitative methods (COSO, 2004)
By conducting a risk assessment, a local authority or public entity will be able to
rank its risk from the highest to the lowest risk, all of which form part of the
organisations risk register. As funding is limited in all public institutions it will allow
an entity to select its most critical risks in a financial year and action these, and
thereafter focus on lower rated risk later. For example prioritising fraud risks,
individuals in positions where the opportunity for fraud and corruption is high can
be better assisted in managing those risks. This allows departments to align their
risk based auditing plan with the risk profile. It ensures a focused audit plan and
contributes to the monitoring of changes in the risk profile of the organisation
3.3.5. Risk Responses- Determine the treatments for the risks
Having assessed the relevant risks, management determines how it will respond.
Responses include risk avoidance, reduction, sharing and acceptance. In
considering its response, management reviews costs and benefits, and selects a
response that brings the expected likelihood and impact within the desired risk
tolerances. (COSO, 2004)
Risk responses fall within the categories described below.
• Avoidance – Action is taken to avoid the activities giving rise to risk.
• Reduction – Action is taken to reduce the risk likelihood or impact, or both.
This may involve any of a myriad of everyday business decisions.
• Sharing – Action is taken to reduce risk likelihood or impact by transferring
or otherwise sharing a portion of the risk. Common risk-sharing techniques
include purchasing insurance products, pooling risks, engaging in hedging
transactions, or outsourcing an activity.
MBL REP-P M Truter (7079 2569) Page 28 of 104
• Acceptance – No action is taken to affect likelihood or impact. (COSO,
2004)
Once all risks have been assessed a decision needs to be made to determine
whether the level is acceptable to the organisation or not. The board determines risk
tolerance levels that can allow be easy decision-making by management. Where risk
levels exceed tolerance levels these should be escalated to the board or the Mayoral
Committee for review and decision.
3.3.6. Control Activities
Control activities are the policies and procedures that help ensure that
management’s risk responses are carried out. Control activities occur throughout
the organisation, at all levels and in all functions. They include a range of activities
− as diverse as approvals, authorisations, verifications, reconciliations, reviews of
operating performance, security of assets and segregation of duties. (COSO,
2004)
3.3.7. Information and communication
Pertinent information is identified, captured and communicated in a form and
timeframe that enable people to carry out their responsibilities. Information
systems use internally generated data, and information about external events,
activities and conditions, providing information for managing enterprise risks and
making informed decisions relative to objectives. They understand their own role in
enterprise risk management, as well as how individual activities relate to the work
of others. They must have a means of communicating significant information
upstream. There is also effective communication with external parties. (COSO,
2004)
(Sobel et al., 2004:33-36) provides a comprehensive overview of communication
between the various stakeholders as presented in Figure 1. Information that senior
management should communicate to the board of directors includes:
MBL REP-P M Truter (7079 2569) Page 29 of 104
a) the steps senior management has taken to establish a healthy ethical culture
and to handle significant code of conduct violations as they occur;
b) senior management’s strategic objectives and its plan for achieving these
objectives;
c) the significant risks that affect the company’s ability to achieve its strategic
objectives;
d) the actions management has taken or will take to manage those risks; and
e) ERM performance results.
Communication between senior management should communicate downward to risk
owners includes:
a) a written code of conduct that articulates the company’s ethical principles and
specific rules of conduct;
b) a written risk management framework that conveys senior management’s risk
management philosophy, policies, strategies, and procedures; and
c) risk management authority, tolerance thresholds, and performance metrics
for individual risk owners.
Relevant and reliable upward communication from risk owners to senior
management includes:
a) risk and control assessments;
b) risk management plans; and
c) ERM performance reports.
3.3.8. Monitor and report on the effectiveness of risk treatments
Enterprise risk management is monitored – a process that assesses the presence
and functioning of its components over time. This is accomplished through ongoing
monitoring activities, separate evaluations or a combination of the two. Ongoing
monitoring occurs in the normal course of management activities. The scope and
frequency of separate evaluations will depend primarily on an assessment of risks
and the effectiveness of ongoing monitoring procedures. Enterprise risk
MBL REP-P M Truter (7079 2569) Page 30 of 104
management deficiencies are reported, with serious matters reported to top
management and the board. (COSO, 2004)
Internal audit in terms of the assurance role will conduct audits to ensure the
validity of reports and to test controls put in place to manage risk.
3.4. THE ROLE OF THE INTERNAL AUDIT IN ERM
The Internal audit is an independent objective assurance and consulting activity
designed to add value and improve an organisation’s operations. It helps an
organisation accomplish its objectives by bringing in a systematic disciplined
approach to evaluate and improve the effectiveness of risk management, control
and governance processes. (IIA, 2004:8)
Research has indicated that the greatest value of the internal audit is in the area of
providing assurance that significant business risk are being appropriately managed
and that the risk management framework is operating effectively.
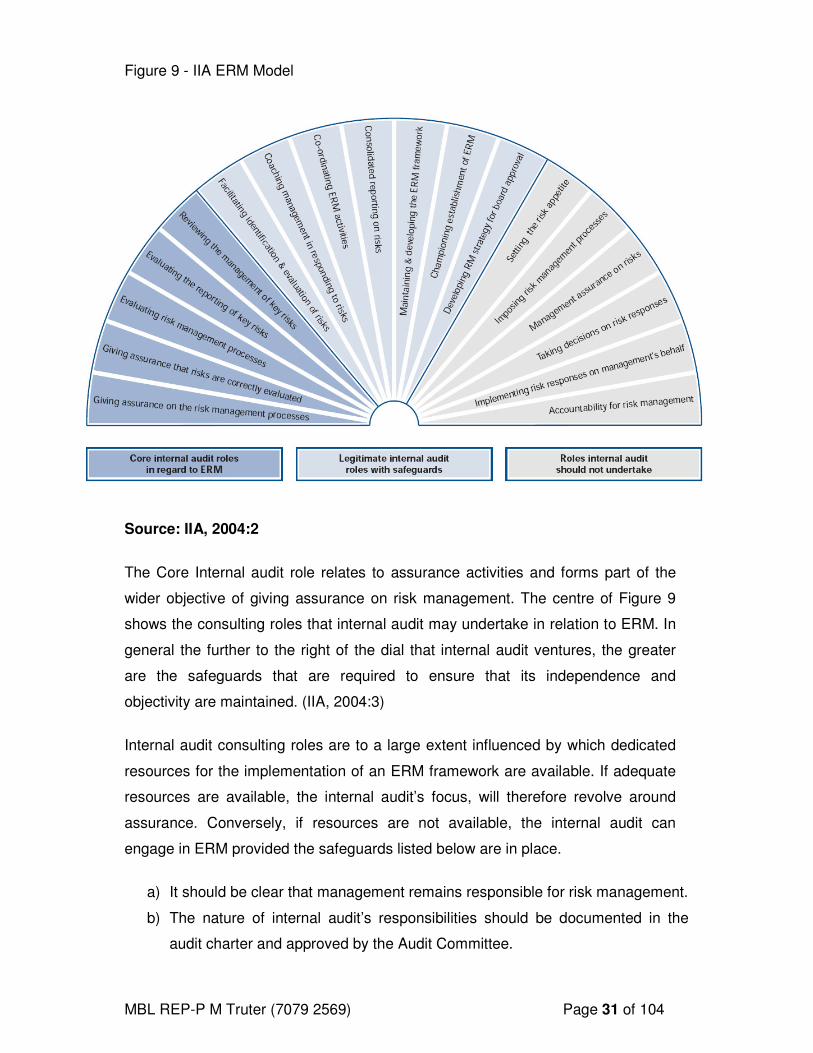
The IIA ERM model is presented in Figure 9. It provides a guideline of the activities
that the internal audit should and, equally importantly, should not undertake. The
delineation between the roles that it should and should not undertake is based on the
impact on its ability to remain objective regarding organisation risk management,
control, and governance processes.
The key factors to take into account when determining the role of internal audit are
whether the activity raises any threats to the internal audit function’s independence
and objectivity and whether it is likely to improve the organisation’s risk
management, control and governance processes
MBL REP-P M Truter (7079 2569) Page 31 of 104
Figure 9 - IIA ERM Model
Source: IIA, 2004:2
The Core Internal audit role relates to assurance activities and forms part of the
wider objective of giving assurance on risk management. The centre of Figure 9
shows the consulting roles that internal audit may undertake in relation to ERM. In
general the further to the right of the dial that internal audit ventures, the greater
are the safeguards that are required to ensure that its independence and
objectivity are maintained. (IIA, 2004:3)
Internal audit consulting roles are to a large extent influenced by which dedicated
resources for the implementation of an ERM framework are available. If adequate
resources are available, the internal audit’s focus, will therefore revolve around
assurance. Conversely, if resources are not available, the internal audit can
engage in ERM provided the safeguards listed below are in place.
a) It should be clear that management remains responsible for risk management.
b) The nature of internal audit’s responsibilities should be documented in the
audit charter and approved by the Audit Committee.
MBL REP-P M Truter (7079 2569) Page 32 of 104
c) Internal audit should not manage any of the risks on behalf of management.
d) Internal audit should provide advice, challenge, and support to management’s
decision-making, as opposed to taking risk management decisions
themselves.
e) Moreover internal audit cannot give objective assurance on any part of the
ERM framework for which it is responsible. Such assurance should be
provided by other suitably qualified parties.
f) Any work beyond the assurance activities should be recognised as a
consulting engagement and the implementation standards related to such
engagements should be followed (IIA, 2004:3)
The area to the right- hand side of Figure 9 represents all ERM roles that internal
audit should not perform.
Research into the role of internal audit has revealed numerous benefits. These are
presented in a study by Walker, Shenkie and Barton 2003: 53-55. These benefits
are listed below.
a) Internal audits were more effective because ERM enabled the departments
to marshal extensive information about their company’s risk profile and
gauge the extent to which those risk were being managed.
b) Chief Audit Executives were able to operate their departments more
effectively by leveraging ERM resources.
c) Internal audit used their risk analysis developed through their company’s
ERM efforts and applied them to their own planning and execution
processes.
d) ERM allowed for “new thinking” on the part of internal auditing as they
began to think like managers and to focus on business objectives rather
than audit objectives.
e) ERM benefits included greater efficiency within internal auditing, better
inputs to the auditing process, and greater respect for internal auditing
from others within the organisation.
MBL REP-P M Truter (7079 2569) Page 33 of 104
In as much as there is research in support of the internal audits role in ERM, there
is also supporting research in opposition thereof. According to Jackson (2005: 50),
“indeed, the problem with melding ERM and internal auditing isn’t generally finding
areas where CAEs can contribute, it’s making sure they don’t contribute too much.
And therein, of course, lies the rub. It’s easy to say that internal auditing must offer
advice and monitoring. And it’s easy to say that internal auditing must not own risk
or make risk management decisions on management’s behalf. But how do these
obligations and proscriptions play out in the real world? The view on the ground is
far, far less clear.”
Based on this assertion, the researcher will attempt to investigate the role of the
internal audit in the local government and public sectors.
3.5. RISK MANAGEMENT
Risk is defined as the variation of an actual outcome from expected outcome. Risk
therefore implies the presence of uncertainty, if this definition is accepted then the
standard deviation is an appropriate measure of risk (Valsamakis et al.,2005:27). A
distinction is drawn amongst pure, speculative, and fundamental risks, in that pure
risks are concerned with the possibility of a loss or no loss, speculative risks are
those that offer a chance of gain or loss, and fundamental risks arise from losses
that are impersonal in origin and in consequence.
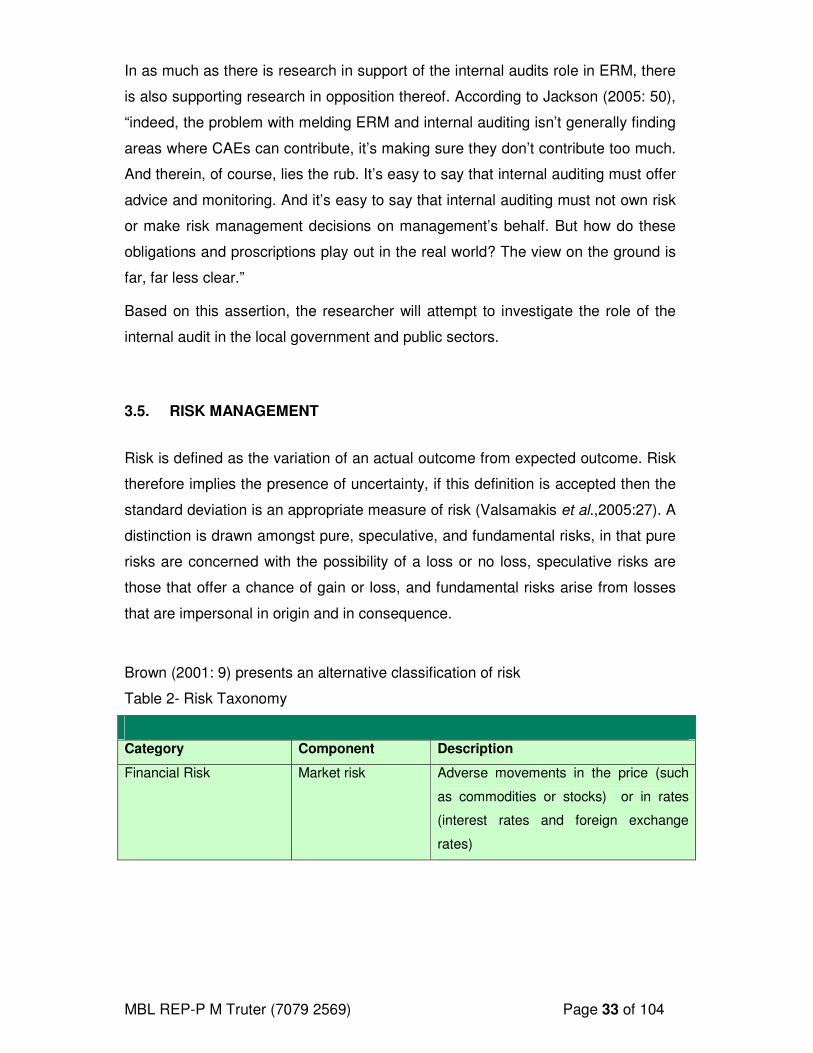
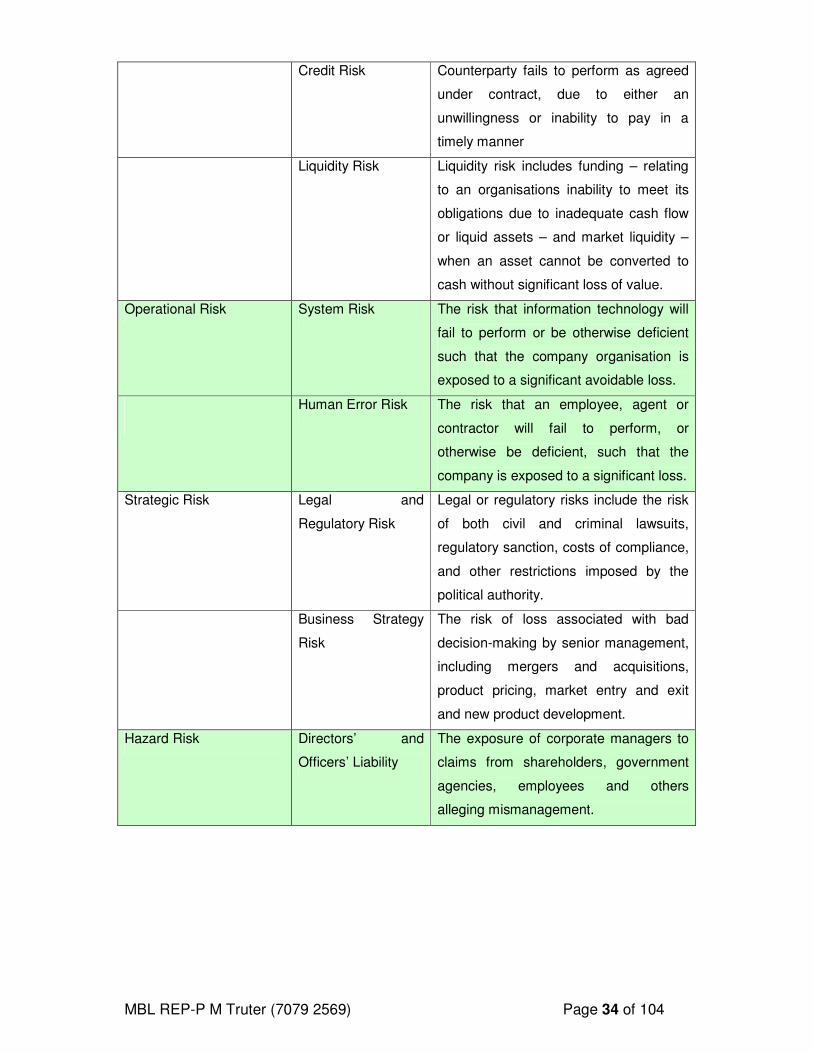
Brown (2001: 9) presents an alternative classification of risk
Table 2- Risk Taxonomy
Category Component Description
Financial Risk Market risk Adverse movements in the price (such
as commodities or stocks) or in rates
(interest rates and foreign exchange
rates)
MBL REP-P M Truter (7079 2569) Page 34 of 104
Credit Risk Counterparty fails to perform as agreed
under contract, due to either an
unwillingness or inability to pay in a
timely manner
Liquidity Risk Liquidity risk includes funding – relating
to an organisations inability to meet its
obligations due to inadequate cash flow
or liquid assets – and market liquidity –
when an asset cannot be converted to
cash without significant loss of value.
Operational Risk System Risk The risk that information technology will
fail to perform or be otherwise deficient
such that the company organisation is
exposed to a significant avoidable loss.
Human Error Risk The risk that an employee, agent or
contractor will fail to perform, or
otherwise be deficient, such that the
company is exposed to a significant loss.
Strategic Risk Legal and
Regulatory Risk
Legal or regulatory risks include the risk
of both civil and criminal lawsuits,
regulatory sanction, costs of compliance,
and other restrictions imposed by the
political authority.
Business Strategy
Risk
The risk of loss associated with bad
decision-making by senior management,
including mergers and acquisitions,
product pricing, market entry and exit
and new product development.
Hazard Risk Directors’ and
Officers’ Liability
The exposure of corporate managers to
claims from shareholders, government
agencies, employees and others
alleging mismanagement.
MBL REP-P M Truter (7079 2569) Page 35 of 104
3.6. THE ROLE OF THE CHIEF RISK OFFICER
“Without effective management, the breath and the magnitude of risks facing the
multinational organisation can easily threaten an organisation’s viability. To address
this challenge, some organisations are adopting an integrated approach that
embraces the totality of risk. An important strategic initiative resulting from this effort
is the emergence of the chief risk officer, who is key to managing and monitoring
enterprise risk.” (Lam & Kawamoto, 1997:30)
The successful implementation of an ERM strategy is influenced by the role of the
Chief Risk Officer (CRO). The key roles according to Russell (2005:04) can be
classified as follows:
a) providing overall leadership, vision and direction;
b) establishing an integrated risk management framework for all levels of risk
across the organisation;
c) developing risk management policies, including the quantification of
management risk profiles through specific risk limits;
d) implementing a set of risk metrics and reports, including losses and
incidents, key risk exposures, and early warning indicators;
e) allocating economic risk capital to business activities based on risk;
f) improving the company’s risk management readiness through
communication and training programmes; and
g) risk based performance measurements and incentives.
The researcher will attempt to confirm whether a similar trend is emerging in the
case of the local and provincial government and public sector.
3.7. CONCLUSION
Risk management is a fundamental element of corporate governance, with
management being the implementing agent of the board tasked with responsibility
for establishing and maintenance of an integrated risk management in line with the
risk tolerances defined by the board. ERM brings many benefits as a result of its
MBL REP-P M Truter (7079 2569) Page 36 of 104
structured system and coordinated approach to managing risk across and
enterprise.
Jablonowski (2006) states that, “the real value of ERM does not come from short-
term gains to profitability. Rather, it lies in a wider view of corporate responsibility, to
its managers, to its employees, to its shareholders, and to the community.”
According Moody (2004), there are several factors still impeding the implementation
of an ERM approach, these issues are mentioned below.
a) A culture of risk awareness has not yet emerged.
b) The importance of governance is still underestimated.
c) Quantifiable risks are still absorbing too much time, with the focus being on
these risks that are most familiar.
d) Compliance is not being turned to competitive advantage.
MBL REP-P M Truter (7079 2569) Page 37 of 104
4. CHAPTER 4: RESEARCH METHODOLOGY
4.1. INTRODUCTION
“Research is a systematic process of collecting, analysing and interpreting
information (data) in order to increase our understanding of the phenomenon in
which we are interested or concerned.” (Leedy, Ellis & Ormond, 2005: 2). As the
body of knowledge in the area of ERM framework implementation in the public sector
is limited, the research will be exploratory.
As the body of knowledge in the area of ERM framework implementation in the
public sector is limited, the study uses the body of knowledge that currently focuses
on the private sector as a basis, and the applicability of the ERM frameworks within
the public sector. The latter is used to develop the items for the research instrument.
A study will be undertaken of the relevant literature in this subject, which includes
books, legislation, official publications, newspaper, research surveys, theses and
dissertations, as well as material from the internet.
This chapter is devoted to research design and will provide details concerning the
target population, sampling frame, data collection, design and secondary research
such a reviewing other similar case studies. These include ….
The study will adopt quantitative research methods in the design of research
instrument as it is deemed the most suitable for the study of this nature. Quantitative
research is used to answer questions about relationships among measured
variables, with the purpose of explaining, predicting, and controlling phenomena.
(Leedy, et al., 2005: 94).
The nature of study is to answer questions about relationships among variables
describes earlier. Qualitative research method in the analysis of literature and
legislation forms the basis of the study.
MBL REP-P M Truter (7079 2569) Page 38 of 104
4.2. TARGET POPULATION
The target population for the research study will be Chief Risk Officers, Senior Risk
Mangers, Internal Auditors, Senior Management, and Risk Managers within local
government and public entities within the Gauteng Province.
Attempts by the researcher to obtain a database of chief risk officers, internal
auditors, and senior managers proved fruitless. In the absence of a database, the
researcher selected the sample based on personal judgment. “In purposive
sampling, people or other units are chosen, as the name implies, for a particular
purpose. For instance, we might choose people who we have decided are ‘typical’
of a group or those who represent diverse perspectives on an issue” (Leedy, et al.,
2005: 206).
Therefore, the sample selected for the study represents the typical group or sample
population and deemed sufficient to give responses that are generalizable to the
population of public officials within risk management.
4.3. DATA COLLECTION
The primary data collection will be achieved through questionnaires, which will be e-
mailed to Chief Risk Officers Internal Auditors, and Senior Management. The
measurement instrument will be a questionnaire that will consist of both closed-
ended and open-ended questions and will be distributed via email.
4.4. DATA ANALYSIS
The quantitative data collected will be analysed by means of SPSS Version 14
software. The objective of data analysis is to determine the relationship between the
concepts, constructs and variables. The analysis process will involve editing
(checking for omissions, classification, and consistency) and coding. Relationships
between variables will be explored and results checked, to determine whether they
are consistent with the research propositions and theories. Conclusions will be
drawn, based on the analyses.
MBL REP-P M Truter (7079 2569) Page 39 of 104
Since the questionnaires will be structured in a way that allows for easy analysis of
data. The minimum response rate was 32 questionnaires.
4.5. THE INSTRUMENT OF MEASUREMENT
Prior to the questionnaires being distributed, a pilot study was undertaken with chief
risk officers, senior managers, internal auditors and research analyst to ensure
relevance of the questionnaire. The guidelines listed below were considered in the
formulation of the questionnaire.
• Why are these questions being asked?
• Be clear and concise.
• Response choices should not overlap.
• Use natural and familiar language.
• Do not use words or phrases that show bias.
• Avoid double-barrelled, or ambiguous, questions.
• Provide explicit alternatives.
• Questions should be reliable and valid.
Aspects of the pilot study included:
• to determine whether the guidelines provided were adequate;
• that questions were correctly ordered;
• whether some questions were unclear or needed additional or supporting
details to explain; and
• to determine whether the questions would be understood by all possible
respondent.
4.6. RESEARCH ETHICS
During the research the ethical guidelines discussed below as presented in
Leedy (et al., 2005: 102) were followed.
MBL REP-P M Truter (7079 2569) Page 40 of 104
a) Informed Consent – all research participants were personally contacted by
the researcher and were invited to participate in the study, following which
the research questionnaire was mailed. Therefore the participants were
aware that the completion of the research questionnaire was voluntary.
b) Right to Privacy – as the study focused on persons in senior management
within local, provincial government and public entities their assessment of
ERM and Governance was viewed as being confidential.
c) Honesty with professional colleagues – all report findings and questionnaire
were to be captured as completed by the participants. In addition, in no way
was data be fabricated to support a particular conclusion.
4.7. RESEARCH PROPOSITIONS
Based on the research questions and literature review the following research
propositions were formulated.
Research Proposition 1
This was to investigate the perceived relationship between ERM and corporate
Governance.
Research Proposition 2
This was to investigate the perceived relationship between ERM and communication
about risk management.
Research Proposition 3
This was to investigate the perceived relationship between the implementation of
ERM and the role of the auditor.
4.8. ANALYSIS
4.8.1. Descriptive Statistics
Descriptive statistics were used to provide simple summaries about the sample and
the measure. This allows a large amount of data to be presented in an easy to
understand form.
MBL REP-P M Truter (7079 2569) Page 41 of 104
4.8.2. Inferential Statistics
When the focus of analysis is on estimation or hypothesis-testing, the sample is
used to make inferences about the population. This process is formally known as
statistical inferences and the various techniques that are employed are commonly
referred to as inferential statistics. (Diamantopoulos & Schlegelmilch, 2004: 65).
4.8.3. Factor Analysis
The purpose here was to exam the correlations among a number of variables and
identify the cluster of highly interrelated variables that reflect underlying themes or
factors, within the data. (Leedy et al., 2005: 274).
4.8.4. Reliability Analysis
Cronbach's Alpha was used to measure how well a set of items (or variables)
measures a single unidimensional latent construct. When data have a
multidimensional structure, Cronbach's Alpha will usually be low. Technically
speaking, Cronbach's Alpha is not a statistical test - it is a coefficient of reliability (or
consistency). http://www.ats.ucla.edu/STAT/SPSS
4.8.5. The Krusal– Wallis (K-W) Test
The Krusal–Wallis one – way ANOVA tests the same hypothesis as the Mann-
Whitney U Test but across k rather than two groups. In a manner similar to the use
of the Mann-Whitney U Test as a non-parametric alternative to the t-test for
differences between two means (Diamantopoulos et al., 2004: 183).
4.8.6. The Mann-Whitney U Test
The Mann-Whitney U test is a very useful when you have two groups to compare on
variable which is measured at ordinal level. The test focuses on differences in central
MBL REP-P M Truter (7079 2569) Page 42 of 104
location and assumes that any differences in the distributions of the two populations
are due only to the differences in locations.
The null hypothesis tested by the Mann and Whitney U test is that there is no
difference between the two groups in terms of location, focusing on the median as a
measure of central tendency. (Diamantopoulos et al., 2004: 181).
4.9. REPORTING RESULTS
Upon completion of the statistical analysis, a research report was compiled for
submission to the SBL in partial fulfillment of the Masters of Business Leadership
4.10. CONCLUSION
This chapter gave an insight on the methodology of the research to be followed in
collecting data. It also highlights the sample size, measurement instruments,
hypothesis, qualitative and quantitative approaches. The research design is also
discussed in the chapter
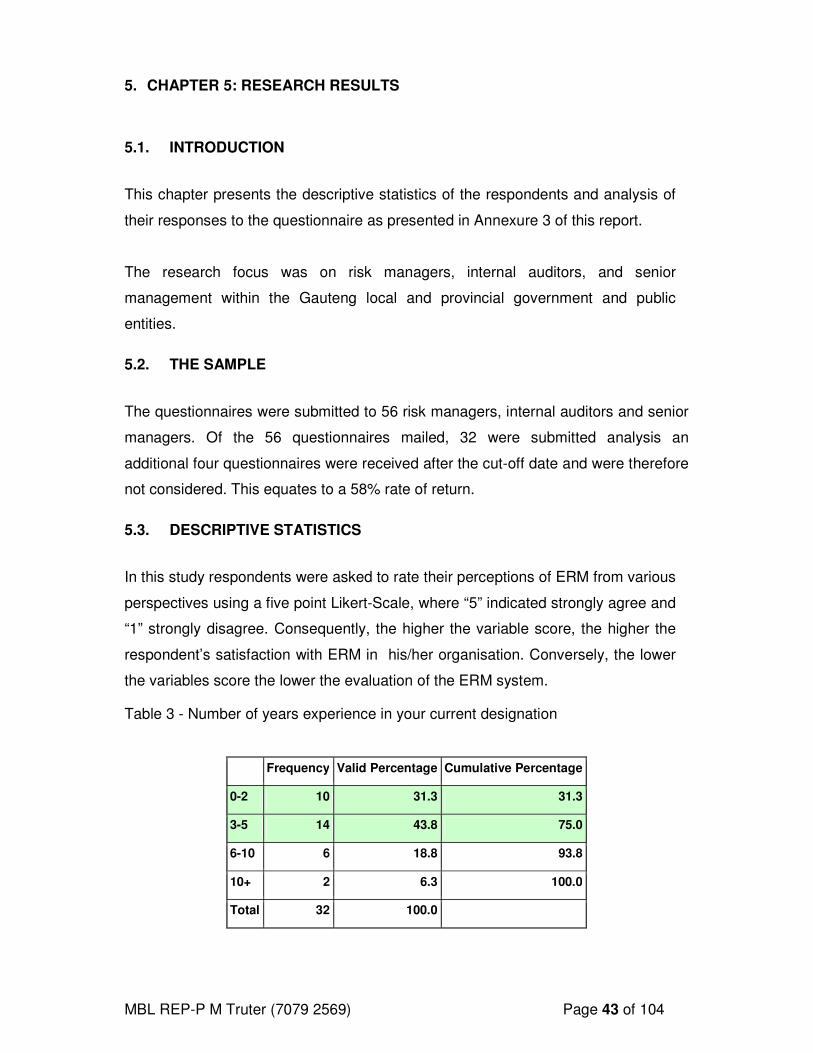
MBL REP-P M Truter (7079 2569) Page 43 of 104
5. CHAPTER 5: RESEARCH RESULTS
5.1. INTRODUCTION
This chapter presents the descriptive statistics of the respondents and analysis of
their responses to the questionnaire as presented in Annexure 3 of this report.
The research focus was on risk managers, internal auditors, and senior
management within the Gauteng local and provincial government and public
entities.
5.2. THE SAMPLE
The questionnaires were submitted to 56 risk managers, internal auditors and senior
managers. Of the 56 questionnaires mailed, 32 were submitted analysis an
additional four questionnaires were received after the cut-off date and were therefore
not considered. This equates to a 58% rate of return.
5.3. DESCRIPTIVE STATISTICS
In this study respondents were asked to rate their perceptions of ERM from various
perspectives using a five point Likert-Scale, where “5” indicated strongly agree and
“1” strongly disagree. Consequently, the higher the variable score, the higher the
respondent’s satisfaction with ERM in his/her organisation. Conversely, the lower
the variables score the lower the evaluation of the ERM system.
Table 3 - Number of years experience in your current designation
Frequency Valid Percentage Cumulative Percentage
0-2 10 31.3 31.3
3-5 14 43.8 75.0
6-10 6 18.8 93.8
10+ 2 6.3 100.0
Total 32 100.0
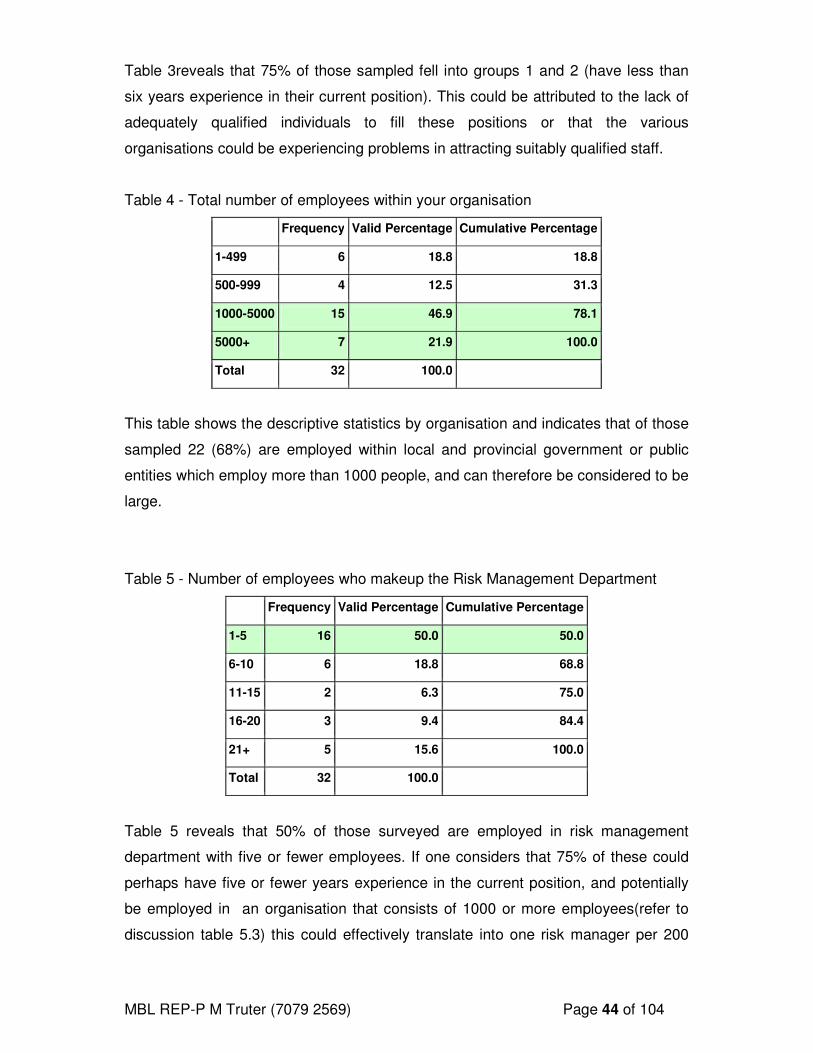
MBL REP-P M Truter (7079 2569) Page 44 of 104
Table 3reveals that 75% of those sampled fell into groups 1 and 2 (have less than
six years experience in their current position). This could be attributed to the lack of
adequately qualified individuals to fill these positions or that the various
organisations could be experiencing problems in attracting suitably qualified staff.
Table 4 - Total number of employees within your organisation
Frequency Valid Percentage Cumulative Percentage
1-499 6 18.8 18.8
500-999 4 12.5 31.3
1000-5000 15 46.9 78.1
5000+ 7 21.9 100.0
Total 32 100.0
This table shows the descriptive statistics by organisation and indicates that of those
sampled 22 (68%) are employed within local and provincial government or public
entities which employ more than 1000 people, and can therefore be considered to be
large.
Table 5 - Number of employees who makeup the Risk Management Department
Frequency Valid Percentage Cumulative Percentage
1-5 16 50.0 50.0
6-10 6 18.8 68.8
11-15 2 6.3 75.0
16-20 3 9.4 84.4
21+ 5 15.6 100.0
Total 32 100.0
Table 5 reveals that 50% of those surveyed are employed in risk management
department with five or fewer employees. If one considers that 75% of these could
perhaps have five or fewer years experience in the current position, and potentially
be employed in an organisation that consists of 1000 or more employees(refer to
discussion table 5.3) this could effectively translate into one risk manager per 200
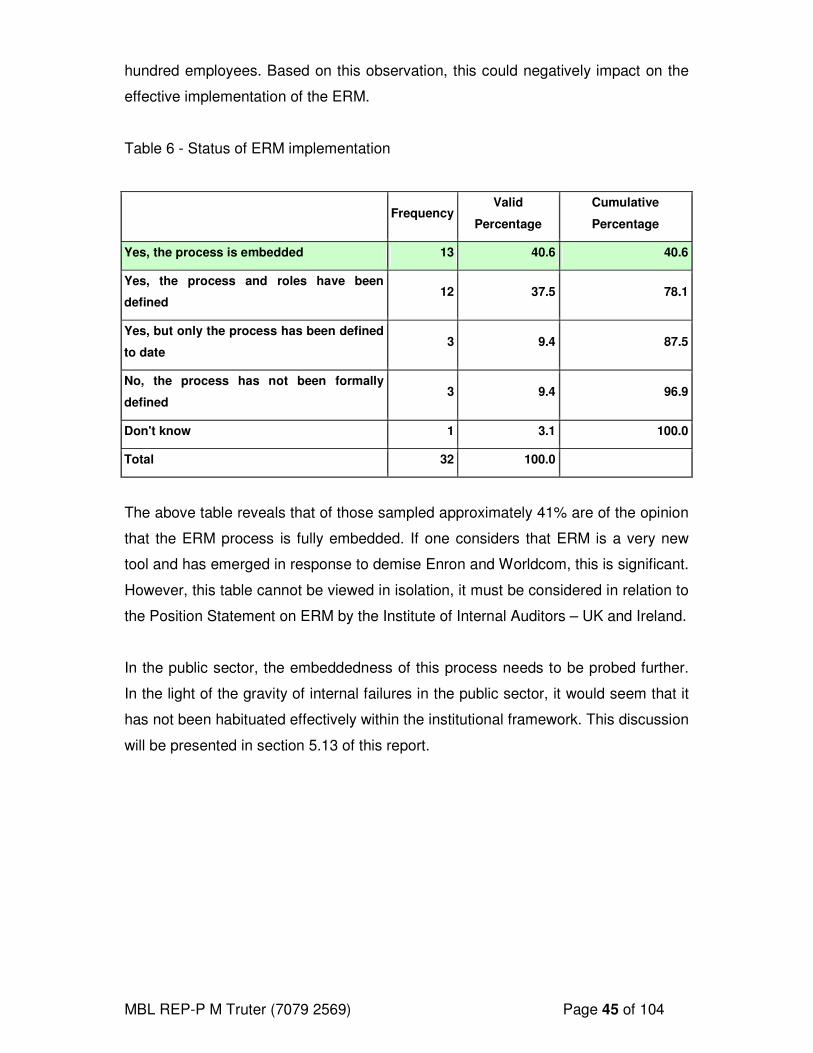
MBL REP-P M Truter (7079 2569) Page 45 of 104
hundred employees. Based on this observation, this could negatively impact on the
effective implementation of the ERM.
Table 6 - Status of ERM implementation
Frequency Valid
Percentage
Cumulative
Percentage
Yes, the process is embedded 13 40.6 40.6
Yes, the process and roles have been
defined 12 37.5 78.1
Yes, but only the process has been defined
to date 3 9.4 87.5
No, the process has not been formally
defined 3 9.4 96.9
Don't know 1 3.1 100.0
Total 32 100.0
The above table reveals that of those sampled approximately 41% are of the opinion
that the ERM process is fully embedded. If one considers that ERM is a very new
tool and has emerged in response to demise Enron and Worldcom, this is significant.
However, this table cannot be viewed in isolation, it must be considered in relation to
the Position Statement on ERM by the Institute of Internal Auditors – UK and Ireland.
In the public sector, the embeddedness of this process needs to be probed further.
In the light of the gravity of internal failures in the public sector, it would seem that it
has not been habituated effectively within the institutional framework. This discussion
will be presented in section 5.13 of this report.
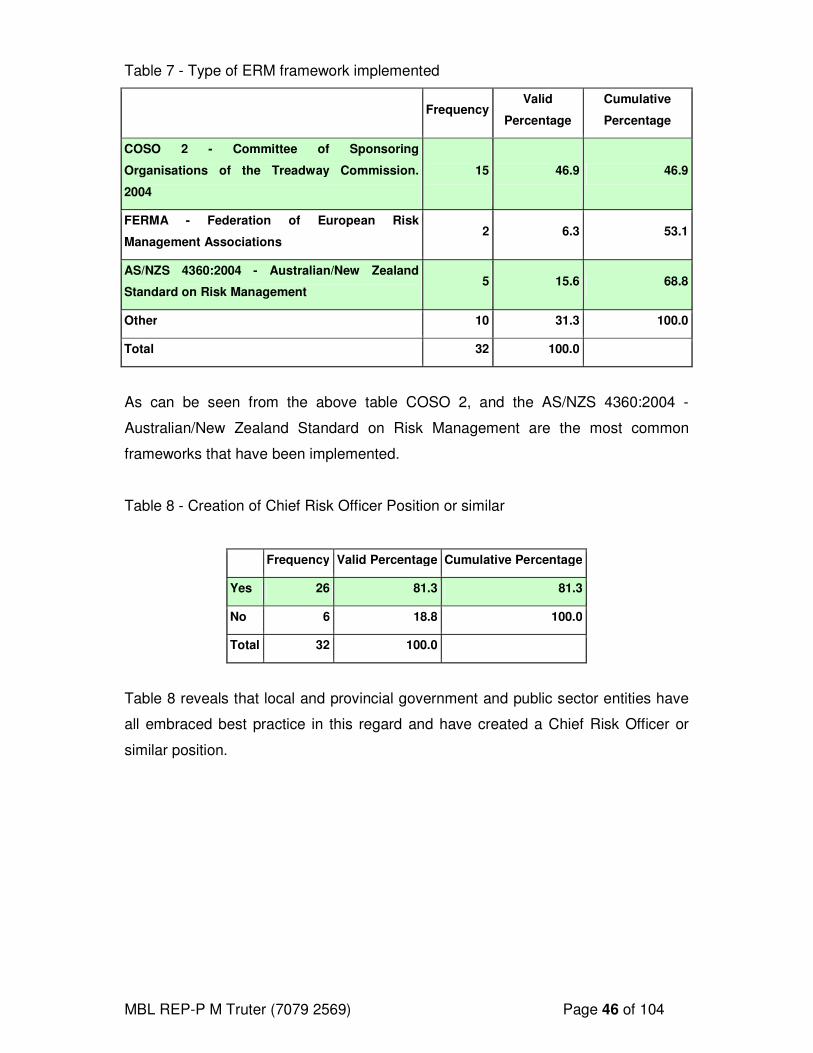
MBL REP-P M Truter (7079 2569) Page 46 of 104
Table 7 - Type of ERM framework implemented
Frequency Valid
Percentage
Cumulative
Percentage
COSO 2 - Committee of Sponsoring
Organisations of the Treadway Commission.
2004
15 46.9 46.9
FERMA - Federation of European Risk
Management Associations 2 6.3 53.1
AS/NZS 4360:2004 - Australian/New Zealand
Standard on Risk Management 5 15.6 68.8
Other 10 31.3 100.0
Total 32 100.0
As can be seen from the above table COSO 2, and the AS/NZS 4360:2004 -
Australian/New Zealand Standard on Risk Management are the most common
frameworks that have been implemented.
Table 8 - Creation of Chief Risk Officer Position or similar
Frequency Valid Percentage Cumulative Percentage
Yes 26 81.3 81.3
No 6 18.8 100.0
Total 32 100.0
Table 8 reveals that local and provincial government and public sector entities have
all embraced best practice in this regard and have created a Chief Risk Officer or
similar position.
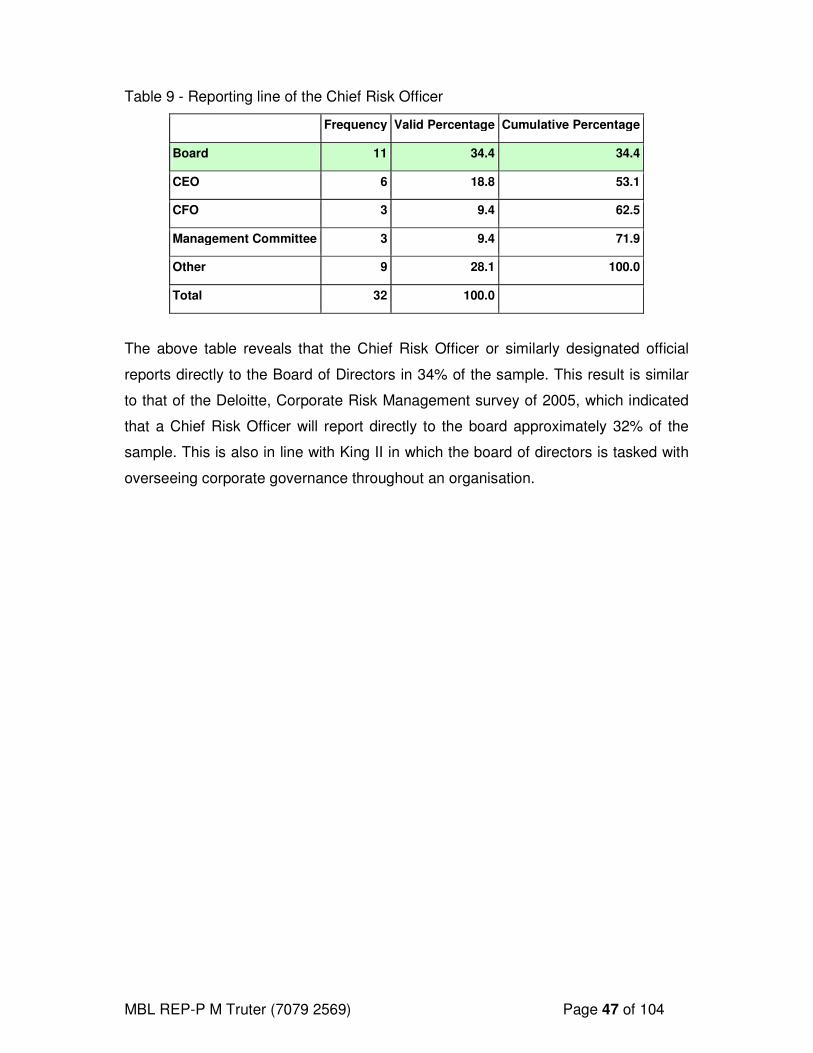
MBL REP-P M Truter (7079 2569) Page 47 of 104
Table 9 - Reporting line of the Chief Risk Officer
Frequency Valid Percentage Cumulative Percentage
Board 11 34.4 34.4
CEO 6 18.8 53.1
CFO 3 9.4 62.5
Management Committee 3 9.4 71.9
Other 9 28.1 100.0
Total 32 100.0
The above table reveals that the Chief Risk Officer or similarly designated official
reports directly to the Board of Directors in 34% of the sample. This result is similar
to that of the Deloitte, Corporate Risk Management survey of 2005, which indicated
that a Chief Risk Officer will report directly to the board approximately 32% of the
sample. This is also in line with King II in which the board of directors is tasked with
overseeing corporate governance throughout an organisation.
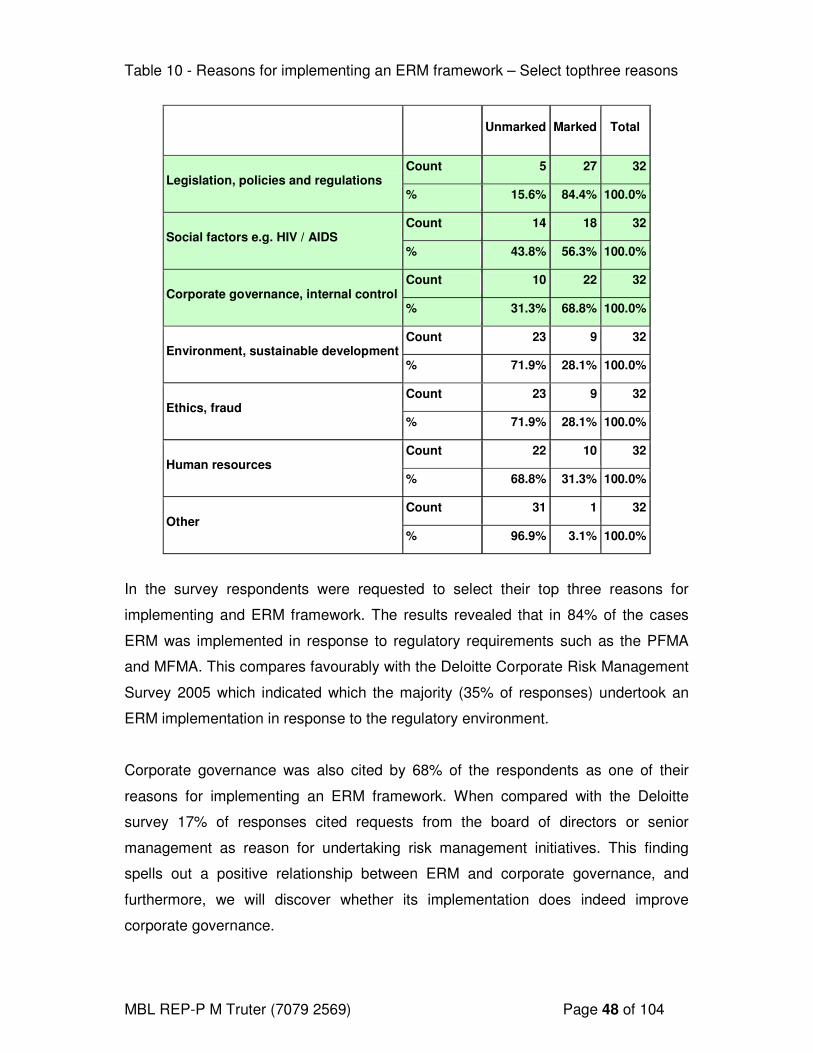
MBL REP-P M Truter (7079 2569) Page 48 of 104
Table 10 - Reasons for implementing an ERM framework – Select topthree reasons
Unmarked Marked Total
Legislation, policies and regulations Count 5 27 32
% 15.6% 84.4% 100.0%
Social factors e.g. HIV / AIDS Count 14 18 32
% 43.8% 56.3% 100.0%
Corporate governance, internal control Count 10 22 32
% 31.3% 68.8% 100.0%
Environment, sustainable development Count 23 9 32
% 71.9% 28.1% 100.0%
Ethics, fraud Count 23 9 32
% 71.9% 28.1% 100.0%
Human resources Count 22 10 32
% 68.8% 31.3% 100.0%
Other Count 31 1 32
% 96.9% 3.1% 100.0%
In the survey respondents were requested to select their top three reasons for
implementing and ERM framework. The results revealed that in 84% of the cases
ERM was implemented in response to regulatory requirements such as the PFMA
and MFMA. This compares favourably with the Deloitte Corporate Risk Management
Survey 2005 which indicated which the majority (35% of responses) undertook an
ERM implementation in response to the regulatory environment.
Corporate governance was also cited by 68% of the respondents as one of their
reasons for implementing an ERM framework. When compared with the Deloitte
survey 17% of responses cited requests from the board of directors or senior
management as reason for undertaking risk management initiatives. This finding
spells out a positive relationship between ERM and corporate governance, and
furthermore, we will discover whether its implementation does indeed improve
corporate governance.
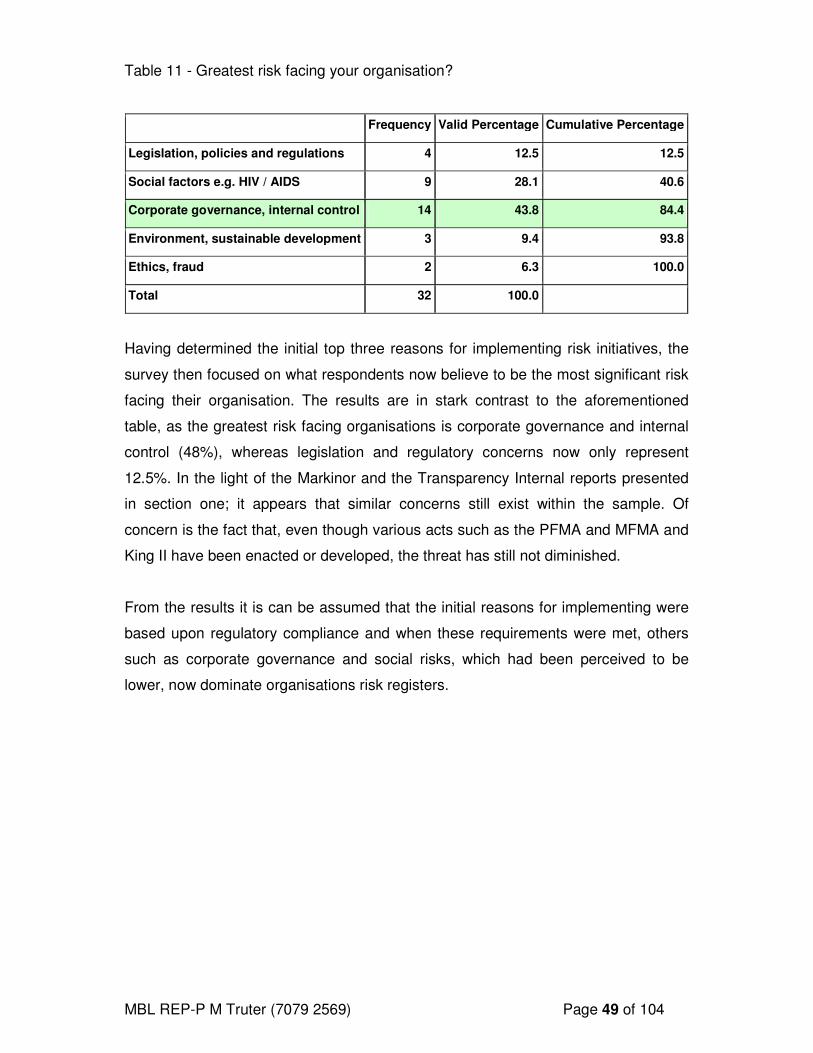
MBL REP-P M Truter (7079 2569) Page 49 of 104
Table 11 - Greatest risk facing your organisation?
Frequency Valid Percentage Cumulative Percentage
Legislation, policies and regulations 4 12.5 12.5
Social factors e.g. HIV / AIDS 9 28.1 40.6
Corporate governance, internal control 14 43.8 84.4
Environment, sustainable development 3 9.4 93.8
Ethics, fraud 2 6.3 100.0
Total 32 100.0
Having determined the initial top three reasons for implementing risk initiatives, the
survey then focused on what respondents now believe to be the most significant risk
facing their organisation. The results are in stark contrast to the aforementioned
table, as the greatest risk facing organisations is corporate governance and internal
control (48%), whereas legislation and regulatory concerns now only represent
12.5%. In the light of the Markinor and the Transparency Internal reports presented
in section one; it appears that similar concerns still exist within the sample. Of
concern is the fact that, even though various acts such as the PFMA and MFMA and
King II have been enacted or developed, the threat has still not diminished.
From the results it is can be assumed that the initial reasons for implementing were
based upon regulatory compliance and when these requirements were met, others
such as corporate governance and social risks, which had been perceived to be
lower, now dominate organisations risk registers.
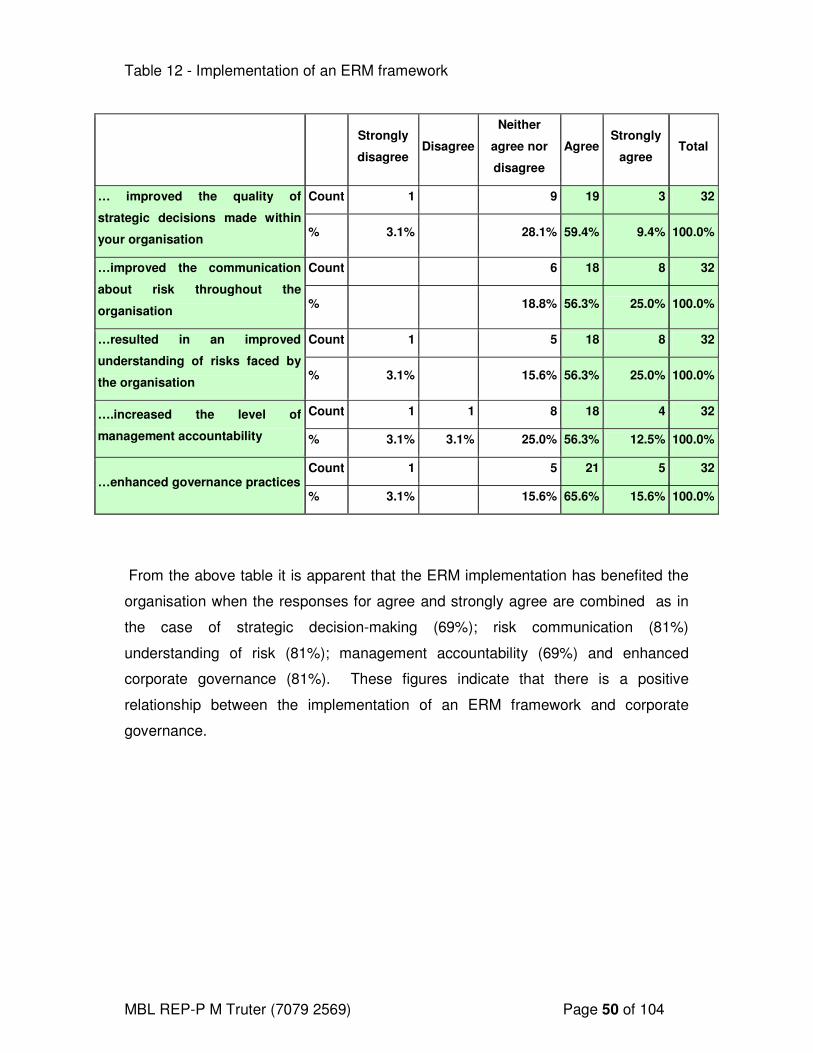
MBL REP-P M Truter (7079 2569) Page 50 of 104
Table 12 - Implementation of an ERM framework
Strongly
disagree Disagree
Neither
agree nor
disagree
Agree Strongly
agree Total
… improved the quality of
strategic decisions made within
your organisation
Count 1 9 19 3 32
% 3.1% 28.1% 59.4% 9.4% 100.0%
…improved the communication
about risk throughout the
organisation
Count 6 18 8 32
% 18.8% 56.3% 25.0% 100.0%
…resulted in an improved
understanding of risks faced by
the organisation
Count 1 5 18 8 32
% 3.1% 15.6% 56.3% 25.0% 100.0%
….increased the level of
management accountability
Count 1 1 8 18 4 32
% 3.1% 3.1% 25.0% 56.3% 12.5% 100.0%
…enhanced governance practices Count 1 5 21 5 32
% 3.1% 15.6% 65.6% 15.6% 100.0%
From the above table it is apparent that the ERM implementation has benefited the
organisation when the responses for agree and strongly agree are combined as in
the case of strategic decision-making (69%); risk communication (81%)
understanding of risk (81%); management accountability (69%) and enhanced
corporate governance (81%). These figures indicate that there is a positive
relationship between the implementation of an ERM framework and corporate
governance.
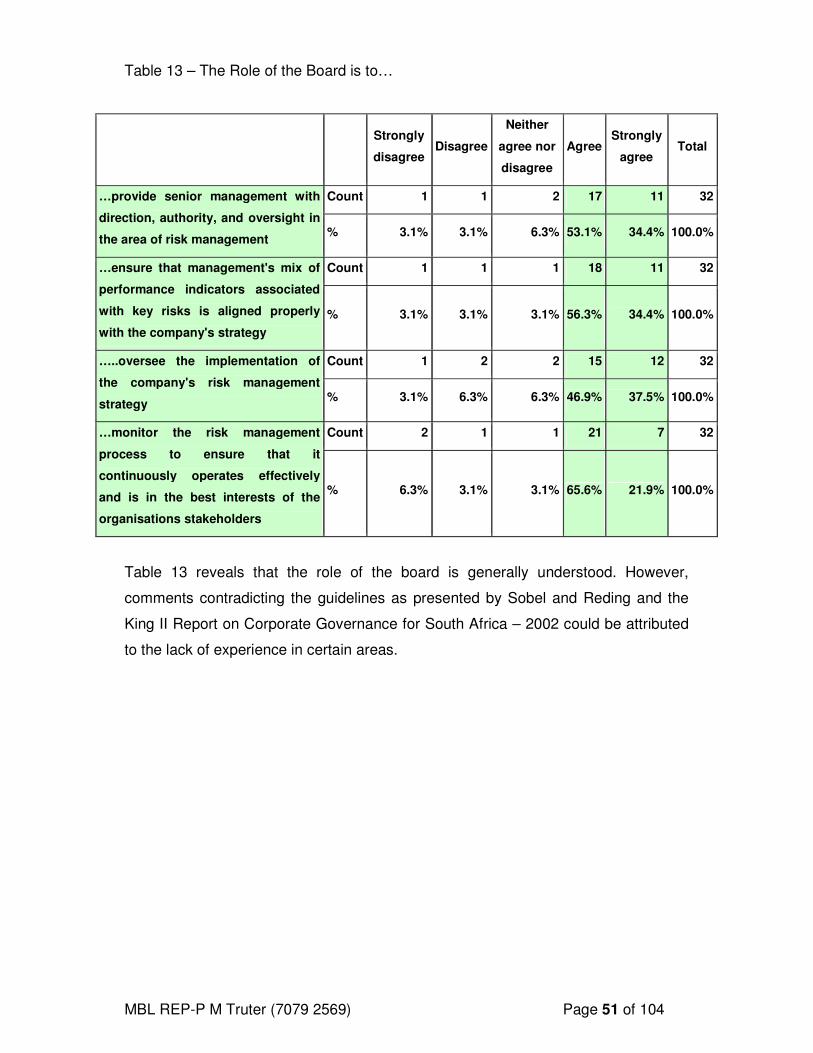
MBL REP-P M Truter (7079 2569) Page 51 of 104
Table 13 – The Role of the Board is to…
Strongly
disagree Disagree
Neither
agree nor
disagree
Agree Strongly
agree Total
…provide senior management with
direction, authority, and oversight in
the area of risk management
Count 1 1 2 17 11 32
% 3.1% 3.1% 6.3% 53.1% 34.4% 100.0%
…ensure that management's mix of
performance indicators associated
with key risks is aligned properly
with the company's strategy
Count 1 1 1 18 11 32
% 3.1% 3.1% 3.1% 56.3% 34.4% 100.0%
…..oversee the implementation of
the company's risk management
strategy
Count 1 2 2 15 12 32
% 3.1% 6.3% 6.3% 46.9% 37.5% 100.0%
…monitor the risk management
process to ensure that it
continuously operates effectively
and is in the best interests of the
organisations stakeholders
Count 2 1 1 21 7 32
% 6.3% 3.1% 3.1% 65.6% 21.9% 100.0%
Table 13 reveals that the role of the board is generally understood. However,
comments contradicting the guidelines as presented by Sobel and Reding and the
King II Report on Corporate Governance for South Africa – 2002 could be attributed
to the lack of experience in certain areas.
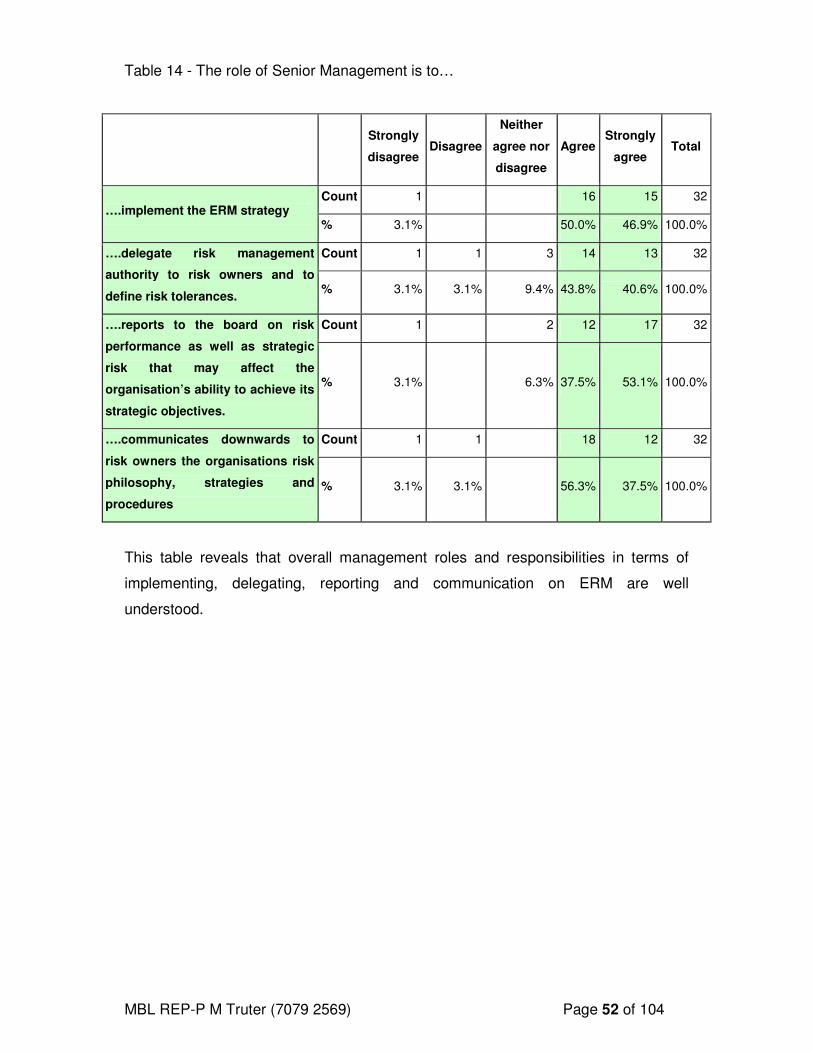
MBL REP-P M Truter (7079 2569) Page 52 of 104
Table 14 - The role of Senior Management is to…
Strongly
disagree Disagree
Neither
agree nor
disagree
Agree Strongly
agree Total
….implement the ERM strategy Count 1 16 15 32
% 3.1% 50.0% 46.9% 100.0%
….delegate risk management
authority to risk owners and to
define risk tolerances.
Count 1 1 3 14 13 32
% 3.1% 3.1% 9.4% 43.8% 40.6% 100.0%
….reports to the board on risk
performance as well as strategic
risk that may affect the
organisation’s ability to achieve its
strategic objectives.
Count 1 2 12 17 32
% 3.1% 6.3% 37.5% 53.1% 100.0%
….communicates downwards to
risk owners the organisations risk
philosophy, strategies and
procedures
Count 1 1 18 12 32
% 3.1% 3.1% 56.3% 37.5% 100.0%
This table reveals that overall management roles and responsibilities in terms of
implementing, delegating, reporting and communication on ERM are well
understood.
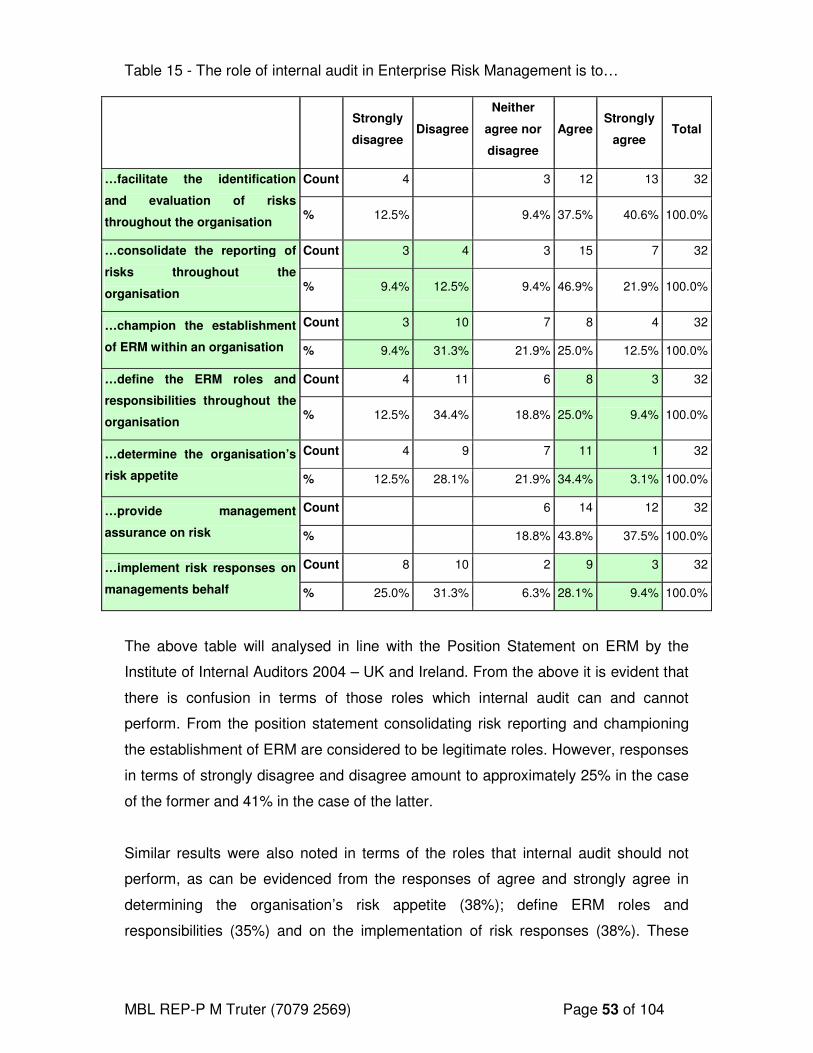
MBL REP-P M Truter (7079 2569) Page 53 of 104
Table 15 - The role of internal audit in Enterprise Risk Management is to…
Strongly
disagree Disagree
Neither
agree nor
disagree
Agree Strongly
agree Total
…facilitate the identification
and evaluation of risks
throughout the organisation
Count 4 3 12 13 32
% 12.5% 9.4% 37.5% 40.6% 100.0%
…consolidate the reporting of
risks throughout the
organisation
Count 3 4 3 15 7 32
% 9.4% 12.5% 9.4% 46.9% 21.9% 100.0%
…champion the establishment
of ERM within an organisation
Count 3 10 7 8 4 32
% 9.4% 31.3% 21.9% 25.0% 12.5% 100.0%
…define the ERM roles and
responsibilities throughout the
organisation
Count 4 11 6 8 3 32
% 12.5% 34.4% 18.8% 25.0% 9.4% 100.0%
…determine the organisation’s
risk appetite
Count 4 9 7 11 1 32
% 12.5% 28.1% 21.9% 34.4% 3.1% 100.0%
…provide management
assurance on risk
Count 6 14 12 32
% 18.8% 43.8% 37.5% 100.0%
…implement risk responses on
managements behalf
Count 8 10 2 9 3 32
% 25.0% 31.3% 6.3% 28.1% 9.4% 100.0%
The above table will analysed in line with the Position Statement on ERM by the
Institute of Internal Auditors 2004 – UK and Ireland. From the above it is evident that
there is confusion in terms of those roles which internal audit can and cannot
perform. From the position statement consolidating risk reporting and championing
the establishment of ERM are considered to be legitimate roles. However, responses
in terms of strongly disagree and disagree amount to approximately 25% in the case
of the former and 41% in the case of the latter.
Similar results were also noted in terms of the roles that internal audit should not
perform, as can be evidenced from the responses of agree and strongly agree in
determining the organisation’s risk appetite (38%); define ERM roles and
responsibilities (35%) and on the implementation of risk responses (38%). These
MBL REP-P M Truter (7079 2569) Page 54 of 104
results indicate that confusion still exists around the role of internal audit in ERM.
This could also be attributed to a lack of experience by internal auditors in the area
of ERM, or that their role as defined in the position statement is not fully understood.
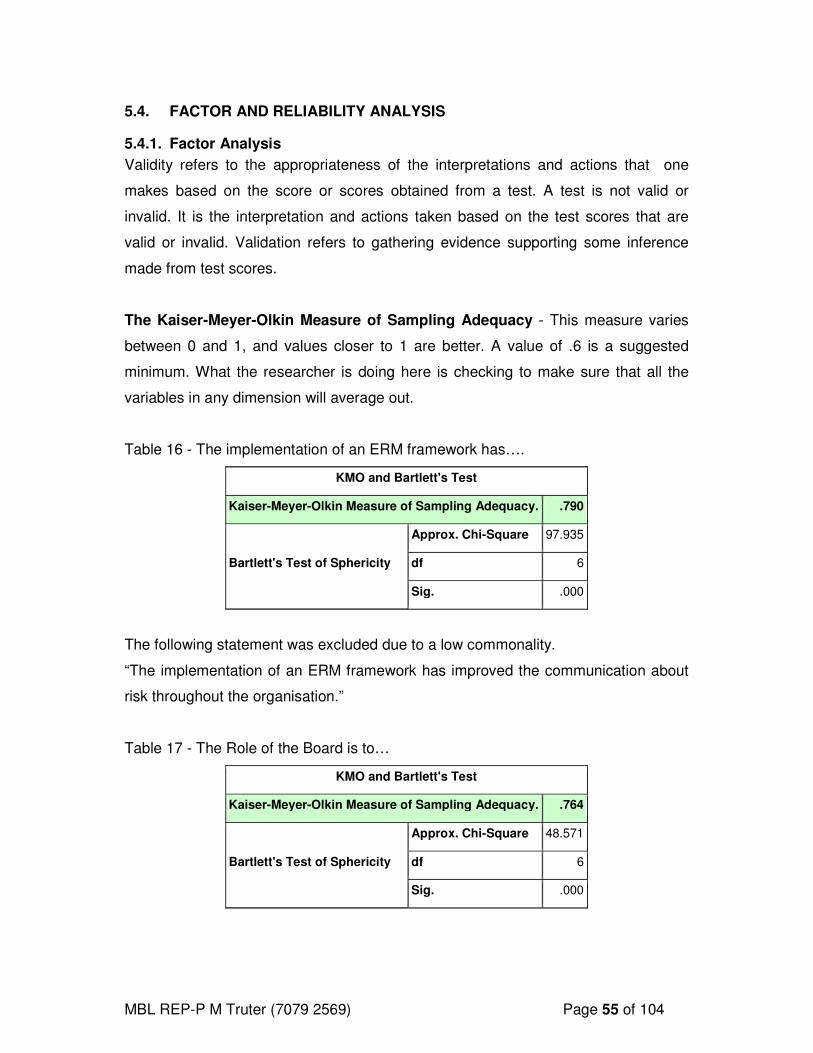
MBL REP-P M Truter (7079 2569) Page 55 of 104
5.4. FACTOR AND RELIABILITY ANALYSIS
5.4.1. Factor Analysis
Validity refers to the appropriateness of the interpretations and actions that one
makes based on the score or scores obtained from a test. A test is not valid or
invalid. It is the interpretation and actions taken based on the test scores that are
valid or invalid. Validation refers to gathering evidence supporting some inference
made from test scores.
The Kaiser-Meyer-Olkin Measure of Sampling Adequacy - This measure varies
between 0 and 1, and values closer to 1 are better. A value of .6 is a suggested
minimum. What the researcher is doing here is checking to make sure that all the
variables in any dimension will average out.
Table 16 - The implementation of an ERM framework has….
KMO and Bartlett's Test
Kaiser-Meyer-Olkin Measure of Sampling Adequacy. .790
Bartlett's Test of Sphericity
Approx. Chi-Square 97.935
df 6
Sig. .000
The following statement was excluded due to a low commonality.
“The implementation of an ERM framework has improved the communication about
risk throughout the organisation.”
Table 17 - The Role of the Board is to…
KMO and Bartlett's Test
Kaiser-Meyer-Olkin Measure of Sampling Adequacy. .764
Bartlett's Test of Sphericity
Approx. Chi-Square 48.571
df 6
Sig. .000
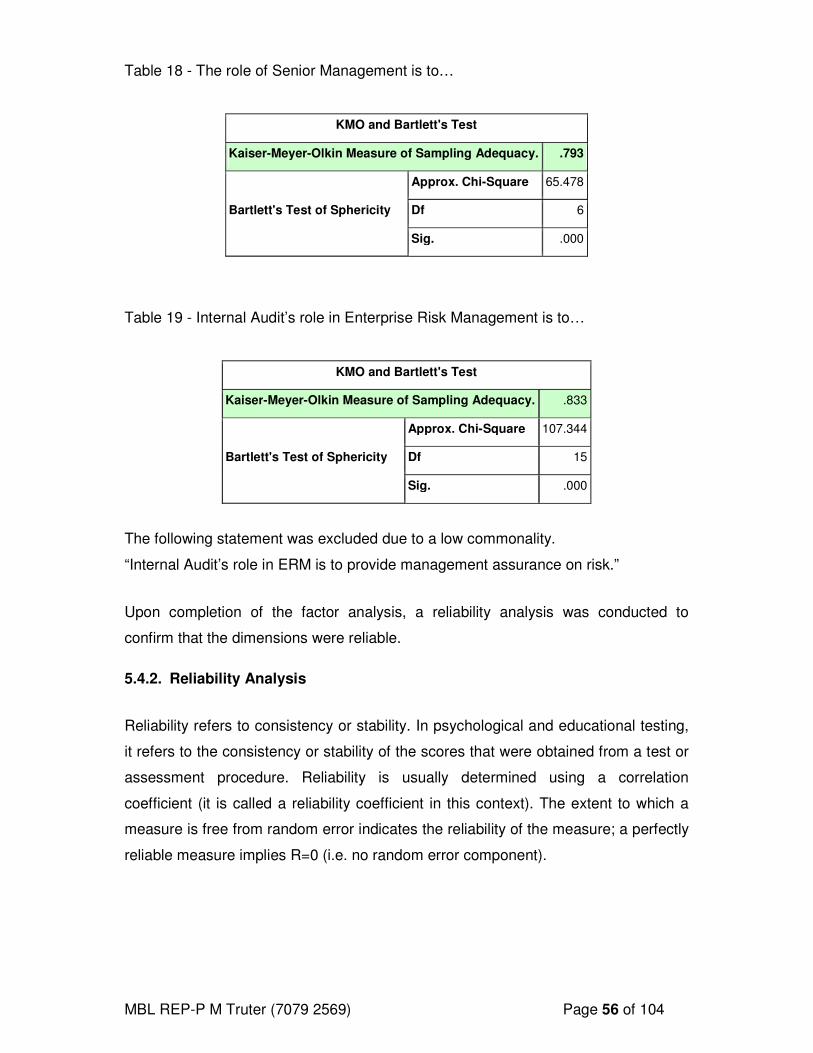
MBL REP-P M Truter (7079 2569) Page 56 of 104
Table 18 - The role of Senior Management is to…
KMO and Bartlett's Test
Kaiser-Meyer-Olkin Measure of Sampling Adequacy. .793
Bartlett's Test of Sphericity
Approx. Chi-Square 65.478
Df 6
Sig. .000
Table 19 - Internal Audit’s role in Enterprise Risk Management is to…
KMO and Bartlett's Test
Kaiser-Meyer-Olkin Measure of Sampling Adequacy. .833
Bartlett's Test of Sphericity
Approx. Chi-Square 107.344
Df 15
Sig. .000
The following statement was excluded due to a low commonality.
“Internal Audit’s role in ERM is to provide management assurance on risk.”
Upon completion of the factor analysis, a reliability analysis was conducted to
confirm that the dimensions were reliable.
5.4.2. Reliability Analysis
Reliability refers to consistency or stability. In psychological and educational testing,
it refers to the consistency or stability of the scores that were obtained from a test or
assessment procedure. Reliability is usually determined using a correlation
coefficient (it is called a reliability coefficient in this context). The extent to which a
measure is free from random error indicates the reliability of the measure; a perfectly
reliable measure implies R=0 (i.e. no random error component).
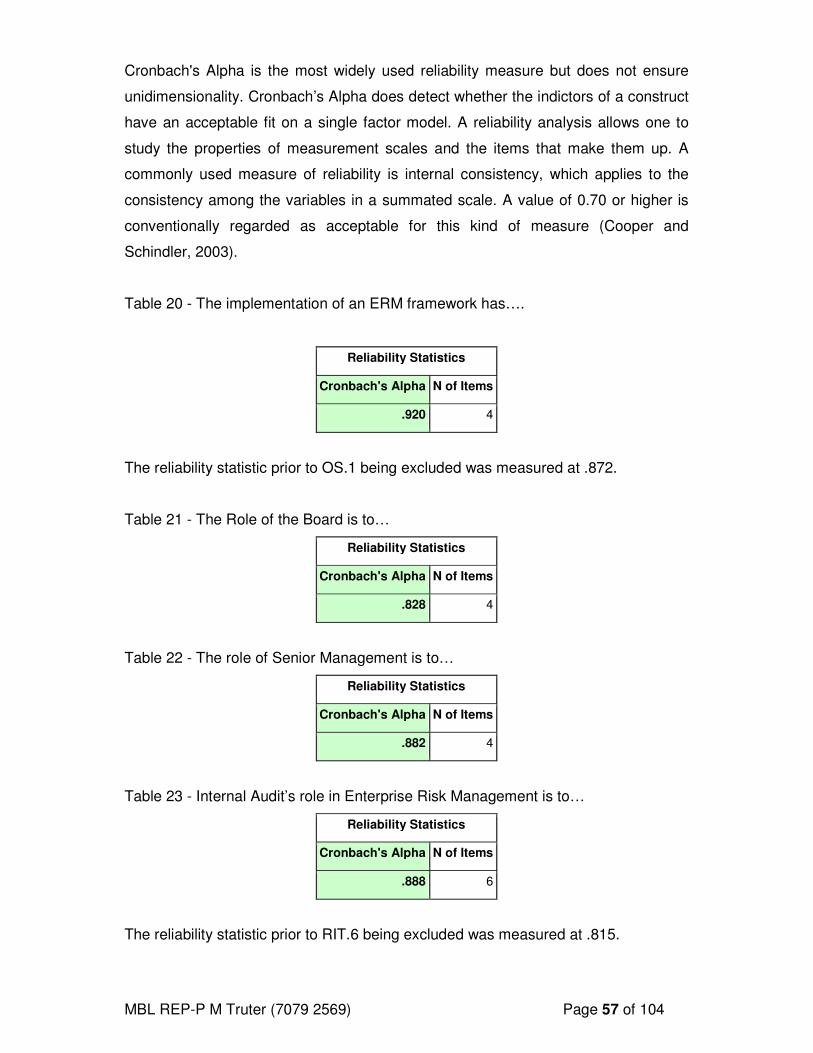
MBL REP-P M Truter (7079 2569) Page 57 of 104
Cronbach's Alpha is the most widely used reliability measure but does not ensure
unidimensionality. Cronbach’s Alpha does detect whether the indictors of a construct
have an acceptable fit on a single factor model. A reliability analysis allows one to
study the properties of measurement scales and the items that make them up. A
commonly used measure of reliability is internal consistency, which applies to the
consistency among the variables in a summated scale. A value of 0.70 or higher is
conventionally regarded as acceptable for this kind of measure (Cooper and
Schindler, 2003).
Table 20 - The implementation of an ERM framework has….
Reliability Statistics
Cronbach's Alpha N of Items
.920 4
The reliability statistic prior to OS.1 being excluded was measured at .872.
Table 21 - The Role of the Board is to…
Reliability Statistics
Cronbach's Alpha N of Items
.828 4
Table 22 - The role of Senior Management is to…
Reliability Statistics
Cronbach's Alpha N of Items
.882 4
Table 23 - Internal Audit’s role in Enterprise Risk Management is to…
Reliability Statistics
Cronbach's Alpha N of Items
.888 6
The reliability statistic prior to RIT.6 being excluded was measured at .815.
MBL REP-P M Truter (7079 2569) Page 58 of 104
As can be seen in previous tables, all Cronbach's Alpha values are well in excess of
0.7, which indicates that the questionnaire has a high degree of internal consistency.
5.5. Variable Analysis
Following the calculations of dimensions, tests to investigate how the various groups
perceived ERM were carried out. Due to the exploratory nature, the sample size was
relatively low; normally the use T-Tests and AONVA’s would be used. However, in
this case non-parametric alternatives to these tests, such as the Kruskal-Wallis and
Mann-Whitney Test were used. In preparation for this analysis. These initial results
were recoded and are presented in Annexure 3 of this report.
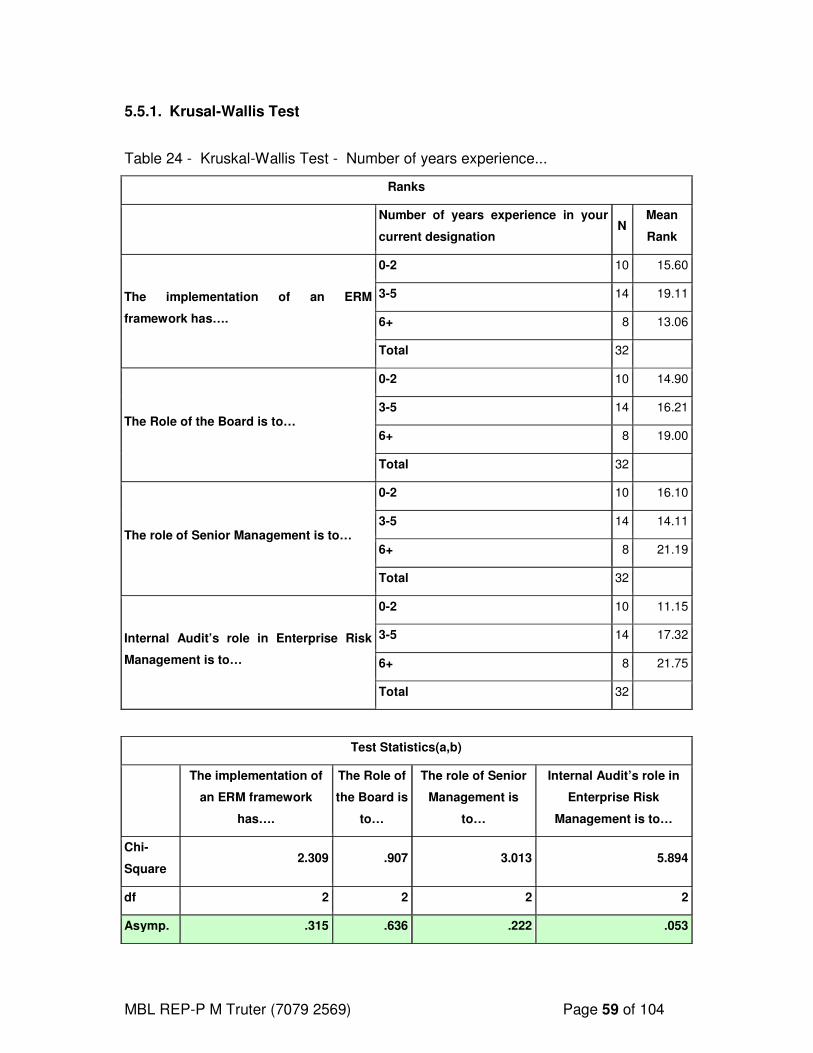
MBL REP-P M Truter (7079 2569) Page 59 of 104
5.5.1. Krusal-Wallis Test
Table 24 - Kruskal-Wallis Test - Number of years experience...
Ranks
Number of years experience in your
current designation N
Mean
Rank
The implementation of an ERM
framework has….
0-2 10 15.60
3-5 14 19.11
6+ 8 13.06
Total 32
The Role of the Board is to…
0-2 10 14.90
3-5 14 16.21
6+ 8 19.00
Total 32
The role of Senior Management is to…
0-2 10 16.10
3-5 14 14.11
6+ 8 21.19
Total 32
Internal Audit’s role in Enterprise Risk
Management is to…
0-2 10 11.15
3-5 14 17.32
6+ 8 21.75
Total 32
Test Statistics(a,b)
The implementation of
an ERM framework
has….
The Role of
the Board is
to…
The role of Senior
Management is
to…
Internal Audit’s role in
Enterprise Risk
Management is to…
Chi-
Square 2.309 .907 3.013 5.894
df 2 2 2 2
Asymp. .315 .636 .222 .053
MBL REP-P M Truter (7079 2569) Page 60 of 104
Sig.
a Kruskal-Wallis Test
b Grouping Variable: NEW Number of years experience in your current designation
This is very close to being a significant difference in the number of years experience
and the role of internal auditing risk management. This presence or absence could
have been far clearer if the sample size had been larger.
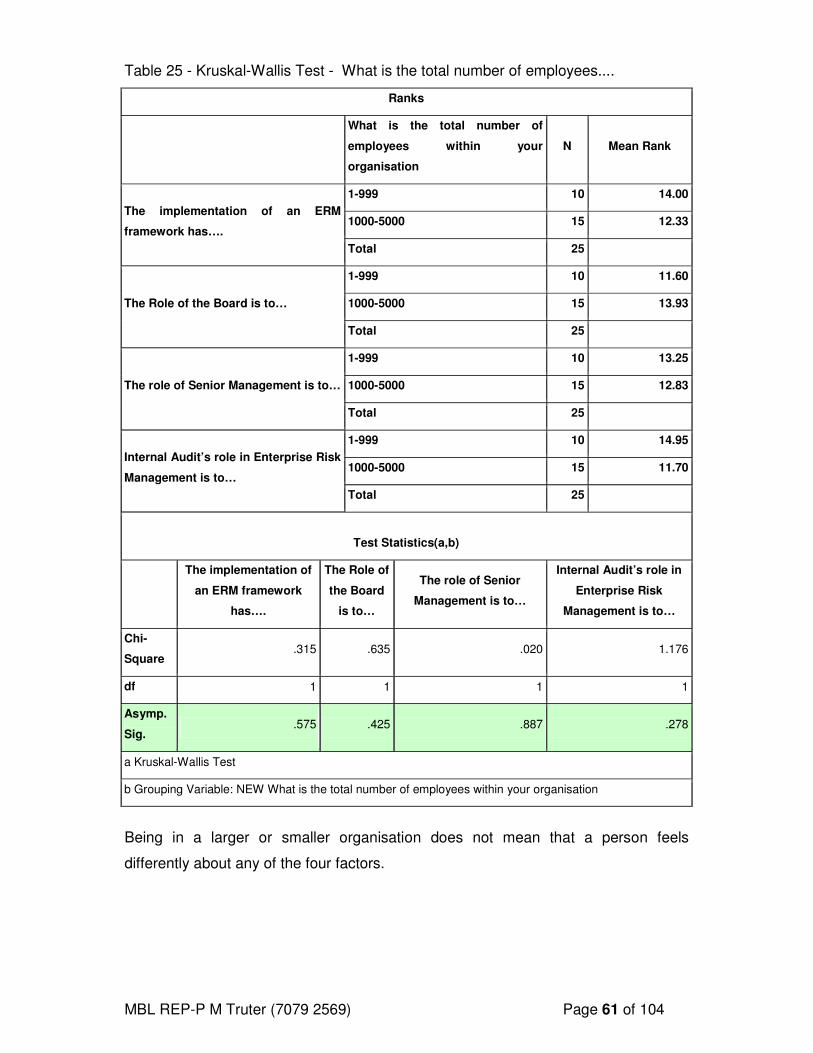
MBL REP-P M Truter (7079 2569) Page 61 of 104
Table 25 - Kruskal-Wallis Test - What is the total number of employees....
Ranks
What is the total number of
employees within your
organisation
N Mean Rank
The implementation of an ERM
framework has….
1-999 10 14.00
1000-5000 15 12.33
Total 25
The Role of the Board is to…
1-999 10 11.60
1000-5000 15 13.93
Total 25
The role of Senior Management is to…
1-999 10 13.25
1000-5000 15 12.83
Total 25
Internal Audit’s role in Enterprise Risk
Management is to…
1-999 10 14.95
1000-5000 15 11.70
Total 25
Test Statistics(a,b)
The implementation of
an ERM framework
has….
The Role of
the Board
is to…
The role of Senior
Management is to…
Internal Audit’s role in
Enterprise Risk
Management is to…
Chi-
Square .315 .635 .020 1.176
df 1 1 1 1
Asymp.
Sig. .575 .425 .887 .278
a Kruskal-Wallis Test
b Grouping Variable: NEW What is the total number of employees within your organisation
Being in a larger or smaller organisation does not mean that a person feels
differently about any of the four factors.
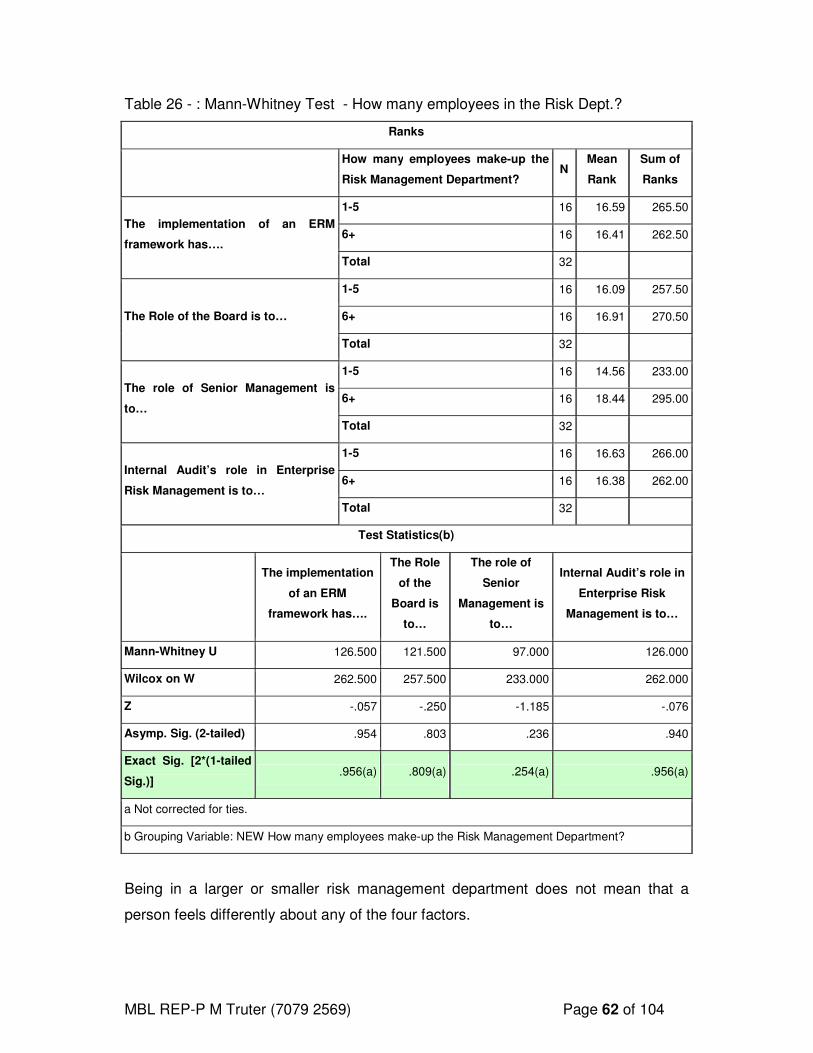
MBL REP-P M Truter (7079 2569) Page 62 of 104
Table 26 - : Mann-Whitney Test - How many employees in the Risk Dept.?
Ranks
How many employees make-up the
Risk Management Department? N
Mean
Rank
Sum of
Ranks
The implementation of an ERM
framework has….
1-5 16 16.59 265.50
6+ 16 16.41 262.50
Total 32
The Role of the Board is to…
1-5 16 16.09 257.50
6+ 16 16.91 270.50
Total 32
The role of Senior Management is
to…
1-5 16 14.56 233.00
6+ 16 18.44 295.00
Total 32
Internal Audit’s role in Enterprise
Risk Management is to…
1-5 16 16.63 266.00
6+ 16 16.38 262.00
Total 32
Test Statistics(b)
The implementation
of an ERM
framework has….
The Role
of the
Board is
to…
The role of
Senior
Management is
to…
Internal Audit’s role in
Enterprise Risk
Management is to…
Mann-Whitney U 126.500 121.500 97.000 126.000
Wilcox on W 262.500 257.500 233.000 262.000
Z -.057 -.250 -1.185 -.076
Asymp. Sig. (2-tailed) .954 .803 .236 .940
Exact Sig. [2*(1-tailed
Sig.)] .956(a) .809(a) .254(a) .956(a)
a Not corrected for ties.
b Grouping Variable: NEW How many employees make-up the Risk Management Department?
Being in a larger or smaller risk management department does not mean that a
person feels differently about any of the four factors.
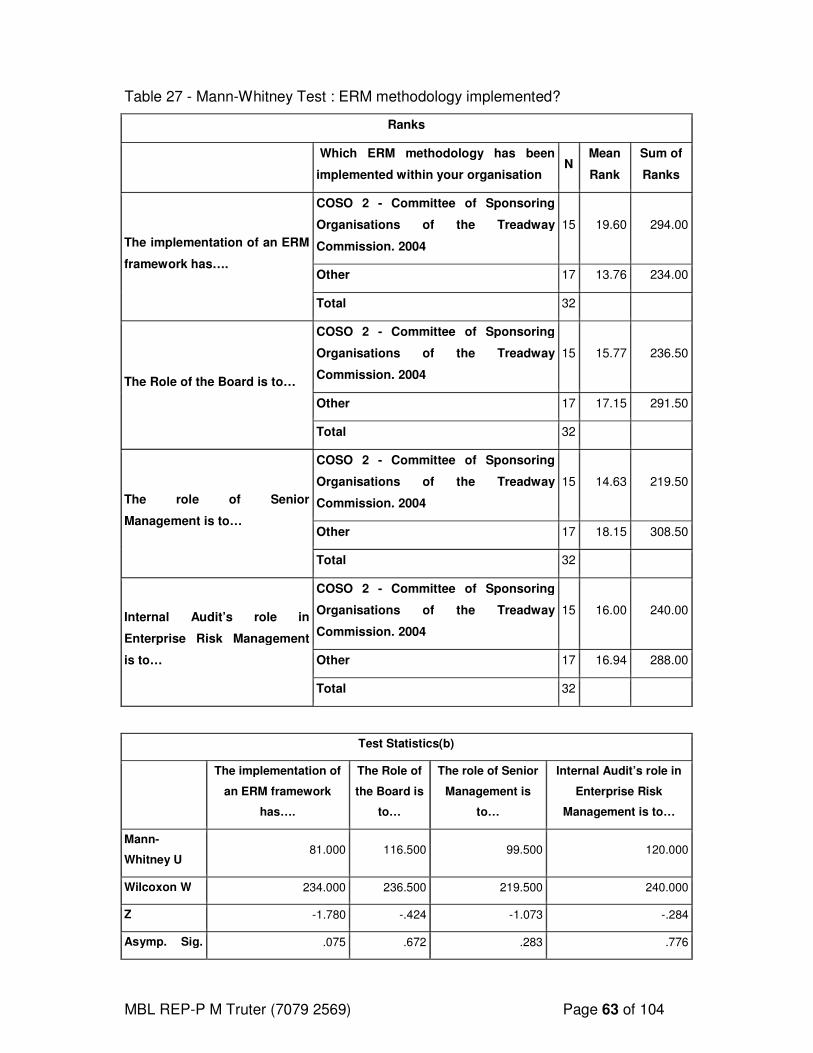
MBL REP-P M Truter (7079 2569) Page 63 of 104
Table 27 - Mann-Whitney Test : ERM methodology implemented?
Ranks
Which ERM methodology has been
implemented within your organisation N
Mean
Rank
Sum of
Ranks
The implementation of an ERM
framework has….
COSO 2 - Committee of Sponsoring
Organisations of the Treadway
Commission. 2004
15 19.60 294.00
Other 17 13.76 234.00
Total 32
The Role of the Board is to…
COSO 2 - Committee of Sponsoring
Organisations of the Treadway
Commission. 2004
15 15.77 236.50
Other 17 17.15 291.50
Total 32
The role of Senior
Management is to…
COSO 2 - Committee of Sponsoring
Organisations of the Treadway
Commission. 2004
15 14.63 219.50
Other 17 18.15 308.50
Total 32
Internal Audit’s role in
Enterprise Risk Management
is to…
COSO 2 - Committee of Sponsoring
Organisations of the Treadway
Commission. 2004
15 16.00 240.00
Other 17 16.94 288.00
Total 32
Test Statistics(b)
The implementation of
an ERM framework
has….
The Role of
the Board is
to…
The role of Senior
Management is
to…
Internal Audit’s role in
Enterprise Risk
Management is to…
Mann-
Whitney U 81.000 116.500 99.500 120.000
Wilcoxon W 234.000 236.500 219.500 240.000
Z -1.780 -.424 -1.073 -.284
Asymp. Sig. .075 .672 .283 .776
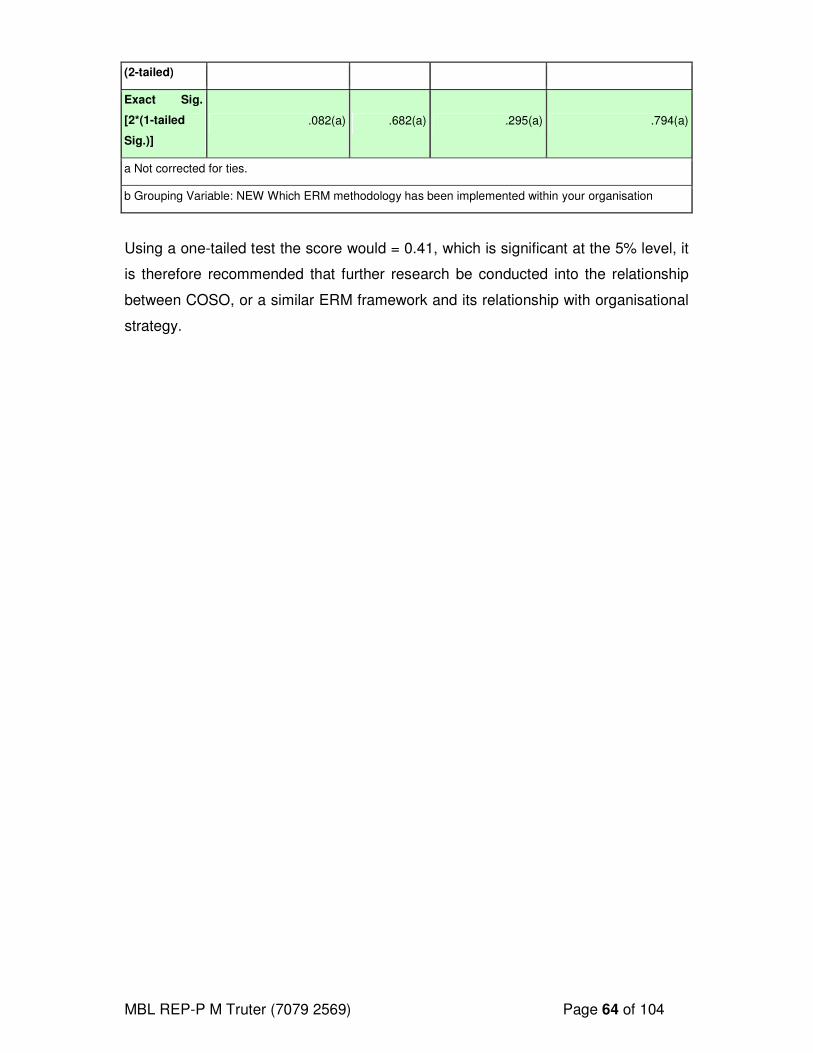
MBL REP-P M Truter (7079 2569) Page 64 of 104
(2-tailed)
Exact Sig.
[2*(1-tailed
Sig.)]
.082(a) .682(a) .295(a) .794(a)
a Not corrected for ties.
b Grouping Variable: NEW Which ERM methodology has been implemented within your organisation
Using a one-tailed test the score would = 0.41, which is significant at the 5% level, it
is therefore recommended that further research be conducted into the relationship
between COSO, or a similar ERM framework and its relationship with organisational
strategy.
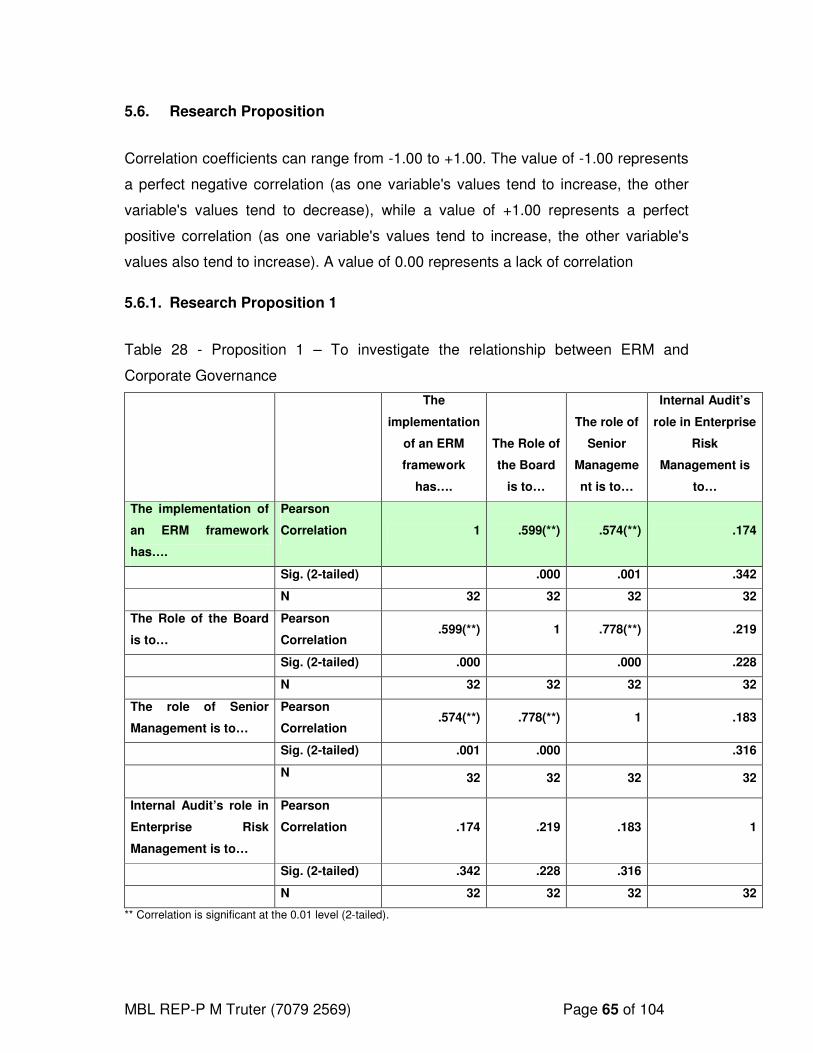
MBL REP-P M Truter (7079 2569) Page 65 of 104
5.6. Research Proposition
Correlation coefficients can range from -1.00 to +1.00. The value of -1.00 represents
a perfect negative correlation (as one variable's values tend to increase, the other
variable's values tend to decrease), while a value of +1.00 represents a perfect
positive correlation (as one variable's values tend to increase, the other variable's
values also tend to increase). A value of 0.00 represents a lack of correlation
5.6.1. Research Proposition 1
Table 28 - Proposition 1 – To investigate the relationship between ERM and
Corporate Governance
The
implementation
of an ERM
framework
has….
The Role of
the Board
is to…
The role of
Senior
Manageme
nt is to…
Internal Audit’s
role in Enterprise
Risk
Management is
to…
The implementation of
an ERM framework
has….
Pearson
Correlation 1 .599(**) .574(**) .174
Sig. (2-tailed) .000 .001 .342
N 32 32 32 32
The Role of the Board
is to…
Pearson
Correlation .599(**) 1 .778(**) .219
Sig. (2-tailed) .000 .000 .228
N 32 32 32 32
The role of Senior
Management is to…
Pearson
Correlation .574(**) .778(**) 1 .183
Sig. (2-tailed) .001 .000 .316
N 32 32 32 32
Internal Audit’s role in
Enterprise Risk
Management is to…
Pearson
Correlation .174 .219 .183 1
Sig. (2-tailed) .342 .228 .316
N 32 32 32 32
** Correlation is significant at the 0.01 level (2-tailed).
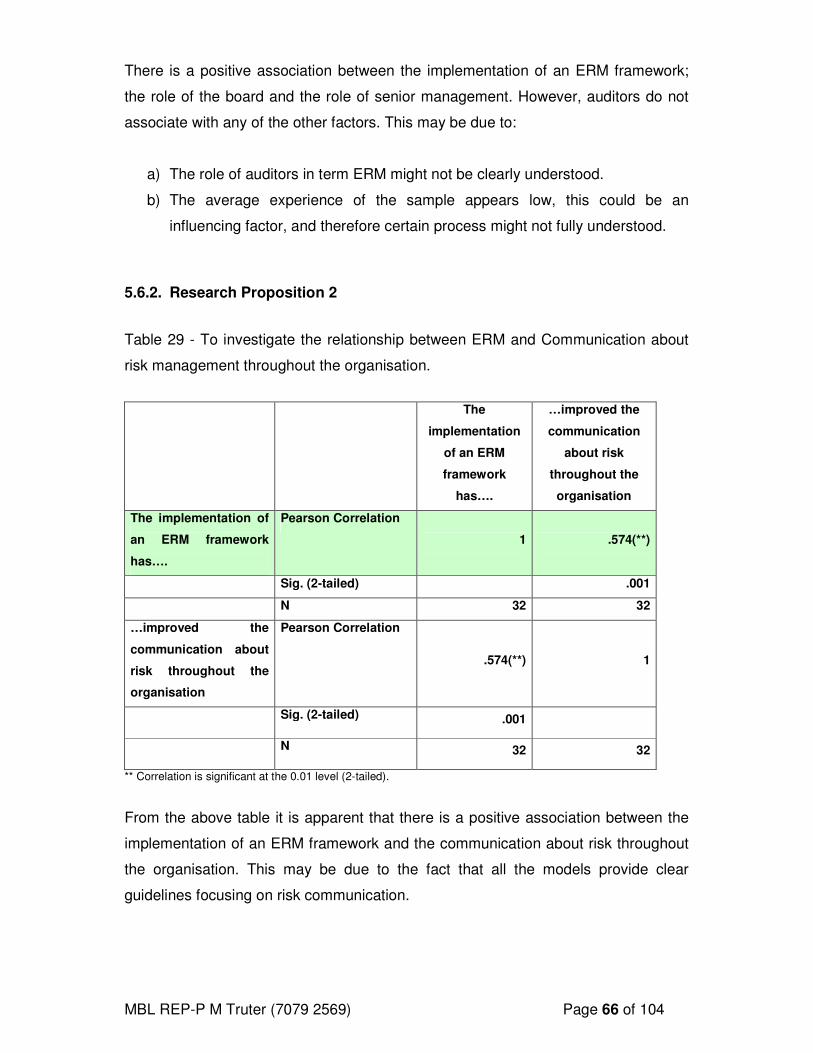
MBL REP-P M Truter (7079 2569) Page 66 of 104
There is a positive association between the implementation of an ERM framework;
the role of the board and the role of senior management. However, auditors do not
associate with any of the other factors. This may be due to:
a) The role of auditors in term ERM might not be clearly understood.
b) The average experience of the sample appears low, this could be an
influencing factor, and therefore certain process might not fully understood.
5.6.2. Research Proposition 2
Table 29 - To investigate the relationship between ERM and Communication about
risk management throughout the organisation.
The
implementation
of an ERM
framework
has….
…improved the
communication
about risk
throughout the
organisation
The implementation of
an ERM framework
has….
Pearson Correlation
1 .574(**)
Sig. (2-tailed) .001
N 32 32
…improved the
communication about
risk throughout the
organisation
Pearson Correlation
.574(**) 1
Sig. (2-tailed) .001
N 32 32
** Correlation is significant at the 0.01 level (2-tailed).
From the above table it is apparent that there is a positive association between the
implementation of an ERM framework and the communication about risk throughout
the organisation. This may be due to the fact that all the models provide clear
guidelines focusing on risk communication.
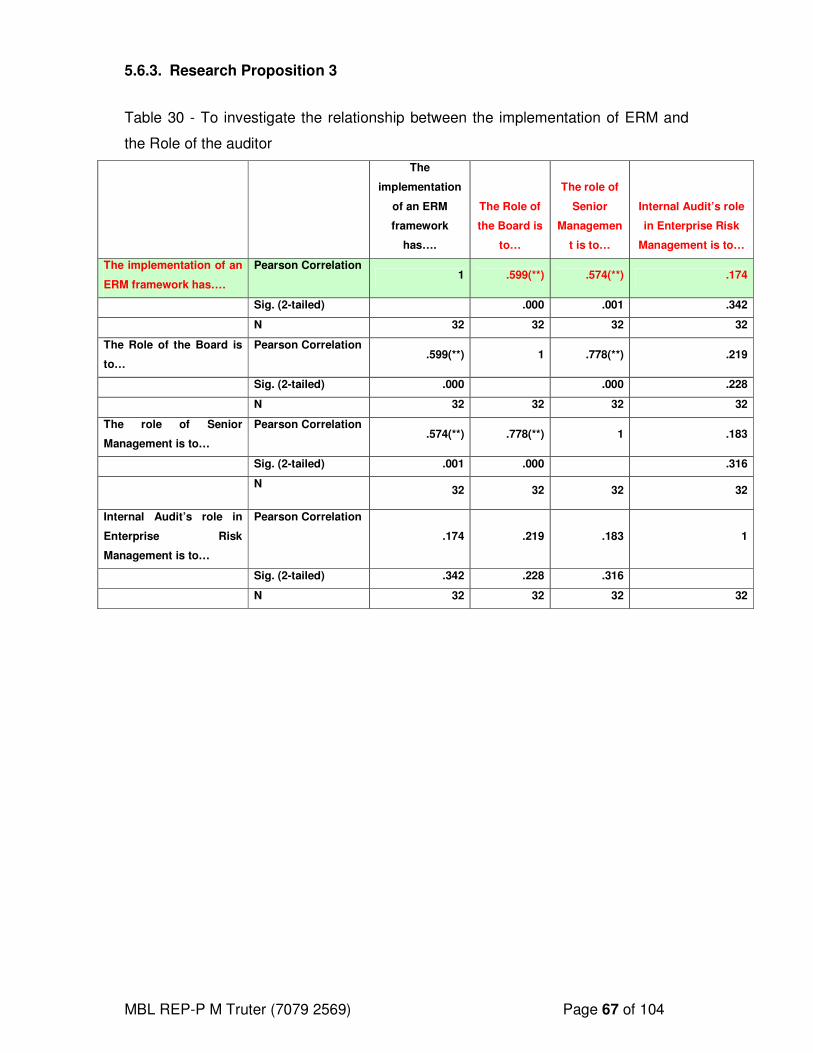
MBL REP-P M Truter (7079 2569) Page 67 of 104
5.6.3. Research Proposition 3
Table 30 - To investigate the relationship between the implementation of ERM and
the Role of the auditor
The
implementation
of an ERM
framework
has….
The Role of
the Board is
to…
The role of
Senior
Managemen
t is to…
Internal Audit’s role
in Enterprise Risk
Management is to…
The implementation of an
ERM framework has….
Pearson Correlation 1 .599(**) .574(**) .174
Sig. (2-tailed) .000 .001 .342
N 32 32 32 32
The Role of the Board is
to…
Pearson Correlation .599(**) 1 .778(**) .219
Sig. (2-tailed) .000 .000 .228
N 32 32 32 32
The role of Senior
Management is to…
Pearson Correlation .574(**) .778(**) 1 .183
Sig. (2-tailed) .001 .000 .316
N 32 32 32 32
Internal Audit’s role in
Enterprise Risk
Management is to…
Pearson Correlation
.174 .219 .183 1
Sig. (2-tailed) .342 .228 .316
N 32 32 32 32
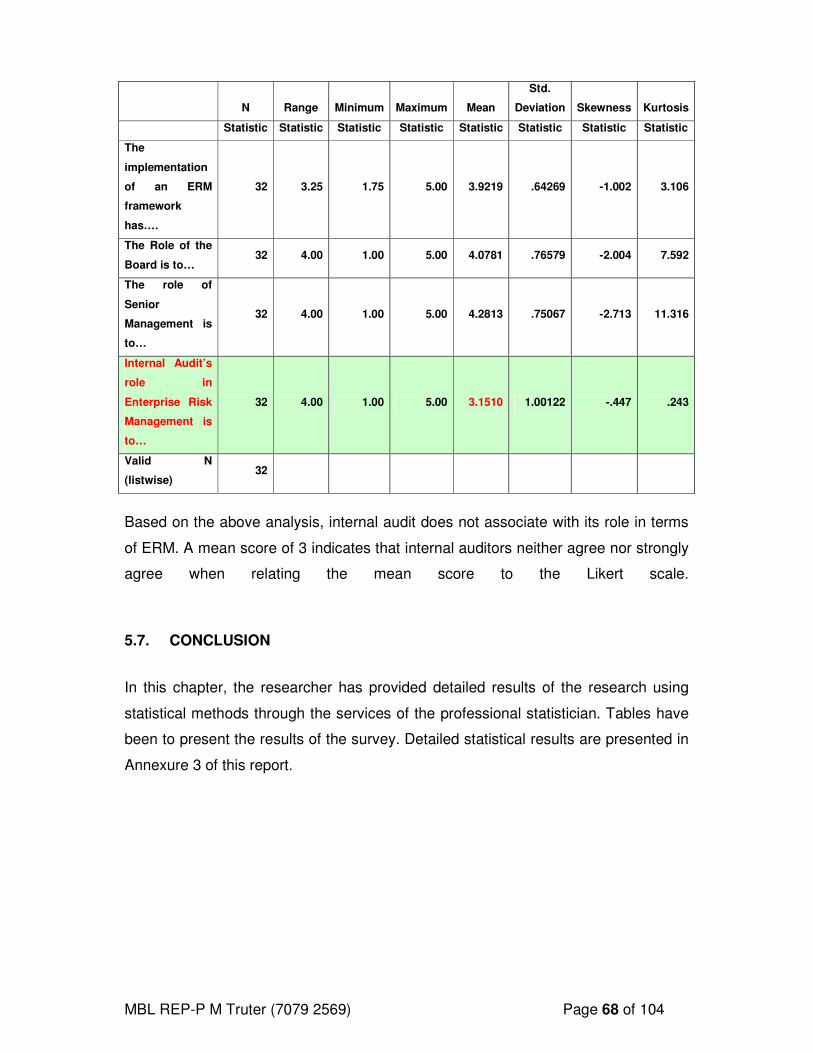
MBL REP-P M Truter (7079 2569) Page 68 of 104
N Range Minimum Maximum Mean
Std.
Deviation Skewness Kurtosis
Statistic Statistic Statistic Statistic Statistic Statistic Statistic Statistic
The
implementation
of an ERM
framework
has….
32 3.25 1.75 5.00 3.9219 .64269 -1.002 3.106
The Role of the
Board is to… 32 4.00 1.00 5.00 4.0781 .76579 -2.004 7.592
The role of
Senior
Management is
to…
32 4.00 1.00 5.00 4.2813 .75067 -2.713 11.316
Internal Audit’s
role in
Enterprise Risk
Management is
to…
32 4.00 1.00 5.00 3.1510 1.00122 -.447 .243
Valid N
(listwise) 32
Based on the above analysis, internal audit does not associate with its role in terms
of ERM. A mean score of 3 indicates that internal auditors neither agree nor strongly
agree when relating the mean score to the Likert scale.
5.7. CONCLUSION
In this chapter, the researcher has provided detailed results of the research using
statistical methods through the services of the professional statistician. Tables have
been to present the results of the survey. Detailed statistical results are presented in
Annexure 3 of this report.
MBL REP-P M Truter (7079 2569) Page 69 of 104
6. CHAPTER 6: DISCUSSION, CONCLUSIONS AND RECOMMENDATIONS
6.1. INTRODUCTION
In the light of various corporate governance failures within the public sector in
general and the prevailing perception the corruption is rife, the implementation of an
ERM framework is not optional. One of the central pillars of public administration is
accountability to shareholders, stakeholders and the community at large. Both the
PFMA and MFMA prescribe that risk management methodologies be implemented.
A survey was undertaken with risk managers, senior management, and internal
auditors to determine the relationship between the implementation of an ERM
framework and corporate governance.
6.2. TERMS OF REFERENCE
The purpose of the research was to determine the role of Enterprise Risk
Management in corporate governance within local government and public entities
located within Gauteng Province. A survey was conducted between August and
September 2007. Other objectives include: was to determine the following:
The perceived relationship between ERM and corporate governance.
The perceived relationship between ERM and communication about risk
management within public sector organizations
The perceived relationship between the implementation of ERM and the role of
internal audit.
The aim of this report is to outline the results of the survey and the
recommendations arising from the findings of the survey as well as areas of further
research. The report outlines the measurement instruments used in the research.
Statistical tools were applied which resulted in the tables which have been
MBL REP-P M Truter (7079 2569) Page 70 of 104
presented in the report. It is important to note that the results of this research are
the perceptions of risk and senior managers and those of internal auditors in
relation to ERM.
6.3. FINDINGS
This survey is based upon the perceptions of key stakeholders all involved in the
implementation of ERM framework. All respondents’ data was captured on a
spreadsheet designed by the researcher and approved by the statistician. All
analysis was performed using the SPSS Version 14 software and is based on
international best practice associated with standards and principles of statistical
analysis.
Relationship between ERM and Corporate Governance
The descriptive analysis indicated that 44% of respondents were of the opinion that
corporate governance presented the greatest risk to local and provincial
government and public sector entities. Concerns around social risk most notably
HIV/AIDS ranked second with 28%.
There is generally agreement among respondents that the implementation of an
ERM framework had positively impacted on corporate governance. This can be
seen in the improvement of the understanding of risk faced by the organisation,
where the mean score of 4.00 and standard deviation of 0.842 were measured.
Similar trends emerged in the assessment of the levels of management
accountability; and improvement of governance practices, with mean scores of
3.72 and 3.91 respectively. These results are further supported by analysis
presented in table 28 wherein the correlation coefficient between ERM and the
Role of the board was measured at .599, which indicates a significant positive
correlation.
MBL REP-P M Truter (7079 2569) Page 71 of 104
Therefore based on the aforementioned results we can conclude that there is a
positive association between the implementation of ERM framework and Corporate
Governance.
ERM and Communication about Risk
There is agreement among the respondents that the implementation has improved
the communication of risk throughout the organisation. This is supported by a
mean score of 4.06 and a standard deviation of 0.669. Further evidence in support
of this positive association can be found in table 29 of this is this report where a
positive correlation of 0.574 was measured between the implementation of ERM
and the communication of risk.
It can therefore be concluded a positive association between the implementation of
ERM framework and communication on risk.
Internal Audit role in ERM
The results confirm that the role of the internal audit in respect of ERM is not
clearly understood, this can seen in the mean scores of key indicators most
notably in the determining of the organisation risk appetite which was measured at
2.88. A similar scenario was scene in the scores for the implementation of risk
responses on managements behalf with a mean score of 2.66 and standard
deviation of 1.382. In terms of role of the internal audit in terms of ERM as
presented by the Internal Audit Institute UK and Ireland the aforementioned roles
are roles which audit should not perform.
Internal audit are key role players in the implementation of and maintenance of an
ERM framework and it is therefore key that they have a clear understanding of
their role and can clearly associate with roles that they can and cannot perform.
The implications are significant in that internal audit are charged with providing
assurance to the board on matters relating to risk, this could lead to inaccurate
assessments of risk.
MBL REP-P M Truter (7079 2569) Page 72 of 104
Risk Management Departments
The majority of respondents (75%) confirmed that their risk departments are small
with six or fewer members. These departments have further created the position of
chief risk officer or similar in line with international best practice. With regards to
the status of implementation 41% of respondents’ confirmed that the process was
embedded and further 38% confirmed that the roles had been defined.
If the results are to believed one would expect that these systems and practices
would be inculcated into the organisations business process; systems and culture.
However, the spate of governance failures continues unabated, the
“embeddedness” of ERM within the public sector will need to be tested.
6.4. LIMITATIONS OF THE STUDY
The results of the study may not be representative of ERM within all local and
provincial government departments or public sector entities. As no database exists of
risk managers, internal auditors or senior managers, only a small percentage was
sampled and therefore the results are in no way conclusive.
Due to time and financial constraints the study had to be limited to the Gauteng
province and therefore it cannot provide an overview of the South African local and
provincial and public entity perspective.
It is possible that some junior or inexperienced staff members who do not have a full
understanding of ERM will have misinterpreted questions. A further limitation is that
there are various models in the area of ERM, which, although very similar, each
have their own limitations. These models view ERM from a management
perspective, there is no integrated models that incorporate all stakeholders’ roles
and responsibilities including that of internal audit.
MBL REP-P M Truter (7079 2569) Page 73 of 104
The results of the survey will not be representative of all the South Africa local
governments, provincial governments and public entities, as the sampling frame
cannot be regarded as being representative of the entire population.
6.5. RECOMMENDATIONS FOR FURTHER RESEARCH
Further research could be conducted in the areas discussed below.
a) The first is the development of an integrated model similar to that combines
COSO, the Internal Audit Position statement on ERM and King II. This will
allow for consistency in implementation across the organisation.
b) Conduct research survey focusing on corporate governance over a five to ten
year period, as the impact of various ERM frameworks should become
tangible over time.
c) Investigate the benefit experienced by the various stakeholders in the creation
of the CRO role or similar in a public or private sector setting
d) Develop an ERM Maturity level framework, based on key indicators,
including ERM training, appointment of Chief Risk Officer, ERM, and
Balance Scorecard indicators, ERM Communication, Internal Audit’s role.
e) Conduct a study with specific emphasis on the role of the internal audit from
the audit perspective as well as from the senior management and risk
management perspectives.
f) Investigate the relationship between the implementation of ERM and
organisational Strategy within the public sector. The study should also focus
on determining the implementation by internal audit of the Internal Audit’s
Institute UK and Ireland position statement on ERM or a similar framework.
g) Investigate the relationship between the implementation of an ERM
framework and the financial benefits associated with this.
MBL REP-P M Truter (7079 2569) Page 74 of 104
6.6. CONCLUSION
In summary the results confirm a positive association between ERM; corporate
governance and communication on risk management. However, in the case of the
internal audit the results indicate that they do not associate with their role in ERM.
The implementation of an ERM framework offers many potential benefits most
notably to communities, stakeholders and civil society at large. The timing thereof
could not be better as government continues to role out significant infrastructural
projects such as mass housing and electrification projects.
In conclusion Enterprise Risk Management offers a tool to all stakeholders to
improve the level of Corporate Governance within public entities.
MBL REP-P M Truter (7079 2569) Page 75 of 104
7. LIST OF REFERENCES
AS/NZS4360:2004 - Risk Management Standards Australia/Standards New Zealand,
ISBN 0 7337 2647.
Brown, B.A. 2001. ‘Step-by-step enterprise Risk Management’, Risk Management,
48(9):34.
Cooper, D.R. & Schindler, P.S. 2003. Business Research Methods. 8th Edition. New
York: McGraw-Hill/Irwin.
Deloitte. August 2005. Corporate Risk Management Survey. Johannesburg: Deloitte.
Diamantopoulos, A. & Schlegelmilch, B.B. 2004. Taking the Fear Out of Data
Analysis. 1st Edition. Singapore:Thomson.
Donald, D.R. & Schindler, P.S. 2003. Business Research Methods, 8th Edition. New
York: McGraw-Hill.
Eskom. 2006. Annual Report 2007. Pretoria: Eskom.
FERMA. 2003. Risk Management Standard. Brussels: FERMA.
Gill, J. & Johnson, P. 2002. Research methods for Managers. 3rd Edition. London:
Sage Publications.
Igoli. 2007. Available
from:<http://www.igoli.gov.za/2007/may/speecha_mayor23may.stm> [Accessed 23
October 2007]
Institute of Directors. 2002. King Report on Corporate Governance for South Africa.
South Africa: Parklands. In the text this was referred to as King II.
MBL REP-P M Truter (7079 2569) Page 76 of 104
Institute of Internal Auditors. 2004. Revised Standards for the Professional Practice
of Internal Auditing. USA: Altamonte Springs.
Institute of Internal Auditors – UK and Ireland Ltd. 2004. The Role of Internal Audit in
Enterprise-wide Risk Management. London.
Institute of Risk Management South Africa. 2003 Code of Practice. Sandton: The
Institute of Risk Management South Africa.
Jackson, R.A. 2005. ‘Role Play’, Internal Auditor; 62(2):44-50.
Jablonowski, M. 2006. ‘The Real Value of ERM’, Risk Management, 53:2.
KPMG. Toolkit for company directors.2nd Edition. South Africa.
Lam, J.C. & Kawamoto B.M.1997. ‘Emergence of the chief risk officer’, Risk
Management, 44:30.
Leedy, P.D. & Ormrod, J.E. 2005. Practical Research: Planning and Design. 8th
Edition. New Jersey:Pearson Publisher.
Markinor, 2007. Available from:<http://markinor.co.za/news/public-opinion-on-
corruption> [Accessed on 20 March 2007]
Moody, M. J. 2004. ‘ERM’s Missing Pieces’, Rough Notes, pg. 150. Unpublished
Republic of South Africa, Constitutional Assembly.1996. Constitution of the Republic
of South Africa. No.108 of 1996. Pretoria: Government Printer.
Republic of South Africa, Government Gazette.2003. Municipal Finance
Management Act No 56, 2003. Pretoria: Government Printer.
Republic of South Africa, Government Gazzette.1999. Public Finance Management
Act. No. 1 of 1999. Pretoria: Government Printer.
Shenkir, W.G. & Walker, P. L. 2006. ‘Enterprise Risk Management and The
Strategy-Risk-Focused Organisation’, Cost Management: 20.
MBL REP-P M Truter (7079 2569) Page 77 of 104
Sobel, P.J. & Reding, K.F. 2004. ‘Aligning Corporate Governance with Enterprise
Risk Management’. Management Accounting Quarterly 5(2):29-37.
The Committee of Sponsoring Organisations of the Treadway Commission. 2004.
Enterprise Risk Management. Executive Summary (In text this was referred to as
COSO.)
Transparency International. 2006. Report on the Transparency International Global
Corruption Barometer 2006: Transparency International.
UCLA Academic Technology Services. 2007. Available from
<http://www.ats.ucla.edu/STAT/SPSS> [Accessed on 10 November 2007]
Valsamakis, A.C., Vivian R.W. & du Toit G.S. 2005. Risk Management. 3rd Edition.
Sandton:Heinemann Publishers.
Viljoen B. 2007. ‘Municipality missing R30m’, Beeld.18 March 2007.
Walker, P.L. Shenkir,G.W. & Barton,T.L.2003. ‘ERM in practice’. Internal Auditor;
August 2003:5.
Zikmund, W.G. 2003: Business Research Methods. Mason: South Western.
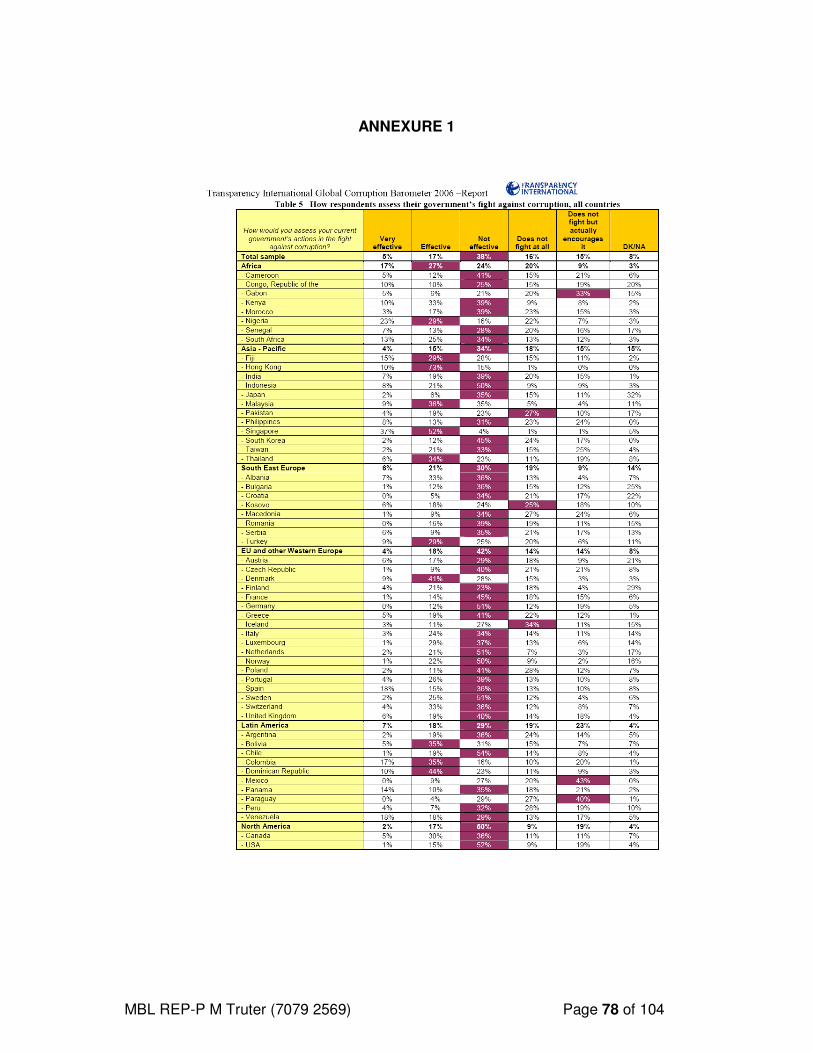
MBL REP-P M Truter (7079 2569) Page 78 of 104
ANNEXURE 1
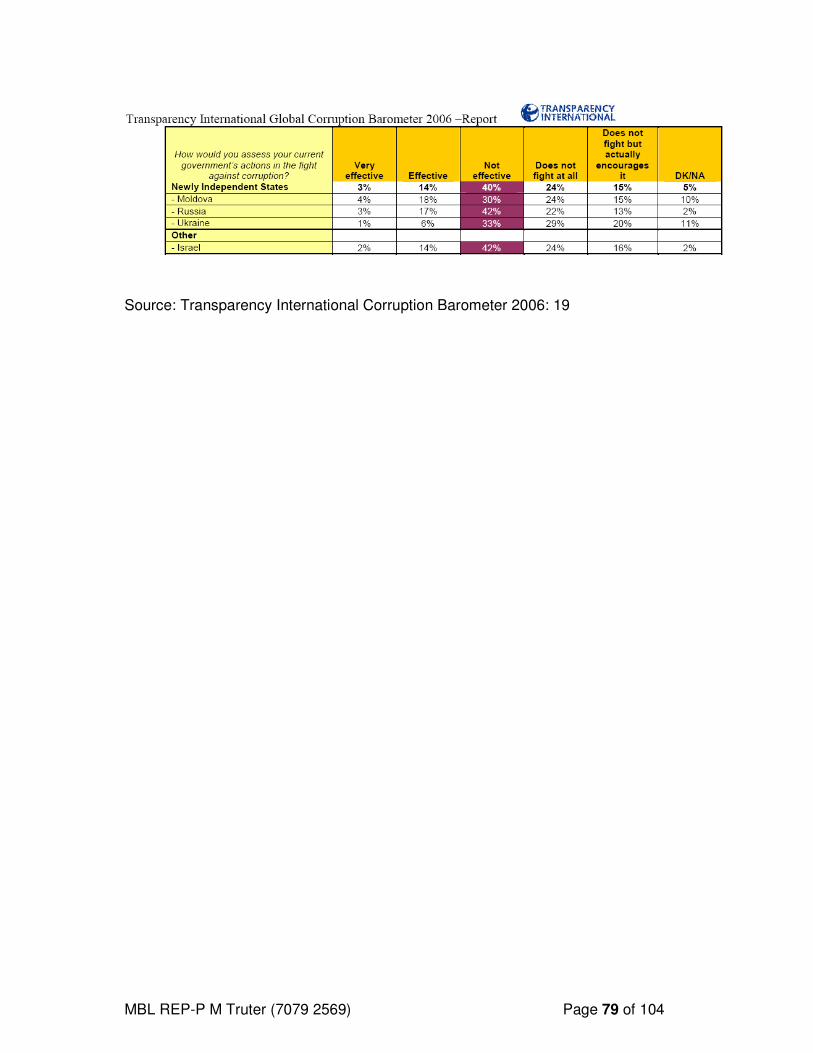
MBL REP-P M Truter (7079 2569) Page 79 of 104
Source: Transparency International Corruption Barometer 2006: 19
MBL REP-P M Truter (7079 2569) Page 80 of 104
ANNEXURE 2 – RESEARCH QUESTIONNAIRE
Research Questionnaire
Dear Participant
The primary purpose of this research is to investigate the role of Enterprise Risk
Management (ERM) in improving corporate governance within the Local Government and
Public Enterprises located in the Gauteng Province. The purpose of this questionnaire is to
gather information, which will later be analysed to evaluate the role of Enterprise Risk
Management in corporate governance.
The researcher (Master in Business Leadership: MBL student) is aware that the information
obtained through this questionnaire cannot be used beyond the scope of Unisa Graduate
School of Business Leadership. Please note that this information will be used strictly for
academic purposes.
After you have completed the questionnaire please forward it to:
Or
Fax: 0865280822
Thank you for taking time to complete this questionnaire
Mark Truter
tel (011) 683 8231
cell 083 6441390
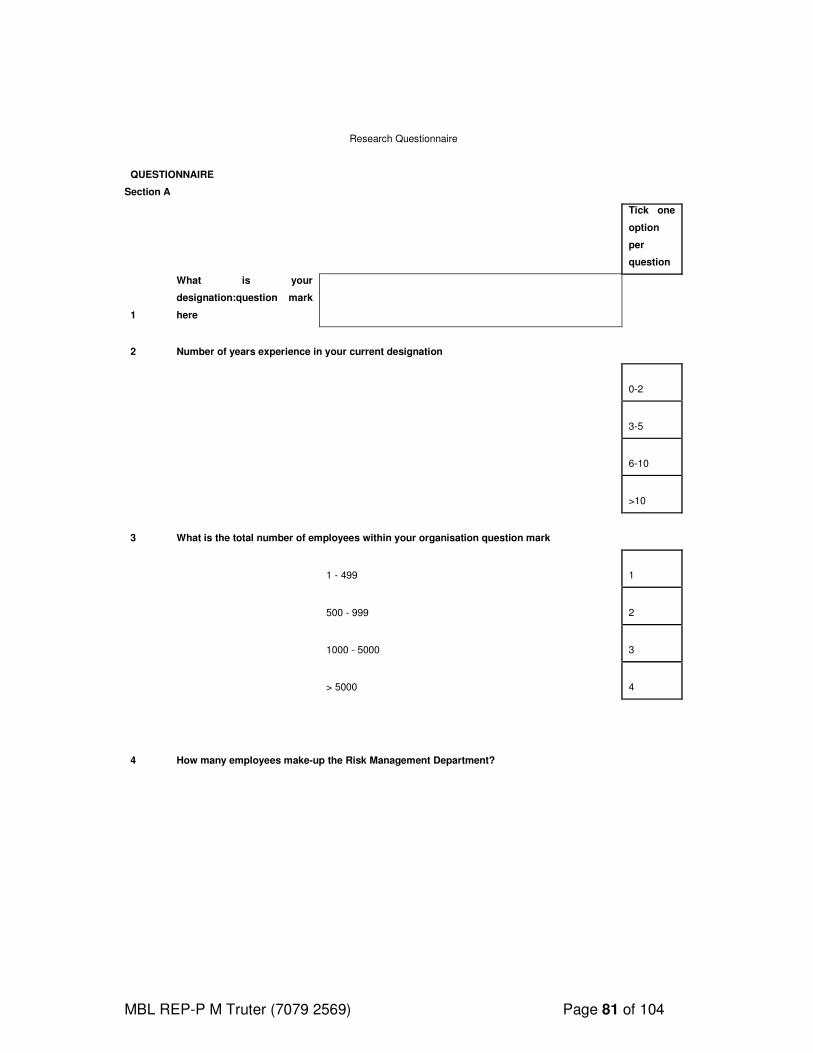
MBL REP-P M Truter (7079 2569) Page 81 of 104
Research Questionnaire
QUESTIONNAIRE
Section A
Tick one
option
per
question
1
What is your
designation:question mark
here
2 Number of years experience in your current designation
0-2
3-5
6-10
>10
3 What is the total number of employees within your organisation question mark
1 - 499 1
500 - 999 2
1000 - 5000 3
> 5000 4
4 How many employees make-up the Risk Management Department?
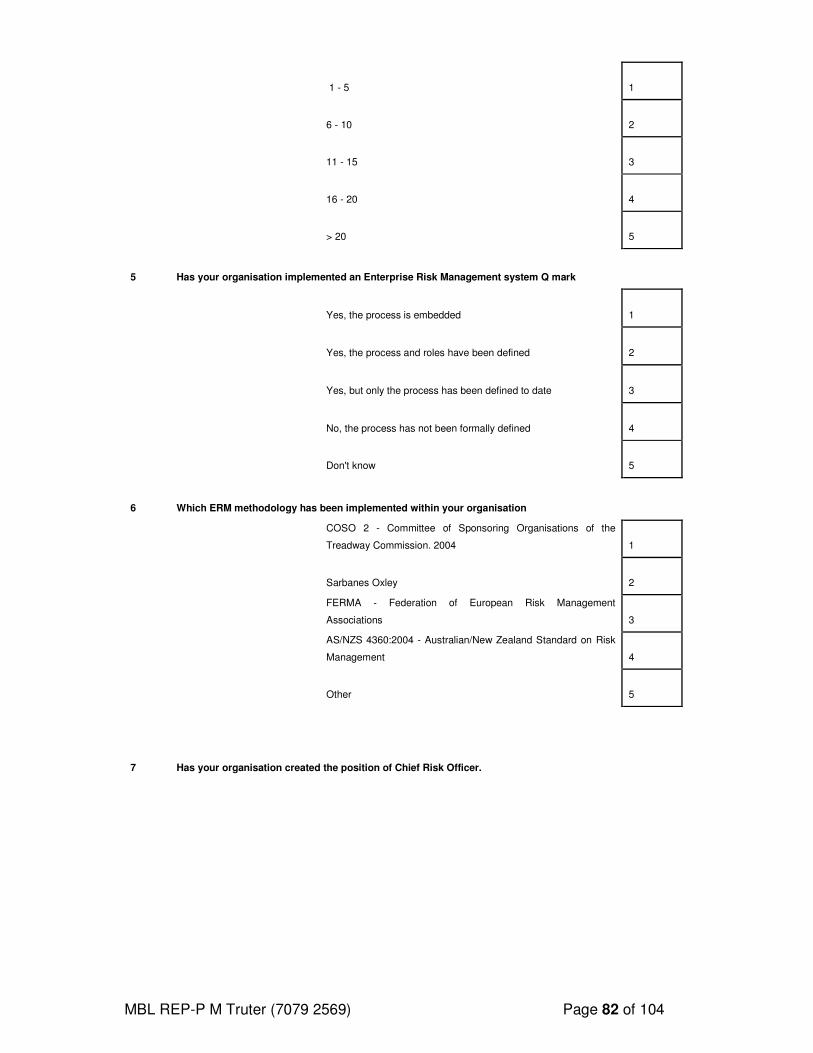
MBL REP-P M Truter (7079 2569) Page 82 of 104
1 - 5 1
6 - 10 2
11 - 15 3
16 - 20 4
> 20 5
5 Has your organisation implemented an Enterprise Risk Management system Q mark
Yes, the process is embedded 1
Yes, the process and roles have been defined 2
Yes, but only the process has been defined to date 3
No, the process has not been formally defined 4
Don't know 5
6 Which ERM methodology has been implemented within your organisation
COSO 2 - Committee of Sponsoring Organisations of the
Treadway Commission. 2004 1
Sarbanes Oxley 2
FERMA - Federation of European Risk Management
Associations 3
AS/NZS 4360:2004 - Australian/New Zealand Standard on Risk
Management 4
Other 5
7 Has your organisation created the position of Chief Risk Officer.
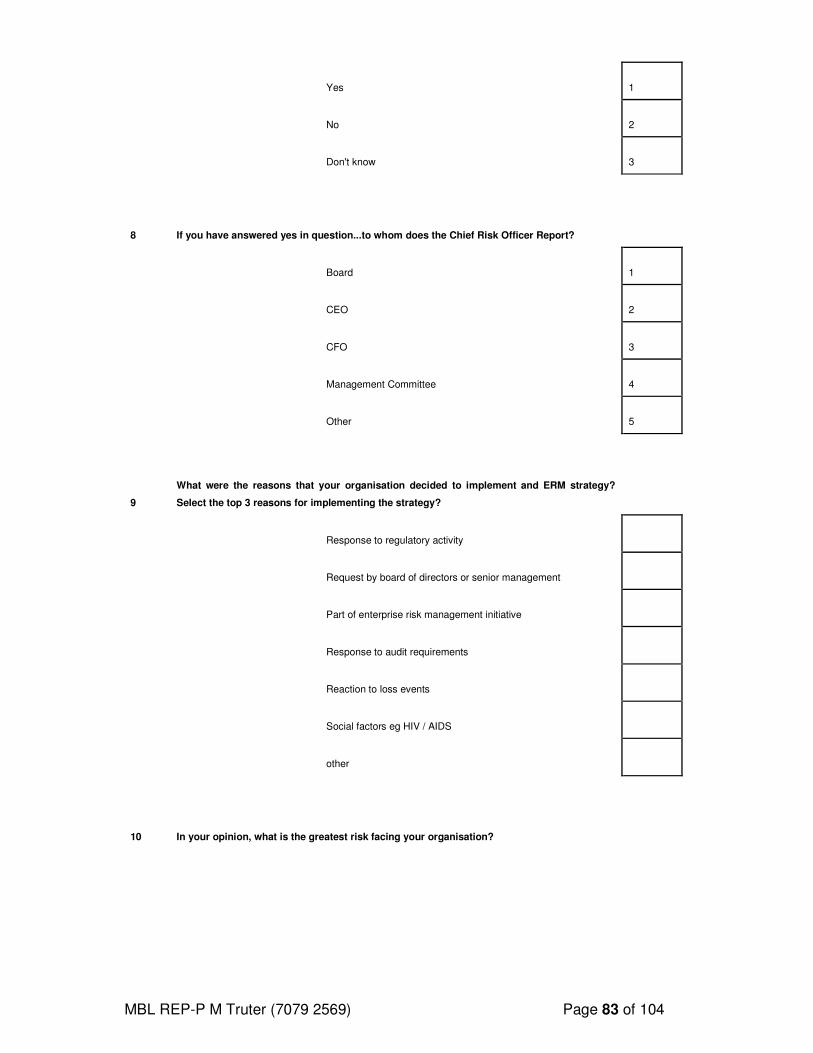
MBL REP-P M Truter (7079 2569) Page 83 of 104
Yes 1
No 2
Don't know 3
8 If you have answered yes in question...to whom does the Chief Risk Officer Report?
Board 1
CEO 2
CFO 3
Management Committee 4
Other 5
9
What were the reasons that your organisation decided to implement and ERM strategy?
Select the top 3 reasons for implementing the strategy?
Response to regulatory activity
Request by board of directors or senior management
Part of enterprise risk management initiative
Response to audit requirements
Reaction to loss events
Social factors eg HIV / AIDS
other
10 In your opinion, what is the greatest risk facing your organisation?
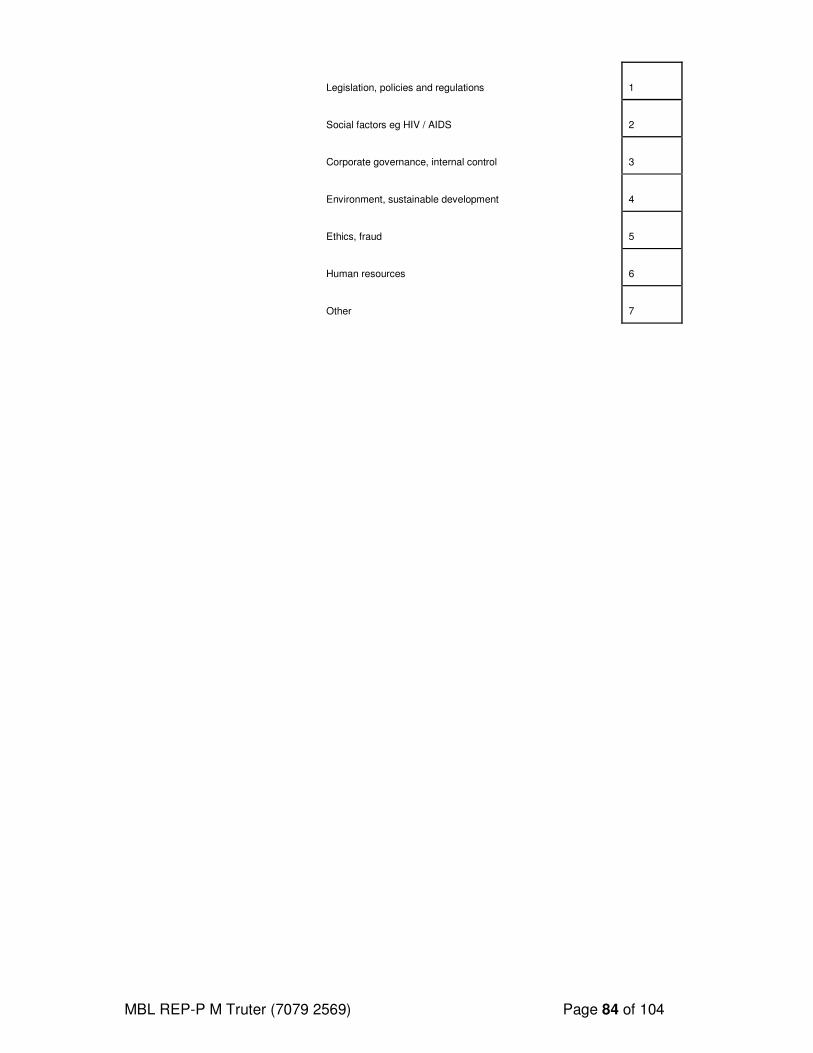
MBL REP-P M Truter (7079 2569) Page 84 of 104
Legislation, policies and regulations 1
Social factors eg HIV / AIDS 2
Corporate governance, internal control 3
Environment, sustainable development 4
Ethics, fraud 5
Human resources 6
Other 7
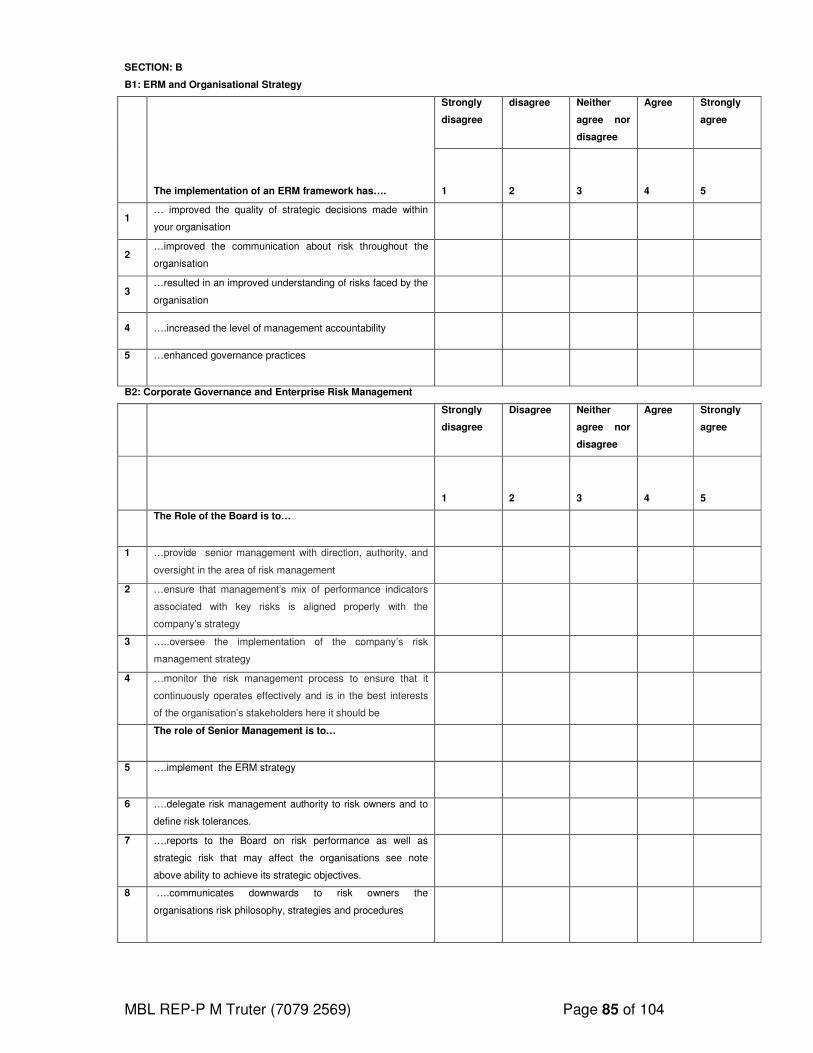
MBL REP-P M Truter (7079 2569) Page 85 of 104
SECTION: B
B1: ERM and Organisational Strategy
Strongly
disagree
disagree Neither
agree nor
disagree
Agree Strongly
agree
The implementation of an ERM framework has….
1
2
3
4
5
1 … improved the quality of strategic decisions made within
your organisation
2 …improved the communication about risk throughout the
organisation
3 …resulted in an improved understanding of risks faced by the
organisation
4 ….increased the level of management accountability
5 …enhanced governance practices
B2: Corporate Governance and Enterprise Risk Management
Strongly
disagree
Disagree Neither
agree nor
disagree
Agree Strongly
agree
1
2
3
4
5
The Role of the Board is to…
1 …provide senior management with direction, authority, and
oversight in the area of risk management
2 …ensure that management’s mix of performance indicators
associated with key risks is aligned properly with the
company’s strategy
3 …..oversee the implementation of the company’s risk
management strategy
4 …monitor the risk management process to ensure that it
continuously operates effectively and is in the best interests
of the organisation’s stakeholders here it should be
The role of Senior Management is to…
5 ….implement the ERM strategy
6 ….delegate risk management authority to risk owners and to
define risk tolerances.
7 ….reports to the Board on risk performance as well as
strategic risk that may affect the organisations see note
above ability to achieve its strategic objectives.
8 ….communicates downwards to risk owners the
organisations risk philosophy, strategies and procedures
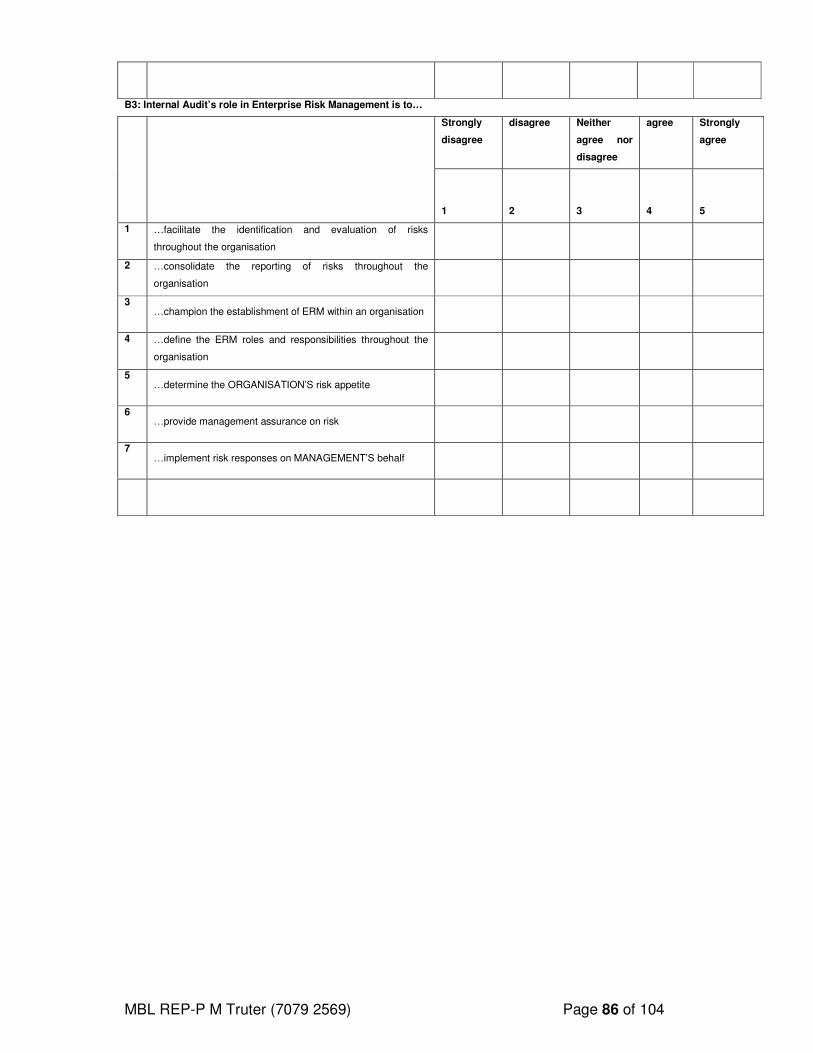
MBL REP-P M Truter (7079 2569) Page 86 of 104
B3: Internal Audit’s role in Enterprise Risk Management is to…
Strongly
disagree
disagree Neither
agree nor
disagree
agree Strongly
agree
1
2
3
4
5
1 …facilitate the identification and evaluation of risks
throughout the organisation
2 …consolidate the reporting of risks throughout the
organisation
3 …champion the establishment of ERM within an organisation
4 …define the ERM roles and responsibilities throughout the
organisation
5 …determine the ORGANISATION’S risk appetite
6 …provide management assurance on risk
7 …implement risk responses on MANAGEMENT’S behalf
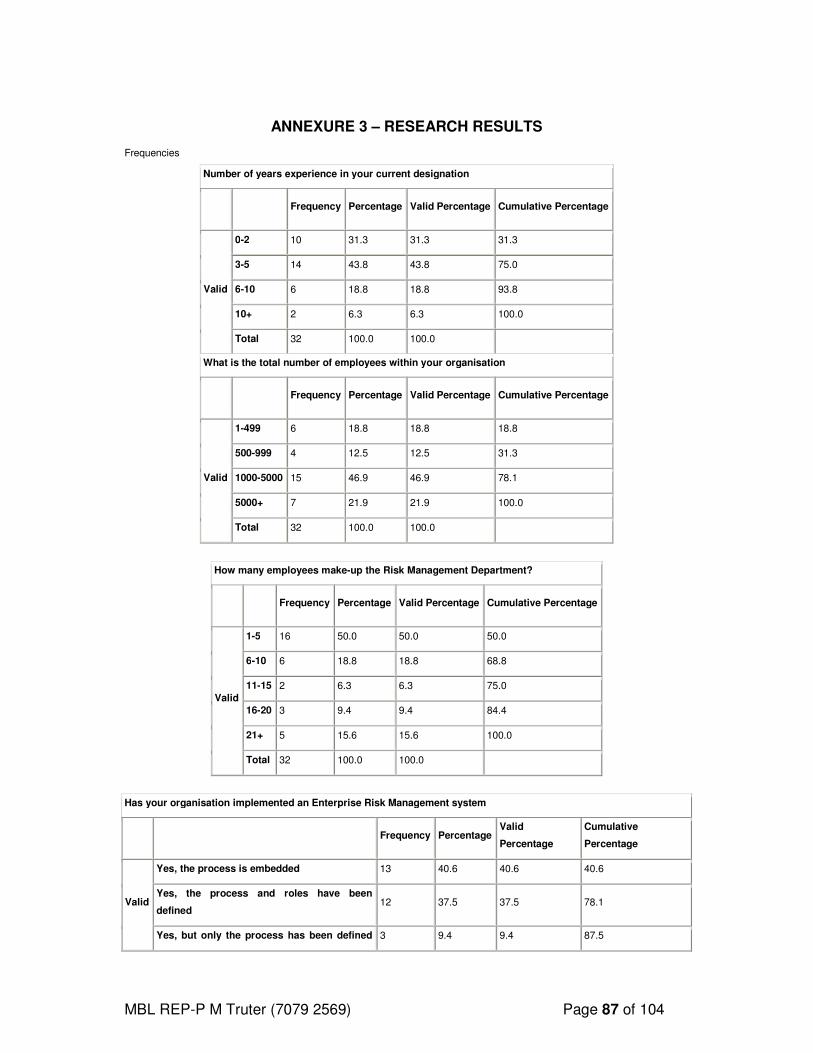
MBL REP-P M Truter (7079 2569) Page 87 of 104
ANNEXURE 3 – RESEARCH RESULTS
Frequencies
Number of years experience in your current designation
Frequency Percentage Valid Percentage Cumulative Percentage
Valid
0-2 10 31.3 31.3 31.3
3-5 14 43.8 43.8 75.0
6-10 6 18.8 18.8 93.8
10+ 2 6.3 6.3 100.0
Total 32 100.0 100.0
What is the total number of employees within your organisation
Frequency Percentage Valid Percentage Cumulative Percentage
Valid
1-499 6 18.8 18.8 18.8
500-999 4 12.5 12.5 31.3
1000-5000 15 46.9 46.9 78.1
5000+ 7 21.9 21.9 100.0
Total 32 100.0 100.0
How many employees make-up the Risk Management Department?
Frequency Percentage Valid Percentage Cumulative Percentage
Valid
1-5 16 50.0 50.0 50.0
6-10 6 18.8 18.8 68.8
11-15 2 6.3 6.3 75.0
16-20 3 9.4 9.4 84.4
21+ 5 15.6 15.6 100.0
Total 32 100.0 100.0
Has your organisation implemented an Enterprise Risk Management system
Frequency Percentage
Valid
Percentage
Cumulative
Percentage
Valid
Yes, the process is embedded 13 40.6 40.6 40.6
Yes, the process and roles have been
defined 12 37.5 37.5 78.1
Yes, but only the process has been defined 3 9.4 9.4 87.5
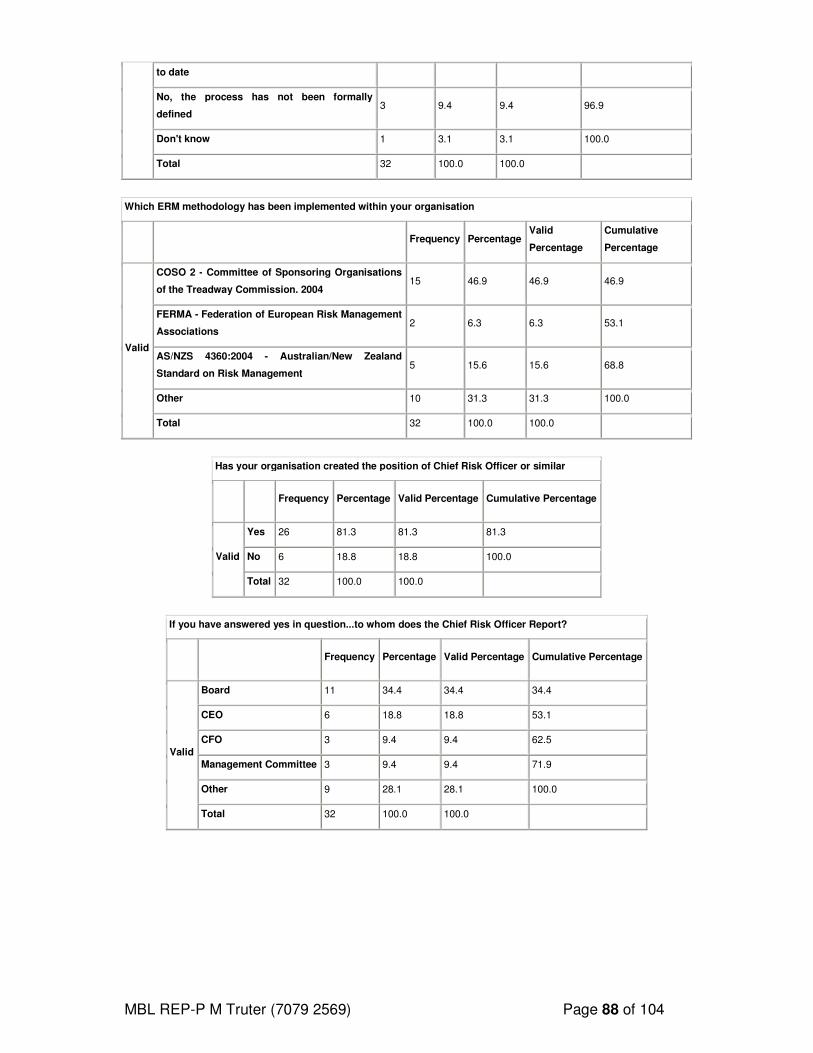
MBL REP-P M Truter (7079 2569) Page 88 of 104
to date
No, the process has not been formally
defined 3 9.4 9.4 96.9
Don't know 1 3.1 3.1 100.0
Total 32 100.0 100.0
Which ERM methodology has been implemented within your organisation
Frequency Percentage
Valid
Percentage
Cumulative
Percentage
Valid
COSO 2 - Committee of Sponsoring Organisations
of the Treadway Commission. 2004 15 46.9 46.9 46.9
FERMA - Federation of European Risk Management
Associations 2 6.3 6.3 53.1
AS/NZS 4360:2004 - Australian/New Zealand
Standard on Risk Management 5 15.6 15.6 68.8
Other 10 31.3 31.3 100.0
Total 32 100.0 100.0
Has your organisation created the position of Chief Risk Officer or similar
Frequency Percentage Valid Percentage Cumulative Percentage
Valid
Yes 26 81.3 81.3 81.3
No 6 18.8 18.8 100.0
Total 32 100.0 100.0
If you have answered yes in question...to whom does the Chief Risk Officer Report?
Frequency Percentage Valid Percentage Cumulative Percentage
Valid
Board 11 34.4 34.4 34.4
CEO 6 18.8 18.8 53.1
CFO 3 9.4 9.4 62.5
Management Committee 3 9.4 9.4 71.9
Other 9 28.1 28.1 100.0
Total 32 100.0 100.0
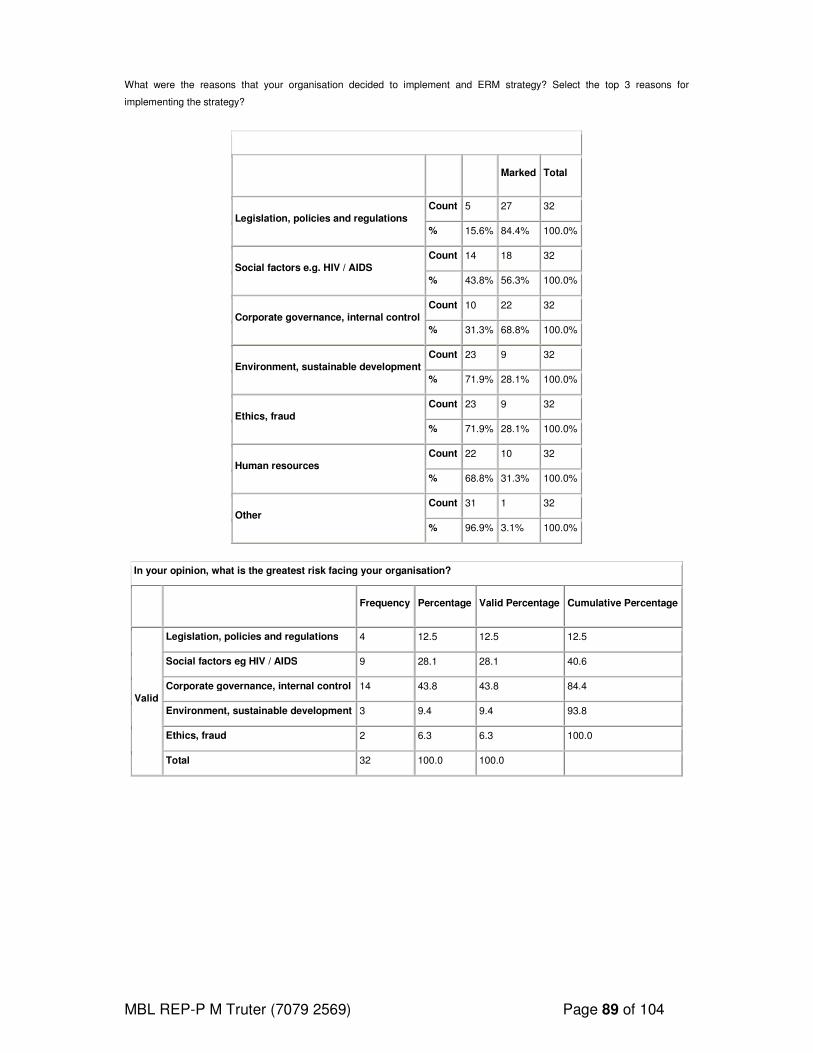
MBL REP-P M Truter (7079 2569) Page 89 of 104
What were the reasons that your organisation decided to implement and ERM strategy? Select the top 3 reasons for
implementing the strategy?
Marked Total
Legislation, policies and regulations
Count 5 27 32
% 15.6% 84.4% 100.0%
Social factors e.g. HIV / AIDS
Count 14 18 32
% 43.8% 56.3% 100.0%
Corporate governance, internal control
Count 10 22 32
% 31.3% 68.8% 100.0%
Environment, sustainable development
Count 23 9 32
% 71.9% 28.1% 100.0%
Ethics, fraud
Count 23 9 32
% 71.9% 28.1% 100.0%
Human resources
Count 22 10 32
% 68.8% 31.3% 100.0%
Other
Count 31 1 32
% 96.9% 3.1% 100.0%
In your opinion, what is the greatest risk facing your organisation?
Frequency Percentage Valid Percentage Cumulative Percentage
Valid
Legislation, policies and regulations 4 12.5 12.5 12.5
Social factors eg HIV / AIDS 9 28.1 28.1 40.6
Corporate governance, internal control 14 43.8 43.8 84.4
Environment, sustainable development 3 9.4 9.4 93.8
Ethics, fraud 2 6.3 6.3 100.0
Total 32 100.0 100.0
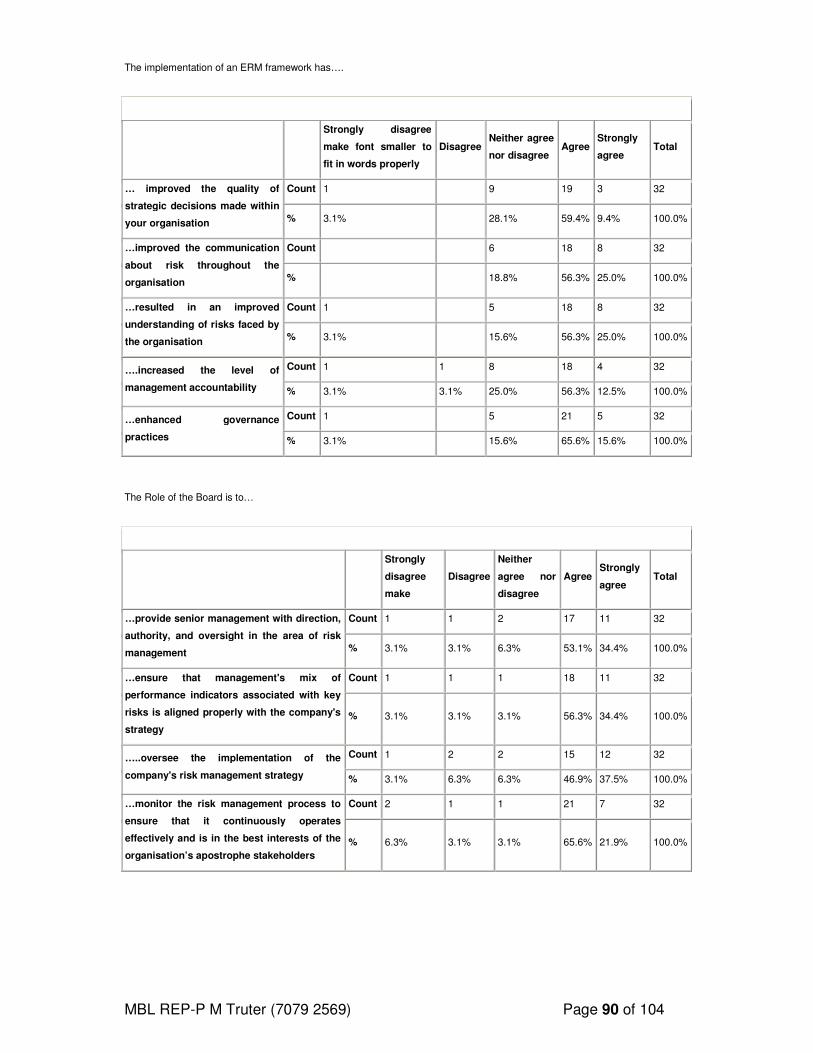
MBL REP-P M Truter (7079 2569) Page 90 of 104
The implementation of an ERM framework has….
Strongly disagree
make font smaller to
fit in words properly
Disagree Neither agree
nor disagree Agree
Strongly
agree Total
… improved the quality of
strategic decisions made within
your organisation
Count 1 9 19 3 32
% 3.1% 28.1% 59.4% 9.4% 100.0%
…improved the communication
about risk throughout the
organisation
Count 6 18 8 32
% 18.8% 56.3% 25.0% 100.0%
…resulted in an improved
understanding of risks faced by
the organisation
Count 1 5 18 8 32
% 3.1% 15.6% 56.3% 25.0% 100.0%
….increased the level of
management accountability
Count 1 1 8 18 4 32
% 3.1% 3.1% 25.0% 56.3% 12.5% 100.0%
…enhanced governance
practices
Count 1 5 21 5 32
% 3.1% 15.6% 65.6% 15.6% 100.0%
The Role of the Board is to…
Strongly
disagree
make
Disagree
Neither
agree nor
disagree
Agree Strongly
agree Total
…provide senior management with direction,
authority, and oversight in the area of risk
management
Count 1 1 2 17 11 32
% 3.1% 3.1% 6.3% 53.1% 34.4% 100.0%
…ensure that management's mix of
performance indicators associated with key
risks is aligned properly with the company's
strategy
Count 1 1 1 18 11 32
% 3.1% 3.1% 3.1% 56.3% 34.4% 100.0%
…..oversee the implementation of the
company's risk management strategy
Count 1 2 2 15 12 32
% 3.1% 6.3% 6.3% 46.9% 37.5% 100.0%
…monitor the risk management process to
ensure that it continuously operates
effectively and is in the best interests of the
organisation’s apostrophe stakeholders
Count 2 1 1 21 7 32
% 6.3% 3.1% 3.1% 65.6% 21.9% 100.0%
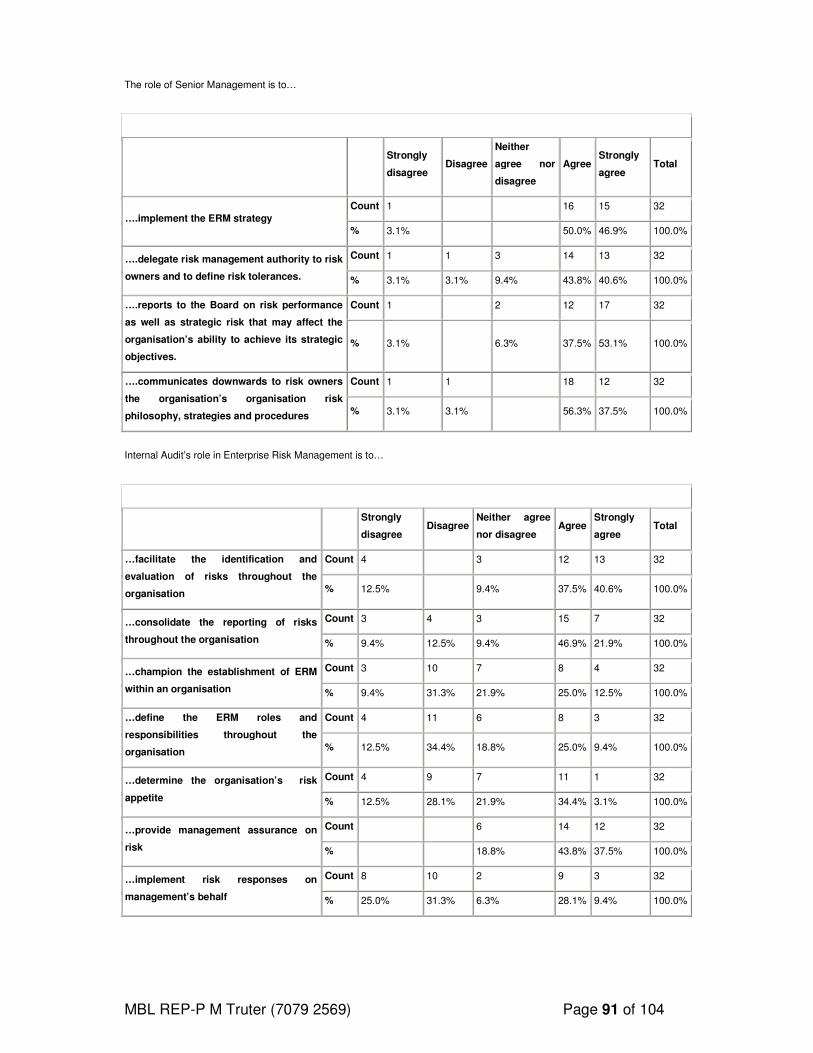
MBL REP-P M Truter (7079 2569) Page 91 of 104
The role of Senior Management is to…
Strongly
disagree Disagree
Neither
agree nor
disagree
Agree Strongly
agree Total
….implement the ERM strategy
Count 1 16 15 32
% 3.1% 50.0% 46.9% 100.0%
….delegate risk management authority to risk
owners and to define risk tolerances.
Count 1 1 3 14 13 32
% 3.1% 3.1% 9.4% 43.8% 40.6% 100.0%
….reports to the Board on risk performance
as well as strategic risk that may affect the
organisation’s ability to achieve its strategic
objectives.
Count 1 2 12 17 32
% 3.1% 6.3% 37.5% 53.1% 100.0%
….communicates downwards to risk owners
the organisation’s organisation risk
philosophy, strategies and procedures
Count 1 1 18 12 32
% 3.1% 3.1% 56.3% 37.5% 100.0%
Internal Audit’s role in Enterprise Risk Management is to…
Strongly
disagree Disagree
Neither agree
nor disagree Agree
Strongly
agree Total
…facilitate the identification and
evaluation of risks throughout the
organisation
Count 4 3 12 13 32
% 12.5% 9.4% 37.5% 40.6% 100.0%
…consolidate the reporting of risks
throughout the organisation
Count 3 4 3 15 7 32
% 9.4% 12.5% 9.4% 46.9% 21.9% 100.0%
…champion the establishment of ERM
within an organisation
Count 3 10 7 8 4 32
% 9.4% 31.3% 21.9% 25.0% 12.5% 100.0%
…define the ERM roles and
responsibilities throughout the
organisation
Count 4 11 6 8 3 32
% 12.5% 34.4% 18.8% 25.0% 9.4% 100.0%
…determine the organisation’s risk
appetite
Count 4 9 7 11 1 32
% 12.5% 28.1% 21.9% 34.4% 3.1% 100.0%
…provide management assurance on
risk
Count 6 14 12 32
% 18.8% 43.8% 37.5% 100.0%
…implement risk responses on
management’s behalf
Count 8 10 2 9 3 32
% 25.0% 31.3% 6.3% 28.1% 9.4% 100.0%
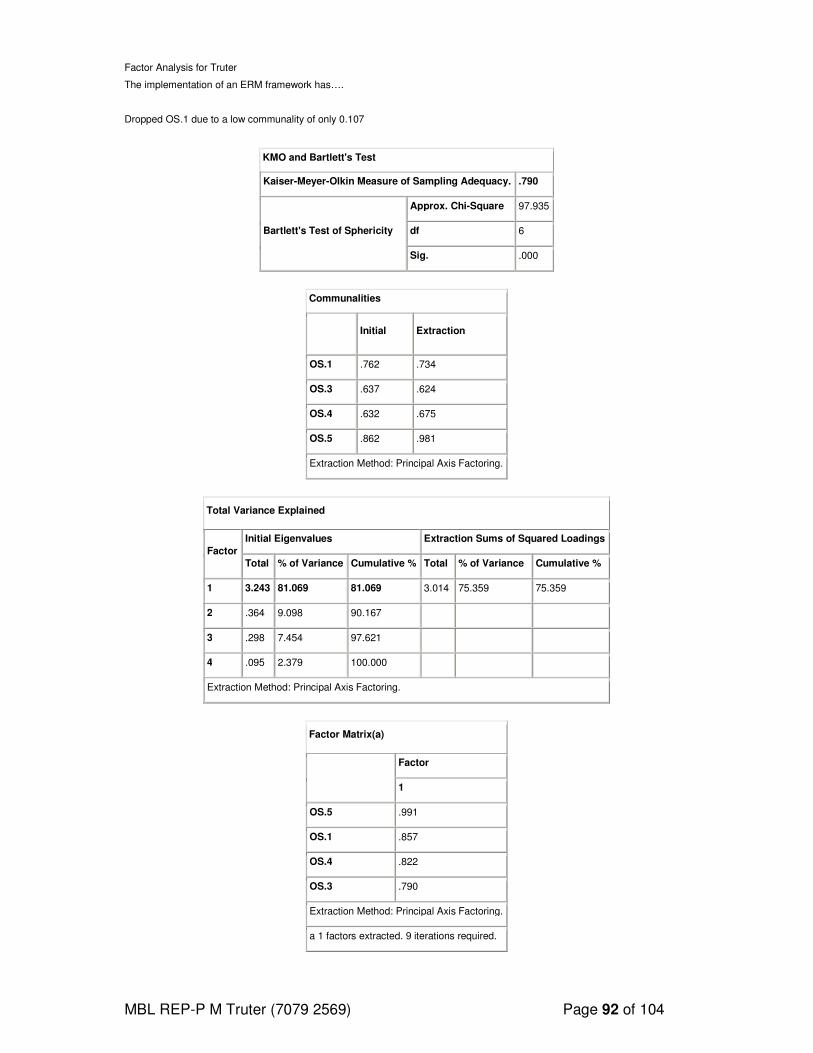
MBL REP-P M Truter (7079 2569) Page 92 of 104
Factor Analysis for Truter
The implementation of an ERM framework has….
Dropped OS.1 due to a low communality of only 0.107
KMO and Bartlett's Test
Kaiser-Meyer-Olkin Measure of Sampling Adequacy. .790
Bartlett's Test of Sphericity
Approx. Chi-Square 97.935
df 6
Sig. .000
Communalities
Initial Extraction
OS.1 .762 .734
OS.3 .637 .624
OS.4 .632 .675
OS.5 .862 .981
Extraction Method: Principal Axis Factoring.
Total Variance Explained
Factor
Initial Eigenvalues Extraction Sums of Squared Loadings
Total % of Variance Cumulative % Total % of Variance Cumulative %
1 3.243 81.069 81.069 3.014 75.359 75.359
2 .364 9.098 90.167
3 .298 7.454 97.621
4 .095 2.379 100.000
Extraction Method: Principal Axis Factoring.
Factor Matrix(a)
Factor
1
OS.5 .991
OS.1 .857
OS.4 .822
OS.3 .790
Extraction Method: Principal Axis Factoring.
a 1 factors extracted. 9 iterations required.
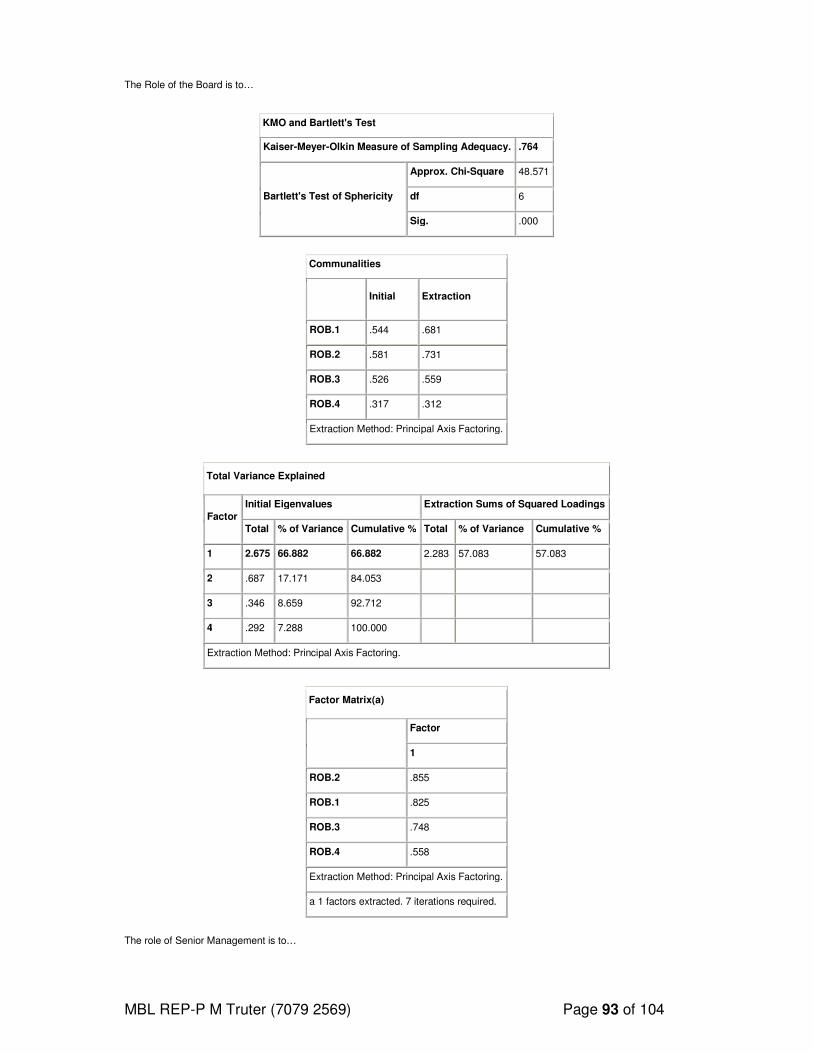
MBL REP-P M Truter (7079 2569) Page 93 of 104
The Role of the Board is to…
KMO and Bartlett's Test
Kaiser-Meyer-Olkin Measure of Sampling Adequacy. .764
Bartlett's Test of Sphericity
Approx. Chi-Square 48.571
df 6
Sig. .000
Communalities
Initial Extraction
ROB.1 .544 .681
ROB.2 .581 .731
ROB.3 .526 .559
ROB.4 .317 .312
Extraction Method: Principal Axis Factoring.
Total Variance Explained
Factor
Initial Eigenvalues Extraction Sums of Squared Loadings
Total % of Variance Cumulative % Total % of Variance Cumulative %
1 2.675 66.882 66.882 2.283 57.083 57.083
2 .687 17.171 84.053
3 .346 8.659 92.712
4 .292 7.288 100.000
Extraction Method: Principal Axis Factoring.
Factor Matrix(a)
Factor
1
ROB.2 .855
ROB.1 .825
ROB.3 .748
ROB.4 .558
Extraction Method: Principal Axis Factoring.
a 1 factors extracted. 7 iterations required.
The role of Senior Management is to…
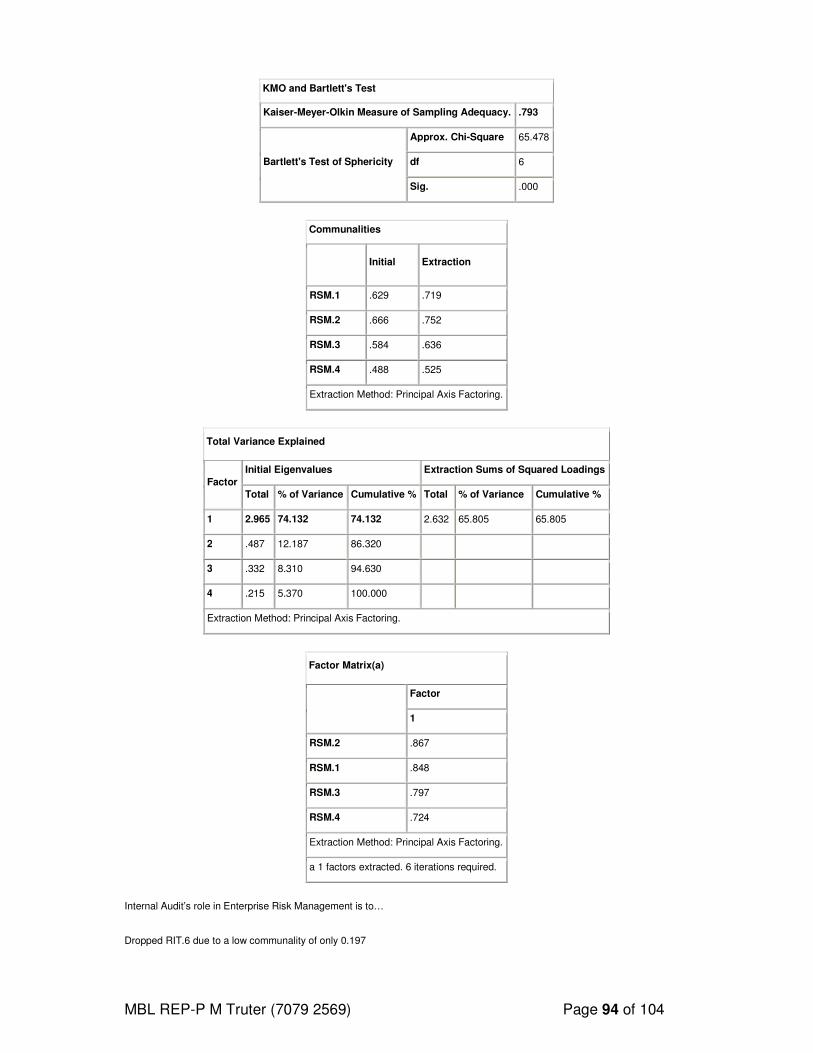
MBL REP-P M Truter (7079 2569) Page 94 of 104
KMO and Bartlett's Test
Kaiser-Meyer-Olkin Measure of Sampling Adequacy. .793
Bartlett's Test of Sphericity
Approx. Chi-Square 65.478
df 6
Sig. .000
Communalities
Initial Extraction
RSM.1 .629 .719
RSM.2 .666 .752
RSM.3 .584 .636
RSM.4 .488 .525
Extraction Method: Principal Axis Factoring.
Total Variance Explained
Factor
Initial Eigenvalues Extraction Sums of Squared Loadings
Total % of Variance Cumulative % Total % of Variance Cumulative %
1 2.965 74.132 74.132 2.632 65.805 65.805
2 .487 12.187 86.320
3 .332 8.310 94.630
4 .215 5.370 100.000
Extraction Method: Principal Axis Factoring.
Factor Matrix(a)
Factor
1
RSM.2 .867
RSM.1 .848
RSM.3 .797
RSM.4 .724
Extraction Method: Principal Axis Factoring.
a 1 factors extracted. 6 iterations required.
Internal Audit’s role in Enterprise Risk Management is to…
Dropped RIT.6 due to a low communality of only 0.197
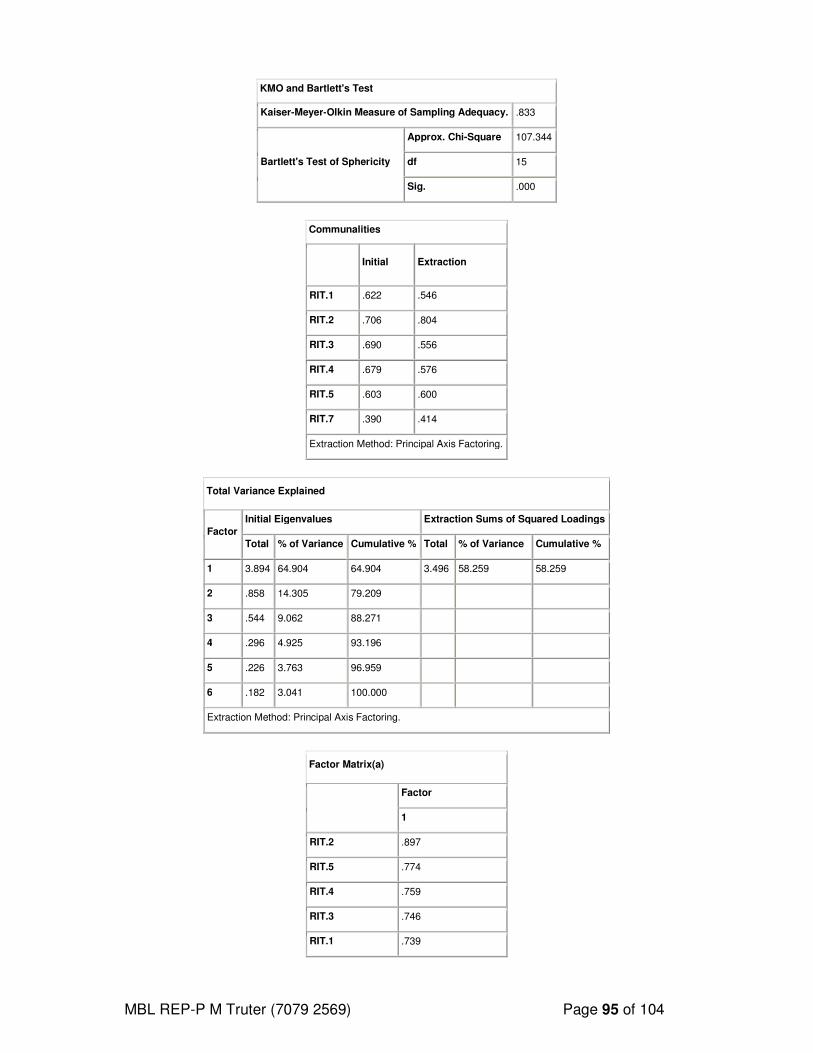
MBL REP-P M Truter (7079 2569) Page 95 of 104
KMO and Bartlett's Test
Kaiser-Meyer-Olkin Measure of Sampling Adequacy. .833
Bartlett's Test of Sphericity
Approx. Chi-Square 107.344
df 15
Sig. .000
Communalities
Initial Extraction
RIT.1 .622 .546
RIT.2 .706 .804
RIT.3 .690 .556
RIT.4 .679 .576
RIT.5 .603 .600
RIT.7 .390 .414
Extraction Method: Principal Axis Factoring.
Total Variance Explained
Factor
Initial Eigenvalues Extraction Sums of Squared Loadings
Total % of Variance Cumulative % Total % of Variance Cumulative %
1 3.894 64.904 64.904 3.496 58.259 58.259
2 .858 14.305 79.209
3 .544 9.062 88.271
4 .296 4.925 93.196
5 .226 3.763 96.959
6 .182 3.041 100.000
Extraction Method: Principal Axis Factoring.
Factor Matrix(a)
Factor
1
RIT.2 .897
RIT.5 .774
RIT.4 .759
RIT.3 .746
RIT.1 .739
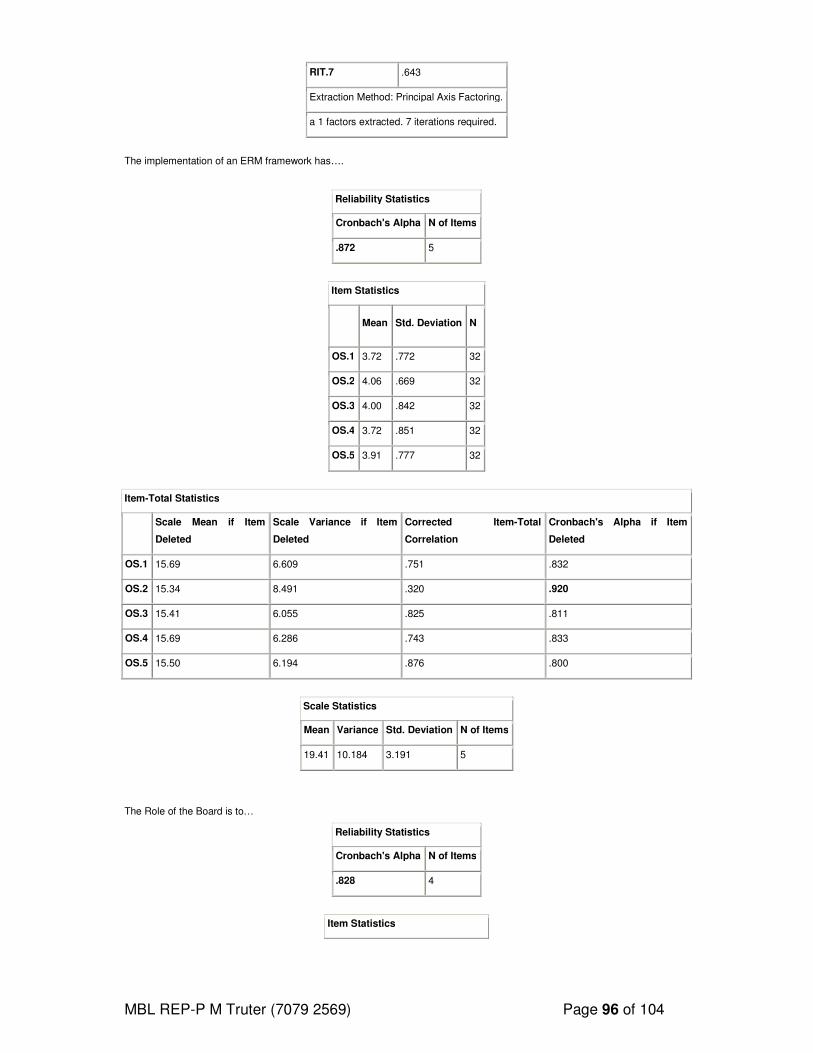
MBL REP-P M Truter (7079 2569) Page 96 of 104
RIT.7 .643
Extraction Method: Principal Axis Factoring.
a 1 factors extracted. 7 iterations required.
The implementation of an ERM framework has….
Reliability Statistics
Cronbach's Alpha N of Items
.872 5
Item Statistics
Mean Std. Deviation N
OS.1 3.72 .772 32
OS.2 4.06 .669 32
OS.3 4.00 .842 32
OS.4 3.72 .851 32
OS.5 3.91 .777 32
Item-Total Statistics
Scale Mean if Item
Deleted
Scale Variance if Item
Deleted
Corrected Item-Total
Correlation
Cronbach's Alpha if Item
Deleted
OS.1 15.69 6.609 .751 .832
OS.2 15.34 8.491 .320 .920
OS.3 15.41 6.055 .825 .811
OS.4 15.69 6.286 .743 .833
OS.5 15.50 6.194 .876 .800
Scale Statistics
Mean Variance Std. Deviation N of Items
19.41 10.184 3.191 5
The Role of the Board is to…
Reliability Statistics
Cronbach's Alpha N of Items
.828 4
Item Statistics
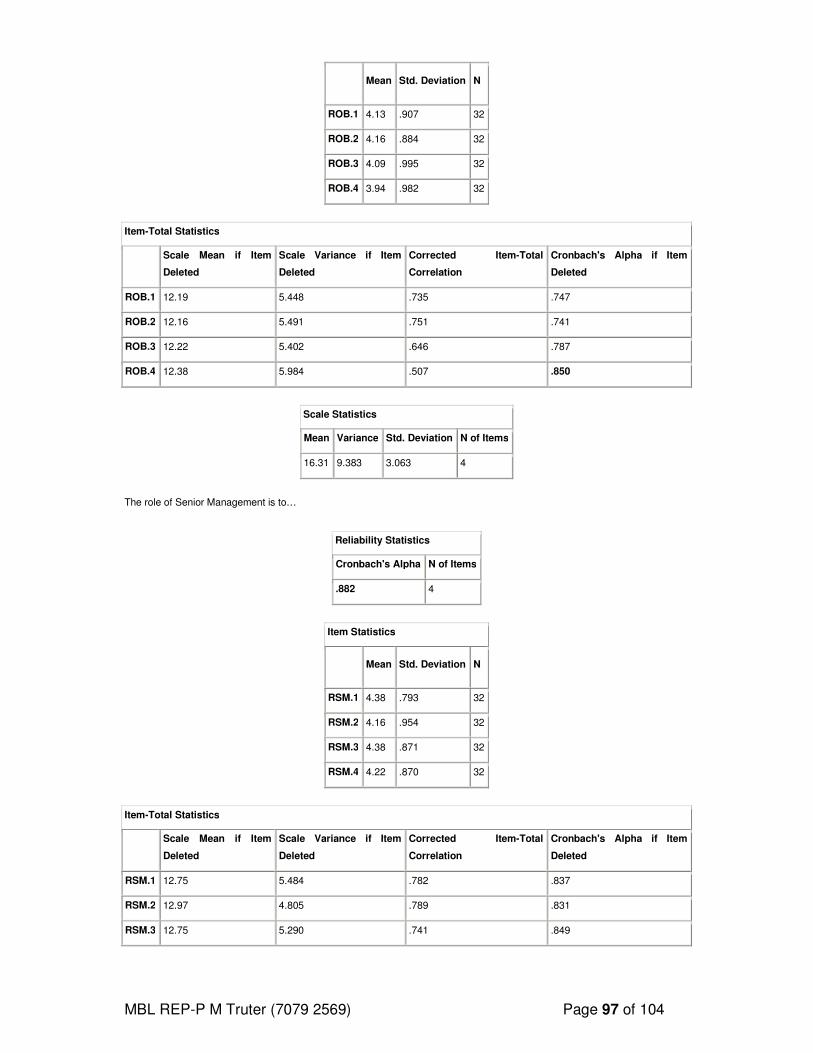
MBL REP-P M Truter (7079 2569) Page 97 of 104
Mean Std. Deviation N
ROB.1 4.13 .907 32
ROB.2 4.16 .884 32
ROB.3 4.09 .995 32
ROB.4 3.94 .982 32
Item-Total Statistics
Scale Mean if Item
Deleted
Scale Variance if Item
Deleted
Corrected Item-Total
Correlation
Cronbach's Alpha if Item
Deleted
ROB.1 12.19 5.448 .735 .747
ROB.2 12.16 5.491 .751 .741
ROB.3 12.22 5.402 .646 .787
ROB.4 12.38 5.984 .507 .850
Scale Statistics
Mean Variance Std. Deviation N of Items
16.31 9.383 3.063 4
The role of Senior Management is to…
Reliability Statistics
Cronbach's Alpha N of Items
.882 4
Item Statistics
Mean Std. Deviation N
RSM.1 4.38 .793 32
RSM.2 4.16 .954 32
RSM.3 4.38 .871 32
RSM.4 4.22 .870 32
Item-Total Statistics
Scale Mean if Item
Deleted
Scale Variance if Item
Deleted
Corrected Item-Total
Correlation
Cronbach's Alpha if Item
Deleted
RSM.1 12.75 5.484 .782 .837
RSM.2 12.97 4.805 .789 .831
RSM.3 12.75 5.290 .741 .849
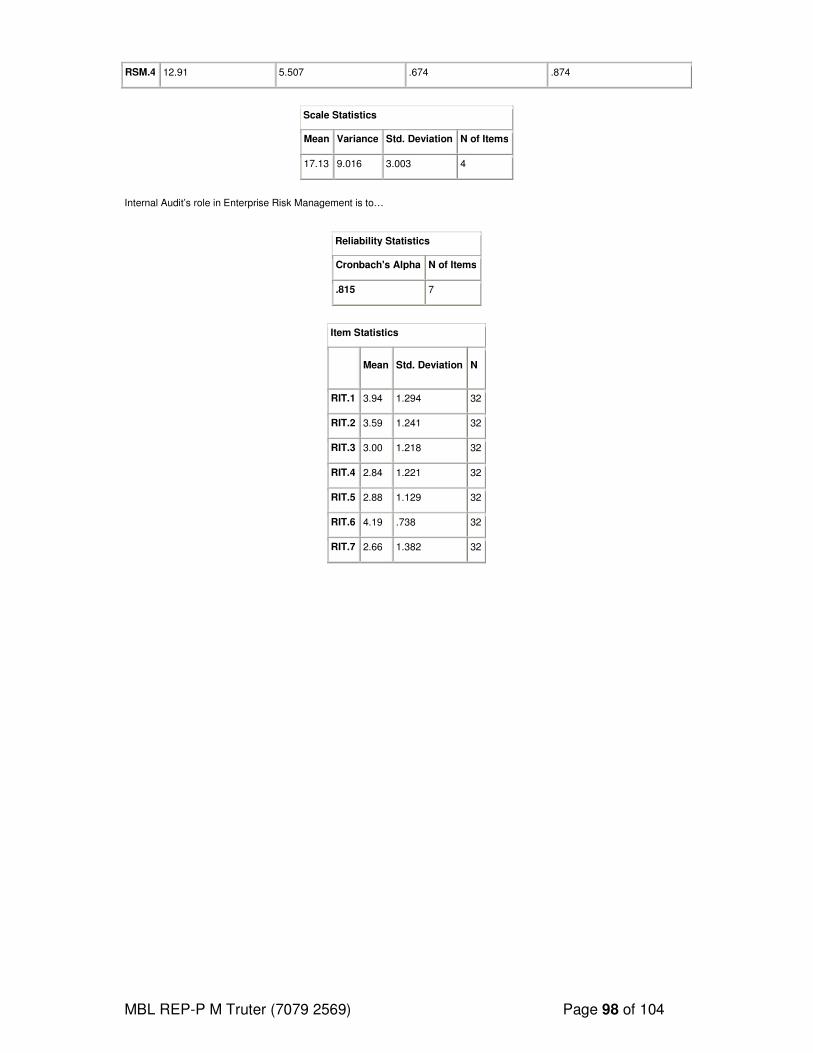
MBL REP-P M Truter (7079 2569) Page 98 of 104
RSM.4 12.91 5.507 .674 .874
Scale Statistics
Mean Variance Std. Deviation N of Items
17.13 9.016 3.003 4
Internal Audit’s role in Enterprise Risk Management is to…
Reliability Statistics
Cronbach's Alpha N of Items
.815 7
Item Statistics
Mean Std. Deviation N
RIT.1 3.94 1.294 32
RIT.2 3.59 1.241 32
RIT.3 3.00 1.218 32
RIT.4 2.84 1.221 32
RIT.5 2.88 1.129 32
RIT.6 4.19 .738 32
RIT.7 2.66 1.382 32
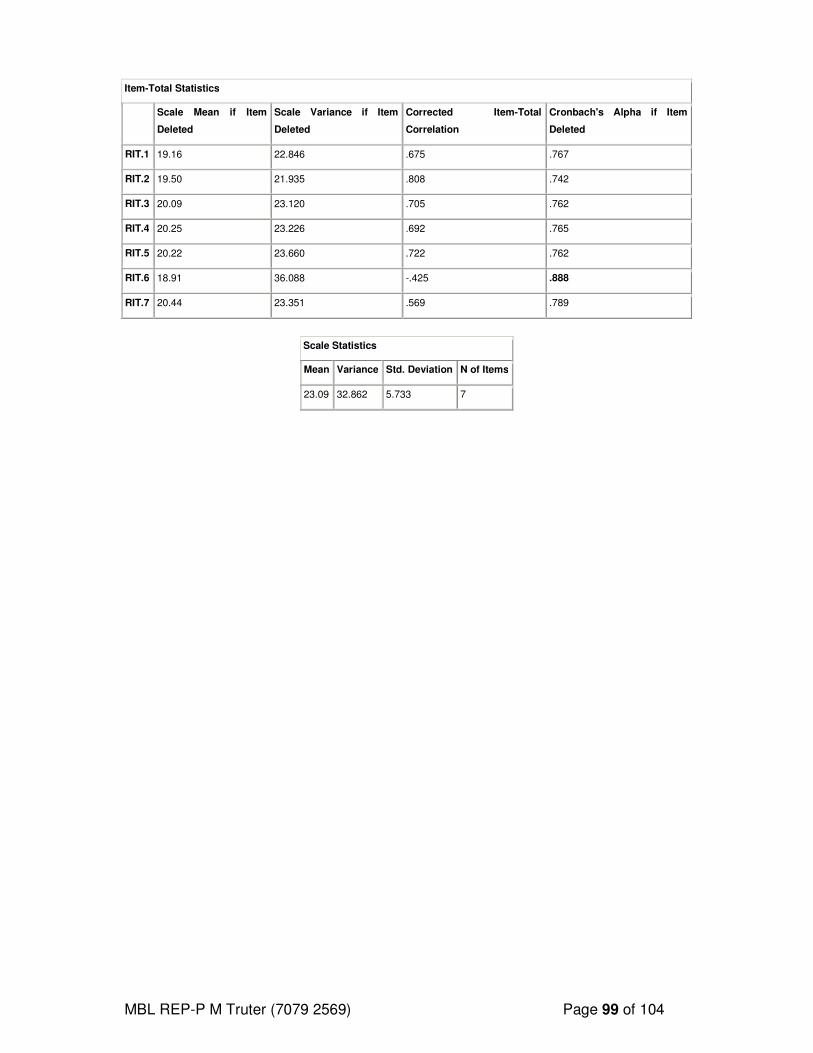
MBL REP-P M Truter (7079 2569) Page 99 of 104
Item-Total Statistics
Scale Mean if Item
Deleted
Scale Variance if Item
Deleted
Corrected Item-Total
Correlation
Cronbach's Alpha if Item
Deleted
RIT.1 19.16 22.846 .675 .767
RIT.2 19.50 21.935 .808 .742
RIT.3 20.09 23.120 .705 .762
RIT.4 20.25 23.226 .692 .765
RIT.5 20.22 23.660 .722 .762
RIT.6 18.91 36.088 -.425 .888
RIT.7 20.44 23.351 .569 .789
Scale Statistics
Mean Variance Std. Deviation N of Items
23.09 32.862 5.733 7
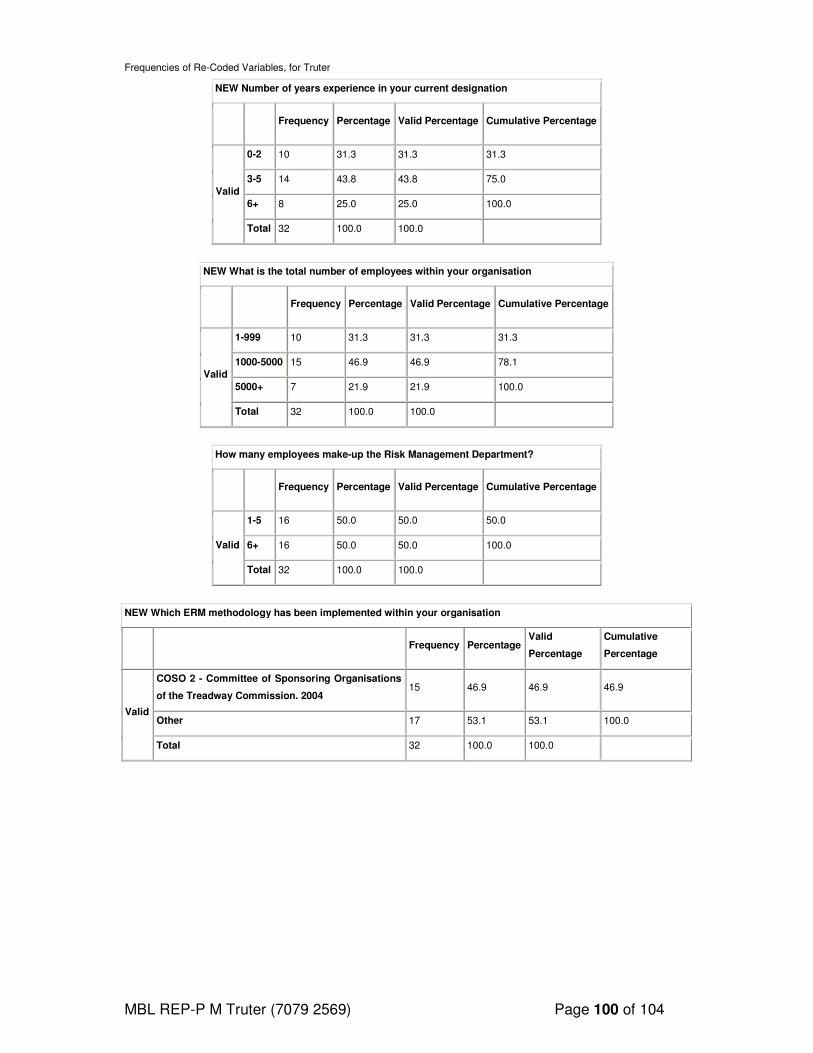
MBL REP-P M Truter (7079 2569) Page 100 of 104
Frequencies of Re-Coded Variables, for Truter
NEW Number of years experience in your current designation
Frequency Percentage Valid Percentage Cumulative Percentage
Valid
0-2 10 31.3 31.3 31.3
3-5 14 43.8 43.8 75.0
6+ 8 25.0 25.0 100.0
Total 32 100.0 100.0
NEW What is the total number of employees within your organisation
Frequency Percentage Valid Percentage Cumulative Percentage
Valid
1-999 10 31.3 31.3 31.3
1000-5000 15 46.9 46.9 78.1
5000+ 7 21.9 21.9 100.0
Total 32 100.0 100.0
How many employees make-up the Risk Management Department?
Frequency Percentage Valid Percentage Cumulative Percentage
Valid
1-5 16 50.0 50.0 50.0
6+ 16 50.0 50.0 100.0
Total 32 100.0 100.0
NEW Which ERM methodology has been implemented within your organisation
Frequency Percentage
Valid
Percentage
Cumulative
Percentage
Valid
COSO 2 - Committee of Sponsoring Organisations
of the Treadway Commission. 2004 15 46.9 46.9 46.9
Other 17 53.1 53.1 100.0
Total 32 100.0 100.0
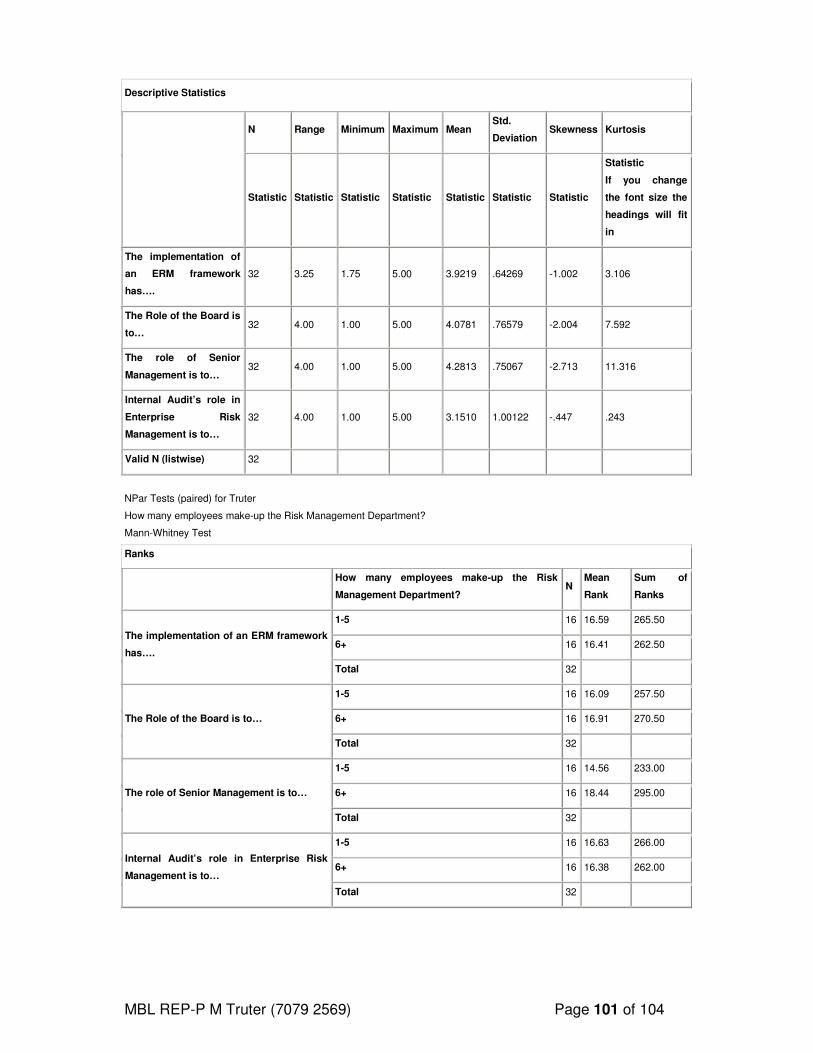
MBL REP-P M Truter (7079 2569) Page 101 of 104
Descriptive Statistics
N Range Minimum Maximum Mean Std.
Deviation Skewness Kurtosis
Statistic Statistic Statistic Statistic Statistic Statistic Statistic
Statistic
If you change
the font size the
headings will fit
in
The implementation of
an ERM framework
has….
32 3.25 1.75 5.00 3.9219 .64269 -1.002 3.106
The Role of the Board is
to… 32 4.00 1.00 5.00 4.0781 .76579 -2.004 7.592
The role of Senior
Management is to… 32 4.00 1.00 5.00 4.2813 .75067 -2.713 11.316
Internal Audit’s role in
Enterprise Risk
Management is to…
32 4.00 1.00 5.00 3.1510 1.00122 -.447 .243
Valid N (listwise) 32
NPar Tests (paired) for Truter
How many employees make-up the Risk Management Department?
Mann-Whitney Test
Ranks
How many employees make-up the Risk
Management Department? N
Mean
Rank
Sum of
Ranks
The implementation of an ERM framework
has….
1-5 16 16.59 265.50
6+ 16 16.41 262.50
Total 32
The Role of the Board is to…
1-5 16 16.09 257.50
6+ 16 16.91 270.50
Total 32
The role of Senior Management is to…
1-5 16 14.56 233.00
6+ 16 18.44 295.00
Total 32
Internal Audit’s role in Enterprise Risk
Management is to…
1-5 16 16.63 266.00
6+ 16 16.38 262.00
Total 32
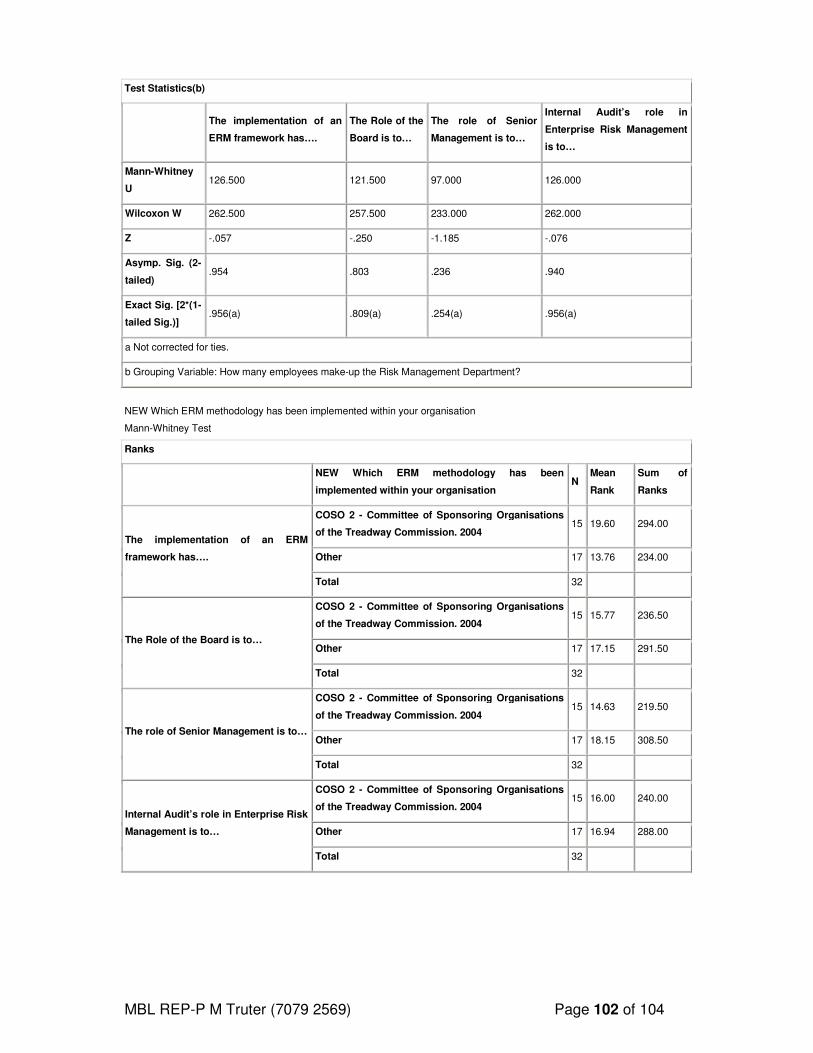
MBL REP-P M Truter (7079 2569) Page 102 of 104
Test Statistics(b)
The implementation of an
ERM framework has….
The Role of the
Board is to…
The role of Senior
Management is to…
Internal Audit’s role in
Enterprise Risk Management
is to…
Mann-Whitney
U 126.500 121.500 97.000 126.000
Wilcoxon W 262.500 257.500 233.000 262.000
Z -.057 -.250 -1.185 -.076
Asymp. Sig. (2-
tailed) .954 .803 .236 .940
Exact Sig. [2*(1-
tailed Sig.)] .956(a) .809(a) .254(a) .956(a)
a Not corrected for ties.
b Grouping Variable: How many employees make-up the Risk Management Department?
NEW Which ERM methodology has been implemented within your organisation
Mann-Whitney Test
Ranks
NEW Which ERM methodology has been
implemented within your organisation N
Mean
Rank
Sum of
Ranks
The implementation of an ERM
framework has….
COSO 2 - Committee of Sponsoring Organisations
of the Treadway Commission. 2004 15 19.60 294.00
Other 17 13.76 234.00
Total 32
The Role of the Board is to…
COSO 2 - Committee of Sponsoring Organisations
of the Treadway Commission. 2004 15 15.77 236.50
Other 17 17.15 291.50
Total 32
The role of Senior Management is to…
COSO 2 - Committee of Sponsoring Organisations
of the Treadway Commission. 2004 15 14.63 219.50
Other 17 18.15 308.50
Total 32
Internal Audit’s role in Enterprise Risk
Management is to…
COSO 2 - Committee of Sponsoring Organisations
of the Treadway Commission. 2004 15 16.00 240.00
Other 17 16.94 288.00
Total 32
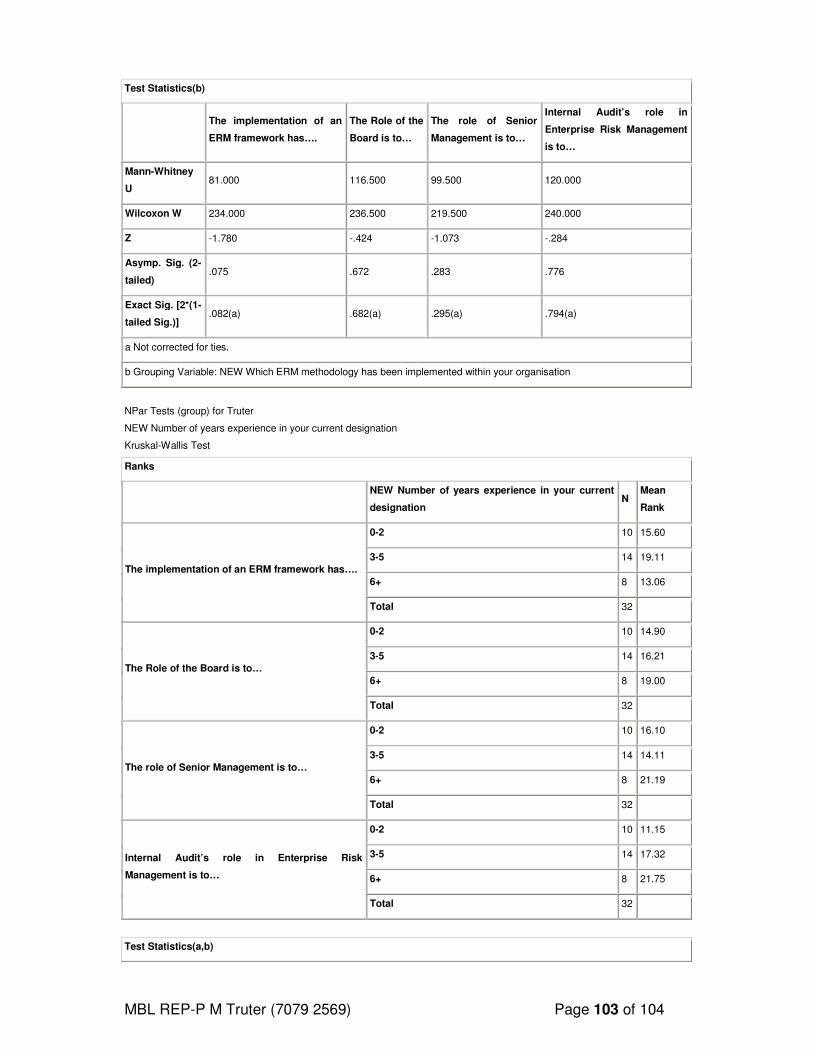
MBL REP-P M Truter (7079 2569) Page 103 of 104
Test Statistics(b)
The implementation of an
ERM framework has….
The Role of the
Board is to…
The role of Senior
Management is to…
Internal Audit’s role in
Enterprise Risk Management
is to…
Mann-Whitney
U 81.000 116.500 99.500 120.000
Wilcoxon W 234.000 236.500 219.500 240.000
Z -1.780 -.424 -1.073 -.284
Asymp. Sig. (2-
tailed) .075 .672 .283 .776
Exact Sig. [2*(1-
tailed Sig.)] .082(a) .682(a) .295(a) .794(a)
a Not corrected for ties.
b Grouping Variable: NEW Which ERM methodology has been implemented within your organisation
NPar Tests (group) for Truter
NEW Number of years experience in your current designation
Kruskal-Wallis Test
Ranks
NEW Number of years experience in your current
designation N
Mean
Rank
The implementation of an ERM framework has….
0-2 10 15.60
3-5 14 19.11
6+ 8 13.06
Total 32
The Role of the Board is to…
0-2 10 14.90
3-5 14 16.21
6+ 8 19.00
Total 32
The role of Senior Management is to…
0-2 10 16.10
3-5 14 14.11
6+ 8 21.19
Total 32
Internal Audit’s role in Enterprise Risk
Management is to…
0-2 10 11.15
3-5 14 17.32
6+ 8 21.75
Total 32
Test Statistics(a,b)
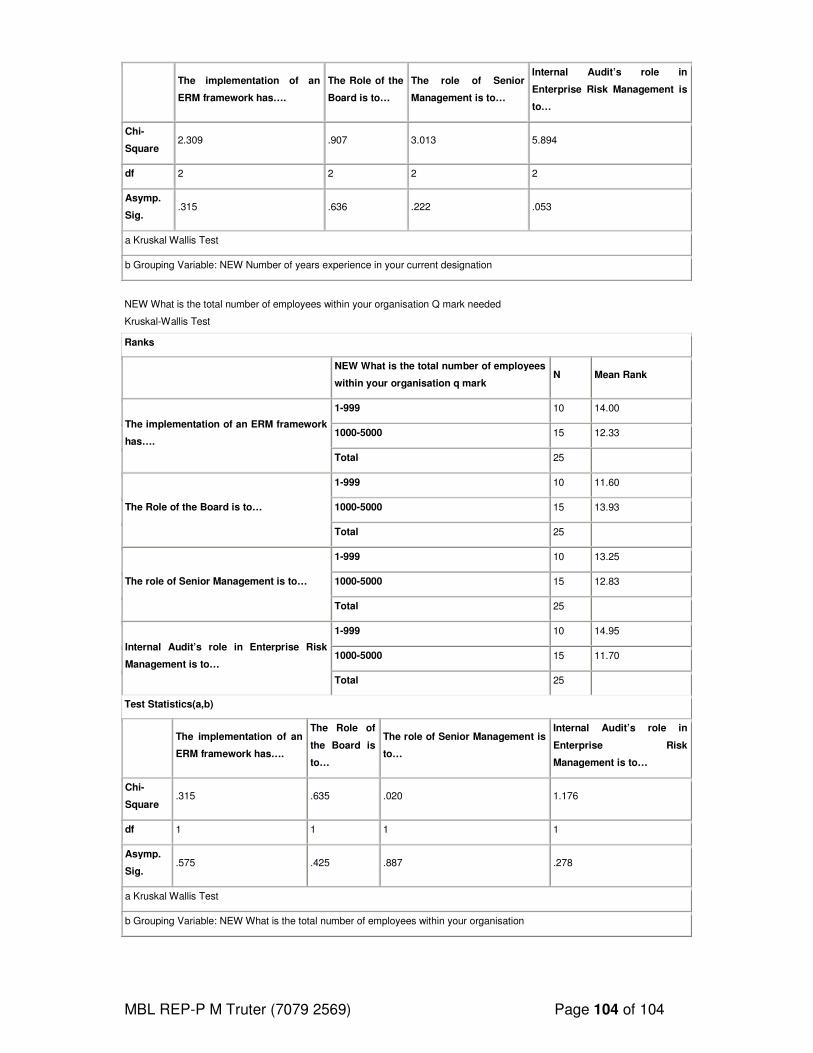
MBL REP-P M Truter (7079 2569) Page 104 of 104
The implementation of an
ERM framework has….
The Role of the
Board is to…
The role of Senior
Management is to…
Internal Audit’s role in
Enterprise Risk Management is
to…
Chi-
Square 2.309 .907 3.013 5.894
df 2 2 2 2
Asymp.
Sig. .315 .636 .222 .053
a Kruskal Wallis Test
b Grouping Variable: NEW Number of years experience in your current designation
NEW What is the total number of employees within your organisation Q mark needed
Kruskal-Wallis Test
Ranks
NEW What is the total number of employees
within your organisation q mark N Mean Rank
The implementation of an ERM framework
has….
1-999 10 14.00
1000-5000 15 12.33
Total 25
The Role of the Board is to…
1-999 10 11.60
1000-5000 15 13.93
Total 25
The role of Senior Management is to…
1-999 10 13.25
1000-5000 15 12.83
Total 25
Internal Audit’s role in Enterprise Risk
Management is to…
1-999 10 14.95
1000-5000 15 11.70
Total 25
Test Statistics(a,b)
The implementation of an
ERM framework has….
The Role of
the Board is
to…
The role of Senior Management is
to…
Internal Audit’s role in
Enterprise Risk
Management is to…
Chi-
Square .315 .635 .020 1.176
df 1 1 1 1
Asymp.
Sig. .575 .425 .887 .278
a Kruskal Wallis Test
b Grouping Variable: NEW What is the total number of employees within your organisation