implementation of an ultra-low cost heat exchanger
TRANSCRIPT

Paper ID #15241
Implementation of an Ultra-low Cost Heat Exchanger Learning Module toAddress Energy Balance Concepts
Ms. Negar Beheshti Pour, Washington State University
Negar Beheshtipour received her B.S. in chemical Engineering at Tehran University where she also taughtas a teacher assistant. She is currently working towards a PhD in Chemical Engineering at WashingtonState University under supervision of Dr. Van Wie and Dr. Thiessen. In addition to her chemical engi-neering research into phase separation in microgravity, Negar is interested in engineering education andnew pedagogies. Now she is working on low-cost version of desktop learning modules.
David B. Thiessen, Washington State University
David B.Thiessen received his Ph.D. in Chemical Engineering from the University of Colorado in 1992and has been at Washington State University since 1994. His research interests include fluid physics,acoustics, and engineering education.
Prof. Bernard J. Van Wie, Washington State University
Prof. Bernard J. Van Wie received his B.S., M.S. and Ph.D., and did his postdoctoral work at the Universityof Oklahoma where he also taught as a visiting lecturer. He has been on the Washington State Universityfaculty for 32 years and for the past 18 years has focused on innovative pedagogy research and technicalresearch in biotechnology. His 2007-2008 Fulbright exchange to Nigeria set the stage for him to receivethe Marian Smith Award given annually to the most innovative teacher at Washington State University.
c©American Society for Engineering Education, 2016

Implementation of an Ultra-low Cost Heat Exchanger Learning Module to
Address Energy Balance Concepts
Introduction
Engineering education researchers are publishing many instructional designs that report a
cognitive edge over straight lecture (1, 2). These fall under the category of High Performance
Learning Environments (Hi-Pe-LE) (3) which constitute a wide array of pedagogies of
engagement (4) like Problem-Based Learning (PBL) (5), hands-on learning and experimental
formats (6-11), interaction-enhanced lectures (12), and multimedia-aided deliveries (13-16).
Multimedia learning is known to reduce cognitive load and thereby enhance learning (17-20).
Prior work in our group led to commercialization of modular, instrumented, desktop learning
modules (DLMs) to ease the implementation of hands-on activities in a classroom environment.
We expect the use of DLMs to help students learn by reducing cognitive load. This paper reports
on a new system being developed with a goal of making experimental modules that are
affordable for individual student purchase.
A low-cost, vacuum-formed, shell and tube heat exchanger was constructed and used as an
instructional module in a sophomore-level, introductory chemical engineering course. The
primary learning goal for the module was for students to be able to make appropriate
measurements and apply the principle of energy conservation to analyze a real-world engineering
process. Activities were designed to help students with system boundary concepts. This seems to
be an easy concept in textbooks but can be challenging when it comes to real systems, as
students often do not fully appreciate the purpose of identifying a system boundary.
The design and construction techniques used for the heat exchanger described here are simple
enough to allow undergraduates to design and build their own heat exchangers if desired. This
was beyond the scope of the current project, but that approach has been used at Drexel
University where undergraduate students were asked to design and prototype a micro-heat
exchanger (21).
This paper starts with a brief introduction to the techniques we used to create this ultra-low-cost,
simple and see-through shell and tube heat exchanger and then we report on the implementation
and assessment of this instructional tool in a lower division course.
Design, Modeling and Manufacturing
For developing this very low cost miniaturized industrial shell and tube heat exchanger, flow and
heat-transfer modeling of alternative designs was performed with COMSOL software, and final
detailed system design used SolidWorks CAD software. Figure 1 summarizes the fabrication
steps. A detailed mold is designed in SolidWorks to match the dimensions of the basic design
tested in COMSOL (Fig. 1a). Next the CAD design of the mold is printed on a 3D printer
(Fig. 1b). This gives us the ability to perform rapid prototyping. Transparent PETG plastic sheets
are used in vacuum forming the shell of the heat exchanger to allow students to see the tube and

baffle arrangement inside the exchanger and to watch how fluid flows through the shell. The two
halves of the shell are cemented together while incorporating stainless steel tubes (Fig. 1d).
Finally gravity reservoirs on a ring stand are connected by silicone tubing to the heat exchanger
and collection beakers are placed beneath the outlet tubes (Fig. 1e). Food coloring can be added
to the shell-side reservoir to enhance visibility (Figs. 1e and f).
Figure 1. Fabrication steps of low-cost shell and tube module. (a)-(c) shows the SolidWorks
design, 3D printing, and printed mold respectively for earlier prototypes of the heat exchanger.
The final design of the heat exchanger is shown in the gluing jig in (d) and in the learning station
setup in (e). A close-up of the heat exchanger with food coloring in the shell is shown in (f).
Classroom Implementation
The heat exchanger module was implemented in an introductory material and energy balance
course for sophomore-level chemical engineers during summer 2015. To orient students on the
use of this desktop module a YouTube video was made available prior to class. Class was
conducted in a room with lab benches and students were divided into 9 groups of 3 or 4 students
with each group having their own heat exchanger setup. Worksheets were provided that required
both qualitative observations and quantitative measurements (see Appendix B). The worksheet
first directed students to discuss with their team members several topics that are known to be
persistent misconceptions. The topics focused on misconceptions that could be resolved by
visual observation. Students often have misconceptions about the flow path for the tube side or
shell side fluid. Others think that the shell side fluid mixes directly with the tube side fluid. To
address these misconceptions we first have students think alone, then share with teammates what
they think will happen. They are even asked to draw a predicted flow pattern on the transparent
plastic shell for both the shell and tube sides using two different colored dry erase markers before
and after running an experiment. This allows them to actively engage in the learning process as

teams discuss hypothetical flow patterns and then correct any misconceptions. By observing flow
patterns for the tube side, students realize there are two passes and that flow is in the same
direction for adjacent tubes within the same pass. By adding colored dye to the shell side
reservoir, students observe that no mixing occurs between the two fluids.
Students also made quantitative measurements of the heat duty of the exchanger for different hot
and cold water temperatures. A handheld digital thermometer was used to measure the hot and
cold water temperatures in the reservoirs before opening pinch clamps on the hoses and then the
temperatures of the streams coming out of the exchanger were measured in the collection
beakers. The flow rate of each stream was also measured using a stopwatch and measuring the
volume collected in the beakers. The water in the collection beakers was subsequently poured
back into the supply reservoirs for the next run, resulting in a set of runs with decreasing
temperature difference between the hot and cold streams. The calculation of heat duty from the
measured data was part of a homework assignment.
Student Data
Figure 2 shows student measurements of the heat duty based on their cold stream data plotted
against that measured for their hot stream data for each run in the series of four measurements
that each group made with decreasing temperature differences. The different symbols in Fig. 2
represent the different groups. For a perfectly insulated heat exchanger the magnitudes of the hot
and cold heat duties would be equal. Figure 2 shows that in this shell and tube heat exchanger the
measured heat duties tend to be larger for the hot side as the system is not perfectly insulated
from the environment and evaporative heat loss from the hot stream occurs as it flows into the
collection beaker. Considering the limited time for this exercise (50 minutes) and the bias due to
evaporative heat loss, the data is reasonably consistent with a few exceptions.

Figure 2. Measured heat duty of the cold stream versus the hot stream. The rates are not equal as
the system is not insulated ideally and more heat is lost by the hot stream than gained by the
cold.
Student Feedback
During the implementation we asked 9 students (one person selected randomly from each group)
to answer 4 questions about the experiment. The main purpose of this survey was to gauge
student attitudes about using this low-cost module. Table 1 summarizes the survey questions and
student responses. All 9 students surveyed liked the low cost module and found the experiment
clear and straight forward. Four of them believed this experiment was helpful while two of them
would prefer to work with larger industrial equipment and three students had no preferences.
y = 0.6155x
0
100
200
300
400
500
600
700
800
900
1000
0 200 400 600 800 1000 1200 1400 1600
Q C
old
[W]
Q Hot [W]
Group #1
Group #2
Group #3
Group #4
Group #5
Group #6
Group #7
Group #8
Group #9

Table 1. Survey questions about the experiment with the low cost shell and tube and student
responses .
Questions Yes No Students’ Comments
1. Did you like it?
If yes, what was the most
interesting feature of this
apparatus?
If no, could you tell us
why?
9 0
1. Hands on made me look at the things in a
different perspective.
2. Calculating Q with measured values was the
most interesting part.
3. The most interesting thing about this was
that a friend of mine did research on DLMs
here in WSU.
4. Hands on relates to class topics.
5. It was green (the food color).
6. Learning how to read the flow rate of the
system.
7. The experiment seemed too simplistic.
8. Scales down the heat exchanger and
demonstrates the principle clearly.
9. The colored stream identifies which stream
took its respective path.
2. Honestly, was it helpful?
If you could choose
between working with
these kinds of apparatuses
and working with
equipment in the unit
operations lab, which one
do you prefer?
4 2
1. It is transparent and we can know more about
how they work.
2. Putting the process to visual helps with
theoretical calculation.
3. Prefer working with equipment.
4. No preference (3 students).
5. Not familiar with unit operation lab.
3. Was the experiment clear and
straight forward? 9 0
1. The equipment was self-explanatory.
2. Something like what to measure was unclear
but easily figured out after question.
4. Did you watch the related
video before coming to the
lab?
8 1 1. It was helpful.
Assessments
To assess student learning we used a pretest and posttest. The pre and posttest were given at the
beginning and end of the 75-minute class period. The same four open-ended questions were used
for both pretest and posttest. The first two questions were selected from the AIChE Concept
Warehouse (22) and we designed the two last questions to probe understanding of the system
boundary and energy balance concepts. The first question chosen from the AIChE Concept
Warehouse (ID:1657 Heat Exchangers 3) was selected to address the relation between mass flow
rate and temperature change for a stream passing through a heat exchanger. The second question
also from the AIChE Concept Warehouse (ID:968 Constant Heat Capacity Mixing of Hot and
Cold Streams) was selected to ask about the final temperature of a mixture of two fluids starting
with different temperatures. Questions 3 and 4 can be found in Appendix A. For question 3
students were given a schematic of a simple heat exchanger and asked to draw the system
boundary in order to calculate the rate of heat transfer from the hot side to the cold side while in
question 4 they were asked to write down the data they would need in order to calculate the heat
duty (question 4).
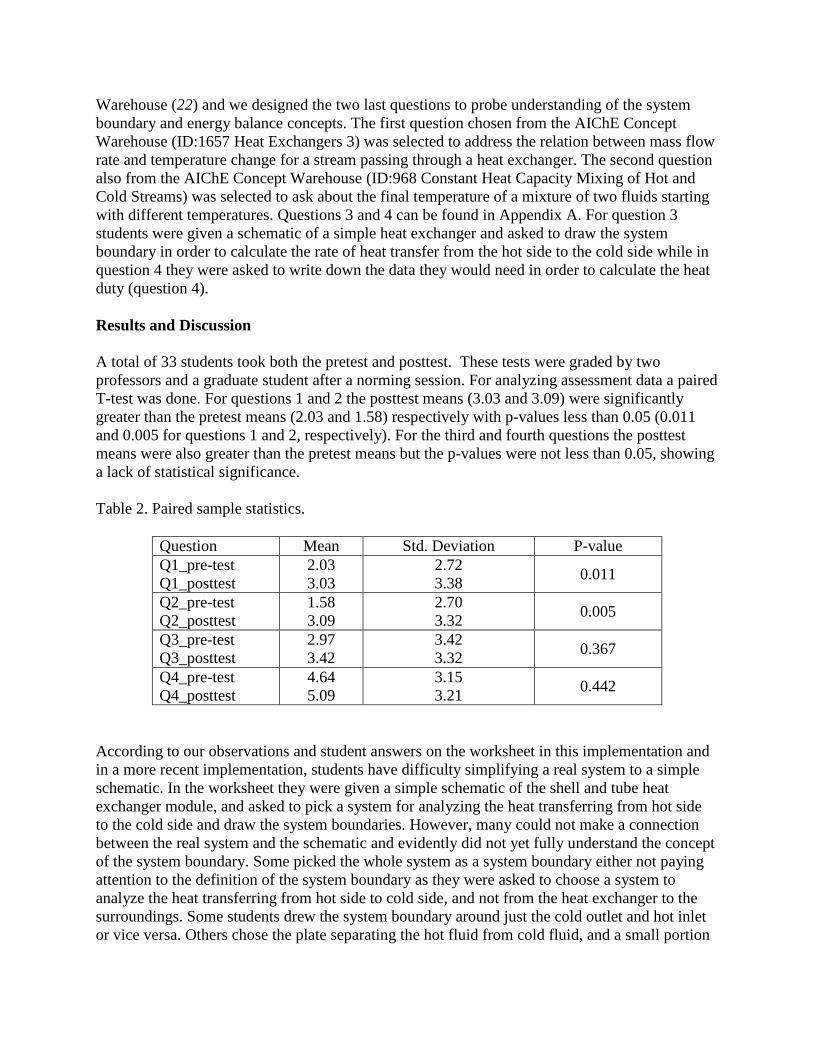
Results and Discussion
A total of 33 students took both the pretest and posttest. These tests were graded by two
professors and a graduate student after a norming session. For analyzing assessment data a paired
T-test was done. For questions 1 and 2 the posttest means (3.03 and 3.09) were significantly
greater than the pretest means (2.03 and 1.58) respectively with p-values less than 0.05 (0.011
and 0.005 for questions 1 and 2, respectively). For the third and fourth questions the posttest
means were also greater than the pretest means but the p-values were not less than 0.05, showing
a lack of statistical significance.
Table 2. Paired sample statistics.
Question Mean Std. Deviation P-value
Q1_pre-test
Q1_posttest
2.03
3.03
2.72
3.38 0.011
Q2_pre-test
Q2_posttest
1.58
3.09
2.70
3.32 0.005
Q3_pre-test
Q3_posttest
2.97
3.42
3.42
3.32 0.367
Q4_pre-test
Q4_posttest
4.64
5.09
3.15
3.21 0.442
According to our observations and student answers on the worksheet in this implementation and
in a more recent implementation, students have difficulty simplifying a real system to a simple
schematic. In the worksheet they were given a simple schematic of the shell and tube heat
exchanger module, and asked to pick a system for analyzing the heat transferring from hot side
to the cold side and draw the system boundaries. However, many could not make a connection
between the real system and the schematic and evidently did not yet fully understand the concept
of the system boundary. Some picked the whole system as a system boundary either not paying
attention to the definition of the system boundary as they were asked to choose a system to
analyze the heat transferring from hot side to cold side, and not from the heat exchanger to the
surroundings. Some students drew the system boundary around just the cold outlet and hot inlet
or vice versa. Others chose the plate separating the hot fluid from cold fluid, and a small portion

selected either the hot or cold flow. These misconceptions might be addressed by a scaffolded
approach where students start with an even simpler heat exchanger consisting of a flat plate
separating the flowing hot and cold fluids.
Conclusions
We have demonstrated a straightforward and efficient technique for producing ultra-low cost
desktop learning modules that demonstrate concepts typically covered in introductory courses
covering energy balances. Assessments reveal surprisingly that many misconceptions are present
in what professors often think are ideas that are rather simple to grasp. Knowledge of where
students struggle with their understanding is paving the way for new simple constructs that we
believe can unequivocally resolve these misconceptions.
Acknowledgements
This project was funded by NSF IUSE 1432674. We want to acknowledge Professor Bob
Richards for his ideas of employing 3D printing and vacuforming to produce low cost heat
transfer and fluid flow modules and we thank graduate student Fanhe Meng for helping us with
the vacuforming. We thank undergraduate students Sam Schardt and Tanner Gerety for
assembling the DLMs and Adam Saleh for helping us to make an instructional video to orient
students for the DLM implementation.
References
1. Pellegrino, J. W. In Understanding how students learn and inferring what they know:
Implications for the design of curriculum, instruction and assessment, NSF K-12 Mathematics
and science curriculum and implementation centers conference proceedings, 2002; National
Science Foundation and American Geological Institute Washington, DC: 2002; pp 76-92.
2. Johnson, D. W.; Johnson, R. T.; Smith, K. A., Cooperative learning returns to college
what evidence is there that it works? Change: the magazine of higher learning (1998), pp 26-35.
3. Sauer, S. G.; Arce, P. E. In Development, Implementation, and Assessment of High
Performance Learning Environments, AIChE, Salt Lake City, UT, 2007; Salt Lake City, UT,
2007.
4. Smith, K. A.; Sheppard, S. D.; Johnson, D. W.; Johnson, R. T., Pedagogies of
engagement: Classroom‐based practices. Journal of engineering education 2005, 94, 87-101.
5. Gijbels, D.; Dochy, F.; Van den Bossche, P.; Segers, M., Effects of problem-based
learning: A meta-analysis from the angle of assessment. Review of educational research 2005,
75, 27-61.
6. Abdul, B.; Van Wie, B. J.; Babauta, J. T.; Golter, P. B.; Brown, G. R.; Bako, R. B.;
Ahmed, A. S.; Shide, E. G.; Anafi, F. O.; Olaofe, O. O., Addressing Student Learning Barriers in
Developing Nations with a Novel Hands-on Active Pedagogy and Miniaturized Industrial
Process Equipment: The Case of Nigeria. International Journal of Engineering Education 2011,
27, 458-476.

7. Agarwala, R.; Abdel-Salam, T. M.; Faruqi, M., Introducing thermal and fluid systems to
industrial engineering technology students with hands-on laboratory experience. In American
Society for Engineering Education, Hawaii, 2007.
8. Ma, J.; Nickerson, J. V., Hands-on, simulated, and remote laboratories: A comparative
literature review. ACM Computing Surveys (CSUR) 2006, 38, 7.
9. Ribando, R. J.; Richards, L. G.; O’Leary, G. W., A “Hands-On” Approach to Teaching
Undergraduate Heat Transfer. In ASME 2004 International Mechanical Engineering Congress
and Exposition, American Society of Mechanical Engineers: 2004; pp 413-422.
10. Minerick, A., Desktop experiment module: heat transfer. In American Society for
Engineering Education, Austin, 2009.
11. Visco Jr, D. P., Student Designed Desktop Modules in A Thermodynamics Course. In
American Society for Engineering Education, Arkansas, 2011.
12. Van Dijk, L. A.; Jochems, W., Changing a traditional lecturing approach into an
interactive approach: Effects of interrupting the monologue in lectures. International Journal of
engineering education 2002, 18, 275-284.
13. Marcos-Acevedo, J.; Vilas-Iglesias, J. M.; Pérez-López, S. A., Multimedia System for the
Teaching of Proximity Sensors. International Journal of Engineering Education 2006, 22, 1304.
14. Mayer, R. E.; Hegarty, M.; Mayer, S.; Campbell, J., When static media promote active
learning: annotated illustrations versus narrated animations in multimedia instruction. Journal of
Experimental Psychology: Applied 2005, 11, 256.
15. Yuen, S. T.; Naidu, S., Using multimedia to close the gap between theory and practice in
engineering education. International Journal of Engineering Education 2007, 23, 536-544.
16. Damewood, S.; Jeanmonod, D.; Cadigan, B., Comparison of a multimedia simulator to a
human model for teaching FAST exam image interpretation and image acquisition. Academic
Emergency Medicine 2011, 18, 413-419.
17. Brunken, R.; Plass, J. L.; Leutner, D., Direct measurement of cognitive load in
multimedia learning. Educational Psychologist 2003, 38, 53-61.
18. Mayer, R. E.; Moreno, R., Nine ways to reduce cognitive load in multimedia learning.
Educational psychologist 2003, 38, 43-52.
19. Tabbers, H. K.; Martens, R. L.; Merriënboer, J. J., Multimedia instructions and cognitive
load theory: Effects of modality and cueing. British Journal of Educational Psychology 2004, 74,
71-81.
20. Van Merrienboer, J. J.; Sweller, J., Cognitive load theory and complex learning: Recent
developments and future directions. Educational psychology review 2005, 17, 147-177.
21. Gillander, M. J. B., Undergraduate Research Projects using Microfluidic Devices. In
American Society for Engineering Education, Atlanta, 2013.
22. Brooks, B. J., Gilbuena, D., Falconer, J. L., Silverstein, D. L., Miller, R. L., Koretsky,
M. , Preliminary Development of the AIChE Concept Warehouse In American Society for
Engineering Education, San Antonio, Texas, 2012.

Appendix A
The third and fourth questions of pre and post quizzes designed by the authors.
Question 3:
Heat exchanger analysis:
(a) A simple heat exchanger is shown above. If you want to determine the rate of heat transfer
from hot fluid to cold fluid, what would you pick as the system to analyze? (Draw the system
boundaries on the figure and make notes as necessary.)
(b) Briefly justify your rational for this answer:
Question 4:
Heat exchanger analysis:
(a) A simple heat exchanger is shown above. For calculating the heat transfer rate, what would
you need to measure?
(b) Briefly justify your rational for this answer:

Appendix B
Heat Exchanger Lab Worksheet – Turn in this handout at the end of lab
At your station you should have a transparent heat exchanger connected to two beakers on a ring
stand, a set of four other beakers, a digital thermometer, and possibly a stopwatch. Take a few
minutes to examine the heat exchanger and flow connections. A photo of setup is shown below.
Experimental setup. Shell and tube heat exchanger. Green liquid is in the shell.
Qualitative observations
Close both pinch clamps connecting the water supply beakers to the heat exchanger. Fill the
tube-side supply beaker with hot water and the shell-side beaker with cold water from the sink.
Note the difference in how the water feels in the two beakers. Place food coloring in the beaker
attached to the shell. Open both pinch clamps at once and observe the flow pattern in the shell
(look at the path of any entrained bubbles). Now note the difference in how the water feels in the
two outflow beakers. You may want to repeat this several times. Record your observations
below.
1. Sketch the flow pattern in the shell:
2. Do you feel a difference in the water temperatures from before they flowed through the heat
exchanger? Describe the change.
3. Was there any mixing of the hot and cold water streams in the exchanger? How can you tell?
4. Explain how heat is transferring from the hot stream to the cold stream within the exchanger.
You might want to use a sketch.
Detach here and turn in the handout at the end of lab.

Quantitative Measurements
To avoid transient effects associated with startup and shut down of flow you will need to initially
let the flows go into waste beakers for about 5 seconds before quickly switching to the empty
outlet measurement beakers. The timer should be started at the instant the beakers are switched
and you should allow the flows to continue for 20 seconds at which time you should quickly pull
the measurement beakers out of the streams replacing them with the waste beakers to collect the
rest of the flow.
1. Place the empty tri-cornered waste beakers under the heat exchanger outlet tubes.
2. Close both pinch clamps and fill the beaker attached to the shell side with cold water and
the beaker attached to the tube side with hot water from the lab sink.
3. Measure the temperatures of the cold and hot water in the supply beakers and record in
the data table as the inlet temperatures. You should measure the hot water temperature
immediately before starting flow.
4. Open both pinch clamps simultaneously.
5. After about 5 seconds simultaneously replace both waste beakers with the empty outlet
measurement beakers. Two team members can perform the beaker switch while a third
starts the stopwatch at the instant the outlet collection beakers are in place.
6. After 20 seconds of collecting the flow the collection beakers should both be
simultaneously replaced by the waste beakers again. This may require some practice to
do this without spilling any of the collected water.
7. The temperature of the water in the tube-side outlet beaker should be immediately
measured and recorded followed by the shell-side.
8. Finally record the volume of water in each outlet beaker in the appropriate location in the
data table.
9. Record the actual time of flow collection (20 seconds or whatever it was).
10. Now close the pinch clamps and pour the water collected from the outlets back into the
corresponding inlet beakers and repeat the experiment recording the data as trial 2.
11. Repeat two more times using the same water recording the data as trials 3 and 4.
Data Table
Trial #
Tube Side Shell Side
time (s) T in T out V (mL) T in T out V (mL)
1
2
3
4

Group Homework and Data Analysis
Submit one analysis for your group at the start of class on 30 July. Attach additional pages as
necessary.
Using the data collected from trials 1 to 4 determine the rate of heat transfer for each trial
determined by separate energy balances on the tube side and shell side of the exchanger and
record in the table below. First determine the mass flow rate for each side using the volume and
time data that you recorded. Then determine the temperature change (outlet minus inlet) for each
side of the exchanger. Finally determine the rate of heat transfer to or from the water passing
through the tube side and shell side respectively.
Heat Duty Analysis
Trial #
Tube Side Shell Side
�̇� (kg/s) ∆𝑇 �̇� (W) �̇� (kg/s) ∆𝑇 �̇� (W)
1
2
3
4
1. Is the rate of heat leaving the hot water equal to the rate of heat gain by the cold water? Do
you expect it to be? Why or why not?
2. Do you see a change in the rate of heat transfer for the different trials? What do you propose
causes this change?