implementation and reporting of causal mediation analysis ...studies apply and report the elements...
TRANSCRIPT

Liu et al. BMC Res Notes (2016) 9:354 DOI 10.1186/s13104-016-2163-7
RESEARCH ARTICLE
Implementation and reporting of causal mediation analysis in 2015: a systematic review in epidemiological studiesShao‑Hsien Liu1*, Christine M. Ulbricht2, Stavroula A. Chrysanthopoulou3 and Kate L. Lapane2
Abstract
Background: Causal mediation analysis is often used to understand the impact of variables along the causal path‑way of an occurrence relation. How well studies apply and report the elements of causal mediation analysis remains unknown.
Methods: We systematically reviewed epidemiological studies published in 2015 that employed causal media‑tion analysis to estimate direct and indirect effects of observed associations between an exposure on an outcome. We identified potential epidemiological studies through conducting a citation search within Web of Science and a keyword search within PubMed. Two reviewers independently screened studies for eligibility. For eligible studies, one reviewer performed data extraction, and a senior epidemiologist confirmed the extracted information. Empirical application and methodological details of the technique were extracted and summarized.
Results: Thirteen studies were eligible for data extraction. While the majority of studies reported and identified the effects of measures, most studies lacked sufficient details on the extent to which identifiability assumptions were satisfied. Although most studies addressed issues of unmeasured confounders either from empirical approaches or sensitivity analyses, the majority did not examine the potential bias arising from the measurement error of the media‑tor. Some studies allowed for exposure‑mediator interaction and only a few presented results from models both with and without interactions. Power calculations were scarce.
Conclusions: Reporting of causal mediation analysis is varied and suboptimal. Given that the application of causal mediation analysis will likely continue to increase, developing standards of reporting of causal mediation analysis in epidemiological research would be prudent.
Keywords: Causal mediation analysis, Systematic review, Causal inference, Causality
© 2016 The Author(s). This article is distributed under the terms of the Creative Commons Attribution 4.0 International License (http://creativecommons.org/licenses/by/4.0/), which permits unrestricted use, distribution, and reproduction in any medium, provided you give appropriate credit to the original author(s) and the source, provide a link to the Creative Commons license, and indicate if changes were made. The Creative Commons Public Domain Dedication waiver (http://creativecommons.org/publicdomain/zero/1.0/) applies to the data made available in this article, unless otherwise stated.
BackgroundCausal mediation analysis identifies potential pathways that could explain observed associations between an exposure and an outcome [1]. This approach also exam-ines how a third intermediate variable, the mediator, is related to the observed exposure-outcome relationship. Causal mediation analysis has been used to study genetic factors in disease causation [2, 3], pathways associated
with response to clinical treatments [4], and mechanisms impacting on public health interventions [5, 6]. There are two approaches for conducting causal mediation analysis. The first, primarily applied in the social sciences, involves the comparison between regression models with and without conditioning on the mediator [7]. The second approach uses the counterfactual framework [8, 9], which allows scientists to decompose the total effect into direct and indirect effects [8–13]. Using the counterfactual framework can help to address the potential bias arising from both incorrect statistical analysis and suboptimal study design [14–16].
Open Access
BMC Research Notes
*Correspondence: [email protected] 1 Clinical and Population Health Research Program, Graduate School of Biomedical Sciences, University of Massachusetts Medical School, 368 Plantation Street, Worcester, MA 01655, USAFull list of author information is available at the end of the article

Page 2 of 21Liu et al. BMC Res Notes (2016) 9:354
The field of causal mediation is relatively new and techniques emerge rapidly. With the rapid development of software packages [11–13, 17], the implementation and/or discussion of this methodology is increasing. In a preliminary search in PubMed, we identified 33 arti-cles in 2013, 59 in 2014, and 61 in 2015. While these software packages allow for estimation in a number of settings, limitations on automated procedures for con-ducting sensitivity analyses on unmeasured confounding or measurement errors remain. However, causal media-tion analysis requires careful implementation of the approach and appropriate evaluations for assumptions to derive valid estimates and the extent to which these studies apply and report the elements of causal mediation analysis remains unknown. Therefore, understanding how these methods have been applied to address issues of bias, how studies have implemented the approach, and how estimates are interpreted may provide useful guid-ance for future reporting.
The purpose of this review was to systematically review epidemiological studies in which causal mediation analy-sis was used to estimate direct and indirect effects. In this review, we will extract information on the elements critical to be reported and summarize our findings on how epide-miological studies have conducted and presented results from causal mediation analysis. We will also give recom-mendations for scientists considering to conduct studies applying causal mediation in the medical literature.
MethodsSelection of articlesOur aim was to identify original empirical epidemiologi-cal research published in 2015 that used causal media-tion analysis. Two search strategies were used to achieve this goal. First, we retrieved all published studies citing one of the seminal papers [8, 10, 12, 13] on causal media-tion analysis using the Web of Science database. One hundred and fifty-seven articles were identified with this approach. Second, we conducted a keyword search within PubMed through working with a research librar-ian at the University of Massachusetts Medical School. We developed the following keyword search algorithm: causal mediation analysis OR (“causal” AND “mediation analysis” AND “Mediat*”). This search term returned 61 unique records in PubMed dating from January 1, 2015 to December 31, 2015. We excluded the following types of publications or studies: (i) methodological or simula-tion studies without an empirical application; (ii) stud-ies without examining the effects on health outcomes, that is, studies not including mortality, morbidity, and diagnostic markers, for both mental and physical health; (iii) animal studies or genetic studies; (iv) letters, meet-ing abstracts, review articles, and editorials; (v) studies
without formal discussion of causal framework or using traditional approach, cross-sectional design, and studies using multilevel models or structural equation models approach.
We used the guidelines from the Preferred Reporting Items for Systematic Reviews and Meta-Analyses [18]. After excluding duplicate records, titles and abstracts of the remaining articles were assigned to two review-ers who independently evaluated each study to assess eligibility. Articles with titles and abstracts were then evaluated by two reviewers through full-text review. Any discrepancy in eligibility was discussed and resolved between reviewers. One reviewer (S-H L) performed data extraction, and two reviewers including a senior epi-demiologist (SC and KLL) confirmed the extracted infor-mation for all eligible studies.
Information abstractionWe considered several elements believed to be impor-tant for transparent and complete reporting of causal mediation analyses. These included: (1) motivation for applying causal mediation analysis, (2) evaluation of identifiability assumptions of effects identified, (3) use of sensitivity analyses for unmeasured confounding and/or measurement error of mediators, and (4) elements of implementing causal mediations analysis includ-ing power calculations, inclusion of exposure-mediator interactions, and bias analysis for interactions. A brief description and rationale for each element chosen is pro-vided in the following sections.
Rationale for causal mediation analysisExplanations of cause-effect associations may be enhanced through additional analyses of mediation and interaction. Mediation and interaction phenomena are not mutually exclusive [1]. Several theoretical and practi-cal considerations can also be the motivations to conduct empirical studies for these phenomena of causal effects. Empirically studying mediation can help to: (1) improve understanding; (2) confirm/refute theory; and (3) refine interventions [1]. In this review, we extracted informa-tion about whether studies reported (i) the reason for applying causal mediation analysis; (ii) the effect esti-mates calculated; and (iii) the motivation of the applica-tion presented.
Identification of effects and identifiability assumptionsIn a counterfactual framework, three measures are esti-mated: (1) natural direct effect; (2) natural indirect effect; and (3) controlled direct effect [8, 9]. The natural direct effect expresses how much the outcome (Y) would change if the exposure (A) was set to A = 1 compared to A = 0 (if binary) intervening to set the mediator (M)
Page 3 of 21Liu et al. BMC Res Notes (2016) 9:354
to what it would have been if exposure had been A = 0 (defined by Y1M0
− Y0M0). The natural indirect effect
comparing fixing the mediator to M1 versus M0 if the exposure is set to level A = 1 (defined by Y1M1
− Y1M0 ).
The controlled direct effect expresses how much the outcome would change on average if the exposure were changed from A = 0 to A = 1 but the mediator were set to a fixed level in the population (defined by Y1M–Y0M).
For the mediation analysis to have a causal interpre-tation, we assume that adjustment for the four types of confounding has been addressed. The four types of con-founding are: (1) confounding of the exposure-outcome relationship; (2) confounding of the mediator-outcome relationship; (3) confounding of the exposure-mediator association; and (4) mediator-outcome confounders also affected by the exposure [19]. For controlled direct effect, assumptions (1) and (2) are required. For the identifica-tion of natural direct and indirect effects, assumptions (3) and (4) are also needed [13]. However, for studies with randomized treatments, assumptions (1) and (3) are satisfied and control only needed to be made for (2) and (4). We extracted information about what identifiability assumptions were acknowledged in relation to identified effects of estimates.
Sensitivity analysisIn addition to unmeasured confounding common in observational studies [8, 9, 20], measurement error of the mediator could potentially affect the regression coef-ficient from both the mediator and the outcome regres-sions and thus result in biased estimates for direct and indirect effects [21–23]. Furthermore, interaction anal-ysis could also be a part of research interests to under-stand how and why the effect occurs in an observed phenomena. If control has not been made for two sets of confounding factors for each of the exposures, the results from interaction analysis will be biased [1]. In causal mediation analysis, sensitivity analysis can be used as a technique to evaluate the extent to which the direct and indirect effects are robust to assumption violations [24, 25]. We abstracted information on bias analysis to assess: (i) whether sensitivity analysis was conducted or empirically analyzed for identification assumptions; (ii) which identification assumption was a concern and what approach was used for sensitivity analysis; (iii) whether the rationale and approach to conduct sensitivity analysis for measurement errors of the mediators was included; and (iv) whether bias analysis for the interaction was included.
Power calculationsStudies may be powered to detect a main effect, but may not be sufficiently powered to detect an interaction of a
certain magnitude. We hypothesized that many studies implementing causal mediation analyses may be under-powered. We extracted information about power calcu-lations for interaction from each study. However, further development and methodologic work regarding power calculations for direct and indirect effects is needed [1]. With this in mind, we extracted information regarding what authors reported on the issue of power calculations for causal mediation analysis without judgment regarding which formulas were appropriate.
Exposure‑mediator interactionsIn the traditional approach for mediation analysis, no interaction between the effects of the exposure and the mediator on the outcome is assumed [8, 9]. Causal medi-ation analysis, on the other hand, provides the decom-position of the direct and indirect effects that are valid even in the presence of interaction between the exposure and the mediator on the outcome and when non-linear models are needed [8, 9]. This gives rise to the question of when to include or exclude interactions in conducting causal mediation analysis. The decision to include inter-action terms is often driven by statistical findings which may be problematic if statistical power is lacking. As such, a recommended approach is to include exposure-mediator interactions in the outcome model by default and only exclude the interaction terms if the magnitude of interactions is small and the estimates of direct and indirect effects are not altered much in the presence of the interaction terms [1]. Leaving the interaction terms in the outcome model is suggested to avoid drawing incorrect causal conclusions, to help allow for additional model flexibility, and to understand the dynamics of mediation [1]. Therefore, we extracted information about whether or not studies allowed for interactions in the outcome model.
Effects of estimates and results from exposure‑mediator interactionIn this review, we assessed whether studies reported both estimates from allowing for exposure-mediator interac-tions in the outcome model in addition to the effect of estimates without interaction in the model. Moreover, we also extracted estimates from sensitivity analysis con-ducted for direct/indirect effects and interactions. We also extracted information about explanations of discrep-ancies when noted.
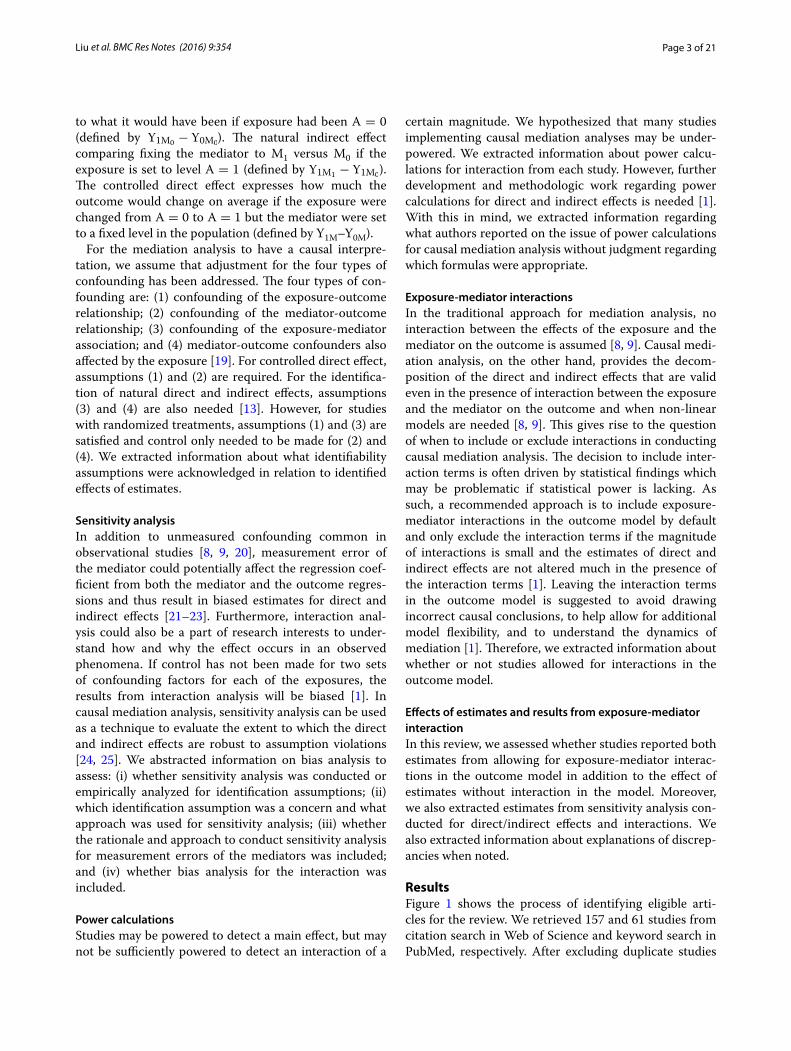
ResultsFigure 1 shows the process of identifying eligible arti-cles for the review. We retrieved 157 and 61 studies from citation search in Web of Science and keyword search in PubMed, respectively. After excluding duplicate studies
Page 4 of 21Liu et al. BMC Res Notes (2016) 9:354
(n = 22), studies not focusing on the effects of health-related outcomes (n = 57), review articles (n = 6), methodological or simulation studies (n = 46), letters, meeting abstracts and brief reports (n = 10), animals studies (n = 2), studies not using causal mediation analy-sis (n = 9), genetic studies (n = 9) or studies using mul-tilevel models, structural equation models approach, and cross-sectional design (n = 27), and studies using tradi-tional approach or without formal discussion of formal causal framework (n = 17), we had 13 epidemiological studies that applied causal mediation analysis [26–38].
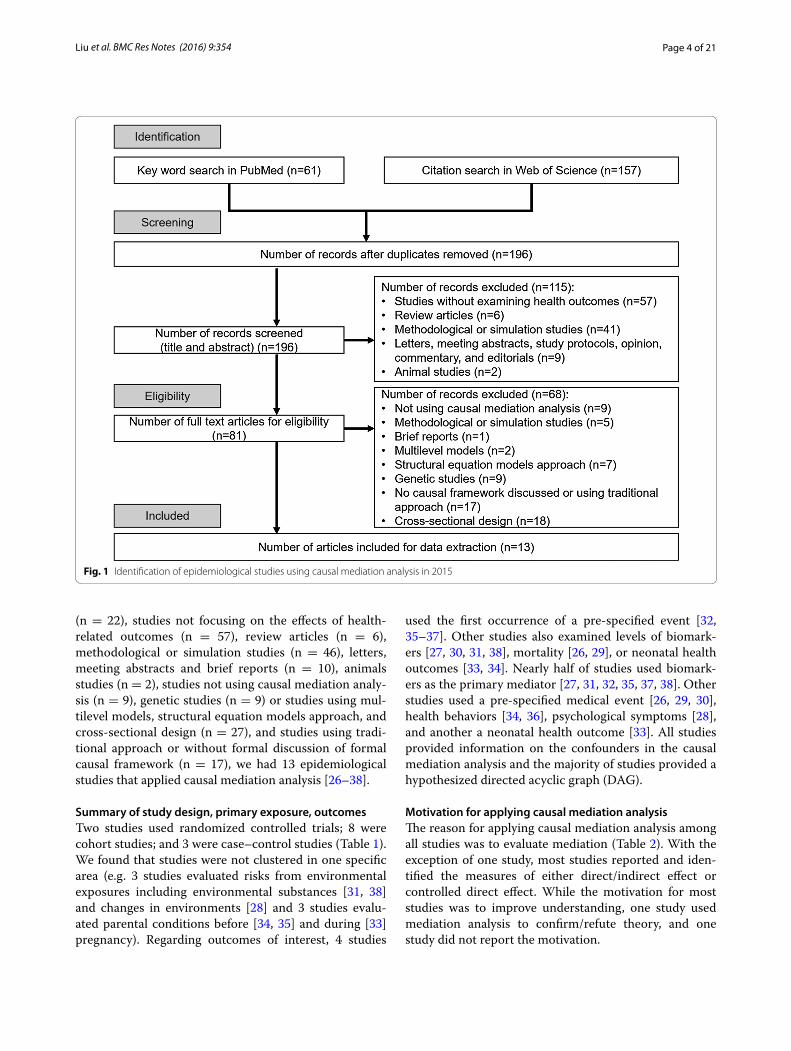
Summary of study design, primary exposure, outcomesTwo studies used randomized controlled trials; 8 were cohort studies; and 3 were case–control studies (Table 1). We found that studies were not clustered in one specific area (e.g. 3 studies evaluated risks from environmental exposures including environmental substances [31, 38] and changes in environments [28] and 3 studies evalu-ated parental conditions before [34, 35] and during [33] pregnancy). Regarding outcomes of interest, 4 studies
used the first occurrence of a pre-specified event [32, 35–37]. Other studies also examined levels of biomark-ers [27, 30, 31, 38], mortality [26, 29], or neonatal health outcomes [33, 34]. Nearly half of studies used biomark-ers as the primary mediator [27, 31, 32, 35, 37, 38]. Other studies used a pre-specified medical event [26, 29, 30], health behaviors [34, 36], psychological symptoms [28], and another a neonatal health outcome [33]. All studies provided information on the confounders in the causal mediation analysis and the majority of studies provided a hypothesized directed acyclic graph (DAG).
Motivation for applying causal mediation analysisThe reason for applying causal mediation analysis among all studies was to evaluate mediation (Table 2). With the exception of one study, most studies reported and iden-tified the measures of either direct/indirect effect or controlled direct effect. While the motivation for most studies was to improve understanding, one study used mediation analysis to confirm/refute theory, and one study did not report the motivation.
Fig. 1 Identification of epidemiological studies using causal mediation analysis in 2015

Page 5 of 21Liu et al. BMC Res Notes (2016) 9:354
Tabl
e 1
Gen
eral
des
crip
tion
of e
pide
mio
logi
cal s
tudi
es th
at w
ere
elig
ible
for t
he s
yste
mat
ic re
view
Refe
renc
esCo
untr
y, p
opul
a‑tio
n, a
nd s
ampl
e si
ze
of s
tudy
a
Dire
cted
acy
clic
gr
aph
(DA
G)
incl
uded
?
Spec
ific
med
iatio
n hy
poth
esis
spe
cifie
d?Ex
posu
rePr
imar
y ou
tcom
eM
edia
tor
Conf
ound
ersb
Rand
omiz
ed c
ontr
olle
d tr
ials
D’A
mel
io e
t al.
[27]
Italy
Non
‑dia
betic
wom
en
with
pos
tmen
opau
sal
oste
opor
osis
(n =
46)
No
Biol
ogic
mec
hani
sms
disc
usse
dA
ll tr
eate
d w
ith c
al‑
cium
120
0 m
g/da
y an
d ch
olec
alci
fero
l 80
0 U
I/day
Rand
omiz
ed to
with
PT
H 1
–84
100
μg/
day
subc
utan
eous
Or
With
out P
TH 1
–84
100
μg/d
ay s
ubcu
ta‑
neou
s (b
inar
y)
Glu
cose
met
abol
ism
, (c
ontin
uous
, log
sc
ale)
Tota
l ost
eoca
lcin
(OC
) un
derc
arbo
xyla
ted
(uO
C)
(con
tinuo
us)
Biom
arke
rs th
at w
ere
unba
lanc
ed b
etw
een
the
two
trea
tmen
t gr
oups
at b
asel
ine
incl
udin
g uO
C a
nd
seru
m ta
rtra
te re
sist
‑an
t aci
d ph
osph
atas
e 5B
(TRA
P5b)
Fre
eman
et a
l. [2
8]En
glan
dPa
tient
s w
ith p
erse
cu‑
tory
del
usio
ns fr
om
6 m
enta
l hea
lth s
ites
(n =
59)
No
Gui
ded
by c
ogni
tive
mod
el o
f per
secu
‑to
ry d
elus
ions
Rand
omiz
ed to
str
eet
expo
sure
in a
reas
of
rela
tive
depr
ivat
ion
durin
g bu
sy m
id‑d
ayO
rA
neu
tral
con
trol
co
nditi
on w
hich
in
clud
ed s
ittin
g in
a
room
wat
chin
g m
ildly
hum
orou
s te
levi
sion
clip
s fo
r 10
min
(bin
ary)
(1) S
tate
Par
anoi
a us
ing
six
visu
al a
nalo
g sc
ales
(VA
S)(2
) Sta
te s
ocia
l par
a‑no
ia s
cale
(3) S
chiz
otyp
al S
ymp‑
tom
s In
vent
ory—
Para
noia
(con
tinu‑
ous)
Voic
esH
allu
cina
tions
VA
SD
istr
ess V
AS
Affec
tive
Anx
iety
VA
SD
epre
ssio
n VA
SBr
ief c
ore
sche
ma
scal
es (B
CSS
)Se
lf‑fo
cus
Thre
at a
ntic
ipat
ion
Inte
rpre
tatio
n bi
as
(con
tinuo
us)
Reas
onin
g m
easu
res
Jum
ping
to c
oncl
u‑si
ons
Poss
ibili
ty o
f bei
ng
mis
take
nA
ltern
ativ
e ex
plan
a‑tio
nsH
ypot
hetic
al c
ontr
adic
‑tio
n (b
inar
y)Pr
obab
ility
of b
eing
m
ista
ken
(con
tinu‑
ous)
Base
line
mea
sure
s of
pa
rano
ia, a
ll of
the
med
iato
rs c
onsi
dere
d,
and
cent
er

Page 6 of 21Liu et al. BMC Res Notes (2016) 9:354
Tabl
e 1
cont
inue
d
Refe
renc
esCo
untr
y, p
opul
a‑tio
n, a
nd s
ampl
e si
ze
of s
tudy
a
Dire
cted
acy
clic
gr
aph
(DA
G)
incl
uded
?
Spec
ific
med
iatio
n hy
poth
esis
spe
cifie
d?Ex
posu
rePr
imar
y ou
tcom
eM
edia
tor
Conf
ound
ersb
Coho
rt s
tudi
es
Ban
ack
et a
l. [2
6]U
nite
d St
ates
Nat
iona
lly re
pres
enta
‑tiv
e no
nins
titut
iona
l‑iz
edSa
mpl
e of
adu
lts a
ged
20 to
80
year
s in
the
U.S
. (19
88–2
004)
(n
= 7
212)
Yes
Gui
ded
by p
revi
ous
rese
arch
Obe
sity
defi
ned
as
body
mas
s in
dex
≥30
kg/
m2 v
s.
18.5
–29.
9 kg
/m2
(bin
ary)
All‑
caus
e m
orta
l‑ity
with
follo
w‑u
p th
roug
h 20
06
(bin
ary)
Self‑
repo
rted
acu
te
card
iac
even
t (e.
g.
stro
ke o
r myo
card
ial
infa
rctio
n) (b
inar
y)
Age
, gen
der,
race
, edu
‑ca
tion,
sm
okin
g st
atus
, an
d ca
rdio
resp
irato
ry
fitne
ss
Jack
son
et a
l. [2
9]N
ew J
erse
y an
d Pe
nnsy
lvan
ia, U
nite
d St
ates
Old
er a
dults
dua
lly
enro
lled
in m
edic
are
and
phar
mac
y as
sis‑
tanc
e pr
ogra
ms;
“new
us
ers”
(n =
26,
197)
No
Med
iato
rs s
elec
ted
base
d on
pre
viou
s lit
erat
ure
New
use
r of fi
rst g
en‑
erat
ion
antip
sych
otic
ve
rsus
new
use
r of
sec
ond
gen‑
erat
ion
antip
sych
otic
(b
inar
y)
Mor
talit
y w
ith 1
80 d
ays
(bin
ary)
Med
ical
eve
nts
stro
ke,
vent
ricul
ar a
rrhy
th‑
mia
, acu
te m
yoca
rdia
l in
farc
tion,
ven
ous
thro
mbo
embo
lism
, pn
eum
onia
, bac
teria
l in
fect
ion
(bes
ides
pn
eum
onia
), an
d hi
p fra
ctur
e) (b
inar
y)
70 d
iffer
ent d
emo‑
grap
hic
char
acte
ristic
s, he
alth
ser
vice
util
iza‑
tion
and
med
icat
ion
usag
e, c
o‑ex
istin
g m
edic
al a
nd p
sych
iat‑
ric il
lnes
s, an
d in
dica
‑to
rs o
f fun
ctio
nal
impa
irmen
t
Kos
itsaw
at e
t al.
[30]
Mem
phis
, Ten
nes‑
see
and
Pitt
sbur
gh,
Penn
sylv
ania
, Uni
ted
Stat
esBl
ack
and
whi
te
med
icar
e el
igi‑
ble—
com
mun
ity
dwel
ling
adul
ts a
ged
70–7
9 ye
ars
with
out
diab
etes
at y
ear 2
of
the
stud
y (n
= 2
193)
No
Ratio
nale
not
cle
arSe
rum
vita
min
D le
vels
(2
5‑hy
drox
yvita
‑m
in D
) <20
ng/
mL
(bin
ary)
A1c
leve
l ≥6.
5 %
at
year
4 (b
inar
y)D
iabe
tes
stat
us a
t yea
r 4
(bin
ary)
Conf
ound
ers
cons
ider
ed
in m
edia
tion
anal
ysis
no
t rep
orte
d
Lou
wie
s et
al.
[31]
Belg
ium
Wor
king
nur
ses
aged
be
twee
n 22
and
59
yea
rs w
ithou
t car
‑di
ovas
cula
r dis
ease
s an
d di
abet
es (n
= 5
5)
No
Gui
ded
by p
revi
ous
liter
atur
eSu
bchr
onic
bla
ck
carb
on e
xpos
ure
(con
tinuo
us)
Dia
stol
ic b
lood
pre
s‑su
reSy
stol
ic b
lood
pre
ssur
e(c
ontin
uous
)
Retin
al m
icro
circ
ulat
ion
(con
tinuo
us)
Age
, sex
, bod
y m
ass
inde
x, s
mok
ing,
use
of
ant
i‑hyp
erte
nsiv
e m
edic
atio
n, γ
‑GT,
A1c
, di
stan
ce to
maj
or
road
, clin
ic, a
nd a
ver‑
age
wee
kly
tem
pera
‑tu
re

Page 7 of 21Liu et al. BMC Res Notes (2016) 9:354
Tabl
e 1
cont
inue
d
Refe
renc
esCo
untr
y, p
opul
a‑tio
n, a
nd s
ampl
e si
ze
of s
tudy
a
Dire
cted
acy
clic
gr
aph
(DA
G)
incl
uded
?
Spec
ific
med
iatio
n hy
poth
esis
spe
cifie
d?Ex
posu
rePr
imar
y ou
tcom
eM
edia
tor
Conf
ound
ersb
Lu
et a
l. [3
2]U
nite
d St
ates
Adu
lts fr
ee o
f cor
onar
y he
art d
isea
se w
ho
part
icip
ated
in 9
N
atio
nal H
eart
, Lun
g,
and
Bloo
d In
stitu
te
fund
ed c
ohor
t stu
d‑ie
s w
ith b
ody
mas
s in
dex ≥
20
kg/m
2 (1
954–
2001
)(n
= 5
8,32
2 fo
r m
etab
olic
risk
fac‑
tors
; n =
19,
572
for
fibrin
ogen
ana
lysi
s)
Yes
Biol
ogic
mec
hani
sms
disc
usse
dBo
dy m
ass
inde
x (c
ateg
orie
s ≥30
kg/
m2 , 2
5–<
30 k
g/m
2 , 20
–25
kg/m
2 )(c
ateg
oric
al a
nd
cont
inuo
us)
Firs
t fat
al o
r non
‑fa
tal o
ccur
renc
e of
isch
emic
hea
rt
dise
ase,
acu
te m
yo‑
card
ial i
nfar
ctio
n,
or a
ngin
a pe
ctor
is
(bin
ary)
Expl
ored
in d
ata
com
bine
d fro
m n
ine
coho
rt st
udie
sSy
stol
ic b
lood
pre
ssur
e,
tota
l ser
um c
hole
s‑te
rol,
gluc
ose
Expl
ored
in d
ata
com
bine
d fro
m th
ree
coho
rt st
udie
sFi
brin
ogen
, hig
h‑se
nsiti
ve C
‑rea
ctiv
e pr
otei
n (c
ontin
uous
)
Age
, sex
, sm
okin
g, ra
ce/
ethn
icity
, soc
ioec
o‑no
mic
sta
tus,
alco
hol
inta
ke, p
hysi
cal a
ctiv
‑ity
, and
die
tary
inta
ke
Men
dola
et a
l. [3
3]U
nite
d St
ates
Sing
leto
n ne
wbo
rns
with
≥23
wee
ks
of g
esta
tion
(n =
210
,610
)
Yes
Biol
ogic
mec
hani
sms
disc
usse
dPr
eecl
amps
ia (b
inar
y)Te
n ne
onat
al o
ut‑
com
es (b
inar
y)Pr
eter
m b
irth
(bin
ary)
Stud
y si
te, m
ater
nal
age,
mat
erna
l rac
e/et
hnic
ity, i
nsur
ance
st
atus
, mar
ital s
tatu
s, pa
rity,
pre
‑pre
gnan
cy
body
mas
s in
dex,
and
ch
roni
c di
seas
es d
ur‑
ing
preg
nanc
y
Mes
serli
an e
t al.
[34]
Mon
trea
l, Ca
nada
Wom
en a
ging
20
–45
year
s w
ithou
t pr
eexi
stin
g m
edic
al
cond
ition
s po
tent
ially
as
soci
ated
with
bo
th in
fert
ility
and
pr
eter
m b
irth
and
prim
ary
anal
ysis
w
as re
stric
ted
to
sing
leto
n pr
egna
n‑ci
es (n
= 1
8,14
7)
Yes
Not
ed th
at th
e bi
o‑lo
gic
mec
hani
sms
are
uncl
ear
Reas
on fo
r inf
ertil
ity
(ovu
lato
ry, e
ndo‑
tuba
l, m
ale
fact
or,
uter
ine
abno
rmal
i‑tie
s, un
expl
aine
d,
unsp
ecifi
ed) (
cat‑
egor
ical
)
Pret
erm
birt
h ca
tego
‑riz
ed a
s <
32, <
35,
<37
, ≥37
wee
ks)
(ord
inal
)
Any
type
of I
nfer
tility
tr
eatm
ent
(bin
ary)
Mat
erna
l age
, par
ity,
educ
atio
n, s
mok
‑in
g, a
nd a
lcoh
ol o
r su
bsta
nce
use
durin
g pr
egna
ncy,
and
bod
y m
ass
inde
x
Rag
hava
n et
al.
[35]
Fram
ingh
am, M
as‑
sach
uset
ts, U
nite
d St
ates
Part
icip
ants
with
out
type
2 d
iabe
tes
who
ha
d w
hole
‑gen
ome,
co
mm
on v
aria
nt
geno
typi
ng a
nd w
ere
follo
wed
for a
med
ian
of 1
3 ye
ars
at e
xam
5
(n =
236
1)
Yes
Info
rmed
by
the
liter
atur
ePa
rent
al h
isto
ry o
f di
abet
es—
none
, on
e or
two
pare
nts
(ord
inal
)
Inci
dent
type
2
diab
etes
in o
ffspr
ing
(bin
ary)
Met
abol
icco
rrec
ted
insu
lin
resp
onse
, HO
MA
‑IR,
met
abol
ic s
yndr
ome,
co
mpo
nent
s sc
ore
Gen
etic
gene
tic ri
sk s
core
Li
fest
yle
diab
etog
enic
, die
t sc
ore,
phy
sica
l act
iv‑
ity in
dex
(con
tinuo
us)
Age
, sex
and
gen
etic
risk
sc
ore
(for m
odel
s no
t fo
cuse
d on
gen
etic
m
edia
tors
)
Page 8 of 21Liu et al. BMC Res Notes (2016) 9:354
Tabl
e 1
cont
inue
d
Refe
renc
esCo
untr
y, p
opul
a‑tio
n, a
nd s
ampl
e si
ze
of s
tudy
a
Dire
cted
acy
clic
gr
aph
(DA
G)
incl
uded
?
Spec
ific
med
iatio
n hy
poth
esis
spe
cifie
d?Ex
posu
rePr
imar
y ou
tcom
eM
edia
tor
Conf
ound
ersb
Case
con
trol
stu
dies
Rao
et a
l. [3
6]Ka
rnat
aka,
Indi
aSo
urce
pop
ulat
ion
from
whi
ch c
ases
and
co
ntro
ls w
ere
draw
n in
clud
ed a
dults
who
w
ere
eith
er p
atie
nts
or v
isito
rs a
t 4 m
ajor
ca
ncer
hos
pita
ls
(n =
452
)
Yes
Yes,
criti
cal p
erio
d m
odel
gui
ded
the
DA
G c
onst
ruct
ion
Early
life
soc
ioec
o‑no
mic
dis
adva
ntag
e (lo
w/h
igh)
Case
sD
iagn
osed
with
ora
l an
d/or
oro
phar
yn‑
geal
can
cer (
ICD
‑10
code
s C
00‑C
10).
Cont
rols
Visi
tors
or t
hose
see
k‑in
g m
edic
al c
are
for
med
ical
con
di‑
tions
not
rela
ted
to
toba
cco
or a
lcoh
ol
(bin
ary)
Smok
ing,
che
win
g qu
id a
nd/o
r tob
acco
, al
coho
l (bi
nary
)
Age
, sex
, adu
lt so
cio‑
econ
omic
mea
sure
s an
d pa
tern
al a
lcoh
ol
drin
king
Son
g et
al.
[37]
Uni
ted
Stat
esSo
urce
pop
ulat
ion
from
whi
ch c
ases
and
co
ntro
ls w
ere
draw
n in
clud
ed p
ostm
eno‑
paus
al w
omen
at
40 c
linic
al c
ente
rs
(n =
304
9)
Yes
Med
iato
rs s
elec
ted
base
d on
pre
viou
s lit
erat
ure
Low
birt
h w
eigh
t (o
rdin
al)
Case
sSe
lf‑re
port
ed fi
rst‑
time
use
of m
edic
atio
n fo
r di
abet
es d
urin
g th
e fo
llow
‑up
perio
dsCo
ntro
lsFo
r eac
h in
cide
nt
case
, con
trol
s w
ere
sele
cted
at r
ando
m
from
wom
en w
ho
rem
aine
d fre
e fro
m
card
iova
scul
ar d
is‑
ease
s an
d/or
dia
be‑
tes
at th
e di
agno
sed
time
in th
e ca
se
patie
nt (b
inar
y)
Biom
arke
rs o
f ins
ulin
re
sist
ance
, lep
tin a
nd
its re
cept
or, s
ex s
ter‑
oid
horm
ones
and
th
eir b
indi
ng p
rote
in,
infla
mm
atio
n,
endo
thel
ial f
unct
ion,
ce
llula
r age
ing
and
bloo
d pr
essu
re(c
ontin
uous
)
Two
sets
of c
onfo
unde
rs
wer
e co
nsid
ered
:(1
) Bef
ore
birt
h: ra
ce/
ethn
icity
and
fam
ily
hist
ory
of d
iabe
tes
(2) A
fter
birt
h: a
ge,
smok
ing,
alc
ohol
co
nsum
ptio
n, p
hysi
cal
exer
cise
, die
tary
fibe
r in
take
, die
tary
gly
cae‑
mic
load
, and
BM
I
Xie
et a
l. [3
8]Sh
angh
ai, C
hina
Pre‑
pube
rtal
and
ear
ly
pre‑
pube
rtal
boy
s ag
ed 8
‑15
year
s ol
d (n
= 1
67)
No
Yes,
biol
ogic
mec
ha‑
nism
s di
scus
sed
Tota
l pht
hala
tes
(c
ontin
uous
)Ca
ses D
iagn
osis
if c
on‑
stitu
tiona
l del
ay o
f gr
owth
and
pub
erty
de
fined
by
bone
ag
e <
1.75
yea
rs th
an
chro
nolo
gica
l age
Cont
rols
age
and
Tann
er s
tage
(1
or 2
) mat
ched
(b
inar
y)
Seru
m te
stos
tero
ne
leve
l (co
ntin
uous
)A
ge a
nd b
ody
mas
s in
dex
γ-G
T ga
mm
a gl
utam
yl tr
ansf
eras
e; H
OM
A-IR
hom
eost
atic
mod
el a
sses
smen
t for
insu
lin re
sist
ance
; ICD
inte
rnat
iona
l cla
ssifi
catio
n of
dis
ease
s; P
TH p
arat
hyro
id h
orm
one
a Ove
rall
sam
ple
size
of t
he s
tudy
b Con
foun
ders
incl
uded
in th
e ca
usal
med
iatio
n an
alys
isc T
he re
sults
of m
edia
tion
anal
ysis
wer
e gr
aphi
cally
pre
sent
ed

Page 9 of 21Liu et al. BMC Res Notes (2016) 9:354
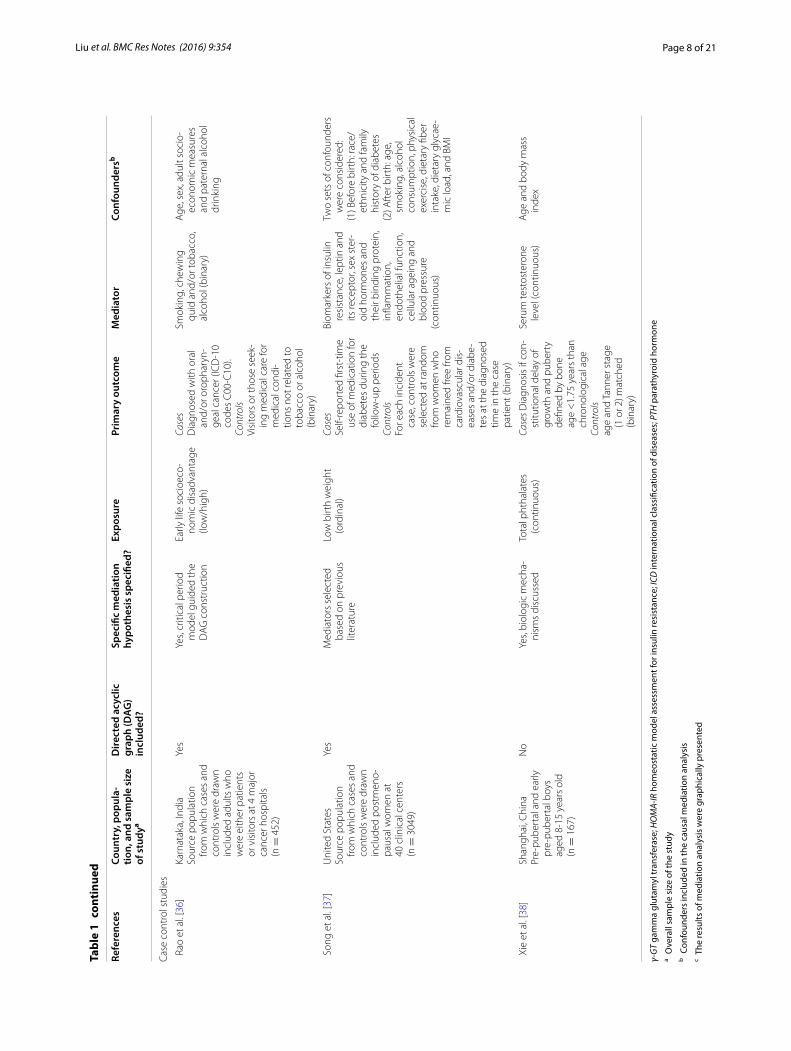
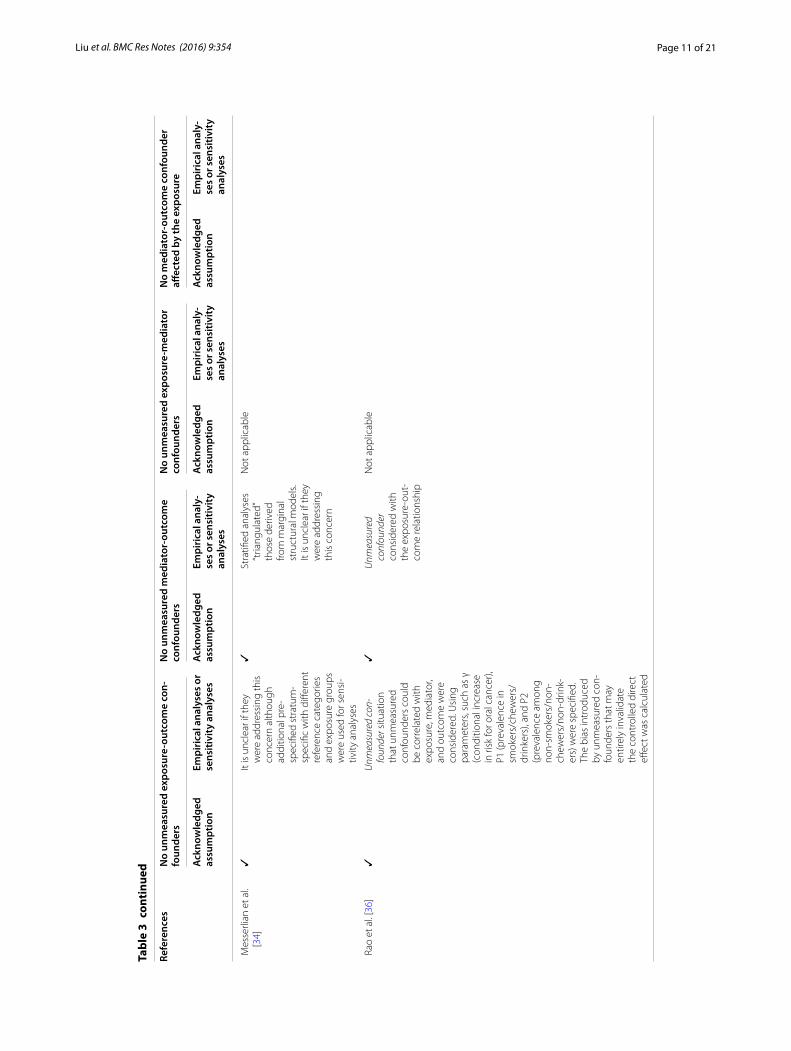
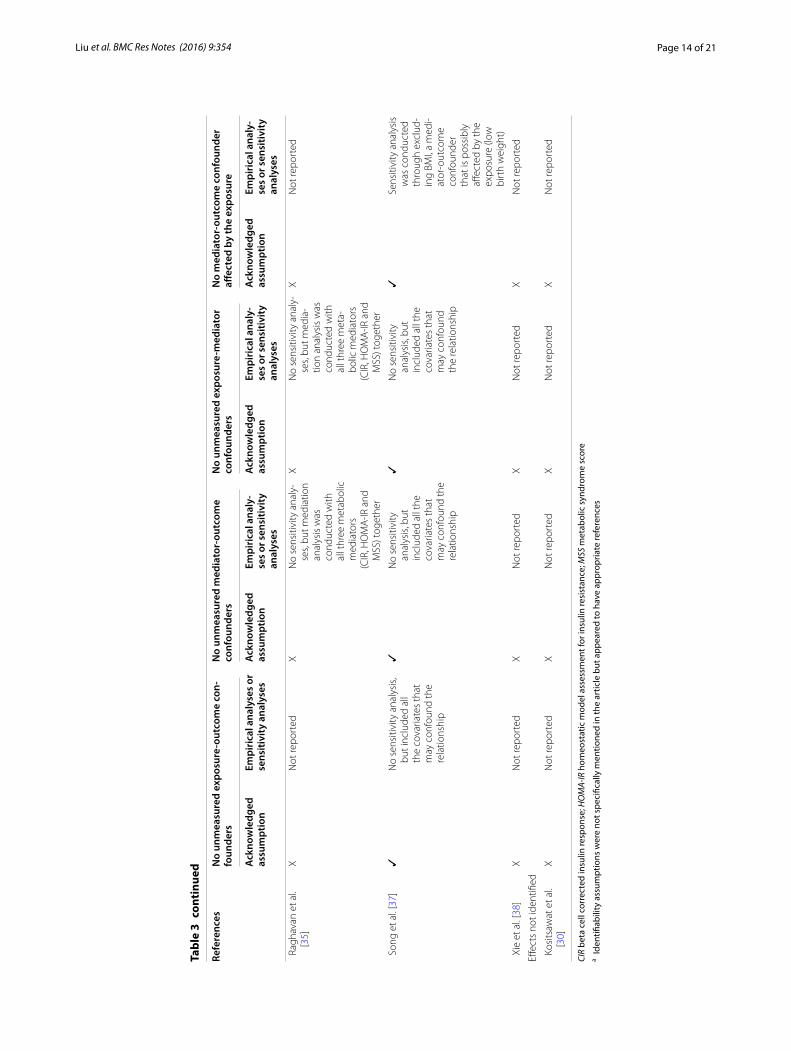
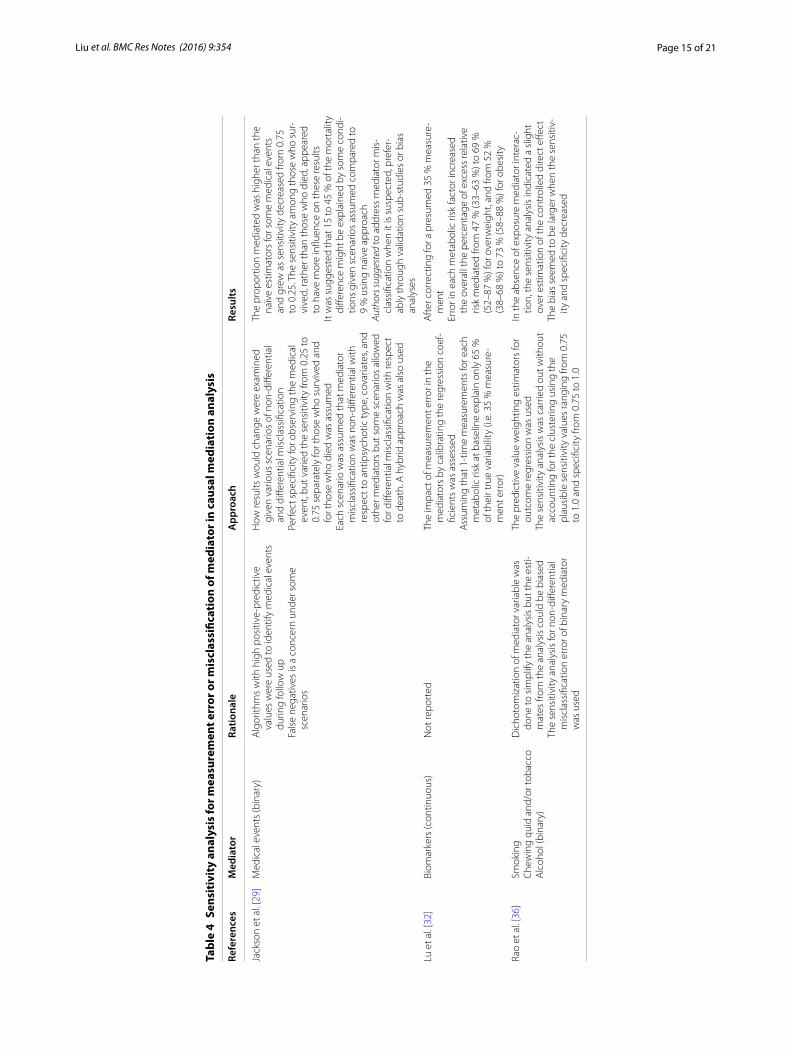
Evaluation of identifiability assumptions and sensitivity analysesFour studies did not report identification assumptions for measures of effects identified (Table 3). With the excep-tion of two studies, the empirical approach or sensitivity analysis was used to address the issue of confounding. There were 9 studies addressing unmeasured confound-ing for the mediator-outcome relationship. Five studies provided the empirical approach and four studies used sensitivity analysis to address the concern. For measure-ment error or misclassification of mediators, 3 studies addressing this issue (Table 4). Two studies provided the rationale for doing sensitivity analysis for measurement error of mediators. Furthermore, they also noted that the
bias may result from misclassification of the mediator and robustness of findings was also discussed.
Elements for implementation of causal mediation analysisMost studies had a relatively large sample size (Table 5). Three studies had small size (n < 100) and this limitation was acknowledged. The majority of studies did not report whether the power or sample size calculation was calcu-lated. For exposure-mediator interaction, most studies did not report or did not have the exposure-mediator interaction in the model. Among those six studies allow-ing for exposure-mediator interaction in the model, none reported power or sample size calculation and bias analy-sis for the interaction.
Table 2 Rationale and measures of effect estimated and reported for Causal Mediation Analysis
a Reason for applying causal mediation analysis: Mediation, Interaction, or Interferenceb Motivation for each application of causal mediation analysis. For mediation (1) improve understanding; (2) confirm/refute theory; (3) intervention refinement. For interaction (1) help allocate resources better; (2) identifying groups in which treatments may be harmful or beneficial (qualitative or cross-over interactions); (3) understand mechanisms; (4) increase statistical power of main effect analysis, and (5) understand which mediator to intervene upon to eliminate most of the effect of primary exposure. For interference (1) quantify spillover effects for cost-effectiveness studies; (2) understand what proportion must be treated to attain population outcomes desired; (3) create knowledge for intervention development and refinementc “Natural” was not specifically used in the article but appeared to have counterfactual framework and appropriate references
References Reasona Measures discussed or reported Motivation for applicationb
Randomized controlled trials
D’Amelio et al. [27] Mediation Natural direct and natural indirect effectsEmphasized direct effect
Improve understanding to show that above and beyond how the treatment works through the mediator, there is an independent effect
Freeman et al. [28] Mediation Direct and indirect effectsc
Proportion mediated by various factorsImprove understanding of mechanisms
Cohort studies
Banack et al. [26] Mediation Similar to controlled direct effect (with caveat that no manipulation of obesity could actually occur)
Refute/confirm that selection bias drives the obesity para‑dox in cardiovascular disease
Jackson et al. [29] Mediation Natural direct and indirect effectsProportion mediated by each medical event
Improve understanding of mechanisms
Kositsawat et al. [30]
Mediation Not identified Not clear
Louwies et al. [31] Mediation Direct and indirect effectc Improve understanding of mechanisms
Lu et al. [32] Mediation Natural direct and natural indirect effectPercent excess risk mediatedNatural indirect effect emphasized
Improve understanding of mechanisms
Mendola et al. [33] Mediation Controlled direct effect Improve understanding
Messerlian et al. [34]
Mediation Controlled direct effect Improve understanding
Raghavan et al. [35] Mediation Direct and indirect effects but only indirect effects reportedc
Proportion of risk mediated through genetic and meta‑bolic factors
Improve understanding of what mediators might be ripe for intervention
Case control studies
Rao et al. [36] Mediation Controlled direct effect Improve understanding
Song et al. [37] Mediation Effect not mediatedmediated effectc
Proportion mediated through various biomarkers
Improve understanding of mechanisms
Xie et al. [38] Mediation Direct and indirect effectc
Proportion of effect mediated through testosteroneImprove understanding
Page 10 of 21Liu et al. BMC Res Notes (2016) 9:354
Tabl
e 3
Exam
inat
ion
of Id
enti
fiabi
lity
Ass
umpt
ions
for C
ausa
l Med
iati
on A
naly
sis
Refe
renc
esN
o un
mea
sure
d ex
posu
re‑o
utco
me
con‑
foun
ders
No
unm
easu
red
med
iato
r‑ou
tcom
e co
nfou
nder
sN
o un
mea
sure
d ex
posu
re‑m
edia
tor
conf
ound
ers
No
med
iato
r‑ou
tcom
e co
nfou
nder
aff
ecte
d by
the
expo
sure
Ack
now
ledg
ed
assu
mpt
ion
Empi
rica
l ana
lyse
s or
se
nsiti
vity
ana
lyse
sA
ckno
wle
dged
as
sum
ptio
nEm
piri
cal a
naly
‑se
s or
sen
sitiv
ity
anal
yses
Ack
now
ledg
ed
assu
mpt
ion
Empi
rica
l ana
ly‑
ses
or s
ensi
tivit
y an
alys
es
Ack
now
ledg
ed
assu
mpt
ion
Empi
rica
l ana
ly‑
ses
or s
ensi
tivit
y an
alys
es
Stud
ies
estim
atin
g co
ntro
lled
dire
ct e
ffect
s on
ly
Ban
ack
et a
l. [2
6]✓
Not
repo
rted
✓U
nmea
sure
d co
nfou
nder
ca
rdio
resp
irato
ry‑
fitne
ssEs
timat
es o
f the
di
rect
effe
ct o
f ca
rdio
resp
ira‑
tory
fitn
ess
on
mor
talit
y fro
m
wel
l‑est
ablis
hed
liter
atur
e. N
o lit
erat
ure
on e
sti‑
mat
es o
f pre
va‑
lenc
e di
ffere
nces
of
unm
easu
red
conf
ound
er—
so a
ra
nge
of 1
0–90
%
was
con
side
red
Not
app
licab
le
Men
dola
et a
l. [3
3]✓
Not
repo
rted
✓U
nmea
sure
d co
n-fo
unde
r mat
erna
l in
fect
ion
Estim
ates
of t
he
dire
ct e
ffect
of
mat
erna
l inf
ec‑
tion
on n
eona
tal
outc
ome
rang
ed
from
2 to
10.
Pre
v‑al
ence
diff
eren
ces
of u
nmea
sure
d co
nfou
nder
—so
a
rang
e of
1–9
9 %
w
as c
onsi
dere
d.
Whe
ther
this
was
do
ne b
ecau
se
no li
tera
ture
was
av
aila
ble
on w
hich
to
bas
e th
e se
nsi‑
tivity
ana
lyse
s w
as
not r
epor
ted
Not
app
licab
le
Page 11 of 21Liu et al. BMC Res Notes (2016) 9:354
Tabl
e 3
cont
inue
d
Refe
renc
esN
o un
mea
sure
d ex
posu
re‑o
utco
me
con‑
foun
ders
No
unm
easu
red
med
iato
r‑ou
tcom
e co
nfou
nder
sN
o un
mea
sure
d ex
posu
re‑m
edia
tor
conf
ound
ers
No
med
iato
r‑ou
tcom
e co
nfou
nder
aff
ecte
d by
the
expo
sure
Ack
now
ledg
ed
assu
mpt
ion
Empi
rica
l ana
lyse
s or
se
nsiti
vity
ana
lyse
sA
ckno
wle
dged
as
sum
ptio
nEm
piri
cal a
naly
‑se
s or
sen
sitiv
ity
anal
yses
Ack
now
ledg
ed
assu
mpt
ion
Empi
rica
l ana
ly‑
ses
or s
ensi
tivit
y an
alys
es
Ack
now
ledg
ed
assu
mpt
ion
Empi
rica
l ana
ly‑
ses
or s
ensi
tivit
y an
alys
es
Mes
serli
an e
t al.
[34]
✓It
is u
ncle
ar if
they
w
ere
addr
essi
ng th
is
conc
ern
alth
ough
ad
ditio
nal p
re‑
spec
ified
str
atum
‑ sp
ecifi
c w
ith d
iffer
ent
refe
renc
e ca
tego
ries
and
expo
sure
gro
ups
wer
e us
ed fo
r sen
si‑
tivity
ana
lyse
s
✓St
ratifi
ed a
naly
ses
“tria
ngul
ated
” th
ose
deriv
ed
from
mar
gina
l st
ruct
ural
mod
els.
It is
unc
lear
if th
ey
wer
e ad
dres
sing
th
is c
once
rn
Not
app
licab
le
Rao
et a
l. [3
6]✓
Unm
easu
red
con-
foun
der s
ituat
ion
that
unm
easu
red
conf
ound
ers
coul
d be
cor
rela
ted
with
ex
posu
re, m
edia
tor,
and
outc
ome
wer
e co
nsid
ered
. Usi
ng
para
met
ers,
such
as
γ (c
ondi
tiona
l inc
reas
e in
risk
for o
ral c
ance
r),
P1 (p
reva
lenc
e in
sm
oker
s/ch
ewer
s/dr
inke
rs),
and
P2
(pre
vale
nce
amon
g no
n‑sm
oker
s/no
n‑ch
ewer
s/no
n‑dr
ink‑
ers)
wer
e sp
ecifi
ed.
The
bias
intr
oduc
ed
by u
nmea
sure
d co
n‑fo
unde
rs th
at m
ay
entir
ely
inva
lidat
e th
e co
ntro
lled
dire
ct
effec
t was
cal
cula
ted
✓U
nmea
sure
d co
nfou
nder
co
nsid
ered
with
th
e ex
posu
re‑o
ut‑
com
e re
latio
nshi
p
Not
app
licab
le

Page 12 of 21Liu et al. BMC Res Notes (2016) 9:354
Tabl
e 3
cont
inue
d
Refe
renc
esN
o un
mea
sure
d ex
posu
re‑o
utco
me
con‑
foun
ders
No
unm
easu
red
med
iato
r‑ou
tcom
e co
nfou
nder
sN
o un
mea
sure
d ex
posu
re‑m
edia
tor
conf
ound
ers
No
med
iato
r‑ou
tcom
e co
nfou
nder
aff
ecte
d by
the
expo
sure
Ack
now
ledg
ed
assu
mpt
ion
Empi
rica
l ana
lyse
s or
se
nsiti
vity
ana
lyse
sA
ckno
wle
dged
as
sum
ptio
nEm
piri
cal a
naly
‑se
s or
sen
sitiv
ity
anal
yses
Ack
now
ledg
ed
assu
mpt
ion
Empi
rica
l ana
ly‑
ses
or s
ensi
tivit
y an
alys
es
Ack
now
ledg
ed
assu
mpt
ion
Empi
rica
l ana
ly‑
ses
or s
ensi
tivit
y an
alys
es
Stud
ies
estim
atin
g na
tura
l dire
ct a
nd in
dire
ct e
ffect
s
D’A
mel
io e
t al.
[27]
Rand
omiz
ed c
ontr
olle
d tr
ial‑n
ot a
pplic
able
✓a
Not
repo
rted
Rand
omiz
ed c
ontr
olle
d tr
ial‑n
ot a
ppli‑
cabl
e✓
aN
o se
nsiti
vity
an
alys
es, b
ut
adju
sted
for
biom
arke
rs th
at
wer
e un
bal‑
ance
d be
twee
n th
e tw
o tr
eat‑
men
t gro
ups
at
base
line
Fre
eman
et a
l. [2
8]Ra
ndom
ized
con
trol
led
tria
l‑not
app
licab
le✓
No
sens
itivi
ty a
naly
‑se
s, bu
t adj
uste
d fo
r bas
elin
e co
nfou
nder
s; ca
n’t
rule
out
Rand
omiz
ed c
ontr
olle
d tr
ial‑n
ot a
ppli‑
cabl
e✓
Not
repo
rted
Jack
son
et a
l. [2
9]✓
Show
ed ri
sk fa
ctor
s by
an
tipsy
chot
ic g
roup
✓N
o se
nsiti
vity
an
alys
es, b
ut
adju
sted
for m
any
risk
fact
ors;
cann
ot
rule
out
resi
dual
co
nfou
ndin
g
✓N
o se
nsiti
vity
ana
ly‑
sis,
but r
esid
ual
conf
ound
ing
(i.e.
de
liriu
m) a
t bas
e‑lin
e th
at c
ould
bi
as th
e to
tal a
nd
indi
rect
effe
cts
upw
ards
was
ac
know
ledg
ed
✓N
o se
nsiti
vity
an
alys
es, b
ut
cond
ucte
d st
rat‑
ified
ana
lyse
s by
med
iato
rs to
pr
ovid
e qu
alita
‑tiv
e ev
iden
ce fo
r w
heth
er o
r not
th
e as
soci
atio
n be
twee
n m
edia
‑to
r and
mor
tal‑
ity is
mod
ified
by
ant
ipsy
chot
ic
type

Page 13 of 21Liu et al. BMC Res Notes (2016) 9:354
Tabl
e 3
cont
inue
d
Refe
renc
esN
o un
mea
sure
d ex
posu
re‑o
utco
me
con‑
foun
ders
No
unm
easu
red
med
iato
r‑ou
tcom
e co
nfou
nder
sN
o un
mea
sure
d ex
posu
re‑m
edia
tor
conf
ound
ers
No
med
iato
r‑ou
tcom
e co
nfou
nder
aff
ecte
d by
the
expo
sure
Ack
now
ledg
ed
assu
mpt
ion
Empi
rica
l ana
lyse
s or
se
nsiti
vity
ana
lyse
sA
ckno
wle
dged
as
sum
ptio
nEm
piri
cal a
naly
‑se
s or
sen
sitiv
ity
anal
yses
Ack
now
ledg
ed
assu
mpt
ion
Empi
rica
l ana
ly‑
ses
or s
ensi
tivit
y an
alys
es
Ack
now
ledg
ed
assu
mpt
ion
Empi
rica
l ana
ly‑
ses
or s
ensi
tivit
y an
alys
es
Lou
wie
s et
al.
[31]
XN
o se
nsiti
vity
ana
lyse
s, bu
t adj
uste
d fo
r co
nfou
nder
s in
Ta
ble
1, e
xcep
t day
of
the
wee
k
XN
ot re
port
edX
Not
repo
rted
XN
ot re
port
ed
Lu
et a
l. [3
2]✓
Excl
uded
firs
t 3 y
ears
of
follo
w‑u
p to
redu
ce
the
influ
ence
of b
ase‑
line
conf
ound
ers
Rest
ricte
d th
e an
alys
is
to n
ever
‑sm
oker
s to
bet
ter c
ontr
ol
for c
onfo
undi
ng b
y sm
okin
g
✓U
nmea
sure
d co
n-fo
unde
rCo
mm
on c
ause
of
met
abol
ic
med
iato
rs a
nd
coro
nary
hea
rt
dise
ase
(e.g
. fam
ily
hist
ory,
gen
etic
fa
ctor
s, re
sidu
al
conf
ound
ing
due
to m
easu
rem
ent
erro
r in
diet
and
ph
ysic
al a
ctiv
ity).
Sens
itivi
ty a
naly
‑se
s do
ne w
ith
two
scen
ario
s: (1
) m
ild c
onfo
und‑
ing
(incr
ease
d ha
zard
ratio
by
fact
or o
f 1.1
an
d pr
eval
ence
20
% fo
r nor
mal
w
eigh
t/25
%
for o
verw
eigh
t/ob
ese)
; and
(2)
stro
ng c
onfo
und‑
ing
(incr
ease
d ha
zard
ratio
by
fact
or o
f 1.8
and
pr
eval
ence
of
45 %
for n
orm
al
wei
ght a
nd 4
0 %
fo
r ove
rwei
ght/
obes
e)
✓Re
stric
ted
the
anal
ysis
to
neve
r‑sm
oker
s to
be
tter
con
trol
for
conf
ound
ing
by
smok
ing
✓N
ot re
port
ed
Page 14 of 21Liu et al. BMC Res Notes (2016) 9:354
Tabl
e 3
cont
inue
d
Refe
renc
esN
o un
mea
sure
d ex
posu
re‑o
utco
me
con‑
foun
ders
No
unm
easu
red
med
iato
r‑ou
tcom
e co
nfou
nder
sN
o un
mea
sure
d ex
posu
re‑m
edia
tor
conf
ound
ers
No
med
iato
r‑ou
tcom
e co
nfou
nder
aff
ecte
d by
the
expo
sure
Ack
now
ledg
ed
assu
mpt
ion
Empi
rica
l ana
lyse
s or
se
nsiti
vity
ana
lyse
sA
ckno
wle
dged
as
sum
ptio
nEm
piri
cal a
naly
‑se
s or
sen
sitiv
ity
anal
yses
Ack
now
ledg
ed
assu
mpt
ion
Empi
rica
l ana
ly‑
ses
or s
ensi
tivit
y an
alys
es
Ack
now
ledg
ed
assu
mpt
ion
Empi
rica
l ana
ly‑
ses
or s
ensi
tivit
y an
alys
es
Rag
hava
n et
al.
[35]
XN
ot re
port
edX
No
sens
itivi
ty a
naly
‑se
s, bu
t med
iatio
n an
alys
is w
as
cond
ucte
d w
ith
all t
hree
met
abol
ic
med
iato
rs(C
IR, H
OM
A‑IR
and
M
SS) t
oget
her
XN
o se
nsiti
vity
ana
ly‑
ses,
but m
edia
‑tio
n an
alys
is w
as
cond
ucte
d w
ith
all t
hree
met
a‑bo
lic m
edia
tors
(CIR
, HO
MA
‑IR a
nd
MSS
) tog
ethe
r
XN
ot re
port
ed
Son
g et
al.
[37]
✓N
o se
nsiti
vity
ana
lysi
s, bu
t inc
lude
d al
l th
e co
varia
tes
that
m
ay c
onfo
und
the
rela
tions
hip
✓N
o se
nsiti
vity
an
alys
is, b
ut
incl
uded
all
the
cova
riate
s th
at
may
con
foun
d th
e re
latio
nshi
p
✓N
o se
nsiti
vity
an
alys
is, b
ut
incl
uded
all
the
cova
riate
s th
at
may
con
foun
d th
e re
latio
nshi
p
✓Se
nsiti
vity
ana
lysi
s w
as c
ondu
cted
th
roug
h ex
clud
‑in
g BM
I, a
med
i‑at
or‑o
utco
me
conf
ound
er
that
is p
ossi
bly
affec
ted
by th
e ex
posu
re (l
ow
birt
h w
eigh
t)
Xie
et a
l. [3
8]X
Not
repo
rted
XN
ot re
port
edX
Not
repo
rted
XN
ot re
port
ed
Effec
ts n
ot id
entifi
ed
Kos
itsaw
at e
t al.
[30]
XN
ot re
port
edX
Not
repo
rted
XN
ot re
port
edX
Not
repo
rted
CIR
beta
cel
l cor
rect
ed in
sulin
resp
onse
; HO
MA-
IR h
omeo
stat
ic m
odel
ass
essm
ent f
or in
sulin
resi
stan
ce; M
SS m
etab
olic
syn
drom
e sc
ore
a Ide
ntifi
abili
ty a
ssum
ptio
ns w
ere
not s
peci
fical
ly m
entio
ned
in th
e ar
ticle
but
app
eare
d to
hav
e ap
prop
riate
refe
renc
es
Page 15 of 21Liu et al. BMC Res Notes (2016) 9:354
Tabl
e 4
Sens
itiv
ity
anal
ysis
for m
easu
rem
ent e
rror
or m
iscl
assi
ficat
ion
of m
edia
tor i
n ca
usal
med
iati
on a
naly
sis
Refe
renc
esM
edia
tor
Ratio
nale
App
roac
hRe
sults
Jack
son
et a
l. [2
9]M
edic
al e
vent
s (b
inar
y)A
lgor
ithm
s w
ith h
igh
posi
tive‑
pred
ictiv
e va
lues
wer
e us
ed to
iden
tify
med
ical
eve
nts
durin
g fo
llow
up
Fals
e ne
gativ
es is
a c
once
rn u
nder
som
e sc
enar
ios
How
resu
lts w
ould
cha
nge
wer
e ex
amin
ed
give
n va
rious
sce
nario
s of
non
‑diff
eren
tial
and
diffe
rent
ial m
iscl
assi
ficat
ion
Perf
ect s
peci
ficity
for o
bser
ving
the
med
ical
ev
ent,
but v
arie
d th
e se
nsiti
vity
from
0.2
5 to
0.
75 s
epar
atel
y fo
r tho
se w
ho s
urvi
ved
and
for t
hose
who
die
d w
as a
ssum
edEa
ch s
cena
rio w
as a
ssum
ed th
at m
edia
tor
mis
clas
sific
atio
n w
as n
on‑d
iffer
entia
l with
re
spec
t to
antip
sych
otic
type
, cov
aria
tes,
and
othe
r med
iato
rs b
ut s
ome
scen
ario
s al
low
ed
for d
iffer
entia
l mis
clas
sific
atio
n w
ith re
spec
t to
dea
th. A
hyb
rid a
ppro
ach
was
als
o us
ed
The
prop
ortio
n m
edia
ted
was
hig
her t
han
the
naïv
e es
timat
ors
for s
ome
med
ical
eve
nts
and
grew
as
sens
itivi
ty d
ecre
ased
from
0.7
5 to
0.2
5. T
he s
ensi
tivity
am
ong
thos
e w
ho s
ur‑
vive
d, ra
ther
than
thos
e w
ho d
ied,
app
eare
d to
hav
e m
ore
influ
ence
on
thes
e re
sults
It w
as s
ugge
sted
that
15
to 4
5 %
of t
he m
orta
lity
diffe
renc
e m
ight
be
expl
aine
d by
som
e co
ndi‑
tions
giv
en s
cena
rios
assu
med
com
pare
d to
9
% u
sing
naï
ve a
ppro
ach
Auth
ors s
ugge
sted
to a
ddre
ss m
edia
tor m
is‑
clas
sific
atio
n w
hen
it is
sus
pect
ed, p
refe
r‑ab
ly th
roug
h va
lidat
ion
sub‑
stud
ies
or b
ias
anal
yses
Lu e
t al.
[32]
Biom
arke
rs (c
ontin
uous
)N
ot re
port
edTh
e im
pact
of m
easu
rem
ent e
rror
in th
e m
edia
tors
by
calib
ratin
g th
e re
gres
sion
coe
f‑fic
ient
s w
as a
sses
sed
Ass
umin
g th
at 1
‑tim
e m
easu
rem
ents
for e
ach
met
abol
ic ri
sk a
t bas
elin
e ex
plai
n on
ly 6
5 %
of
thei
r tru
e va
riabi
lity
(i.e.
35
% m
easu
re‑
men
t err
or)
Aft
er c
orre
ctin
g fo
r a p
resu
med
35
% m
easu
re‑
men
tEr
ror i
n ea
ch m
etab
olic
risk
fact
or in
crea
sed
the
over
all t
he p
erce
ntag
e of
exc
ess
rela
tive
risk
med
iate
d fro
m 4
7 %
(33–
63 %
) to
69 %
(5
2–87
%) f
or o
verw
eigh
t, an
d fro
m 5
2 %
(3
8–68
%) t
o 73
% (5
8–88
%) f
or o
besi
ty
Rao
et a
l. [3
6]Sm
okin
gC
hew
ing
quid
and
/or t
obac
coA
lcoh
ol (b
inar
y)
Dic
hoto
miz
atio
n of
med
iato
r var
iabl
e w
as
done
to s
impl
ify th
e an
alys
is b
ut th
e es
ti‑m
ates
from
the
anal
ysis
cou
ld b
e bi
ased
The
sens
itivi
ty a
naly
sis
for n
on‑d
iffer
entia
l m
iscl
assi
ficat
ion
erro
r of b
inar
y m
edia
tor
was
use
d
The
pred
ictiv
e va
lue
wei
ghtin
g es
timat
ors
for
outc
ome
regr
essi
on w
as u
sed
The
sens
itivi
ty a
naly
sis
was
car
ried
out w
ithou
t ac
coun
ting
for t
he c
lust
erin
g us
ing
the
plau
sibl
e se
nsiti
vity
val
ues
rang
ing
from
0.7
5 to
1.0
and
spe
cific
ity fr
om 0
.75
to 1
.0
In th
e ab
senc
e of
exp
osur
e m
edia
tor i
nter
ac‑
tion,
the
sens
itivi
ty a
naly
sis
indi
cate
d a
slig
ht
over
est
imat
ion
of th
e co
ntro
lled
dire
ct e
ffect
The
bias
see
med
to b
e la
rger
whe
n th
e se
nsiti
v‑ity
and
spe
cific
ity d
ecre
ased

Page 16 of 21Liu et al. BMC Res Notes (2016) 9:354
Tabl
e 5
Elem
ents
of i
mpl
emen
tati
on fo
r cau
sal m
edia
tion
ana
lysi
s
a Sm
alle
st s
ampl
e si
ze u
sed
in th
e ca
usal
med
iatio
n an
alys
is
Refe
renc
esSa
mpl
e si
zea
Pow
er a
nd s
ampl
e si
ze c
alcu
la‑
tion
for m
edia
tion
anal
ysis
Expo
sure
‑med
iato
r int
erac
tion
in th
e m
odel
Pow
er a
nd s
ampl
e si
ze c
alcu
la‑
tion
for i
nter
actio
n an
alys
isLa
ck o
f pow
er m
entio
ned
as a
no
n‑ca
usal
exp
lana
tion
of fi
nd‑
ings
Stud
ies
with
neg
ativ
e fin
ding
s
Fre
eman
et a
l. [2
8]N
= 5
1 fo
r adj
uste
d an
d n =
54
for u
nadj
uste
d an
alys
is80
% p
ower
to d
etec
t lar
ge in
di‑
rect
effe
cts
(Frit
z M
, Mac
kinn
on
DP.
Requ
ired
sam
ple
size
to
dete
ct th
e m
edia
ted
effec
t)
Not
repo
rted
Not
app
licab
leLi
mite
d po
wer
to d
etec
t whe
ther
m
edia
ted
effec
ts w
ere
stat
isti‑
cally
sig
nific
ant
Jack
son
et a
l. [2
9]N
= 2
6,19
7N
ot re
port
ed✓
No
No
Kos
itsaw
at e
t al.
[30]
N =
176
5N
ot re
port
edN
ot re
port
edN
ot a
pplic
able
No
Lou
wie
s et
al.
[31]
N =
55
Not
repo
rted
Not
repo
rted
Not
app
licab
leCa
lled
for c
autio
us in
terp
reta
tion
give
n sm
all s
ampl
e si
ze
Men
dola
et a
l. [3
3]Va
ried
by o
utco
mes
(i.e
. 1 s
tudy
si
te d
id n
ot re
port
infa
nt a
pnea
)N
ot re
port
ed✓
No
No
Stud
ies
with
pos
itive
find
ings
Ban
ack
et a
l. [2
6]N
= 7
212
Not
repo
rted
✓N
oN
o
D’A
mel
io e
t al.
[27]
N =
37
80 %
pow
er, t
wo‑
side
d si
gnifi
‑ca
nce
leve
l of 0
.05,
to d
etec
t di
ffere
nces
in u
OC
gre
ater
than
1.
71 (t
test
on
log‑
scal
e)
✓N
oA
ckno
wle
dged
sm
all s
ampl
e si
ze
as a
lim
itatio
n
Lu
et a
l. [3
2]N
= 5
8,32
2 fo
r met
abol
icN
= 1
9,57
2 fo
r fibr
inog
enN
ot re
port
ed✓
No
No
Mes
serli
an e
t al.
[34]
All
sing
leto
n bi
rths
(n =
18,
147)
; on
ly fi
rst b
irths
(n =
865
1)N
ot re
port
edN
ot re
port
edN
ot a
pplic
able
Lim
ited
pow
er m
entio
ned;
lim
ited
sam
ple
size
to e
valu
ate
spon
‑ta
neou
s an
d in
duce
d pr
eter
m
birt
h se
para
tely
Rag
hava
n et
al.
[35]
Varie
d by
med
iato
rs (n
= 2
159
for d
iet s
core
; and
n =
209
8 fo
r ph
ysic
al a
ctiv
ity in
dex)
Not
repo
rted
Not
repo
rted
Not
app
licab
leLa
ck o
f pow
er to
exa
min
e th
e as
soci
atio
n in
the
med
iatio
n fra
mew
ork
Rao
et a
l. [3
6]N
= 4
33N
ot re
port
edX
No
No
Son
g et
al.
[37]
Varie
d by
med
iato
rs (b
iom
arke
rs)
Not
repo
rted
✓N
oD
espi
te s
ome
sign
ifica
nt m
edia
‑tio
n by
sev
eral
bio
mar
kers
, the
sa
mpl
e si
ze m
ay s
till n
ot b
e la
rge
enou
gh to
pro
vide
mor
e pr
ecis
e es
timat
es o
r to
dete
ct m
edia
tion
by o
ther
pot
entia
l fac
tors
with
sm
alle
r med
iatio
n eff
ects
Xie
et a
l. [3
8]N
= 1
67N
ot re
port
edX
No
Smal
l sam
ple
size
ack
now
ledg
ed
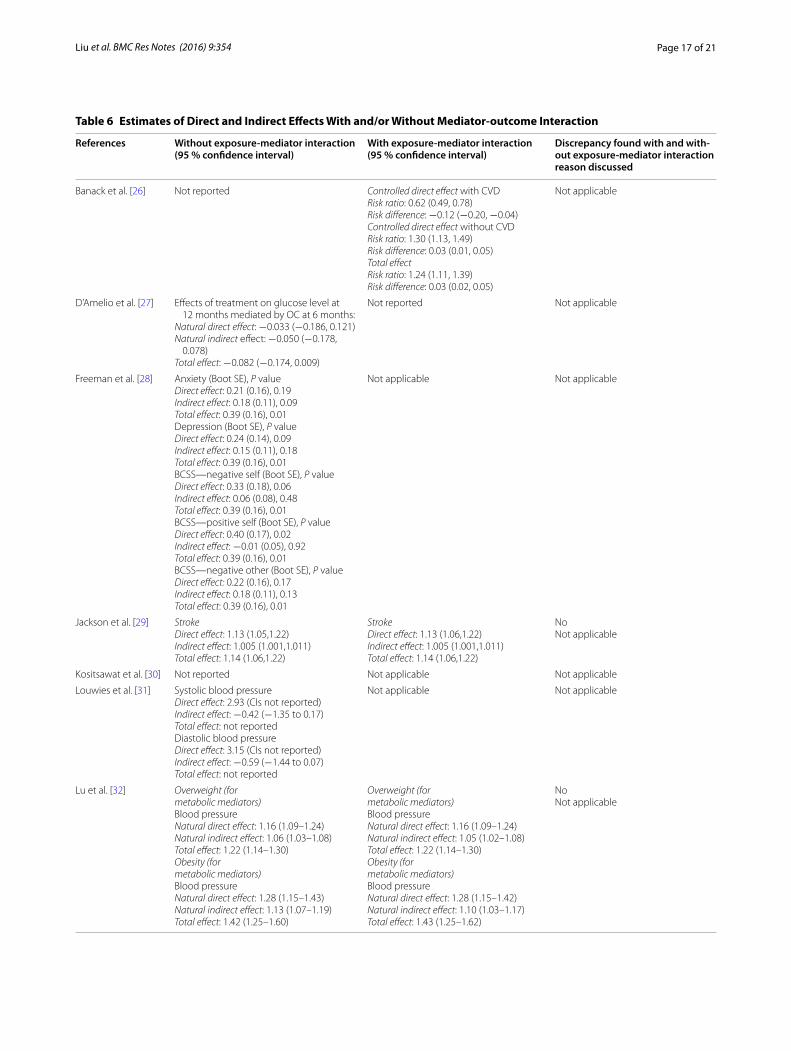
Page 17 of 21Liu et al. BMC Res Notes (2016) 9:354
Table 6 Estimates of Direct and Indirect Effects With and/or Without Mediator-outcome Interaction
References Without exposure‑mediator interaction (95 % confidence interval)
With exposure‑mediator interaction (95 % confidence interval)
Discrepancy found with and with‑out exposure‑mediator interaction reason discussed
Banack et al. [26] Not reported Controlled direct effect with CVDRisk ratio: 0.62 (0.49, 0.78)Risk difference: −0.12 (−0.20, −0.04)Controlled direct effect without CVDRisk ratio: 1.30 (1.13, 1.49)Risk difference: 0.03 (0.01, 0.05)Total effectRisk ratio: 1.24 (1.11, 1.39)Risk difference: 0.03 (0.02, 0.05)
Not applicable
D’Amelio et al. [27] Effects of treatment on glucose level at 12 months mediated by OC at 6 months:
Natural direct effect: −0.033 (−0.186, 0.121)Natural indirect effect: −0.050 (−0.178,
0.078)Total effect: −0.082 (−0.174, 0.009)
Not reported Not applicable
Freeman et al. [28] Anxiety (Boot SE), P valueDirect effect: 0.21 (0.16), 0.19Indirect effect: 0.18 (0.11), 0.09Total effect: 0.39 (0.16), 0.01Depression (Boot SE), P valueDirect effect: 0.24 (0.14), 0.09Indirect effect: 0.15 (0.11), 0.18Total effect: 0.39 (0.16), 0.01BCSS—negative self (Boot SE), P valueDirect effect: 0.33 (0.18), 0.06Indirect effect: 0.06 (0.08), 0.48Total effect: 0.39 (0.16), 0.01BCSS—positive self (Boot SE), P valueDirect effect: 0.40 (0.17), 0.02Indirect effect: −0.01 (0.05), 0.92Total effect: 0.39 (0.16), 0.01BCSS—negative other (Boot SE), P valueDirect effect: 0.22 (0.16), 0.17Indirect effect: 0.18 (0.11), 0.13Total effect: 0.39 (0.16), 0.01
Not applicable Not applicable
Jackson et al. [29] StrokeDirect effect: 1.13 (1.05,1.22)Indirect effect: 1.005 (1.001,1.011)Total effect: 1.14 (1.06,1.22)
StrokeDirect effect: 1.13 (1.06,1.22)Indirect effect: 1.005 (1.001,1.011)Total effect: 1.14 (1.06,1.22)
NoNot applicable
Kositsawat et al. [30] Not reported Not applicable Not applicable
Louwies et al. [31] Systolic blood pressureDirect effect: 2.93 (CIs not reported)Indirect effect: −0.42 (−1.35 to 0.17)Total effect: not reportedDiastolic blood pressureDirect effect: 3.15 (CIs not reported)Indirect effect: −0.59 (−1.44 to 0.07)Total effect: not reported
Not applicable Not applicable
Lu et al. [32] Overweight (formetabolic mediators)Blood pressureNatural direct effect: 1.16 (1.09–1.24)Natural indirect effect: 1.06 (1.03–1.08)Total effect: 1.22 (1.14–1.30)Obesity (formetabolic mediators)Blood pressureNatural direct effect: 1.28 (1.15–1.43)Natural indirect effect: 1.13 (1.07–1.19)Total effect: 1.42 (1.25–1.60)
Overweight (formetabolic mediators)Blood pressureNatural direct effect: 1.16 (1.09–1.24)Natural indirect effect: 1.05 (1.02–1.08)Total effect: 1.22 (1.14–1.30)Obesity (formetabolic mediators)Blood pressureNatural direct effect: 1.28 (1.15–1.42)Natural indirect effect: 1.10 (1.03–1.17)Total effect: 1.43 (1.25–1.62)
NoNot applicable
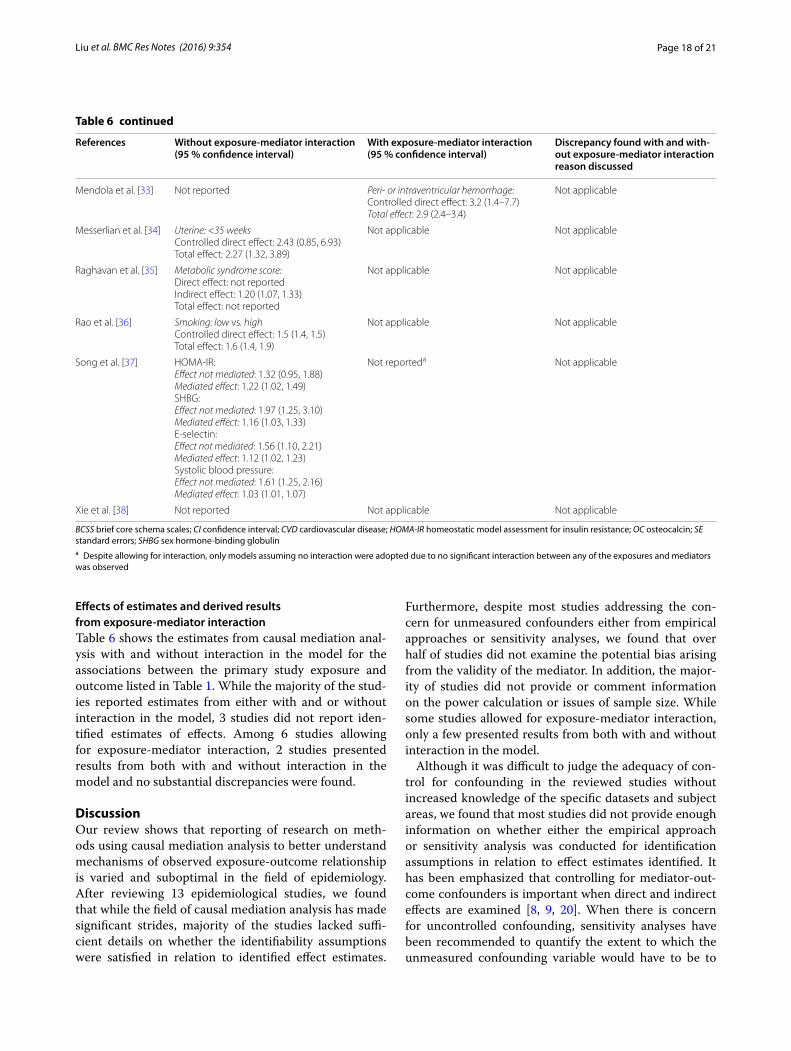
Page 18 of 21Liu et al. BMC Res Notes (2016) 9:354
Effects of estimates and derived results from exposure‑mediator interactionTable 6 shows the estimates from causal mediation anal-ysis with and without interaction in the model for the associations between the primary study exposure and outcome listed in Table 1. While the majority of the stud-ies reported estimates from either with and or without interaction in the model, 3 studies did not report iden-tified estimates of effects. Among 6 studies allowing for exposure-mediator interaction, 2 studies presented results from both with and without interaction in the model and no substantial discrepancies were found.
DiscussionOur review shows that reporting of research on meth-ods using causal mediation analysis to better understand mechanisms of observed exposure-outcome relationship is varied and suboptimal in the field of epidemiology. After reviewing 13 epidemiological studies, we found that while the field of causal mediation analysis has made significant strides, majority of the studies lacked suffi-cient details on whether the identifiability assumptions were satisfied in relation to identified effect estimates.
Furthermore, despite most studies addressing the con-cern for unmeasured confounders either from empirical approaches or sensitivity analyses, we found that over half of studies did not examine the potential bias arising from the validity of the mediator. In addition, the major-ity of studies did not provide or comment information on the power calculation or issues of sample size. While some studies allowed for exposure-mediator interaction, only a few presented results from both with and without interaction in the model.
Although it was difficult to judge the adequacy of con-trol for confounding in the reviewed studies without increased knowledge of the specific datasets and subject areas, we found that most studies did not provide enough information on whether either the empirical approach or sensitivity analysis was conducted for identification assumptions in relation to effect estimates identified. It has been emphasized that controlling for mediator-out-come confounders is important when direct and indirect effects are examined [8, 9, 20]. When there is concern for uncontrolled confounding, sensitivity analyses have been recommended to quantify the extent to which the unmeasured confounding variable would have to be to
BCSS brief core schema scales; CI confidence interval; CVD cardiovascular disease; HOMA-IR homeostatic model assessment for insulin resistance; OC osteocalcin; SE standard errors; SHBG sex hormone-binding globulina Despite allowing for interaction, only models assuming no interaction were adopted due to no significant interaction between any of the exposures and mediators was observed
Table 6 continued
References Without exposure‑mediator interaction (95 % confidence interval)
With exposure‑mediator interaction (95 % confidence interval)
Discrepancy found with and with‑out exposure‑mediator interaction reason discussed
Mendola et al. [33] Not reported Peri‑ or intraventricular hemorrhage:Controlled direct effect: 3.2 (1.4–7.7)Total effect: 2.9 (2.4–3.4)
Not applicable
Messerlian et al. [34] Uterine: <35 weeksControlled direct effect: 2.43 (0.85, 6.93)Total effect: 2.27 (1.32, 3.89)
Not applicable Not applicable
Raghavan et al. [35] Metabolic syndrome score:Direct effect: not reportedIndirect effect: 1.20 (1.07, 1.33)Total effect: not reported
Not applicable Not applicable
Rao et al. [36] Smoking: low vs. highControlled direct effect: 1.5 (1.4, 1.5)Total effect: 1.6 (1.4, 1.9)
Not applicable Not applicable
Song et al. [37] HOMA‑IR:Effect not mediated: 1.32 (0.95, 1.88)Mediated effect: 1.22 (1.02, 1.49)SHBG:Effect not mediated: 1.97 (1.25, 3.10)Mediated effect: 1.16 (1.03, 1.33)E‑selectin:Effect not mediated: 1.56 (1.10, 2.21)Mediated effect: 1.12 (1.02, 1.23)Systolic blood pressure:Effect not mediated: 1.61 (1.25, 2.16)Mediated effect: 1.03 (1.01, 1.07)
Not reporteda Not applicable
Xie et al. [38] Not reported Not applicable Not applicable
Page 19 of 21Liu et al. BMC Res Notes (2016) 9:354
invalidate inferences about the direct and indirect effects [15, 24, 39]. Several approaches can be used to address unmeasured confounding [1]. For example, researchers can choose to report how large the effects of the con-founder variable would need to be to completely explain the effects of estimates. To improve reporting of causal mediation analyses in epidemiological literature, we rec-ommend the following. First, studies should be trans-parent on whether the empirical approach or sensitivity analyses were used to evaluate identifiability assump-tions. Second, studies must carefully consider the extent to which bias is present due to concerns regarding valid measurement of the mediator. Several approaches are available to address this issue [21, 22]. Third, if research-ers are concerned about the presence of multiple bias in the study, we recommend that researchers prioritize the approaches depending on the context to strengthen their findings.
We found that the majority of studies did not report whether the statistical power or sample size calculation was calculated or if the researchers believed that the sample size available was sufficient to estimate direct and indirect effects with sufficient precision. However, we recognize that approached for calculation power and sample size for direct and indirect effects is limited in the current literature, especially for the exposure-mediator interaction [1]. To understand what sample size is suffi-cient for mediation analysis, it is currently recommended that researchers use previously published tables for ade-quate power in single-mediator models [40]. In addition, we also recommend that studies should comment on whether lack of power or insufficient sample size was a likely non-causal explanation of findings especially for these with relatively small sample size.
It has been proven that under sequential ignorability and the additional no-interaction assumption, the esti-mate based on the product of coefficients method can be interpreted as a valid estimate of the causal mediation effect as long as the linearity assumption holds [41, 42]. However, in many studies it is unrealistic to assume that the exposure and mediator do not interact in their effects on the outcome. Carrying out mediation analysis incor-rectly assuming no interaction may result in invalid infer-ences [13]. Despite the progress of statistical methods in mediation analysis under settings with a binary mediator or count outcomes for exposure-mediator interactions [13], we found that most studies did not report whether there was exposure-mediator interaction in the model.. Although more assumptions are required for the decom-position of a total effect into direct and indirect effects even in models with interactions and non-linearity under the counterfactual framework, this decomposition of total effects allows investigators to assess whether most
of the effect is mediated through a particular intermedi-ate or the extent to which it is through other pathways. Therefore, we recommend that future studies include exposure-mediator interactions by default in the out-come model as suggested [1]. We recommend that exposure-mediator interactions only be excluded if the magnitude of interactions is small and do not change the estimates of direct and indirect effects very much.
Our review is subject to some limitations. First, we included only epidemiological studies published in 2015 and limited to those published in English. The findings may not be representative of all publications using causal mediation analysis. However, it is reasonable to give some time for the development and use of methods given that seminal articles for applications were mainly published in 2012 or 2013 and we are interested in a “snapshot” of cur-rent practices in reporting such complex methods from the most recent year. Second, the reporting practices of published studies may be influenced by journals’ require-ments. Authors may be reporting their approach and findings given word limitations from journals and thus may have limited space to provide details needed for the method. Nevertheless, with methods that require careful implementation of the approach, such reporting is neces-sary to evaluate the extent to which the method has been appropriately applied. Third, it is possible that we missed some relevant articles due to lack of standardized ter-minology or exchangeable jargons to describe the study design of causal mediation analysis. However, we believe that including papers which cited the seminal papers reduced the likelihood of this happening. Despite the limitations, this is the first review to examine how epide-miological studies have used causal mediation analysis, what appropriate procedures and analysis are needed to conduct such complex technique, and what elements are critical to report for the method, which is we believe is a strength of our review.
ConclusionsAlthough the application of causal mediation analysis is increasing in epidemiology, there is an opportunity for improving the quality and presentation of this methodol-ogy. We found that there is varied and suboptimal report-ing of this emerging approach in literature. We identified that the majority of studies addressing unmeasured con-founding for the mediator-outcome relationship. We recommend that future studies should: (1) provide suf-ficient details on whether either the empirical approach or sensitivity analysis was conducted for identifiability assumptions in relation to effect estimates identified, (2) comment on the bias that may arise from the validity of mediator, (3) discuss whether lack of statistical power or insufficient sample size issue was likely a non-causal
Page 20 of 21Liu et al. BMC Res Notes (2016) 9:354
explanation of findings, and (4) allow the inclusion of exposure-mediator interaction in the model and present results derived from models with and without interaction terms. We hope that the development of best practices in reporting complex methods in epidemiological research and the adoption of such reporting standards may help quality assessment and interpretation of studies using causal mediation analysis.
Authors’ contributionsAll listed authors have made material contribution to the completion of this manuscript. Mr. Liu conceived and designed the study as well as performed data extraction. This study was conducted under the guidance of Drs. Lapane and Ulbricht with input from the remaining authors. Extracted information were confirmed by Drs. Lapane and Chrysanthopoulou for all eligible studies. Mr. Liu also wrote the first draft of the article, and all other authors revised the manuscript for important intellectual content. All authors read and approved the final manuscript.
Author details1 Clinical and Population Health Research Program, Graduate School of Bio‑medical Sciences, University of Massachusetts Medical School, 368 Planta‑tion Street, Worcester, MA 01655, USA. 2 Division of Epidemiology of Chronic Diseases and Vulnerable Populations, Department of Quantitative Health Sciences, University of Massachusetts Medical School, Worcester, MA 01605, USA. 3 Division of Biostatistics and Health Services Research, Department of Quantitative Health Sciences, University of Massachusetts Medical School, Worcester, MA 01605, USA.
Competing interestsThe authors declare that they have no competing interests.
FundingThis work was supported by the National Institute on Aging [grant number 1R21AG046839‑01 to Dr. Kate Lapane]; and the National Cancer Institute [Grant number 1R21CA198172 to Dr. Kate Lapane].
Received: 30 April 2016 Accepted: 14 July 2016
References 1. VanderWeele TJ. Explanation in causal inference: methods for mediation
and interaction. Oxford: Oxford University Press; 2015. 2. Vanderweele TJ, Asomaning K, Tchetgen Tchetgen EJ, Han Y, Spitz
MR, Shete S, et al. Genetic variants on 15q25.1, smoking, and lung cancer: an assessment of mediation and interaction. Am J Epidemiol. 2012;175:1013–20.
3. Huang Y‑T, Vanderweele TJ, Lin X. Joint analysis of SNP and gene expres‑sion data in genetic association studies of complex diseases. Ann Appl Stat. 2014;8:352–76.
4. VanderWeele TJ, Lauderdale DS, Lantos JD. Medically induced preterm birth and the associations between prenatal care and infant mortality. Ann Epidemiol. 2013;23:435–40.
5. Mumford SL, Schisterman EF, Siega‑Riz AM, Gaskins AJ, Wactawski‑Wende J, VanderWeele TJ. Effect of dietary fiber intake on lipoprotein cholesterol levels independent of estradiol in healthy premenopausal women. Am J Epidemiol. 2011;173:145–56.
6. Nandi A, Glymour MM, Kawachi I, VanderWeele TJ. Using marginal struc‑tural models to estimate the direct effect of adverse childhood social conditions on onset of heart disease, diabetes, and stroke. Epidemiology. 2012;23:223–32.
7. Baron RM, Kenny DA. The moderator‑mediator variable distinction in social psychological research: conceptual, strategic, and statistical consid‑erations. J Pers Soc Psychol. 1986;51:1173–82.
8. Robins JM, Greenland S. Identifiability and exchangeability for direct and indirect effects. Epidemiology. 1992;3:143–55.
9. Pearl J. Direct and indirect effects. In: Proceedings seventeenth confer‑ence uncertain Artificial Intelligence. 2001. p. 411–20.
10. Vanderweele TJ, Vansteelandt S. Conceptual issues concerning media‑tion, interventions and composition. Stat Interface. 2009;2:457–68.
11. Imai K, Keele L, Tingley D, Yamamoto T. Causal mediation analysis using R. In: Advances in social science research using R. Vol 196. 2010. p. 129–54.
12. Imai K, Keele L, Tingley D. A general approach to causal mediation analy‑sis. Psychol Methods. 2010;15:309–34.
13. Valeri L, Vanderweele TJ. Mediation analysis allowing for exposure‑mediator interactions and causal interpretation: theoretical assumptions and implementation with SAS and SPSS macros. Psychol Methods. 2013;18:137–50.
14. Preacher KJ, Rucker DD, Hayes AF. Addressing modearated mediation hypotheses: theory, methods, and prescriptions. Multivar Behav Res. 2007;42:185–227.
15. VanderWeele TJ, Vansteelandt S. Odds ratios for mediation analysis for a dichotomous outcome. Am J Epidemiol. 2010;172:1339–48.
16. Richiardi L, Bellocco R, Zugna D. Mediation analysis in epidemiology: methods, interpretation and bias. Int J Epidemiol. 2013;42:1511–9.
17. Emsley R, Liu H. PARAMED: Stata module to perform causal mediation analysis using parametric regression models. Statistical software compo‑nents. Boston: Boston College Department of Economics; 2013.
18. Moher D, Liberati A, Tetzlaff J, Altman DGTPG. Preferred reporting items for systematic reviews and meta‑analyses: the PRISMA statement. PLoS Med. 2009;2009(6):e1000097.
19. VanderWeele TJ. Mediation analysis: a practitioner’s guide. Ann Rev Publ Health. 2016;37:annurev—publhealth—032315–021402.
20. Cole SR, Hernán MA. Fallibility in estimating direct effects. Int J Epidemiol. 2002;31:163–5.
21. Valeri L, Lin X, VanderWeele TJ. Mediation analysis when a continuous mediator is measured with error and the outcome follows a generalized linear model. Stat Med Engl. 2014;33:4875–90.
22. le Cessie S, Debeij J, Rosendaal FR, Cannegieter SC, Vandenbroucke JP. Quantification of bias in direct effects estimates due to different types of measurement error in the mediator. Epidemiology. 2012;23:551–60.
23. Blakely T, McKenzie S, Carter K. Misclassification of the mediator mat‑ters when estimating indirect effects. J Epidemiol Community Health. 2013;67:458–66.
24. Hafeman DM. Confounding of indirect effects: a sensitivity analysis exploring the range of bias due to a cause common to both the media‑tor and the outcome. Am J Epidemiol. 2011;174:710–7.
25. VanderWeele TJ. Bias formulas for sensitivity analysis for direct and indi‑rect effects. Epidemiology. 2010;21:540–51.
26. Banack HR, Kaufman JS. Does selection bias explain the obesity para‑dox among individuals with cardiovascular disease? Ann Epidemiol. 2015;25:342–9.
27. D’Amelio P, Sassi F, Buondonno I, Spertino E, Tamone C, Piano S, et al. Effect of intermittent PTH treatment on plasma glucose in osteoporosis: a randomized trial. Bone. 2015;76:177–84.
28. Freeman D, Emsley R, Dunn G, Fowler D, Bebbington P, Kuipers E, et al. The stress of the street for patients with persecutory delusions: a test of the symptomatic and psychological effects of going outside into a busy urban area. Schizophr Bull. 2015;41:971–9.
29. Jackson JW, VanderWeele TJ, Blacker D, Schneeweiss S. Mediators of first‑versus second‑generation antipsychotic‑related mortality in older adults. Epidemiology. 2015;26:700–9.
30. Kositsawat J, Kuchel GA, Tooze JA, Houston DK, Cauley JA, Kritchevsky SB, et al. Vitamin D insufficiency and abnormal hemoglobin A1c in black and white older persons. J Gerontol Ser A Biol Sci Med Sci. 2015;70:525–31.
31. Louwies T, Nawrot T, Cox B, Dons E, Penders J, Provost E, et al. Blood pressure changes in association with black carbon exposure in a panel of healthy adults are independent of retinal microcirculation. Environ Int. 2015;75:81–6.
32. Lu Y, Hajifathalian K, Rimm EB, Ezzati M, Danaei G. Mediators of the effect of body mass index on coronary heart disease decomposing direct and indirect effects. Epidemiology. 2015;26:153–62.
33. Mendola P, Mumford SL, Mannisto TI, Holston A, Reddy UM, Laughon SK. Controlled direct effects of preeclampsia on neonatal health after accounting for mediation by preterm birth. Epidemiology. 2015;26:17–26.
34. Messerlian C, Platt RW, Ata B, Tan S‑L, Basso O. Do the causes of infertility play a direct role in the aetiology of preterm birth? Paediatr Perinat Epidemiol Engl. 2015;29:101–12.

Page 21 of 21Liu et al. BMC Res Notes (2016) 9:354
• We accept pre-submission inquiries
• Our selector tool helps you to find the most relevant journal
• We provide round the clock customer support
• Convenient online submission
• Thorough peer review
• Inclusion in PubMed and all major indexing services
• Maximum visibility for your research
Submit your manuscript atwww.biomedcentral.com/submit
Submit your next manuscript to BioMed Central and we will help you at every step:
35. Raghavan S, Porneala B, McKeown N, Fox CS, Dupuis J, Meigs JB. Meta‑bolic factors and genetic risk mediate familial type 2 diabetes risk in the Framingham heart study. Diabetologia. 2015;58:988–96.
36. Rao SK, Mejia GC, Roberts‑Thomson K, Logan RM, Kamath V, Kulkarni M, et al. Estimating the effect of childhood socioeconomic disadvantage on oral cancer in india using marginal structural models. Epidemiology. 2015;26:509–17.
37. Song Y, Huang Y‑T, Song Y, Hevener AL, Ryckman KK, Qi L, et al. Birth‑weight, mediating biomarkers and the development of type 2 diabetes later in life: a prospective study of multi‑ethnic women. Diabetologia. 2015;58:1220–30.
38. Xie C, Zhao Y, Gao L, Chen J, Cai D, Zhang Y. Elevated phthalates’ exposure in children with constitutional delay of growth and puberty. Mol Cell Endocrinol. 2015;407:67–73.
39. Tchetgen Tchetgen EJ, Shpitser I, Tchetgen EJT, Shpitser I. Semipa‑rametric theory for causal mediation analysis: efficiency bounds, multiple robustness and sensitivity analysis. Ann Stat Inst Math Stat. 2012;40:1816–45.
40. Fritz MS, MacKinnon DP. Required sample size to detect the mediated effect. Psychol Sci. 2007;18:233–9.
41. Jo B. Causal inference in randomized experiments with mediational processes. Psychol Methods. 2008;13:314–36.
42. Imai K, Keele L, Yamamoto T. Identification, inference and sensitivity analysis for causal mediation effects. Stat Sci. 2010;25:51–71.