implementation and operation of a cloud-based...
TRANSCRIPT

Implementation and Operation of a Cloud-Based Participatory Damage
Recognition System to Obtain a Common Operational Picture that
Supports a Quick Disaster Response
1Reo Kimura,
2Munenari Inoguchi,
2Keiko Tamura,
3Yuji Nawa,
4Haruo Hayashi
1University of Hyogo,
2Niigata University,
3ESRI,
4Kyoto University
Abstract
A cloud-based participatory damage recognition
survey system using WEB-GIS was implemented and
operated to collect comprehensive and fundamental
information that could be utilized to generate a
common operational picture, which are essential for
the recovery and reconstruction efforts during
widearea, complex disaster responses. The extent of
damages due to buildings that were washed away by
the tsunami that occurred during the Great East
Japan (Tohoku) Earthquake of 2011 was captured
using aerial views. The objective of this research was
to develop the cloud-based participatory WEB-GIS
system constructing the common operational picture
in order to facilitate the decision-making process of
disaster response. The team set the research aim to
create the web service of certifying property damage
due to Tsunami. Using developed service the team
conducted the demonstration experiment to survey to
identify buildings that were washed away in the three
afflicted prefectures of Iwate, Miyagi, and
Fukushima by Tohoku Earthquake.
1. Introduction
High-quality disaster responses cannot be
provided without constructing a common operational
picture (COP) and organic collaboration among
stakeholders. To this end, it is effective to visualize
damages and responses using a Geographic
Information System (GIS), which facilitates
decision-making based on visualized data. In reality,
however, during the chaotic days immediately
following a disaster, the collection and consolidation
of data for visualization is insufficient. The absence
of data to be visualized hinders our efforts to
construct a common operational picture.
2. 2011 Great East Japan Earthquake
The Great East Japan (Tohoku) Earthquake on
March 11, 2011 generated massive tsunamis that
washed away many buildings (Figure 1).
Approximately 20,000 people died or went missing,
approximately 130,000 buildings were severely
damaged or washed away, and approximately
255,000 buildings sustained some
damages. The amount of direct damages was
estimated to be between 16 and 25 trillion yen and
the amount of debris exceeded 26.7 million tons. As
many as 73,500 people were evacuated from the
damaged prefectures (Table 1). Japan defined the
responsibilities of the national and regional
governments during disaster responses in the
Fundamental Disaster Relief Act, which was
implemented in 1961. The Tohoku Earthquake was a
huge disaster that shook the entire nation (Figure 2).
This disaster inflicted severe human and property
Figure 1. The 2011 Great East Japan (Tohoku) Earthquake
and Tsunami (Mw=9.0)
Noda village, Iwate prefecture, Japan
Table 1. Summary of the impact at the Great East Japan
Earthquake in 2011
Figure 2. Japanese Disaster Management System since
1961
International Journal for Infonomics (IJI), Special Issue Volume 1, Issue 1, 2013
Copyright © 2013, Infonomics Society 860

damages to 3 out of 47 prefectures and 22 prefectures
established disaster response centers.
3. Efficient methods of earthquake and
tsunami damage estimation
Our research team initially organized building
point data according to altitude in a geographic space
to create a big picture of damages. We then
estimated the number of damaged buildings in each
region alongside the height of the tsunamis in these
regions (as reported by the Japan Meteorological
Agency). The results indicated that 270,000
buildings were damaged in three prefectures of
Iwate, Miyagi, and Fukushima. Figure 3 shows the
results of our information analyses, which were
shared with the disaster response workers. Under
ideal circumstances we would have conducted a field
survey to verify the results of our estimate. However,
immediately after the earthquake, access to the
disaster area was limited and the survey would have
taken a very long time. These conditions necessitated
the development of an efficient survey method that
did not require visits to the fields.
Figure 3. Estimated number of buildings damaged by
the tsunamis
4. System design
4.1. Aim of the system
The aim was to build a system to enable
participation from anywhere in Japan. This requires a
good network environment in order to secure a stable
supply of human resources for the quick and efficient
execution of the survey. Specifically, we designed a
system to determine whether a building was washed
away or not using the WEB-GIS by superimposing
building data before the earthquake (building data)
and aerial views after the earthquake (Figure 4).
4.3.2. Survey areas by roads. We intersected areas by
roads, and each area was assigned a 13-digit ID
number for each survey area (Figure 6). The 13-digit
ID number was composed of a city, ward, or "cho"
district code (5 digits), flood area code (4 digits), and
survey area code for city, ward, and "cho" (4 digits).
This made it easy to visually identify survey areas,
and tally the results according to governmental
jurisdictions.
4.2. Fundamental concepts of design
The following three points were established as
the fundamental concepts of design. These concepts
were determined based on discussions among
information technology and psychology researchers.
The discussions were centered on how to establish a
mechanism that allowed investigators to intuitively
conduct a survey without being stressed out in a
cloud-based environment and how to motivate
investigators in physically remote locations by
providing visibility to other workers' progress.
4.3.1. Judgment patterns for washed-away
buildings. Two categories were created for buildings
that were washed away, either completely washed
away or partially washed away. The purpose of this
was to make it easy for an investigator to intuitively
make a judgment (Figure 5). Despite our initial
decision to include the unable to determine category
during the development phase of this survey we
decided against this. We were concerned that some
investigators would categorize ambiguous cases to
the unable to determine category if there was a
discrepancy between the buildings being completely
washed away or partially washed away. The purpose
of this survey was to rapidly grasp the big picture of
a wide-area disaster by spending only the minimum
amount of time needed to assess building damage,
instead of spending a large amount of time to
precisely evaluate the degree of damage on each
building. For this reason, the survey required
investigators to always categorize all buildings into
the categories of completely washed away or
partially washed away.
4.3.2. Survey areas by roads. We intersected areas
by roads, and each area was assigned a 13-digit ID
number for each survey area (Figure 6). The 13-digit
ID number was composed of a city, ward, or "cho"
district code (5 digits), flood area code (4 digits), and
survey area code for city, ward, and "cho" (4 digits).
This made it easy to visually identify survey areas,
and tally the results according to governmental
jurisdictions.
International Journal for Infonomics (IJI), Special Issue Volume 1, Issue 1, 2013
Copyright © 2013, Infonomics Society 861
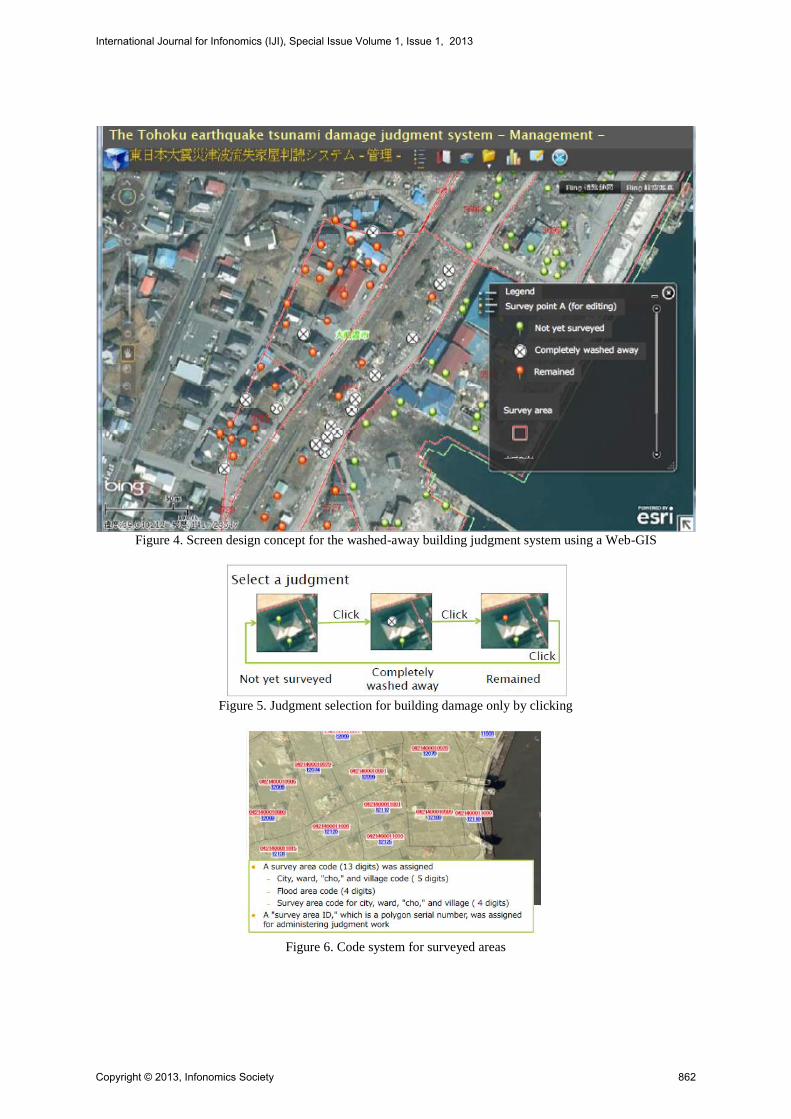
Figure 4. Screen design concept for the washed-away building judgment system using a Web-GIS
Figure 5. Judgment selection for building damage only by clicking
Figure 6. Code system for surveyed areas
International Journal for Infonomics (IJI), Special Issue Volume 1, Issue 1, 2013
Copyright © 2013, Infonomics Society 862
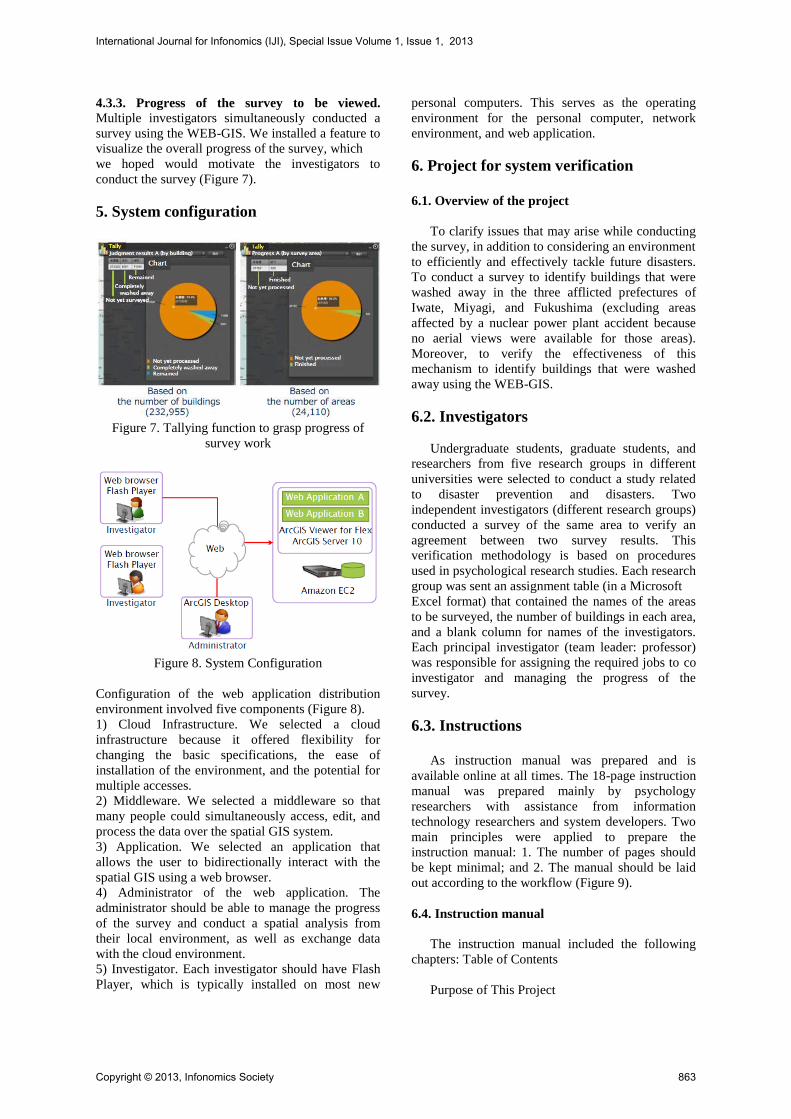
4.3.3. Progress of the survey to be viewed. Multiple investigators simultaneously conducted a
survey using the WEB-GIS. We installed a feature to
visualize the overall progress of the survey, which
we hoped would motivate the investigators to
conduct the survey (Figure 7).
5. System configuration
Figure 7. Tallying function to grasp progress of
survey work
Figure 8. System Configuration
Configuration of the web application distribution
environment involved five components (Figure 8).
1) Cloud Infrastructure. We selected a cloud
infrastructure because it offered flexibility for
changing the basic specifications, the ease of
installation of the environment, and the potential for
multiple accesses.
2) Middleware. We selected a middleware so that
many people could simultaneously access, edit, and
process the data over the spatial GIS system.
3) Application. We selected an application that
allows the user to bidirectionally interact with the
spatial GIS using a web browser.
4) Administrator of the web application. The
administrator should be able to manage the progress
of the survey and conduct a spatial analysis from
their local environment, as well as exchange data
with the cloud environment.
5) Investigator. Each investigator should have Flash
Player, which is typically installed on most new
personal computers. This serves as the operating
environment for the personal computer, network
environment, and web application.
6. Project for system verification
6.1. Overview of the project
To clarify issues that may arise while conducting
the survey, in addition to considering an environment
to efficiently and effectively tackle future disasters.
To conduct a survey to identify buildings that were
washed away in the three afflicted prefectures of
Iwate, Miyagi, and Fukushima (excluding areas
affected by a nuclear power plant accident because
no aerial views were available for those areas).
Moreover, to verify the effectiveness of this
mechanism to identify buildings that were washed
away using the WEB-GIS.
6.2. Investigators
Undergraduate students, graduate students, and
researchers from five research groups in different
universities were selected to conduct a study related
to disaster prevention and disasters. Two
independent investigators (different research groups)
conducted a survey of the same area to verify an
agreement between two survey results. This
verification methodology is based on procedures
used in psychological research studies. Each research
group was sent an assignment table (in a Microsoft
Excel format) that contained the names of the areas
to be surveyed, the number of buildings in each area,
and a blank column for names of the investigators.
Each principal investigator (team leader: professor)
was responsible for assigning the required jobs to co
investigator and managing the progress of the
survey.
6.3. Instructions
As instruction manual was prepared and is
available online at all times. The 18-page instruction
manual was prepared mainly by psychology
researchers with assistance from information
technology researchers and system developers. Two
main principles were applied to prepare the
instruction manual: 1. The number of pages should
be kept minimal; and 2. The manual should be laid
out according to the workflow (Figure 9).
6.4. Instruction manual
The instruction manual included the following
chapters: Table of Contents
Purpose of This Project
International Journal for Infonomics (IJI), Special Issue Volume 1, Issue 1, 2013
Copyright © 2013, Infonomics Society 863

Chapter 1. Evaluation and Registration of Buildings
Washed Away by the Tsunami
Step 1: Access the URL to login from the screen
Step 2: Display a layer for easy evaluation
Step 3: Evaluate buildings that were washed away
Figure 9. Instruction Manual (image)
Step 4: Complete evaluation or logout without
completing the evaluation
Chapter 2. Search
Step 1: Search by area ID
Step 2: Search by city, cho, or village
Chapter 3. Progress
Step 1: Check the progress by survey area
Chapter 4. Tallying
Step 1: Tally the progress status for each survey area
and building evaluation for each building
Step 2: Display the progress status for each survey
area and building evaluation for each building
The four competencies that are required to carry
out this project are listed in the "Purpose of This
Project" and are based on the instructional design
(ID). ID is a learning theory in psychology and
educational technology, and it refers to the process
that allows the investigators to clearly understand
what they should learn while participating in this
project. Users of the instruction manual said, "it is
easy to understand both the big picture of the project
and each job because my workflow is described in
the order that I perform the tasks over a small
number of pages." The following is the actual
statement in the "Purpose of This Project:"
"Thank you very much for participating in this
project. This is a disaster relief project involving
multiple investigators to evaluate buildings that were
washed away in disaster areas through shared and
cooperative work. We ask that work be performed
according to this manual. This manual is organized
according to the following four competencies that are
required to carry out this project: 1. Evaluate and
register buildings that were washed away by tsunami
(Chapter 1), 2. Search by area (Chapter 2), 3. Check
progress (Chapter 3), 4. Tally and display progress in
each survey area and for each building evaluation
(Chapter 4). In case you have a concern or doubt,
please ask your team leader instead of making your
own judgment. This is important in order to maintain
the quality of the work."
6.5. Instruction manual
232,906 points were covered in 15,066 areas.
There were 25,905 survey areas that were partitioned
by roads. We subtracted 1,795 areas where surveys
could not be conducted because airplanes could not
fly due to the nuclear plant accident and 9,044 areas
where there were no buildings (survey points); thus,
resulting in 15,066 areas.
7. Results of System verification
7.1. Results of concordant analysis
Two investigators belonging to two different
research groups conducted a survey of the same area.
Of the 163,205 points that were evaluated, 90.9%
(148,342 points) were classified into the same
category (either completely washed away or partially
washed away) by the two investigators, and 9.1%
(14,863 points) were evaluated differently-the ratio
of agreement was 90.9%. A Pearson's chi-square test
revealed that the ratio of agreement was statistically
significant at 0.1% (Χ2(1)=109305.7, p<.001).
Another verification from a different viewpoint
(similarity by symmetry) resulted in a Φ coefficient
of 0.82, which means that there was a strong positive
correlation at a significance level of 0.1% (Φ=0.82,
p<.001) (Table 2).
7.2. Lack of data and data accuracy
An important issue to keep in mind is that there
were no aerial views of the areas near the Fukushima
Nuclear Power Plants since airplanes were not
allowed to fly over these areas. Therefore, a survey
using this method was not possible in these areas.
Differences in the precision of the spatial
information lead to discrepancies between the
building information before the earthquake (building
foundation data) and aerial views after the
earthquake. In some instances these data
discrepancies made it difficult to distinguish between
a building that was in fact washed away and a
building that appeared to be washed away.
International Journal for Infonomics (IJI), Special Issue Volume 1, Issue 1, 2013
Copyright © 2013, Infonomics Society 864
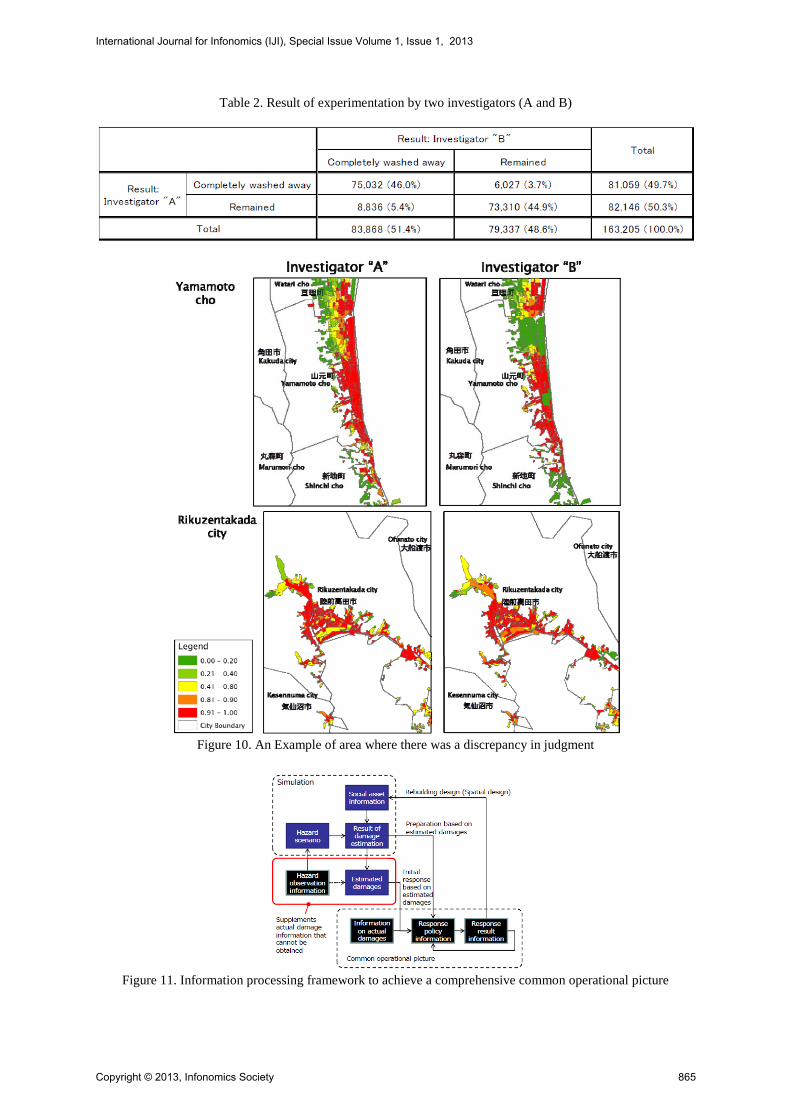
Table 2. Result of experimentation by two investigators (A and B)
Figure 10. An Example of area where there was a discrepancy in judgment
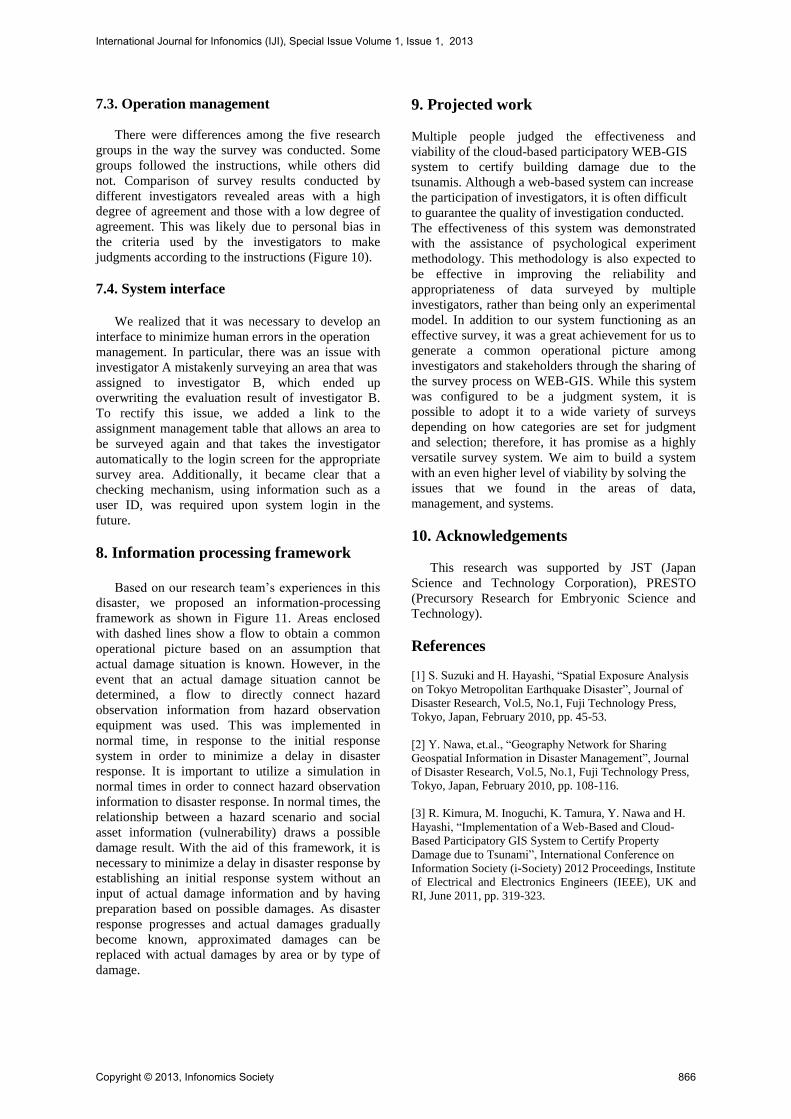
Figure 11. Information processing framework to achieve a comprehensive common operational picture
International Journal for Infonomics (IJI), Special Issue Volume 1, Issue 1, 2013
Copyright © 2013, Infonomics Society 865
7.3. Operation management
There were differences among the five research
groups in the way the survey was conducted. Some
groups followed the instructions, while others did
not. Comparison of survey results conducted by
different investigators revealed areas with a high
degree of agreement and those with a low degree of
agreement. This was likely due to personal bias in
the criteria used by the investigators to make
judgments according to the instructions (Figure 10).
7.4. System interface
We realized that it was necessary to develop an
interface to minimize human errors in the operation
management. In particular, there was an issue with
investigator A mistakenly surveying an area that was
assigned to investigator B, which ended up
overwriting the evaluation result of investigator B.
To rectify this issue, we added a link to the
assignment management table that allows an area to
be surveyed again and that takes the investigator
automatically to the login screen for the appropriate
survey area. Additionally, it became clear that a
checking mechanism, using information such as a
user ID, was required upon system login in the
future.
8. Information processing framework
Based on our research team’s experiences in this
disaster, we proposed an information-processing
framework as shown in Figure 11. Areas enclosed
with dashed lines show a flow to obtain a common
operational picture based on an assumption that
actual damage situation is known. However, in the
event that an actual damage situation cannot be
determined, a flow to directly connect hazard
observation information from hazard observation
equipment was used. This was implemented in
normal time, in response to the initial response
system in order to minimize a delay in disaster
response. It is important to utilize a simulation in
normal times in order to connect hazard observation
information to disaster response. In normal times, the
relationship between a hazard scenario and social
asset information (vulnerability) draws a possible
damage result. With the aid of this framework, it is
necessary to minimize a delay in disaster response by
establishing an initial response system without an
input of actual damage information and by having
preparation based on possible damages. As disaster
response progresses and actual damages gradually
become known, approximated damages can be
replaced with actual damages by area or by type of
damage.
9. Projected work
Multiple people judged the effectiveness and
viability of the cloud-based participatory WEB-GIS
system to certify building damage due to the
tsunamis. Although a web-based system can increase
the participation of investigators, it is often difficult
to guarantee the quality of investigation conducted.
The effectiveness of this system was demonstrated
with the assistance of psychological experiment
methodology. This methodology is also expected to
be effective in improving the reliability and
appropriateness of data surveyed by multiple
investigators, rather than being only an experimental
model. In addition to our system functioning as an
effective survey, it was a great achievement for us to
generate a common operational picture among
investigators and stakeholders through the sharing of
the survey process on WEB-GIS. While this system
was configured to be a judgment system, it is
possible to adopt it to a wide variety of surveys
depending on how categories are set for judgment
and selection; therefore, it has promise as a highly
versatile survey system. We aim to build a system
with an even higher level of viability by solving the
issues that we found in the areas of data,
management, and systems.
10. Acknowledgements
This research was supported by JST (Japan
Science and Technology Corporation), PRESTO
(Precursory Research for Embryonic Science and
Technology).
References
[1] S. Suzuki and H. Hayashi, “Spatial Exposure Analysis
on Tokyo Metropolitan Earthquake Disaster”, Journal of
Disaster Research, Vol.5, No.1, Fuji Technology Press,
Tokyo, Japan, February 2010, pp. 45-53.
[2] Y. Nawa, et.al., “Geography Network for Sharing
Geospatial Information in Disaster Management”, Journal
of Disaster Research, Vol.5, No.1, Fuji Technology Press,
Tokyo, Japan, February 2010, pp. 108-116.
[3] R. Kimura, M. Inoguchi, K. Tamura, Y. Nawa and H.
Hayashi, “Implementation of a Web-Based and Cloud-
Based Participatory GIS System to Certify Property
Damage due to Tsunami”, International Conference on
Information Society (i-Society) 2012 Proceedings, Institute
of Electrical and Electronics Engineers (IEEE), UK and
RI, June 2011, pp. 319-323.
International Journal for Infonomics (IJI), Special Issue Volume 1, Issue 1, 2013
Copyright © 2013, Infonomics Society 866