imperialoverseasequitypool annualfinancialstatements · imperialoverseasequitypool...
TRANSCRIPT
The accompanying notes are an integral part of these financial statements.
Imperial Overseas Equity Pool
Annual Financial Statementsfor the financial year ended December 31, 2016
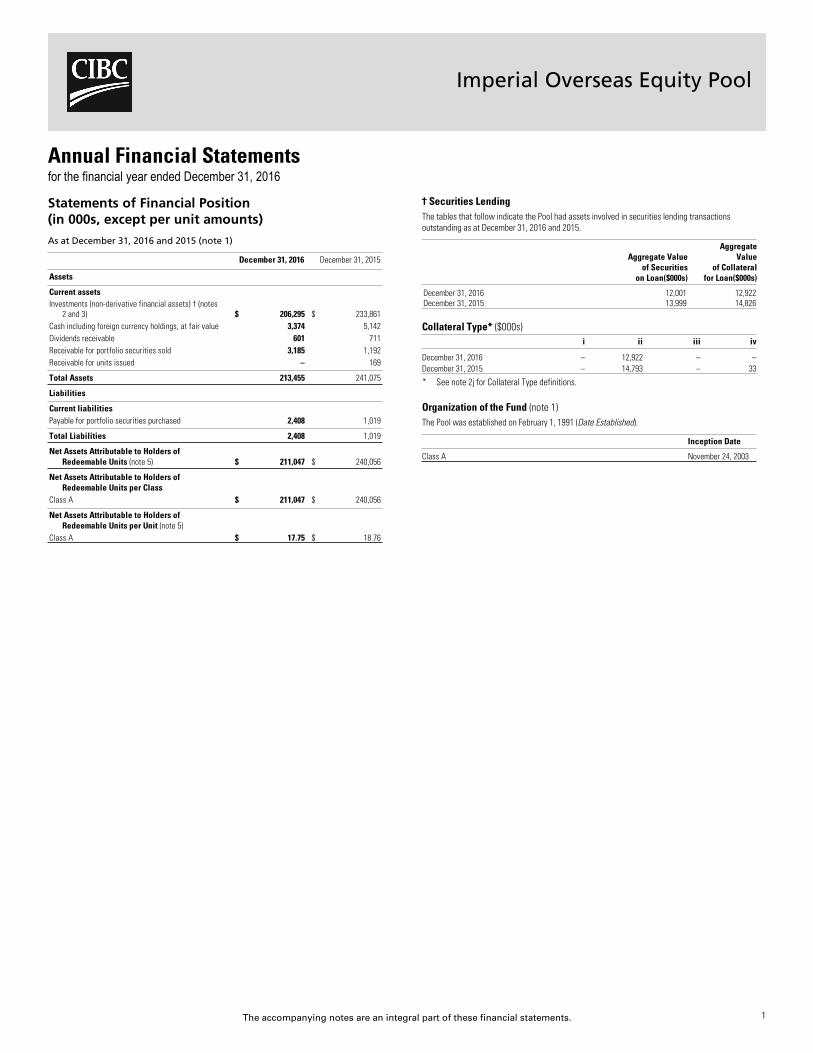
† Securities LendingThe tables that follow indicate the Pool had assets involved in securities lending transactionsoutstanding as at December 31, 2016 and 2015.
Aggregate Valueof Securities
on Loan($000s)
AggregateValue
of Collateralfor Loan($000s)
xx
December 31, 2016 12,001 12,922x
December 31, 2015 13,999 14,826x
Collateral Type* ($000s)i ii iii iv
xx
December 31, 2016 – 12,922 – –x
December 31, 2015 – 14,793 – 33x
x
* See note 2j for Collateral Type definitions.
Organization of the Fund (note 1)The Pool was established on February 1, 1991 (Date Established).
Inception Datexx
Class A November 24, 2003xx
Statements of Financial Position(in 000s, except per unit amounts)
As at December 31, 2016 and 2015 (note 1)
December 31, 2016 December 31, 2015x
xxx
Assetsxxx
Current assetsx
Investments (non-derivative financial assets) † (notes2 and 3) $ 206,295 $ 233,861
x
Cash including foreign currency holdings, at fair value 3,374 5,142x
Dividends receivable 601 711x
Receivable for portfolio securities sold 3,185 1,192x
Receivable for units issued – 169xxx
Total Assets 213,455 241,075xxx
Liabilitiesxxx
Current liabilitiesx
Payable for portfolio securities purchased 2,408 1,019xxx
Total Liabilities 2,408 1,019xxx
Net Assets Attributable to Holders ofRedeemable Units (note 5) $ 211,047 $ 240,056
xxx
Net Assets Attributable to Holders ofRedeemable Units per Class
x
Class A $ 211,047 $ 240,056xxx
Net Assets Attributable to Holders ofRedeemable Units per Unit (note 5)
x
Class A $ 17.75 $ 18.76x
1
The accompanying notes are an integral part of these financial statements.
Imperial Overseas Equity Pool
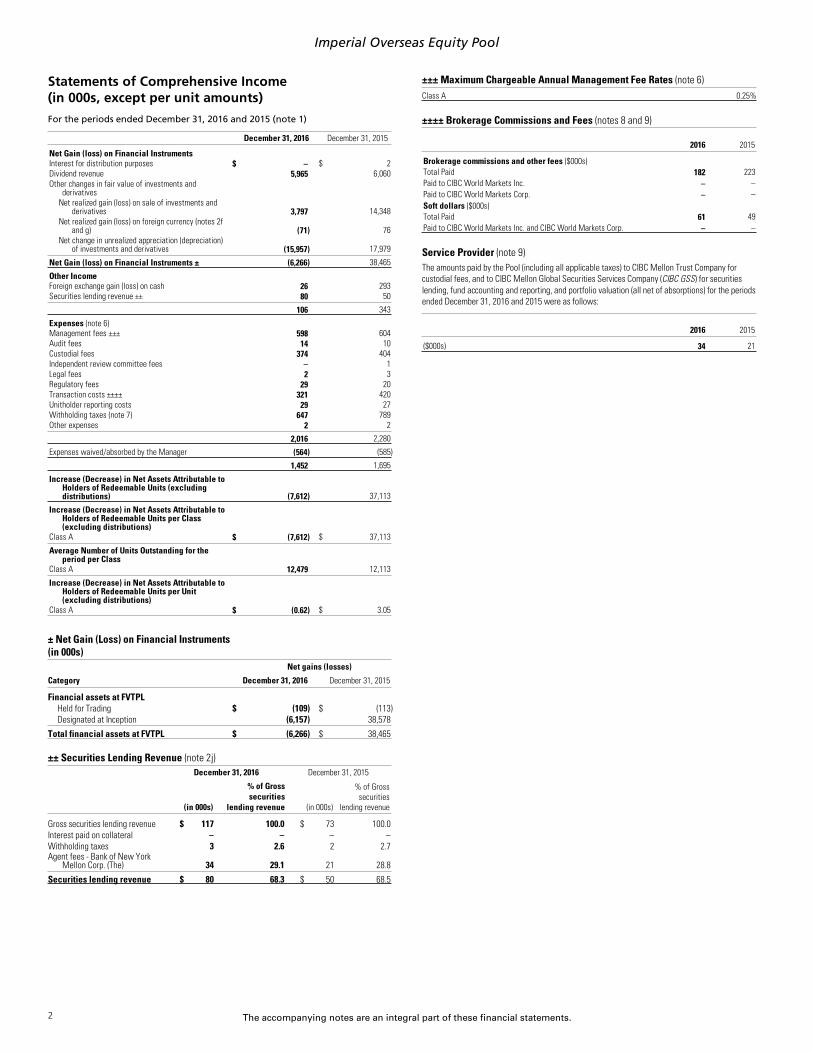
Statements of Comprehensive Income(in 000s, except per unit amounts)
For the periods ended December 31, 2016 and 2015 (note 1)
December 31, 2016 December 31, 2015x
x
Net Gain (loss) on Financial Instrumentsx
Interest for distribution purposes $ – $ 2x
Dividend revenue 5,965 6,060x
Other changes in fair value of investments andderivatives
x
Net realized gain (loss) on sale of investments andderivatives 3,797 14,348
x
Net realized gain (loss) on foreign currency (notes 2fand g) (71) 76
x
Net change in unrealized appreciation (depreciation)of investments and derivatives (15,957) 17,979
xxx
Net Gain (loss) on Financial Instruments ± (6,266) 38,465xx
x
Other Incomex
Foreign exchange gain (loss) on cash 26 293x
Securities lending revenue ±± 80 50xxx
106 343xx
x
Expenses (note 6)x
Management fees ±±± 598 604x
Audit fees 14 10x
Custodial fees 374 404x
Independent review committee fees – 1x
Legal fees 2 3x
Regulatory fees 29 20x
Transaction costs ±±±± 321 420x
Unitholder reporting costs 29 27x
Withholding taxes (note 7) 647 789x
Other expenses 2 2xxx
2,016 2,280xx
x
Expenses waived/absorbed by the Manager (564) (585)xx
x
1,452 1,695xx
x
Increase (Decrease) in Net Assets Attributable toHolders of Redeemable Units (excludingdistributions) (7,612) 37,113
xx
x
Increase (Decrease) in Net Assets Attributable toHolders of Redeemable Units per Class(excluding distributions)
x
Class A $ (7,612) $ 37,113xxx
Average Number of Units Outstanding for theperiod per Class
x
Class A 12,479 12,113xxx
Increase (Decrease) in Net Assets Attributable toHolders of Redeemable Units per Unit(excluding distributions)
x
Class A $ (0.62) $ 3.05x
x
± Net Gain (Loss) on Financial Instruments(in 000s)
Net gains (losses)
Category December 31, 2016 December 31, 2015x..
Financial assets at FVTPL..
Held for Trading $ (109) $ (113)..
Designated at Inception (6,157) 38,578......
Total financial assets at FVTPL $ (6,266) $ 38,465..
±± Securities Lending Revenue (note 2j)December 31, 2016 December 31, 2015
(in 000s)
% of Grosssecurities
lending revenue (in 000s)
% of Grosssecurities
lending revenuexx
Gross securities lending revenue $ 117 100.0 $ 73 100.0x
Interest paid on collateral – – – –x
Withholding taxes 3 2.6 2 2.7x
Agent fees - Bank of New YorkMellon Corp. (The) 34 29.1 21 28.8
xxx
Securities lending revenue $ 80 68.3 $ 50 68.5xx
±±± Maximum Chargeable Annual Management Fee Rates (note 6)xx
Class A 0.25%xx
±±±± Brokerage Commissions and Fees (notes 8 and 9)
2016 2015x
x
Brokerage commissions and other fees ($000s)x
Total Paid 182 223x
Paid to CIBC World Markets Inc. – –x
Paid to CIBC World Markets Corp. – –x
Soft dollars ($000s)x
Total Paid 61 49x
Paid to CIBC World Markets Inc. and CIBC World Markets Corp. – –xx
Service Provider (note 9)The amounts paid by the Pool (including all applicable taxes) to CIBC Mellon Trust Company forcustodial fees, and to CIBC Mellon Global Securities Services Company (CIBC GSS) for securitieslending, fund accounting and reporting, and portfolio valuation (all net of absorptions) for the periodsended December 31, 2016 and 2015 were as follows:
2016 2015x
x
($000s) 34 21xx
2
The accompanying notes are an integral part of these financial statements.
Imperial Overseas Equity Poolx
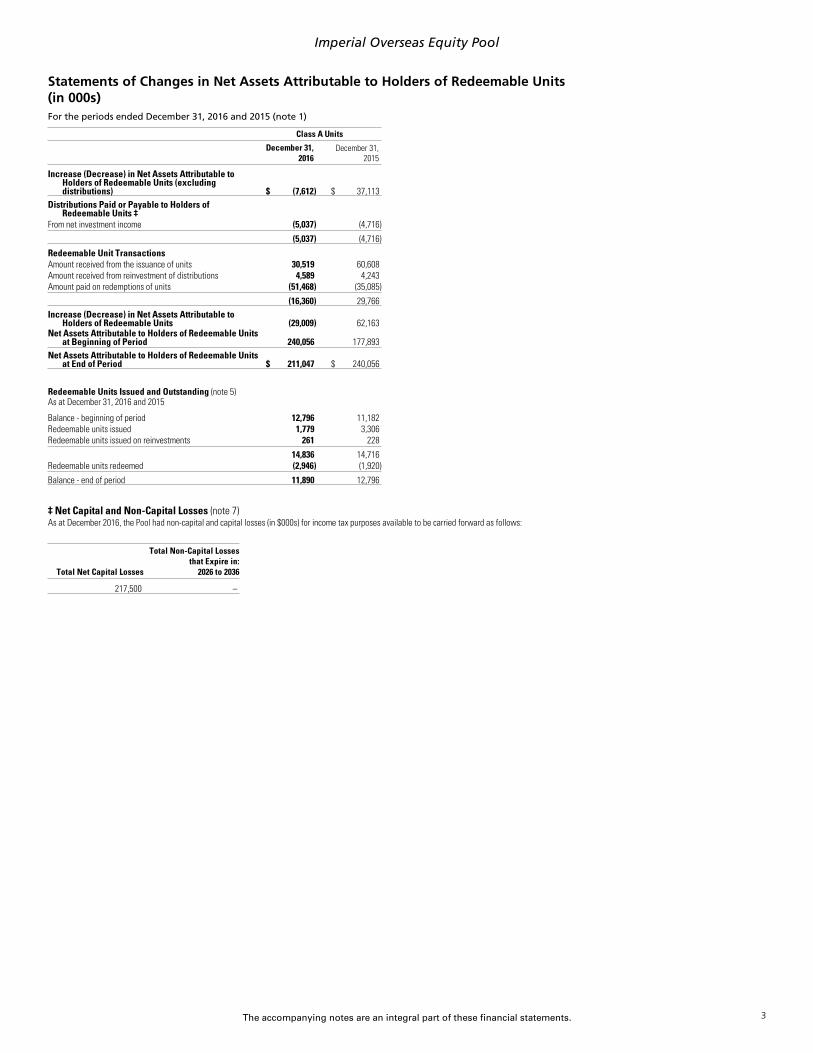
Statements of Changes in Net Assets Attributable to Holders of Redeemable Units(in 000s)For the periods ended December 31, 2016 and 2015 (note 1)
Class A Units
December 31,2016
December 31,2015
xx.
Increase (Decrease) in Net Assets Attributable toHolders of Redeemable Units (excludingdistributions) $ (7,612) $ 37,113
xxx.
Distributions Paid or Payable to Holders ofRedeemable Units ‡
x.
From net investment income (5,037) (4,716)x.xx
(5,037) (4,716)xxx.
Redeemable Unit Transactionsx.
Amount received from the issuance of units 30,519 60,608x.
Amount received from reinvestment of distributions 4,589 4,243x.
Amount paid on redemptions of units (51,468) (35,085)x.xx
(16,360) 29,766xxx.
Increase (Decrease) in Net Assets Attributable toHolders of Redeemable Units (29,009) 62,163
x.
Net Assets Attributable to Holders of Redeemable Unitsat Beginning of Period 240,056 177,893
x.xx
Net Assets Attributable to Holders of Redeemable Unitsat End of Period $ 211,047 $ 240,056
xxx.
Redeemable Units Issued and Outstanding (note 5)x.
As at December 31, 2016 and 2015x.
Balance - beginning of period 12,796 11,182x.
Redeemable units issued 1,779 3,306x.
Redeemable units issued on reinvestments 261 228x.xx
14,836 14,716x.
Redeemable units redeemed (2,946) (1,920)x.xx
Balance - end of period 11,890 12,796xx
x
‡ Net Capital and Non-Capital Losses (note 7)As at December 2016, the Pool had non-capital and capital losses (in $000s) for income tax purposes available to be carried forward as follows:
Total Net Capital Losses
Total Non-Capital Lossesthat Expire in:
2026 to 2036x..
217,500 –.
.
3
The accompanying notes are an integral part of these financial statements.
Imperial Overseas Equity Poolx
x
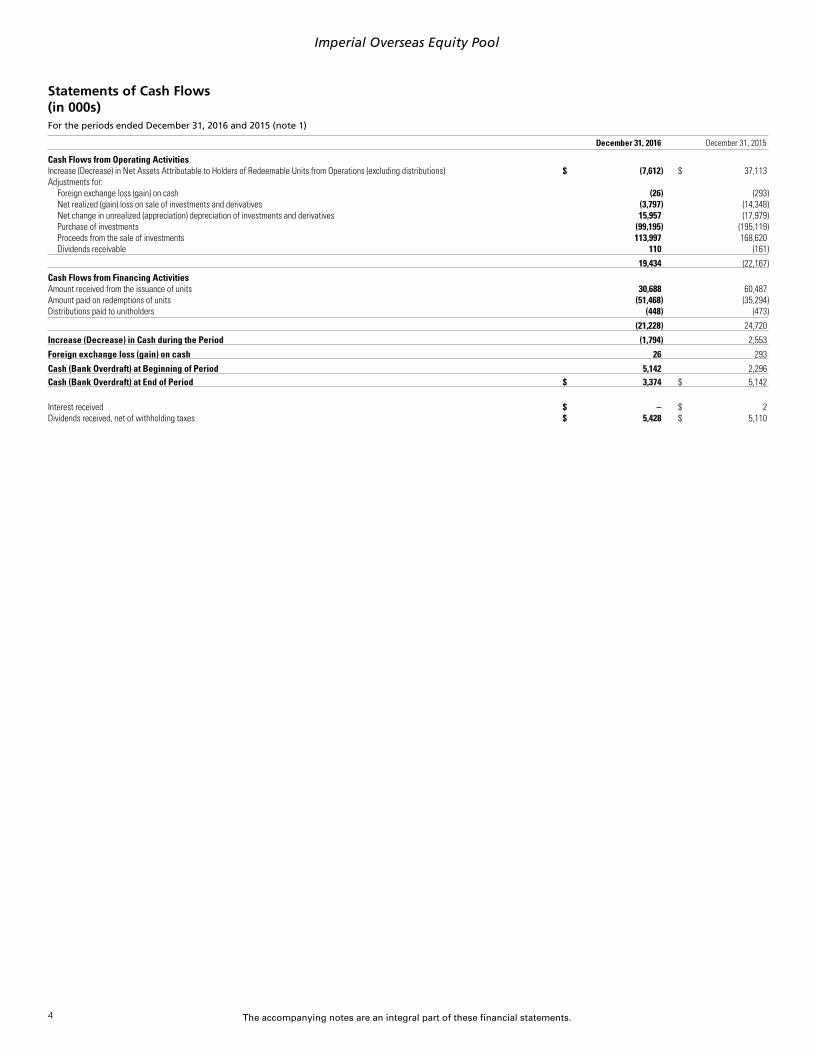
Statements of Cash Flows(in 000s)For the periods ended December 31, 2016 and 2015 (note 1)
December 31, 2016 December 31, 2015xx.
Cash Flows from Operating Activitiesx.
Increase (Decrease) in Net Assets Attributable to Holders of Redeemable Units from Operations (excluding distributions) $ (7,612) $ 37,113x.
Adjustments for:x.
Foreign exchange loss (gain) on cash (26) (293)x.
Net realized (gain) loss on sale of investments and derivatives (3,797) (14,348)x.
Net change in unrealized (appreciation) depreciation of investments and derivatives 15,957 (17,979)x.
Purchase of investments (99,195) (195,119)x.
Proceeds from the sale of investments 113,997 168,620x.
Dividends receivable 110 (161)x.xx
19,434 (22,167)xxx.
Cash Flows from Financing Activitiesx.
Amount received from the issuance of units 30,688 60,487x.
Amount paid on redemptions of units (51,468) (35,294)x.
Distributions paid to unitholders (448) (473)x.xx
(21,228) 24,720xxx.
Increase (Decrease) in Cash during the Period (1,794) 2,553xxx.
Foreign exchange loss (gain) on cash 26 293xxx.
Cash (Bank Overdraft) at Beginning of Period 5,142 2,296xxx.
Cash (Bank Overdraft) at End of Period $ 3,374 $ 5,142x
x.
Interest received $ – $ 2x.
Dividends received, net of withholding taxes $ 5,428 $ 5,110
4
The accompanying notes are an integral part of these financial statements.
Imperial Overseas Equity Pool
x
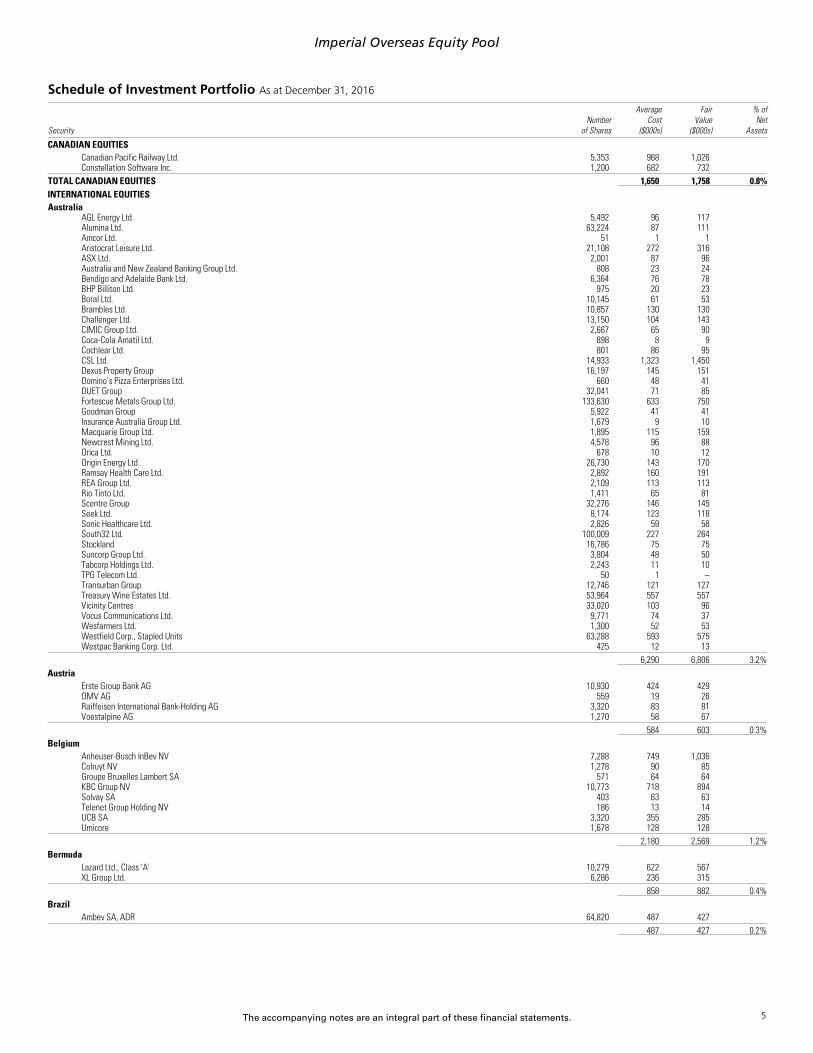
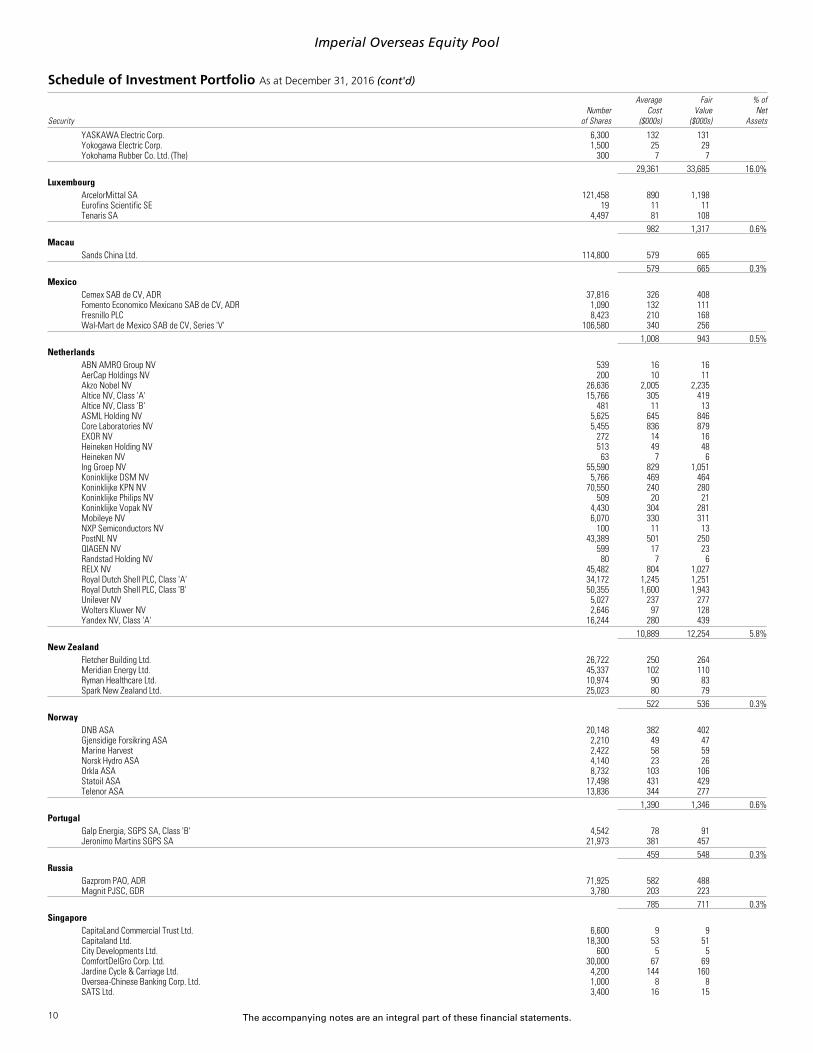
Schedule of Investment Portfolio As at December 31, 2016
SecurityNumber
of Shares
AverageCost
($000s)
FairValue
($000s)
% ofNet
Assetsx
CANADIAN EQUITIES..
Canadian Pacific Railway Ltd. 5,353 968 1,026..
Constellation Software Inc. 1,200 682 732..
....
TOTAL CANADIAN EQUITIES 1,650 1,758 0.8%..x
INTERNATIONAL EQUITIES..
Australia..
AGL Energy Ltd. 5,492 96 117..
Alumina Ltd. 63,224 87 111..
Amcor Ltd. 51 1 1..
Aristocrat Leisure Ltd. 21,108 272 316..
ASX Ltd. 2,001 87 96..
Australia and New Zealand Banking Group Ltd. 808 23 24..
Bendigo and Adelaide Bank Ltd. 6,364 76 78..
BHP Billiton Ltd. 975 20 23..
Boral Ltd. 10,145 61 53..
Brambles Ltd. 10,857 130 130..
Challenger Ltd. 13,150 104 143..
CIMIC Group Ltd. 2,667 65 90..
Coca-Cola Amatil Ltd. 898 8 9..
Cochlear Ltd. 801 86 95..
CSL Ltd. 14,933 1,323 1,450..
Dexus Property Group 16,197 145 151..
Domino's Pizza Enterprises Ltd. 660 48 41..
DUET Group 32,041 71 85..
Fortescue Metals Group Ltd. 133,630 633 750..
Goodman Group 5,922 41 41..
Insurance Australia Group Ltd. 1,679 9 10..
Macquarie Group Ltd. 1,895 115 159..
Newcrest Mining Ltd. 4,578 96 88..
Orica Ltd. 678 10 12..
Origin Energy Ltd. 26,730 143 170..
Ramsay Health Care Ltd. 2,892 160 191..
REA Group Ltd. 2,109 113 113..
Rio Tinto Ltd. 1,411 65 81..
Scentre Group 32,276 146 145..
Seek Ltd. 8,174 123 118..
Sonic Healthcare Ltd. 2,826 59 58..
South32 Ltd. 100,009 227 264..
Stockland 16,786 75 75..
Suncorp Group Ltd. 3,804 48 50..
Tabcorp Holdings Ltd. 2,243 11 10..
TPG Telecom Ltd. 50 1 –..
Transurban Group 12,746 121 127..
Treasury Wine Estates Ltd. 53,964 557 557..
Vicinity Centres 33,020 103 96..
Vocus Communications Ltd. 9,771 74 37..
Wesfarmers Ltd. 1,300 52 53..
Westfield Corp., Stapled Units 63,288 593 575..
Westpac Banking Corp. Ltd. 425 12 13..
....
6,290 6,806 3.2%..x
Austria..
Erste Group Bank AG 10,930 424 429..
OMV AG 559 19 26..
Raiffeisen International Bank-Holding AG 3,320 83 81..
Voestalpine AG 1,270 58 67..
....
584 603 0.3%..x
Belgium..
Anheuser-Busch InBev NV 7,288 749 1,036..
Colruyt NV 1,278 90 85..
Groupe Bruxelles Lambert SA 571 64 64..
KBC Group NV 10,773 718 894..
Solvay SA 403 63 63..
Telenet Group Holding NV 186 13 14..
UCB SA 3,320 355 285..
Umicore 1,678 128 128..
....
2,180 2,569 1.2%..x
Bermuda..
Lazard Ltd., Class 'A' 10,279 622 567..
XL Group Ltd. 6,286 236 315..
....
858 882 0.4%..x
Brazil..
Ambev SA, ADR 64,820 487 427..
....
487 427 0.2%..
5

The accompanying notes are an integral part of these financial statements.
Imperial Overseas Equity Pool
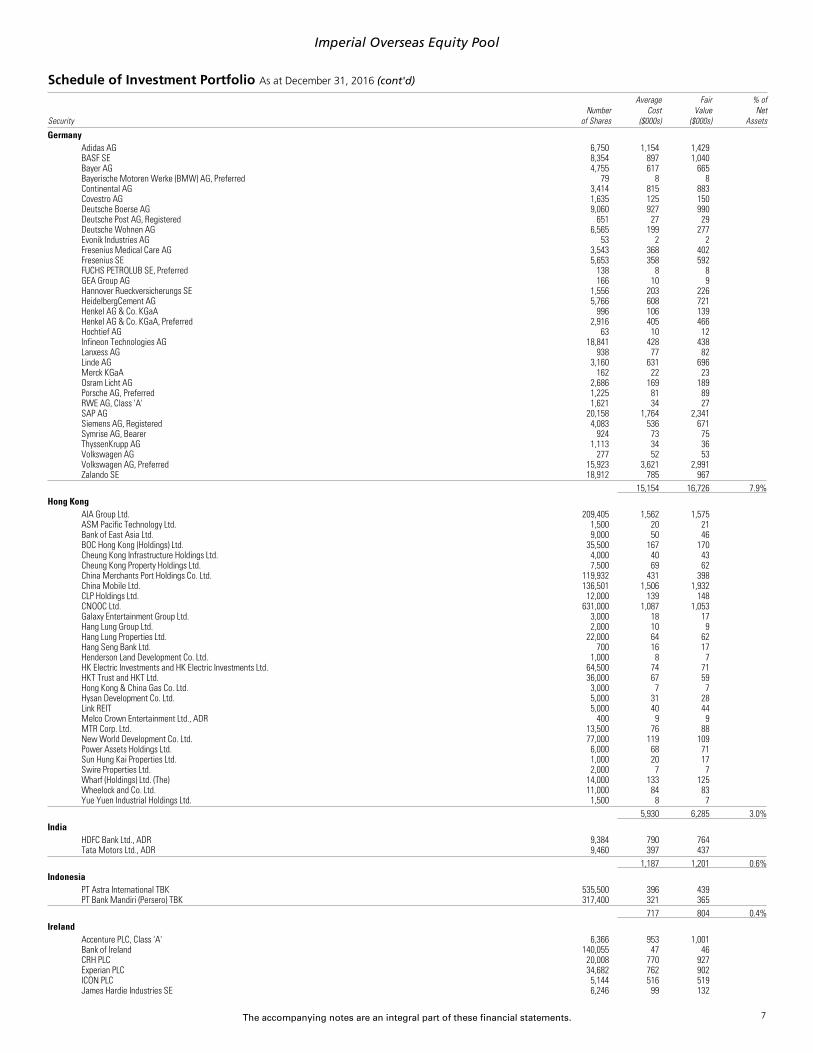
Schedule of Investment Portfolio As at December 31, 2016 (cont'd)
SecurityNumber
of Shares
AverageCost
($000s)
FairValue
($000s)
% ofNet
Assetsx
China..
Alibaba Group Holding Ltd. 4,940 521 582..
Baidu Inc., ADR 5,804 1,251 1,281..
China Shenhua Energy Co. Ltd. 55,000 110 138..
Ctrip.com International Ltd., ADR 10,441 596 561..
Lenovo Group Ltd. 212,000 185 172..
Tencent Holdings Ltd. 44,755 824 1,457..
....
3,487 4,191 2.0%..x
Denmark..
A.P. Moller - Maersk AS, Class 'B' 90 192 193..
Christian Hansen Holdings AS 8,025 550 596..
Coloplast AS, Class 'B' 8,054 741 728..
Danske Bank AS 7,875 249 320..
DSV AS 8,189 458 488..
Genmab AS, Bearer 430 93 96..
ISS AS 1,599 84 72..
Novo Nordisk AS, Series 'B' 13,192 601 635..
Novozymes AS, Class 'B' 12,470 729 576..
Pandora AS 3,256 329 571..
Tryg AS 327 8 8..
Vestas Wind Systems AS 1,038 71 90..
William Demant Holding AS 3,846 97 90..
....
4,202 4,463 2.1%..x
Finland..
Elisa OYJ 4,479 172 195..
Fortum OYJ 5,645 116 116..
Kone OYJ, Class 'B' 315 19 19..
Metso OYJ 1,438 52 55..
Neste Oil OYJ 3,786 132 194..
Orion OYJ, Class 'B' 169 9 10..
Sampo OYJ, Series 'A' 3,859 210 232..
Stora Enso OYJ, Series 'R' 11,617 148 167..
UPM-Kymmene Corp. OYJ 2,051 51 67..
Wärtsilä OYJ, Series 'B' 5,740 340 346..
....
1,249 1,401 0.7%..x
France..
Accor SA 5,494 333 275..
Alstom SA 349 13 13..
Arkema 4,498 454 590..
Atos SE 331 36 47..
BNP Paribas SA 18,773 1,338 1,604..
Bouygues SA 14,550 612 699..
Christian Dior SA 33 9 9..
CNP Assurances 1,589 34 40..
Compagnie de Saint-Gobain SA 1,865 109 116..
Compagnie Générale des Établissements Michelin, Series 'B',Registered 211 29 32
..
Crédit Agricole SA 35,307 549 587..
Criteo SA, ADR 5,609 313 309..
Danone 3,050 304 259..
Dassault Systèmes SA 446 31 46..
Edenred 2,692 72 72..
Engie 88,018 1,922 1,504..
Essilor International SA 8,706 1,293 1,319..
Faurecia 7,820 352 407..
Fonciere des Regions 209 26 24..
Gecina SA 416 83 77..
Hermes International 1,193 561 657..
Kering 2,265 546 682..
Legrand SA 3,124 161 238..
L'Oréal SA 1,585 377 388..
LVMH Moët Hennessy-Louis Vuitton SA 2,985 636 764..
Natixis SA 25,305 181 191..
Publicis Groupe 13,225 1,182 1,224..
Rémy Cointreau SA 462 51 53..
Rexel SA 18,323 359 404..
Safran SA 4,681 423 452..
Sanofi SA 13,268 1,288 1,441..
Schneider Electric SE 27,964 2,475 2,608..
SEB SA 45 8 8..
Societe BIC SA 804 153 147..
Sodexho Alliance SA 601 85 93..
Technip SA 532 40 51..
Thales SA 4,941 532 643..
Total SA 40,571 2,524 2,794..
Valeo SA 9,272 555 715..
Vallourec SA 52,493 881 484..
Vinci SA 1,259 113 115..
Vivendi SA 19,220 474 489..
Wendel SA 708 113 114..
....
21,630 22,784 10.8%..
6
The accompanying notes are an integral part of these financial statements.
Imperial Overseas Equity Pool
Schedule of Investment Portfolio As at December 31, 2016 (cont'd)
SecurityNumber
of Shares
AverageCost
($000s)
FairValue
($000s)
% ofNet
Assetsx
Germany..
Adidas AG 6,750 1,154 1,429..
BASF SE 8,354 897 1,040..
Bayer AG 4,755 617 665..
Bayerische Motoren Werke (BMW) AG, Preferred 79 8 8..
Continental AG 3,414 815 883..
Covestro AG 1,635 125 150..
Deutsche Boerse AG 9,060 927 990..
Deutsche Post AG, Registered 651 27 29..
Deutsche Wohnen AG 6,565 199 277..
Evonik Industries AG 53 2 2..
Fresenius Medical Care AG 3,543 368 402..
Fresenius SE 5,653 358 592..
FUCHS PETROLUB SE, Preferred 138 8 8..
GEA Group AG 166 10 9..
Hannover Rueckversicherungs SE 1,556 203 226..
HeidelbergCement AG 5,766 608 721..
Henkel AG & Co. KGaA 996 106 139..
Henkel AG & Co. KGaA, Preferred 2,916 405 466..
Hochtief AG 63 10 12..
Infineon Technologies AG 18,841 428 438..
Lanxess AG 938 77 82..
Linde AG 3,160 631 696..
Merck KGaA 162 22 23..
Osram Licht AG 2,686 169 189..
Porsche AG, Preferred 1,225 81 89..
RWE AG, Class 'A' 1,621 34 27..
SAP AG 20,158 1,764 2,341..
Siemens AG, Registered 4,083 536 671..
Symrise AG, Bearer 924 73 75..
ThyssenKrupp AG 1,113 34 36..
Volkswagen AG 277 52 53..
Volkswagen AG, Preferred 15,923 3,621 2,991..
Zalando SE 18,912 785 967..
....
15,154 16,726 7.9%..x
Hong Kong..
AIA Group Ltd. 209,405 1,562 1,575..
ASM Pacific Technology Ltd. 1,500 20 21..
Bank of East Asia Ltd. 9,000 50 46..
BOC Hong Kong (Holdings) Ltd. 35,500 167 170..
Cheung Kong Infrastructure Holdings Ltd. 4,000 40 43..
Cheung Kong Property Holdings Ltd. 7,500 69 62..
China Merchants Port Holdings Co. Ltd. 119,932 431 398..
China Mobile Ltd. 136,501 1,506 1,932..
CLP Holdings Ltd. 12,000 139 148..
CNOOC Ltd. 631,000 1,087 1,053..
Galaxy Entertainment Group Ltd. 3,000 18 17..
Hang Lung Group Ltd. 2,000 10 9..
Hang Lung Properties Ltd. 22,000 64 62..
Hang Seng Bank Ltd. 700 16 17..
Henderson Land Development Co. Ltd. 1,000 8 7..
HK Electric Investments and HK Electric Investments Ltd. 64,500 74 71..
HKT Trust and HKT Ltd. 36,000 67 59..
Hong Kong & China Gas Co. Ltd. 3,000 7 7..
Hysan Development Co. Ltd. 5,000 31 28..
Link REIT 5,000 40 44..
Melco Crown Entertainment Ltd., ADR 400 9 9..
MTR Corp. Ltd. 13,500 76 88..
New World Development Co. Ltd. 77,000 119 109..
Power Assets Holdings Ltd. 6,000 68 71..
Sun Hung Kai Properties Ltd. 1,000 20 17..
Swire Properties Ltd. 2,000 7 7..
Wharf (Holdings) Ltd. (The) 14,000 133 125..
Wheelock and Co. Ltd. 11,000 84 83..
Yue Yuen Industrial Holdings Ltd. 1,500 8 7..
....
5,930 6,285 3.0%..x
India..
HDFC Bank Ltd., ADR 9,384 790 764..
Tata Motors Ltd., ADR 9,460 397 437..
....
1,187 1,201 0.6%..x
Indonesia..
PT Astra International TBK 535,500 396 439..
PT Bank Mandiri (Persero) TBK 317,400 321 365..
....
717 804 0.4%..x
Ireland..
Accenture PLC, Class 'A' 6,366 953 1,001..
Bank of Ireland 140,055 47 46..
CRH PLC 20,008 770 927..
Experian PLC 34,682 762 902..
ICON PLC 5,144 516 519..
James Hardie Industries SE 6,246 99 132
7
The accompanying notes are an integral part of these financial statements.
Imperial Overseas Equity Pool
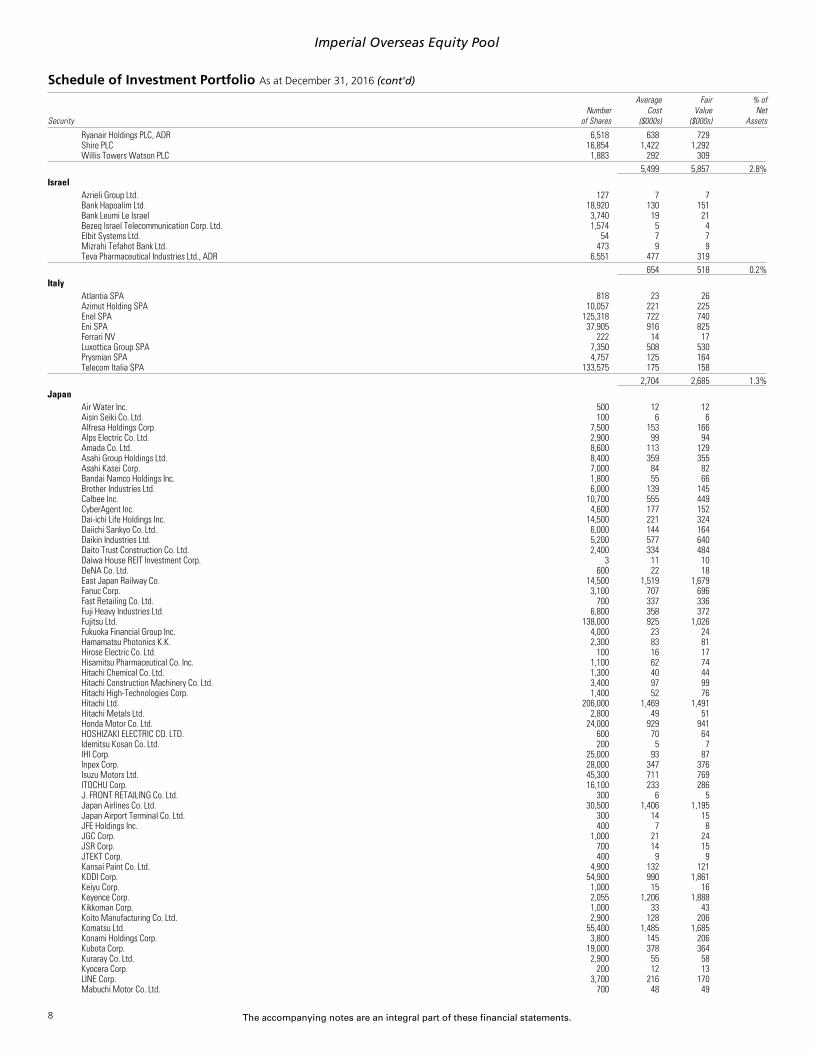
Schedule of Investment Portfolio As at December 31, 2016 (cont'd)
SecurityNumber
of Shares
AverageCost
($000s)
FairValue
($000s)
% ofNet
Assets..
Ryanair Holdings PLC, ADR 6,518 638 729..
Shire PLC 16,854 1,422 1,292..
Willis Towers Watson PLC 1,883 292 309..
....
5,499 5,857 2.8%..x
Israel..
Azrieli Group Ltd. 127 7 7..
Bank Hapoalim Ltd. 18,920 130 151..
Bank Leumi Le Israel 3,740 19 21..
Bezeq Israel Telecommunication Corp. Ltd. 1,574 5 4..
Elbit Systems Ltd. 54 7 7..
Mizrahi Tefahot Bank Ltd. 473 9 9..
Teva Pharmaceutical Industries Ltd., ADR 6,551 477 319..
....
654 518 0.2%..x
Italy..
Atlantia SPA 818 23 26..
Azimut Holding SPA 10,057 221 225..
Enel SPA 125,318 722 740..
Eni SPA 37,905 916 825..
Ferrari NV 222 14 17..
Luxottica Group SPA 7,350 508 530..
Prysmian SPA 4,757 125 164..
Telecom Italia SPA 133,575 175 158..
....
2,704 2,685 1.3%..x
Japan..
Air Water Inc. 500 12 12..
Aisin Seiki Co. Ltd. 100 6 6..
Alfresa Holdings Corp. 7,500 153 166..
Alps Electric Co. Ltd. 2,900 99 94..
Amada Co. Ltd. 8,600 113 129..
Asahi Group Holdings Ltd. 8,400 359 355..
Asahi Kasei Corp. 7,000 84 82..
Bandai Namco Holdings Inc. 1,800 55 66..
Brother Industries Ltd. 6,000 139 145..
Calbee Inc. 10,700 555 449..
CyberAgent Inc. 4,600 177 152..
Dai-ichi Life Holdings Inc. 14,500 221 324..
Daiichi Sankyo Co. Ltd. 6,000 144 164..
Daikin Industries Ltd. 5,200 577 640..
Daito Trust Construction Co. Ltd. 2,400 334 484..
Daiwa House REIT Investment Corp. 3 11 10..
DeNA Co. Ltd. 600 22 18..
East Japan Railway Co. 14,500 1,519 1,679..
Fanuc Corp. 3,100 707 696..
Fast Retailing Co. Ltd. 700 337 336..
Fuji Heavy Industries Ltd. 6,800 358 372..
Fujitsu Ltd. 138,000 925 1,026..
Fukuoka Financial Group Inc. 4,000 23 24..
Hamamatsu Photonics K.K. 2,300 83 81..
Hirose Electric Co. Ltd. 100 16 17..
Hisamitsu Pharmaceutical Co. Inc. 1,100 62 74..
Hitachi Chemical Co. Ltd. 1,300 40 44..
Hitachi Construction Machinery Co. Ltd. 3,400 97 99..
Hitachi High-Technologies Corp. 1,400 52 76..
Hitachi Ltd. 206,000 1,469 1,491..
Hitachi Metals Ltd. 2,800 49 51..
Honda Motor Co. Ltd. 24,000 929 941..
HOSHIZAKI ELECTRIC CO. LTD. 600 70 64..
Idemitsu Kosan Co. Ltd. 200 5 7..
IHI Corp. 25,000 93 87..
Inpex Corp. 28,000 347 376..
Isuzu Motors Ltd. 45,300 711 769..
ITOCHU Corp. 16,100 233 286..
J. FRONT RETAILING Co. Ltd. 300 6 5..
Japan Airlines Co. Ltd. 30,500 1,406 1,195..
Japan Airport Terminal Co. Ltd. 300 14 15..
JFE Holdings Inc. 400 7 8..
JGC Corp. 1,000 21 24..
JSR Corp. 700 14 15..
JTEKT Corp. 400 9 9..
Kansai Paint Co. Ltd. 4,900 132 121..
KDDI Corp. 54,900 990 1,861..
Keiyu Corp. 1,000 15 16..
Keyence Corp. 2,055 1,206 1,888..
Kikkoman Corp. 1,000 33 43..
Koito Manufacturing Co. Ltd. 2,900 128 206..
Komatsu Ltd. 55,400 1,485 1,685..
Konami Holdings Corp. 3,800 145 206..
Kubota Corp. 19,000 378 364..
Kuraray Co. Ltd. 2,900 55 58..
Kyocera Corp. 200 12 13..
LINE Corp. 3,700 216 170..
Mabuchi Motor Co. Ltd. 700 48 49
8
The accompanying notes are an integral part of these financial statements.
Imperial Overseas Equity Pool
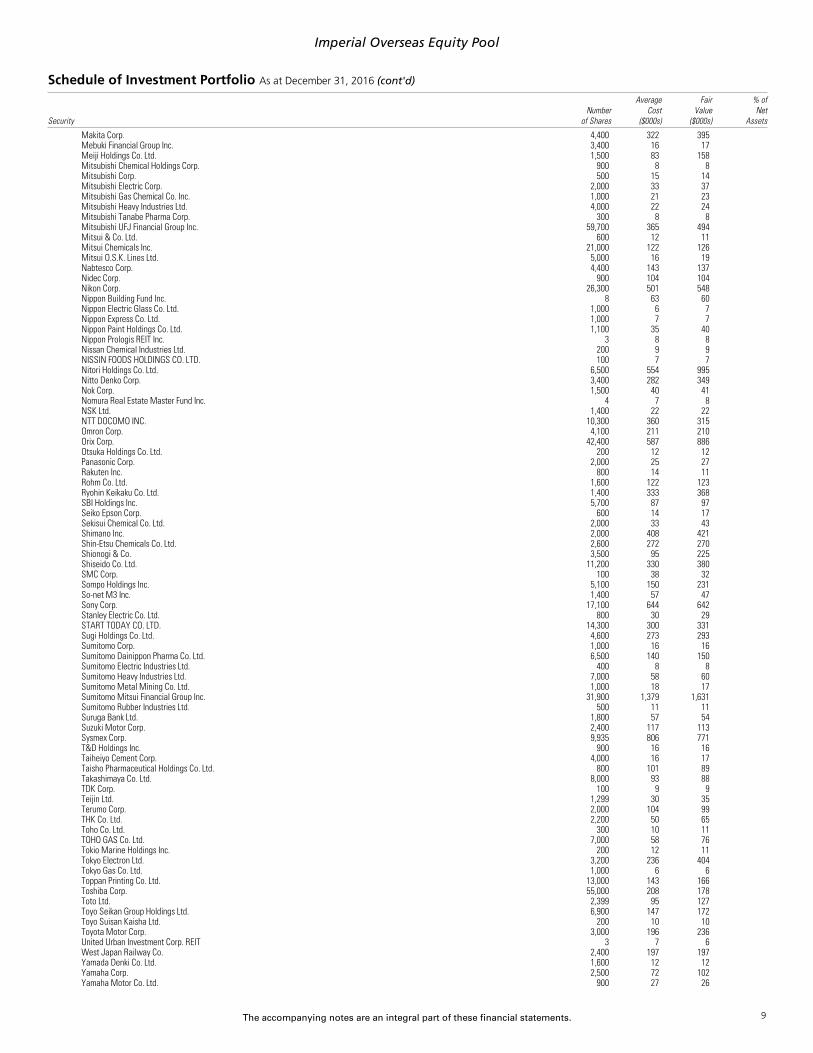
Schedule of Investment Portfolio As at December 31, 2016 (cont'd)
SecurityNumber
of Shares
AverageCost
($000s)
FairValue
($000s)
% ofNet
Assets..
Makita Corp. 4,400 322 395..
Mebuki Financial Group Inc. 3,400 16 17..
Meiji Holdings Co. Ltd. 1,500 83 158..
Mitsubishi Chemical Holdings Corp. 900 8 8..
Mitsubishi Corp. 500 15 14..
Mitsubishi Electric Corp. 2,000 33 37..
Mitsubishi Gas Chemical Co. Inc. 1,000 21 23..
Mitsubishi Heavy Industries Ltd. 4,000 22 24..
Mitsubishi Tanabe Pharma Corp. 300 8 8..
Mitsubishi UFJ Financial Group Inc. 59,700 365 494..
Mitsui & Co. Ltd. 600 12 11..
Mitsui Chemicals Inc. 21,000 122 126..
Mitsui O.S.K. Lines Ltd. 5,000 16 19..
Nabtesco Corp. 4,400 143 137..
Nidec Corp. 900 104 104..
Nikon Corp. 26,300 501 548..
Nippon Building Fund Inc. 8 63 60..
Nippon Electric Glass Co. Ltd. 1,000 6 7..
Nippon Express Co. Ltd. 1,000 7 7..
Nippon Paint Holdings Co. Ltd. 1,100 35 40..
Nippon Prologis REIT Inc. 3 8 8..
Nissan Chemical Industries Ltd. 200 9 9..
NISSIN FOODS HOLDINGS CO. LTD. 100 7 7..
Nitori Holdings Co. Ltd. 6,500 554 995..
Nitto Denko Corp. 3,400 282 349..
Nok Corp. 1,500 40 41..
Nomura Real Estate Master Fund Inc. 4 7 8..
NSK Ltd. 1,400 22 22..
NTT DOCOMO INC. 10,300 360 315..
Omron Corp. 4,100 211 210..
Orix Corp. 42,400 587 886..
Otsuka Holdings Co. Ltd. 200 12 12..
Panasonic Corp. 2,000 25 27..
Rakuten Inc. 800 14 11..
Rohm Co. Ltd. 1,600 122 123..
Ryohin Keikaku Co. Ltd. 1,400 333 368..
SBI Holdings Inc. 5,700 87 97..
Seiko Epson Corp. 600 14 17..
Sekisui Chemical Co. Ltd. 2,000 33 43..
Shimano Inc. 2,000 408 421..
Shin-Etsu Chemicals Co. Ltd. 2,600 272 270..
Shionogi & Co. 3,500 95 225..
Shiseido Co. Ltd. 11,200 330 380..
SMC Corp. 100 38 32..
Sompo Holdings Inc. 5,100 150 231..
So-net M3 Inc. 1,400 57 47..
Sony Corp. 17,100 644 642..
Stanley Electric Co. Ltd. 800 30 29..
START TODAY CO. LTD. 14,300 300 331..
Sugi Holdings Co. Ltd. 4,600 273 293..
Sumitomo Corp. 1,000 16 16..
Sumitomo Dainippon Pharma Co. Ltd. 6,500 140 150..
Sumitomo Electric Industries Ltd. 400 8 8..
Sumitomo Heavy Industries Ltd. 7,000 58 60..
Sumitomo Metal Mining Co. Ltd. 1,000 18 17..
Sumitomo Mitsui Financial Group Inc. 31,900 1,379 1,631..
Sumitomo Rubber Industries Ltd. 500 11 11..
Suruga Bank Ltd. 1,800 57 54..
Suzuki Motor Corp. 2,400 117 113..
Sysmex Corp. 9,935 806 771..
T&D Holdings Inc. 900 16 16..
Taiheiyo Cement Corp. 4,000 16 17..
Taisho Pharmaceutical Holdings Co. Ltd. 800 101 89..
Takashimaya Co. Ltd. 8,000 93 88..
TDK Corp. 100 9 9..
Teijin Ltd. 1,299 30 35..
Terumo Corp. 2,000 104 99..
THK Co. Ltd. 2,200 50 65..
Toho Co. Ltd. 300 10 11..
TOHO GAS Co. Ltd. 7,000 58 76..
Tokio Marine Holdings Inc. 200 12 11..
Tokyo Electron Ltd. 3,200 236 404..
Tokyo Gas Co. Ltd. 1,000 6 6..
Toppan Printing Co. Ltd. 13,000 143 166..
Toshiba Corp. 55,000 208 178..
Toto Ltd. 2,399 95 127..
Toyo Seikan Group Holdings Ltd. 6,900 147 172..
Toyo Suisan Kaisha Ltd. 200 10 10..
Toyota Motor Corp. 3,000 196 236..
United Urban Investment Corp. REIT 3 7 6..
West Japan Railway Co. 2,400 197 197..
Yamada Denki Co. Ltd. 1,600 12 12..
Yamaha Corp. 2,500 72 102..
Yamaha Motor Co. Ltd. 900 27 26
9
The accompanying notes are an integral part of these financial statements.
Imperial Overseas Equity Pool
Schedule of Investment Portfolio As at December 31, 2016 (cont'd)
SecurityNumber
of Shares
AverageCost
($000s)
FairValue
($000s)
% ofNet
Assets..
YASKAWA Electric Corp. 6,300 132 131..
Yokogawa Electric Corp. 1,500 25 29..
Yokohama Rubber Co. Ltd. (The) 300 7 7..
....
29,361 33,685 16.0%..x
Luxembourg..
ArcelorMittal SA 121,458 890 1,198..
Eurofins Scientific SE 19 11 11..
Tenaris SA 4,497 81 108..
....
982 1,317 0.6%..x
Macau..
Sands China Ltd. 114,800 579 665..
....
579 665 0.3%..x
Mexico..
Cemex SAB de CV, ADR 37,816 326 408..
Fomento Economico Mexicano SAB de CV, ADR 1,090 132 111..
Fresnillo PLC 8,423 210 168..
Wal-Mart de Mexico SAB de CV, Series 'V' 106,580 340 256..
....
1,008 943 0.5%..x
Netherlands..
ABN AMRO Group NV 539 16 16..
AerCap Holdings NV 200 10 11..
Akzo Nobel NV 26,636 2,005 2,235..
Altice NV, Class 'A' 15,766 305 419..
Altice NV, Class 'B' 481 11 13..
ASML Holding NV 5,625 645 846..
Core Laboratories NV 5,455 836 879..
EXOR NV 272 14 16..
Heineken Holding NV 513 49 48..
Heineken NV 63 7 6..
Ing Groep NV 55,590 829 1,051..
Koninklijke DSM NV 5,766 469 464..
Koninklijke KPN NV 70,550 240 280..
Koninklijke Philips NV 509 20 21..
Koninklijke Vopak NV 4,430 304 281..
Mobileye NV 6,070 330 311..
NXP Semiconductors NV 100 11 13..
PostNL NV 43,389 501 250..
QIAGEN NV 599 17 23..
Randstad Holding NV 80 7 6..
RELX NV 45,482 804 1,027..
Royal Dutch Shell PLC, Class 'A' 34,172 1,245 1,251..
Royal Dutch Shell PLC, Class 'B' 50,355 1,600 1,943..
Unilever NV 5,027 237 277..
Wolters Kluwer NV 2,646 97 128..
Yandex NV, Class 'A' 16,244 280 439..
....
10,889 12,254 5.8%..x
New Zealand..
Fletcher Building Ltd. 26,722 250 264..
Meridian Energy Ltd. 45,337 102 110..
Ryman Healthcare Ltd. 10,974 90 83..
Spark New Zealand Ltd. 25,023 80 79..
....
522 536 0.3%..x
Norway..
DNB ASA 20,148 382 402..
Gjensidige Forsikring ASA 2,210 49 47..
Marine Harvest 2,422 58 59..
Norsk Hydro ASA 4,140 23 26..
Orkla ASA 8,732 103 106..
Statoil ASA 17,498 431 429..
Telenor ASA 13,836 344 277..
....
1,390 1,346 0.6%..x
Portugal..
Galp Energia, SGPS SA, Class 'B' 4,542 78 91..
Jeronimo Martins SGPS SA 21,973 381 457..
....
459 548 0.3%..x
Russia..
Gazprom PAO, ADR 71,925 582 488..
Magnit PJSC, GDR 3,780 203 223..
....
785 711 0.3%..x
Singapore..
CapitaLand Commercial Trust Ltd. 6,600 9 9..
Capitaland Ltd. 18,300 53 51..
City Developments Ltd. 600 5 5..
ComfortDelGro Corp. Ltd. 30,000 67 69..
Jardine Cycle & Carriage Ltd. 4,200 144 160..
Oversea-Chinese Banking Corp. Ltd. 1,000 8 8..
SATS Ltd. 3,400 16 15
10

The accompanying notes are an integral part of these financial statements.
Imperial Overseas Equity Pool
Schedule of Investment Portfolio As at December 31, 2016 (cont'd)
SecurityNumber
of Shares
AverageCost
($000s)
FairValue
($000s)
% ofNet
Assets..
Singapore Technologies Engineering Ltd. 12,400 37 37..
Suntec REIT 35,900 58 55..
Wilmar International Ltd. 161,100 486 534..
....
883 943 0.5%..x
South Africa..
Naspers Ltd., Series 'N' 1,518 252 298..
Shoprite Holdings Ltd. 26,591 452 446..
....
704 744 0.4%..x
South Korea..
Amorepacific Corp. 420 200 150..
BGF Retail Co. Ltd. 1,570 180 143..
Hana Financial Group Inc. 8,670 297 300..
KT&G Corp. 2,321 173 261..
POSCO 2,050 395 584..
Samsung Electronics Co. Ltd. 1,157 1,547 2,312..
Samsung Electronics Co. Ltd., GDR 25 25 25..
Samsung Electronics Co. Ltd., GDR, Registered 280 176 280..
SK Telecom Co. Ltd. 5,063 1,216 1,260..
....
4,209 5,315 2.5%..x
Spain..
Aena SA 338 57 62..
Amadeus IT Group SA 2,781 141 169..
Bankinter SA 4,687 46 49..
CaixaBank SA 195,641 1,047 866..
Enagas SA 5,391 195 183..
Ferrovial SA 13,889 356 333..
Grifols SA, ADR 14,174 291 306..
Iberdrola SA 15,252 131 134..
Industria de Diseno Textil SA 24,304 816 1,112..
Mapfre SA 2,717 9 11..
Red Electrica Corp. SA 5,272 116 133..
Repsol SA 2,799 48 53..
Repsol SA, Rights 2,799 1 1..
....
3,254 3,412 1.6%..x
Sweden..
Alfa Laval AB 20,240 410 448..
Assa Abloy AB, Class 'B' 288 7 7..
Atlas Copco AB, Series 'A' 12,391 424 505..
Atlas Copco AB, Series 'B' 2,012 72 73..
Boliden AB 6,841 213 239..
Hexagon AB, Series 'B' 10,824 526 518..
Husqvarna AB 13,921 145 145..
Industrivarden AB, Series 'C' 383 8 10..
Investment AB Kinnevik, Series 'B' 432 14 14..
Investor AB, Series 'B' 3,927 174 196..
L E Lundbergforetagen AB, Series 'B' 137 11 11..
Lundin Petroleum AB 16,710 350 486..
Nordea Bank AB 540 8 8..
Sandvik AB 14,915 238 247..
Securitas AB, Series 'B' 2,770 54 58..
Skandinaviska Enskilda Banken, Series 'A' 1,627 21 23..
Skanska AB, Series 'B' 2,549 72 81..
Svenska Handelsbanken AB, Class 'A' 793 15 15..
Swedbank AB 397 12 13..
Swedish Match AB 2,541 111 108..
Volvo AB, Series 'B' 3,196 42 50..
....
2,927 3,255 1.5%..x
Switzerland..
ABB Ltd., Registered 69,980 1,948 1,977..
Actelion Ltd., Registered 2,575 364 747..
Aryzta AG, Registered 15,415 1,024 910..
Baloise Holding AG, Registered 570 85 96..
Chubb Ltd. 6,817 920 1,209..
Compagnie Financiere Richemont SA, Registered 20,954 1,982 1,859..
Credit Suisse Group AG 18,654 473 358..
Ems-Chemie Holding AG, Registered 60 42 41..
Geberit AG, Registered 258 103 139..
Givaudan SA, Registered 35 73 86..
Glencore PLC 30,111 94 137..
Julius Baer Group Ltd. 11,365 658 676..
LafargeHolcim Ltd., Registered 6,402 489 451..
Lonza Group AG, Registered 1,942 301 451..
Nestlé SA, Registered, Series 'B' 13,867 1,059 1,334..
Novartis AG, Registered 21,315 1,788 2,081..
Pargesa Holding SA, Class 'B' 608 55 53..
Partners Group Holding AG 417 168 262..
Roche Holding AG Genusscheine 13,056 3,572 3,996..
Schindler Holding AG 753 171 178..
Schindler Holding AG, Registered 538 119 126..
SGS SA, Registered 285 680 778..
Sika AG 27 153 174
11

The accompanying notes are an integral part of these financial statements.
Imperial Overseas Equity Pool
Schedule of Investment Portfolio As at December 31, 2016 (cont'd)
SecurityNumber
of Shares
AverageCost
($000s)
FairValue
($000s)
% ofNet
Assets..
Sonova Holding AG, Registered 100 17 16..
STMicroelectronics NV 27,942 276 425..
Swiss Life Holding AG, Registered 222 74 84..
Swiss Prime Site AG, Registered 792 89 87..
Swiss Re AG 2,319 242 295..
UBS Group AG 67,619 1,327 1,420..
Wolseley PLC 9,166 690 751..
Zurich Insurance Services AG 4,019 1,253 1,483..
....
20,289 22,680 10.7%..x
Taiwan..
Hon Hai Precision Industry Co. Ltd., GDR, Registered 24,020 118 164..
Taiwan Semiconductor Manufacturing Co. Ltd., ADR 29,215 778 1,128..
....
896 1,292 0.6%..x
United Kingdom..
3i Group PLC 20,099 197 233..
Aberdeen Asset Management PLC 13,350 72 57..
Admiral Group PLC 75 2 2..
Amec Foster Wheeler PLC 19,375 270 150..
Anglo American PLC 3,958 59 75..
Antofagasta PLC 72,061 632 801..
Ashtead Group PLC 27,627 494 721..
ASOS PLC 5,238 372 430..
AstraZeneca PLC 2,122 155 156..
Auto Trader Group PLC 31,581 228 213..
Aviva PLC 337,178 2,910 2,697..
Babcock International Group PLC 715 14 11..
Balfour Beatty PLC 133,917 632 594..
Barclays PLC 414,194 1,634 1,526..
BHP Billiton PLC 3,486 73 75..
Booker Group PLC 93,702 324 272..
BP PLC 789 7 7..
British American Tobacco PLC 45,634 3,047 3,473..
Bunzl PLC 17,406 556 607..
Burberry Group PLC 15,086 398 373..
Carnival PLC 16,768 762 1,141..
CNH Industrial NV 93 1 1..
Cobham PLC 142,914 368 386..
Compass Group PLC 60,572 1,297 1,503..
Diageo PLC 17,405 626 606..
GlaxoSmithKline PLC 44,150 1,198 1,139..
HSBC Holdings PLC 72,225 782 781..
Imperial Brands PLC 4,431 210 259..
Intertek Group PLC 7,132 344 410..
Investec PLC 3,832 38 34..
Johnson Matthey PLC 1,337 76 70..
Legal & General Group PLC 61,914 269 253..
Lloyds Banking Group PLC 877,140 1,061 904..
London Stock Exchange Group PLC 10,188 501 489..
Meggitt PLC 38,156 360 289..
Mondi PLC 4,993 144 137..
National Grid PLC 5,263 87 83..
Persimmon PLC 9,150 362 268..
Prudential PLC 76,897 1,702 2,061..
Reckitt Benckiser Group PLC 20,867 2,360 2,373..
RELX PLC 19,403 424 464..
Rio Tinto PLC, Registered 14,395 701 738..
Royal Bank of Scotland Group PLC 148,700 712 552..
RSA Insurance Group PLC 17,989 152 174..
Sage Group PLC (The) 7,791 79 84..
SEGRO PLC 4,149 33 31..
Smiths Group PLC 3,414 79 80..
SSE PLC 32,089 949 823..
St. James's Place Capital PLC 22,714 340 380..
Standard Chartered PLC 47,724 456 523..
Tate & Lyle PLC 6,361 73 74..
Tesco PLC 210,255 584 720..
Travis Perkins PLC 27,258 876 654..
Tullow Oil PLC 47,100 183 244..
Unilever PLC 18,269 990 992..
United Utilities Group PLC 1,327 21 20..
Vodafone Group PLC 597,646 2,550 1,975..
Weir Group PLC (The) 20,780 519 648..
Worldpay Group PLC 165,771 836 739..
WPP PLC 27,258 635 814..
....
35,816 36,389 17.2%..x
United States..
News Corp., Class 'A' 19,500 371 300..
....
371 300 0.1%..
..
TOTAL INTERNATIONAL EQUITIES 188,136 204,537 96.9%..
..
TOTAL EQUITIES 189,786 206,295 97.7%..
..
Less: Transaction costs included in average cost (402).
..
12
The accompanying notes are an integral part of these financial statements.
Imperial Overseas Equity Pool
Schedule of Investment Portfolio As at December 31, 2016 (cont'd)
SecurityNumber
of Shares
AverageCost
($000s)
FairValue
($000s)
% ofNet
Assets..
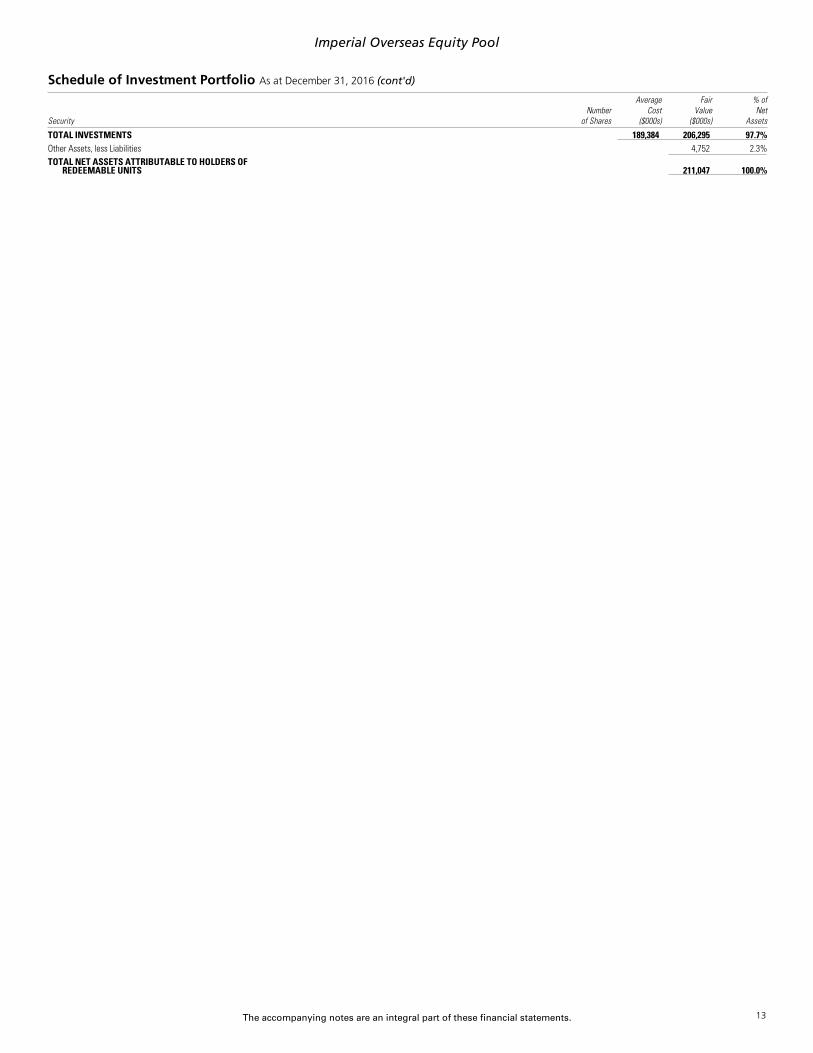
TOTAL INVESTMENTS 189,384 206,295 97.7%..
..
Other Assets, less Liabilities 4,752 2.3%..
....
TOTAL NET ASSETS ATTRIBUTABLE TO HOLDERS OFREDEEMABLE UNITS 211,047 100.0%
.
...
x
13
The accompanying notes are an integral part of these financial statements.
Imperial Overseas Equity Pool
Supplemental Schedule to Schedule of Investment Portfolio
Offsetting Arrangements (note 2d)
The Pool may enter into various master netting arrangements or other similar agreements that do not meet the criteria for offsetting in the Statements of Financial Position but still allowfor the related amounts to be set off in certain circumstances, such as bankruptcy or the termination of the contracts.As at December 31, 2016 and 2015, the Pool did not enter into any arrangements whereby the financial instruments were eligible for offset.
Interests in Underlying Funds (note 4)
As at December 31, 2016 and 2015, the Pool had no investments in underlying funds where the ownership exceeded 20% of each underlying fund.
14
The accompanying notes are an integral part of these financial statements.
Imperial Overseas Equity Pool
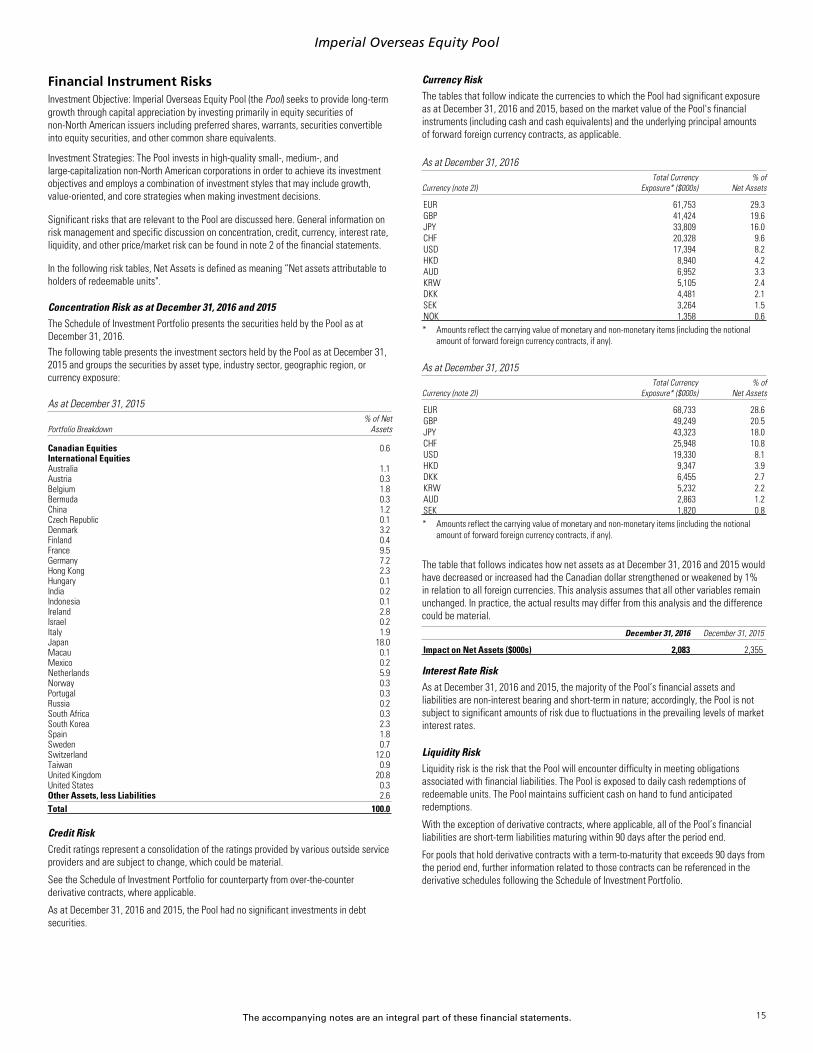
Financial Instrument RisksInvestment Objective: Imperial Overseas Equity Pool (the Pool) seeks to provide long-termgrowth through capital appreciation by investing primarily in equity securities ofnon-North American issuers including preferred shares, warrants, securities convertibleinto equity securities, and other common share equivalents.
Investment Strategies: The Pool invests in high-quality small-, medium-, andlarge-capitalization non-North American corporations in order to achieve its investmentobjectives and employs a combination of investment styles that may include growth,value-oriented, and core strategies when making investment decisions.
Significant risks that are relevant to the Pool are discussed here. General information onrisk management and specific discussion on concentration, credit, currency, interest rate,liquidity, and other price/market risk can be found in note 2 of the financial statements.
In the following risk tables, Net Assets is defined as meaning “Net assets attributable toholders of redeemable units".
Concentration Risk as at December 31, 2016 and 2015The Schedule of Investment Portfolio presents the securities held by the Pool as atDecember 31, 2016.The following table presents the investment sectors held by the Pool as at December 31,2015 and groups the securities by asset type, industry sector, geographic region, orcurrency exposure:
As at December 31, 2015
Portfolio Breakdown% of Net
Assetsx
x
Canadian Equities 0.6x
International Equitiesx
Australia 1.1x
Austria 0.3x
Belgium 1.8x
Bermuda 0.3x
China 1.2x
Czech Republic 0.1x
Denmark 3.2x
Finland 0.4x
France 9.5x
Germany 7.2x
Hong Kong 2.3x
Hungary 0.1x
India 0.2x
Indonesia 0.1x
Ireland 2.8x
Israel 0.2x
Italy 1.9x
Japan 18.0x
Macau 0.1x
Mexico 0.2x
Netherlands 5.9x
Norway 0.3x
Portugal 0.3x
Russia 0.2x
South Africa 0.3x
South Korea 2.3x
Spain 1.8x
Sweden 0.7x
Switzerland 12.0x
Taiwan 0.9x
United Kingdom 20.8x
United States 0.3x
Other Assets, less Liabilities 2.6xxx
Total 100.0xx
Credit RiskCredit ratings represent a consolidation of the ratings provided by various outside serviceproviders and are subject to change, which could be material.
See the Schedule of Investment Portfolio for counterparty from over-the-counterderivative contracts, where applicable.
As at December 31, 2016 and 2015, the Pool had no significant investments in debtsecurities.
Currency RiskThe tables that follow indicate the currencies to which the Pool had significant exposureas at December 31, 2016 and 2015, based on the market value of the Pool's financialinstruments (including cash and cash equivalents) and the underlying principal amountsof forward foreign currency contracts, as applicable.
As at December 31, 2016
Currency (note 2l)Total Currency
Exposure* ($000s)% of
Net Assetsx
x
EUR 61,753 29.3x
GBP 41,424 19.6x
JPY 33,809 16.0x
CHF 20,328 9.6x
USD 17,394 8.2x
HKD 8,940 4.2x
AUD 6,952 3.3x
KRW 5,105 2.4x
DKK 4,481 2.1x
SEK 3,264 1.5x
NOK 1,358 0.6xxx
* Amounts reflect the carrying value of monetary and non-monetary items (including the notionalamount of forward foreign currency contracts, if any).
As at December 31, 2015
Currency (note 2l)Total Currency
Exposure* ($000s)% of
Net Assetsx
x
EUR 68,733 28.6x
GBP 49,249 20.5x
JPY 43,323 18.0x
CHF 25,948 10.8x
USD 19,330 8.1x
HKD 9,347 3.9x
DKK 6,455 2.7x
KRW 5,232 2.2x
AUD 2,863 1.2x
SEK 1,820 0.8xxx
* Amounts reflect the carrying value of monetary and non-monetary items (including the notionalamount of forward foreign currency contracts, if any).
The table that follows indicates how net assets as at December 31, 2016 and 2015 wouldhave decreased or increased had the Canadian dollar strengthened or weakened by 1%in relation to all foreign currencies. This analysis assumes that all other variables remainunchanged. In practice, the actual results may differ from this analysis and the differencecould be material.
December 31, 2016 December 31, 2015x
x
Impact on Net Assets ($000s) 2,083 2,355xx
Interest Rate RiskAs at December 31, 2016 and 2015, the majority of the Pool’s financial assets andliabilities are non-interest bearing and short-term in nature; accordingly, the Pool is notsubject to significant amounts of risk due to fluctuations in the prevailing levels of marketinterest rates.
Liquidity RiskLiquidity risk is the risk that the Pool will encounter difficulty in meeting obligationsassociated with financial liabilities. The Pool is exposed to daily cash redemptions ofredeemable units. The Pool maintains sufficient cash on hand to fund anticipatedredemptions.
With the exception of derivative contracts, where applicable, all of the Pool’s financialliabilities are short-term liabilities maturing within 90 days after the period end.
For pools that hold derivative contracts with a term-to-maturity that exceeds 90 days fromthe period end, further information related to those contracts can be referenced in thederivative schedules following the Schedule of Investment Portfolio.
15
The accompanying notes are an integral part of these financial statements.
Imperial Overseas Equity Pool
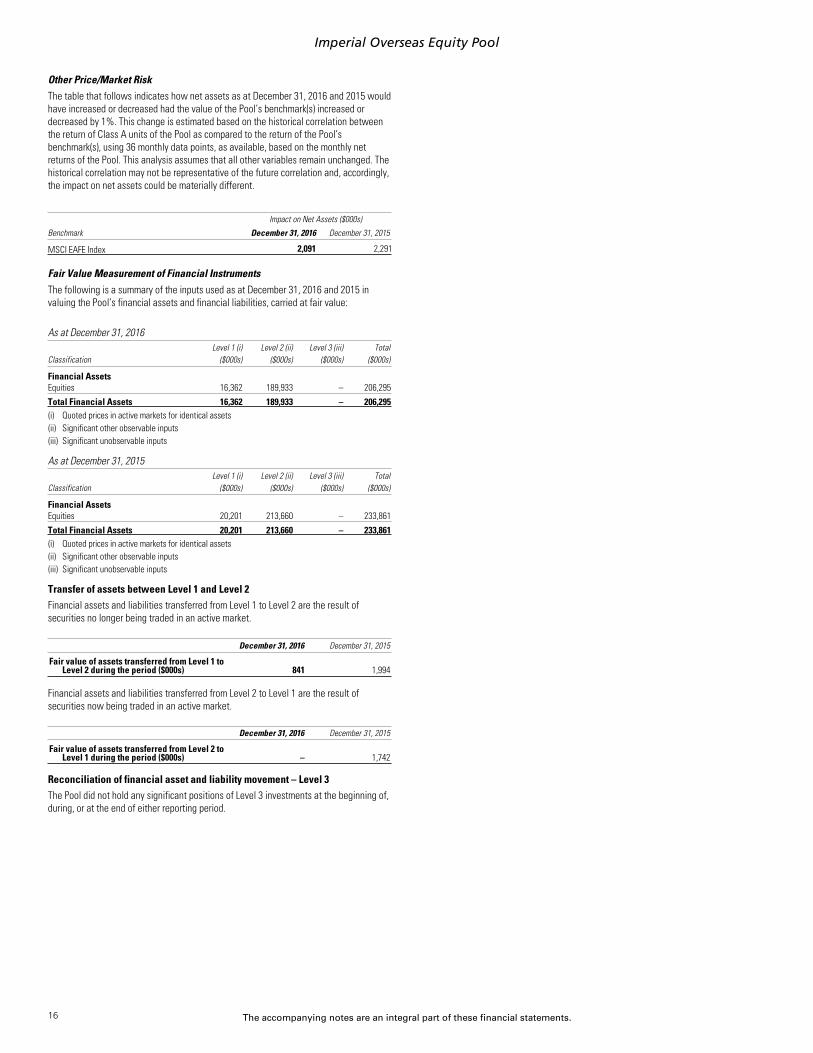
Other Price/Market RiskThe table that follows indicates how net assets as at December 31, 2016 and 2015 wouldhave increased or decreased had the value of the Pool’s benchmark(s) increased ordecreased by 1%. This change is estimated based on the historical correlation betweenthe return of Class A units of the Pool as compared to the return of the Pool’sbenchmark(s), using 36 monthly data points, as available, based on the monthly netreturns of the Pool. This analysis assumes that all other variables remain unchanged. Thehistorical correlation may not be representative of the future correlation and, accordingly,the impact on net assets could be materially different.
x
Impact on Net Assets ($000s)
Benchmark December 31, 2016 December 31, 2015x
x
MSCI EAFE Index 2,091 2,291xx
Fair Value Measurement of Financial InstrumentsThe following is a summary of the inputs used as at December 31, 2016 and 2015 invaluing the Pool’s financial assets and financial liabilities, carried at fair value:
As at December 31, 2016Level 1 (i) Level 2 (ii) Level 3 (iii) Total
Classification ($000s) ($000s) ($000s) ($000s)xx
Financial Assetsx
Equities 16,362 189,933 – 206,295xxx
Total Financial Assets 16,362 189,933 – 206,295xx
x
(i) Quoted prices in active markets for identical assetsx
(ii) Significant other observable inputsx
(iii) Significant unobservable inputs
As at December 31, 2015Level 1 (i) Level 2 (ii) Level 3 (iii) Total
Classification ($000s) ($000s) ($000s) ($000s)xx
Financial Assetsx
Equities 20,201 213,660 – 233,861xxx
Total Financial Assets 20,201 213,660 – 233,861xx
x
(i) Quoted prices in active markets for identical assetsx
(ii) Significant other observable inputsx
(iii) Significant unobservable inputs
Transfer of assets between Level 1 and Level 2Financial assets and liabilities transferred from Level 1 to Level 2 are the result ofsecurities no longer being traded in an active market..
December 31, 2016 December 31, 2015x
x
Fair value of assets transferred from Level 1 toLevel 2 during the period ($000s) 841 1,994
x
x
Financial assets and liabilities transferred from Level 2 to Level 1 are the result ofsecurities now being traded in an active market..
December 31, 2016 December 31, 2015x
x
Fair value of assets transferred from Level 2 toLevel 1 during the period ($000s) – 1,742
x
x
Reconciliation of financial asset and liability movement – Level 3The Pool did not hold any significant positions of Level 3 investments at the beginning of,during, or at the end of either reporting period.
16
Notes to Financial Statements
x
As at and for the periods as disclosed in the financial statements (note 1)
1. Organization of the Funds and Financial Reporting Periods
The Imperial Pools consist of Imperial Money Market Pool, Imperial Short-Term Bond Pool, Imperial Canadian Bond Pool, Imperial Canadian Diversified Income Pool, Imperial International Bond Pool, Imperial EquityHigh Income Pool, Imperial Canadian Dividend Income Pool, Imperial Global Equity Income Pool, Imperial Canadian Equity Pool, Imperial U.S. Equity Pool, Imperial International Equity Pool, Imperial Overseas Equity Pool,and Imperial Emerging Economies Pool (individually, a Pool, and collectively, the Pools).
The Income Generation Portfolios consist of Conservative Income Portfolio, Balanced Income Portfolio and Enhanced Income Portfolio (individually, a Portfolio, and collectively, the Portfolios).
Each of the Imperial Pools and Income Generation Portfolios (individually, a Fund, and collectively, the Funds) is a mutual fund trust organized under the laws of Ontario and governed by a declaration of trust(Declaration of Trust). The address of the Funds' registered office is 18 York Street, Suite 1300, Toronto, Ontario.
Canadian Imperial Bank of Commerce (CIBC) is the manager (the Manager) of the Funds and CIBC Trust Corporation is the trustee (the Trustee) of the Funds. Each Fund may issue an unlimited number of classes ofunits and an unlimited number of units of each class. As at the date of these financial statements, Class A units of each of the Funds are available for sale, except for the Conservative Income Portfolio which offersClass T3 and Class T4 units, the Balanced Income Portfolio which offers Class T4 and Class T5 units, and the Enhanced Income Portfolio which offers Class T5 and Class T6 units.
The date upon which each Fund was established by Declaration of Trust (Date Established) and the date upon which units of each Fund was first sold to the public (Inception Date) are reported in footnote Organizationof the Fund on the Statements of Financial Position.
The Schedule of Investment Portfolio of each Fund is as at December 31, 2016. The Statements of Financial Position of each of the Funds are as at December 31, 2016 and 2015. The Statements of ComprehensiveIncome, Statements of Changes in Net Assets Attributable to Holders of Redeemable Units, and Statements of Cash Flows of each of the Funds are for annual periods ended December 31, 2016 and 2015, exceptfor Funds established during either year, in which case the information presented is from the Date Established or the Inception Date to December 31, 2016 or 2015.
These financial statements were approved for issuance by the Manager on March 2, 2017.xx
2. Summary of Significant Accounting Policies
These financial statements have been prepared in accordance with International Financial Reporting Standards (IFRS) as published by the International Accounting Standards Board (IASB). The Funds adopted IFRS in2014 as required by Canadian securities legislation and the Canadian Accounting Standards Board. Previously, the Funds prepared their financial statements in accordance with Canadian generally acceptedaccounting principles (GAAP) as defined in Part V of the CPA Canada Handbook.
The financial statements have been prepared on a going concern basis using the historical cost convention. However, each Fund is an investment entity and primarily all financial assets and financial liabilities aremeasured at fair value in accordance with IFRS. Accordingly, the Funds’ accounting policies for measuring the fair value of investments and derivatives are consistent with those used in measuring the Net Asset Valuefor transactions with unitholders. In applying IFRS, these financial statements include estimates and assumptions made by management that affect the reported amounts of assets, liabilities, income, and expensesduring the reporting periods. However, existing circumstances and assumptions may change due to market changes or circumstances arising beyond the control of the Funds. Such changes are reflected in theassumptions when they occur.
These financial statements have been presented in Canadian dollars, which is the Funds’ functional currency (unless otherwise noted).
a) Financial Instruments
Classification and recognition of financial instruments
In accordance with IAS 39 Financial Instruments: Recognition and Measurement, financial assets and financial liabilities are classified at initial recognition into the following categories:
Financial assets and liabilities at fair value through profit or loss (FVTPL)
This category is sub-divided into:
l Financial instruments classified as Held For Trading: Financial assets and liabilities are classified as Held For Trading if they are acquired for the purpose of selling and/or repurchasing in the near term, andare acquired principally for the purpose of generating a profit from short-term fluctuations in price. Derivatives and securities sold short held by the Funds are classified as Held For Trading and do not meetthe definition of effective hedging instruments as defined by IAS 39.
l Financial instruments designated as FVTPL through inception: All investments held by the Funds, excluding those classified as Held For Trading (discussed above), are designated as fair value through profitor loss upon initial recognition. These financial assets are designated upon initial recognition on the basis that they are part of a group of financial assets that are managed and have their performanceevaluated on a fair value basis, in accordance with risk management and investment strategies of the Funds, as set out in the Funds’ prospectus.
Loans and receivables
The Funds include in this category receivable balances relating to portfolio investments and other short-term receivables such as receivable for units issued.
Other financial liabilities
This category includes all financial liabilities, other than those classified as fair value through profit or loss. The Funds include in this category amounts relating to payables for portfolio securities purchased and otheraccrued liabilities such as payable for units redeemed and distributions payable to holders of redeemable units.
All Funds have contractual obligations to distribute cash to the unitholders. As a result, each Fund's obligation for net assets attributable to holders of redeemable units represents a financial liability and is presentedat the redemption amount.
b) Risk Management
The Funds’ overall risk management approach includes formal guidelines that govern the extent of exposure to various types of risk, including diversification within asset classes and limits on the exposure to individualinvestments and counterparties. In addition, derivative financial instruments may be used to manage certain risk exposures. The Manager also has various internal controls to oversee the Funds’ investment activities,including monitoring compliance with the investment objectives and strategies, internal guidelines, and securities regulations. Please refer to each Fund’s Supplemental Schedule to Schedule of InvestmentPortfolio for specific risk disclosures.
Fair value of financial instruments by using valuation techniques
Financial instruments are valued at their fair value which is defined as the price that would be received to sell an asset or paid to transfer a liability in an orderly transaction between market participants at themeasurement date. Refer to note 3a to 3f for valuation of each specific type of financial instrument held by the Funds. The fair value of financial assets and liabilities traded in active markets are based on quotedmarket prices at the close of trading on the reporting date. The Funds use the last traded market price for both financial assets and financial liabilities where the last traded price falls within that day’s bid-ask spread.In circumstances where the last traded price is not within the bid-ask spread, the Manager determines the price that is most representative of fair value based on the specific facts and circumstances.
For financial assets and financial liabilities that are not traded in an active market, fair value is determined using valuation techniques.
The Funds classify fair value measurement within a hierarchy which gives the highest priority to unadjusted quoted prices in active markets for identical assets or liabilities (Level 1) and the lowest priority tounobservable inputs (Level 3). The three levels of the fair value hierarchy are:
Level 1: Quoted prices (unadjusted) in active markets for identical assets or liabilities that the entity can access at the measurement date;
Level 2: Inputs other than quoted prices included within Level 1 that are observable for the asset or liability, either directly or indirectly; and
Level 3: Inputs are unobservable for the asset or liability.
17
p / 2 Notes to Financial Statements
If inputs are used to measure an asset’s or liability’s fair value, the classification within the hierarchy is based on the lowest level input that is significant to the fair value measurement. Each Fund’s fair value hierarchyclassification of its assets and liabilities is included in the Supplemental Schedule to Schedule of Investment Portfolio.
The carrying values of all non-investment assets and liabilities approximate their fair values due to their short-term nature. Fair values are classified as Level 1 when the related security or derivative is actively tradedand a quoted price is available. If an instrument classified as Level 1 subsequently ceases to be actively traded, it is transferred out of Level 1. In such cases, instruments are reclassified into Level 2, unless themeasurement of its fair value requires the use of significant unobservable inputs, in which case it is classified as Level 3.
The Manager is responsible for performing the fair value measurements included in the financial statements of a Fund, including the Level 3 measurements. The Manager obtains pricing from third-party pricingvendors and the pricing is reviewed daily. At each financial reporting date, the Manager reviews and approves all Level 3 fair value measurements. The Funds also have a Valuation Committee which meets quarterly toperform detailed reviews of the valuations of investments held by the Funds, which includes discussion on Level 3 measurements.
Credit risk
Credit risk is the risk that a counterparty to a financial instrument, such as a fixed income security or a derivative contract, will fail to discharge an obligation or commitment that it has entered into with the Funds. Thevalue of fixed income securities and derivatives as presented on the Schedule of Investment Portfolio includes consideration of the creditworthiness of the issuer and, accordingly, represents the maximum credit riskexposure of the Funds. Certain Funds may invest in short-term fixed income securities issued or guaranteed primarily by the Government of Canada or any Canadian provincial government, obligations of Canadianchartered banks or trust companies, and commercial paper with approved credit ratings. The risk of default on these short-term fixed income securities is considered low and these securities primarily have creditratings of ‘A-1 (Low)’ or higher (as rated by S&P Global Ratings, a division of S&P Global, or equivalent rating from another rating service).
The bond ratings noted in the Funds’ ‘Financial Instruments Risk’ under sub-section ‘Credit Risk’ represent ratings collected and disseminated by recognized third party vendors. These ratings utilized by the Manager,while obtained from vendors skilled and recognized for bond rating services, may not be the same as those used directly by the portfolio advisor or portfolio sub-advisors. Ratings used by the portfolio advisor orportfolio sub-advisors could be higher or lower than those used for risk disclosure in the financial statements in compliance with their investment policy guidelines.
The Funds may engage in securities lending transactions. The credit risk related to securities lending transactions is limited by the fact that the value of cash or securities held as collateral by the Funds in connectionwith these transactions is at least 102% of the fair value of the securities loaned. The collateral and loaned securities are marked to market on each business day. Further information regarding the collateral andsecurities on loan can be found in the footnotes to the Statements of Financial Position and in note 2j.
Currency risk
Currency risk is the risk that the value of an investment will fluctuate due to changes in foreign exchange rates. Mutual funds may invest in securities denominated or traded in currencies other than the funds’reporting currency.
Interest rate risk
Prices of fixed income securities generally increase when interest rates decline and decrease when interest rates rise. This risk is known as interest rate risk. Prices of longer-term fixed income securities will generallyfluctuate more in response to interest rate changes than would shorter-term securities. Due to the nature of short-term fixed income securities with a remaining term-to-maturity of less than one year, theseinvestments are not generally exposed to a significant risk that their value will fluctuate in response to changes in the prevailing levels of market interest rates.
Liquidity risk
The Funds are exposed to daily cash redemptions of redeemable units. Generally, the Funds retain sufficient cash and cash equivalent positions to maintain adequate liquidity. However, liquidity risk also involves theability to sell an asset for cash easily and at a fair price. Some securities are illiquid due to legal restrictions on their resale, the nature of the investment, or simply a lack of interested buyers for a particular security orsecurity type. Certain securities may become less liquid due to changes in market conditions, such as interest rate changes or market volatility, which could impair the ability of a Fund to sell such securities quickly or ata fair price. Difficulty in selling securities could result in a loss or lower return for a Fund.
Other price/market risk
Other price/market risk is the risk that the value of investments will fluctuate as a result of changes in market conditions. Several factors can influence market trends, such as economic developments, changes ininterest rates, political changes, and catastrophic events. All investments are exposed to other price/market risk.
c) Investment Transactions, Income Recognition, and Recognition of Realized and Unrealized Gains and Losses
i) Interest for distribution purposes shown on the Statements of Comprehensive Income represents the coupon interest received by the Fund accounted for on an accrual basis. The Funds do not amortizepremiums paid or discounts received on the purchase of fixed income securities except for zero coupon bonds, which are amortized on a straight-line basis.
ii) Dividend income is recorded on the ex-dividend date.
iii) Securities that are exchange-traded are recorded at fair value established by the last traded market price when that price falls within that day’s bid-ask spread. Debt securities are recorded at fair value,established by the last traded price on the over-the-counter market (OTC) when that price falls within that day’s bid-ask spread. In circumstances where the last traded price is not within the bid-ask spread,the Manager determines the price that is most representative of fair value based on the specific facts and circumstances. Unlisted securities are recorded at fair value using fair valuation techniquesestablished by the Manager in establishing a fair value.
iv) Realized gains and losses on investments and unrealized appreciation or depreciation of investments are calculated using the average cost, excluding transaction costs, of the related investments.
v) Other income is the sum of income, excluding transaction costs, other than that which is separately classified on the Statements of Comprehensive Income.
d) Offsetting
Financial assets and liabilities are offset and the net amount reported in the Statements of Financial Position, if there is a currently enforceable legal right to offset the recognized amounts and there is an intention tosettle on a net basis, or to realize the asset and settle the liability simultaneously.
Where applicable, additional information can be found in the table Offsetting Arrangements as part of the Supplemental Schedule to Schedule of Investment Portfolio. This supplemental schedule discloses the OTCderivatives which are subject to offsetting.
e) Portfolio Securities
The cost of securities of a Fund is determined in the following manner: securities are purchased and sold at a market-traded price to arrive at a value for the position traded. The total purchased value represents thetotal cost of the security to the Fund. When additional units of the same security are purchased, the cost of those additional units is added to the total security cost. When units of the same security are sold, theproportionate cost of the units of the security sold is deducted from the total security cost. If there is a return of capital paid by a security, the amount of this return of capital is deducted from the total security cost.This method of tracking security cost is known as “average cost” and the current total for any one security is referred to as the “adjusted cost base” or “ACB” of the security. Transaction costs incurred in portfoliotransactions are excluded from the average cost of investments and are recognized immediately in net income and are presented as a separate expense item in the financial statements.
The difference between the fair value of securities and their average cost, excluding transaction costs, represents the unrealized appreciation (depreciation) in value of the portfolio investments. The applicable periodchange in unrealized appreciation (depreciation) of investments is included on the Statements of Comprehensive Income.
Short-term investments on the Schedule of Investment Portfolio are presented at their amortized cost which approximates the fair value. Accrued interest for bonds is disclosed separately on the Statements ofFinancial Position.
f) Foreign Exchange
The value of investments and other assets and liabilities denominated in foreign currencies is translated into Canadian dollars, which is the Funds’ functional and presentation currency at the current rates prevailing oneach valuation date (unless otherwise indicated).
Purchases and sales of investments, income, and expenses are translated into Canadian dollars, which is the Funds’ functional and presentation currency at the foreign exchange rates prevailing on the dates of suchtransactions. Foreign currency translation gains (losses) on investments and income transactions are included in Net realized gain (loss) on foreign currency on the Statements of Comprehensive Income.
18
Notes to Financial Statements p / 3
g) Forward Foreign Currency Contracts
The Funds may enter into forward foreign currency contracts for either hedging or non-hedging purposes where such activity is consistent with their investment objectives and as permitted by the Canadian securitiesregulatory authorities.
Changes in the fair value of forward foreign currency contracts are included in derivative assets or derivative liabilities on the Statements of Financial Position and are recorded as an Increase (decrease) in unrealizedappreciation (depreciation) of investments and derivatives during the applicable period on the Statements of Comprehensive Income.
The gain or loss arising from the difference between the value of the original forward foreign currency contract and the value of such contract at close or delivery is realized and recorded as Net realized gain (loss) onforeign currency for Pools that use the forward foreign currency contracts for hedging or as Derivative income (loss) for Pools that do not use the forward foreign currency contracts for hedging.
h) Futures Contracts
The margin deposits with brokers relating to futures contracts are included in Margin on the Statements of Financial Position. Any change in the margin requirement is settled daily and included in Receivable forportfolio securities sold or Payable for portfolio securities purchased on the Statements of Financial Position.
Any difference between the settlement value at the close of business on each valuation date and the settlement value at the close of business on the previous valuation date is recorded as Derivative income (loss) onthe Statements of Comprehensive Income.
i) Options
Premiums paid for purchased call and put options are included in derivative assets and subsequently measured at fair value on the Statements of Financial Position. When a purchased option expires, the Fund willrealize a loss in the amount of the cost of the option. For a closing transaction, the Fund will realize a gain or loss depending on whether the proceeds are greater or less than the premium paid at the time of purchase.When a purchased call option is exercised, the cost of the security purchased is increased by the premium paid at the time of purchase.
Premiums received from writing options are included in derivative liabilities and subsequently measured at fair value on the Statements of Financial Position as initial reductions in the value of investments. Premiumsreceived from writing options that expire unexercised are recorded as realized gains and reported as Net gain (loss) on sale of investments and derivatives on the Statements of Comprehensive Income. For a closingtransaction, if the cost of closing the transaction exceeds the premium received, the Fund will record a realized loss or, if the premium received at the time the option was written is greater than the amount paid,the Fund will record a realized gain and is reported as Net gain (loss) on sale of investments and derivatives. If a written put option is exercised, the cost for the security delivered is reduced by the premiums received atthe time the option was written.
j) Securities Lending
A Fund may lend portfolio securities in order to earn additional revenue, which is disclosed on the Statements of Comprehensive Income. The loaned assets of any one Fund are not permitted to exceed 50% of thefair value of the assets of that Fund (excluding collateral debt for the loaned securities). The minimum allowable collateral is 102% of the fair value of the loaned securities as per the requirements of NationalInstrument 81-102 – Investment Funds. Collateral can consist of the following:
i) Cash.
ii) Qualified securities.
iii) Irrevocable letters of credit issued by a Canadian financial institution that is not the counterparty, or an affiliate counterparty, of the pool in the transaction, if evidences of indebtedness of the Canadianfinancial institution that are rated as short-term debt by an approved credit rating organization have an approved credit rating.
iv) Securities that are immediately convertible into securities of the same issuer, class, or type, and the same term, as the securities loaned.
The fair value of the loaned securities is determined on the close of any valuation date and any additional required collateral is delivered to the Pool on the next business day. The securities on loan continue to beincluded on the Schedule of Investment Portfolio, and are included in the total value on the Statements of Financial Position in Investments (non-derivative financial assets) at fair value. Where applicable, a Fund’ssecurities lending transactions are reported in footnote Securities Lending on the Statements of Financial Position.
Changes to National Instrument 81-106 – Investment Fund Continuous Disclosure took effect for Funds with a financial year beginning on or after January 1, 2016. Those changes now require a reconciliation of thegross amount generated from the securities lending transactions of the Funds to the revenue from securities lending disclosed in the Funds’ Statements of Comprehensive Income. The gross amount generated fromsecurities lending includes interest paid on collateral, withholding taxes deducted, the fees paid to the Funds’ lending agent and the securities lending revenue received by the Funds. Where applicable, thereconciliation can be found in the footnotes to the Funds’ Statements of Comprehensive Income.
k) Loans and Receivables, Other Assets and Liabilities
Loans and Receivables, other assets and liabilities (other than those classified as FVTPL) are recorded at cost, which approximates their fair value, with the exception of Net Assets Attributable to Holders ofRedeemable Units which are presented at the redemption value.
l) Legend of Abbreviations
The following is a list of abbreviations (foreign currency translation and others) that may be used in the Schedule of Investment Portfolio:
x
Currency Abbreviations
x..
ARS – Argentine Peso JPY – Japanese Yen..
AUD – Australian Dollar KES – Kenyan Shilling..
BRL – Brazilian Real KRW – South Korean Won..
CAD – Canadian Dollar MAD – Morocco Dirham..
CHF – Swiss Franc MXN – Mexican Peso..
CLP – Chilean Peso MYR – Malaysian Ringgit..
CNY – Chinese Renminbi NOK – Norwegian Krone..
COP – Colombian Peso NZD – New Zealand Dollar..
CZK – Czech Koruna PHP – Philippine Peso..
DKK – Danish Krone PLN – Polish Zloty..
EGP – Egyptian Pound RUB – Russian Ruble..
EUR – Euro SEK – Swedish Krona..
GBP – British Pound SGD – Singapore Dollar..
HKD – Hong Kong Dollar THB – Thai Baht..
HUF – Hungarian Forint TRY – New Turkish Lira..
IDR – Indonesian Rupiah TWD – Taiwan Dollar..
ILS – Israeli Shekel USD – United States Dollar..
INR – Indian Rupee ZAR – South African Rand
19

p / 4 Notes to Financial Statements
..
Other Abbreviations
..
ADR – American Depositary Receipt..
CVO – Contingent Value Obligations..
ETF – Exchange-Traded Fund..
GDR – Global Depositary Receipt Securities..
NVDR – Non-Voting Depositary Receiptxxxxxxxx
m) Standards Issued but not yet Effective
Standards issued but not yet effective up to the date of issuance of the Funds’ financial statements are listed below. The Funds intend to adopt applicable standards when they become effective.
IFRS 9, Financial Instruments - Classification and Measurement
In July 2014, the IASB issued the final version of IFRS 9, Financial Instruments which reflects all phases of the financial instruments project and replaces IAS 39, Financial Instruments: Recognition and Measurementand all previous versions of IFRS 9. The standard introduces new requirements for classification and measurement, impairment, and hedge accounting. IFRS 9 is effective for annual periods beginning on or afterJanuary 1, 2018, with early application permitted. The Funds are in the process of assessing the impact of IFRS 9.
n) Increase (Decrease) in Net Assets Attributable to Holders of Redeemable Units per Unit
Increase (decrease) in net assets attributable to holders of redeemable units per unit of each class is calculated by dividing the Increase (decrease) in net assets attributable to holders of redeemable units (excludingdistributions), as reported on the Statements of Comprehensive Income, by the weighted average number of units in issue during the related period.
3. Valuation of Investments
The valuation date (Valuation Date) for a Fund is any day when the Manager’s head office is open for business. The Manager may, at its discretion, establish other Valuation Dates.
The fair value of the investments or assets of a Fund is determined as follows:
a) Cash and Other Assets
Cash, accounts receivable, dividends receivable, distributions receivable, and interest receivable are valued at fair value or at their recorded cost, plus or minus any foreign exchange between recognition of the assetby the Fund and the current Valuation Date, which approximates fair value.
b) Bonds, Debentures, and Other Debt Obligations
Bonds, debentures, and other debt obligations are fair valued using the last traded price provided by a recognized vendor upon the close of trading on a Valuation Date, whereby the last traded price falls within thatday’s bid-ask spread. If the last traded price does not fall within that day’s bid-ask spread, then the Manager will determine the price that is most representative of fair value based on the specific facts andcircumstances.
c) Listed Securities, Unlisted Securities, and Fair Value Pricing of Foreign Securities
Any security that is listed or traded on a securities exchange is fair valued using the last traded price, whereby the last traded price falls within that day’s bid-ask spread or, if there is no traded price on that exchangeor the last traded price does not fall within that day’s bid-ask spread and in the case of securities traded on an OTC market, at the fair value as determined by the Manager as an appropriate basis for valuation. In suchsituations, a fair value will be determined by the Manager to establish current value. If any securities are inter-listed or traded on more than one exchange or market, the Manager will use the principal exchange ormarket for the fair value of such securities.
Units of each mutual fund in which a Fund invests will be valued at fair value using the most recent net asset value quoted by the Trustee or Manager of the mutual fund on the Valuation Date.
Unlisted securities are fair valued using the last traded price quoted by a recognized dealer, or the Manager may determine a price that more accurately reflects the fair value of these securities if the Manager feelsthe last traded price does not reflect fair value.
Fair value pricing is designed to avoid stale prices and to provide a more accurate fair value, and may assist in the deterrence of harmful short-term or excessive trading in the Fund. When securities listed or traded onmarkets or exchanges that close prior to North or South American markets or exchanges are valued by the Manager at their fair market value, instead of using quoted or published prices, the prices of such securitiesused to calculate the Fund’s net assets or net asset value may differ from quoted or published prices of such securities.
d) Derivatives
Long positions in options, debt-like securities, and listed warrants are valued at fair value using the last traded price as established on either their principal trading exchange or by a recognized dealer in such securities,whereby the last traded price falls within that day’s bid-ask spread and the credit rating of each counterparty (as rated by S&P Global Ratings, a division of S&P Global) meets or exceeds the minimum approved creditrating.
When any option is written by any Fund, the premium received by the Fund will be reflected as a liability that will be valued at an amount equal to the current fair value of the option that would have the effect ofclosing the position. Any difference resulting from revaluation shall be treated as an unrealized gain or loss on investment; the liability shall be deducted in arriving at the net assets attributable to holders ofredeemable units of the Fund. The securities that are the subject of a written option, if any, will be valued in the manner described above for listed securities.
Futures contracts, forward contracts, or swaps will be valued at fair value of the gain or loss, if any, that would be realized on the Valuation Date if the position in the futures contracts, forward contracts, or swapswere to be closed out.
Margin paid or deposited in respect of futures contracts and forward contracts will be reflected as an account receivable and margin consisting of assets other than cash will be noted as held as collateral.
Other derivatives and margin are fair valued in a manner that the Manager determines to represent their fair value.
e) Restricted Securities
Restricted securities purchased by any Fund will be fair valued in a manner that the Manager determines to represent their fair value.
f) Other Investments
All other investments of the Funds will be fair valued in accordance with the laws of the Canadian securities regulatory authorities, where applicable.
The value of any security or other property of a Fund for which a market quotation is not readily available or where the market quotations do not properly reflect the fair value of such securities will be determined bythe Manager by valuing the securities at their fair value. In such situations, fair value will be determined using the fair valuation technique that most accurately reflects the fair value as established by the Manager.
4. Interest in Underlying Funds
The Funds may invest in other investment funds (Underlying Funds). Each Underlying Fund invests in a portfolio of assets to generate returns in the form of investment income and capital appreciation for itsunitholders. Each Underlying Fund finances its operations primarily through the issuance of redeemable units, which are puttable at the unitholder's option and entitle the unitholder to a proportionate share of theunderlying fund's net assets. The Fund's interests in Underlying Funds held in the form of redeemable units, are reported in its Schedule of Investments at fair value, which represents the Funds’ maximum exposure onthose investments. The Funds' interests in underlying funds as at the prior year period ends are presented in the Financial Instruments Risks - Concentration Risk section in the Supplemental Schedule to Schedule ofInvestment Portfolio. Distributions earned from Underlying Funds are included in “Investment Income” in the Statements of Comprehensive Income. The total realized and change in unrealized gains (losses) arisingfrom Underlying Funds are also included in the Statements of Comprehensive Income. The Funds do not provide any additional significant financial or other support to Underlying Funds.
Where applicable, the table “Interests in Underlying Funds” presented as part of the Supplemental Schedule to Schedule of Investment Portfolio, provides additional information on the Funds’ investments inUnderlying Funds where the ownership interest exceeds 20% of each Underlying Fund.
20
Notes to Financial Statements p / 5
5. Redeemable Units Issued and Outstanding
Each Fund is permitted to have an unlimited number of classes of units and may issue an unlimited number of units of each class. The outstanding units represent the capital of a Fund. Each unit has no par value andthe value of each unit is the net assets attributable to holders of redeemable units per unit next determined. Settlement of the cost for units issued is completed as per security regulations in place at the time of issue.Distributions made by a Fund and reinvested by unitholders in additional units also constitute issued redeemable units of a Fund.
Units are redeemed at the net assets attributable to holders of a redeemable unit per unit of a Fund. A right to redeem units of a Fund may be suspended with the approval of the Canadian securities regulatoryauthorities or when normal trading is suspended on a stock, options, or futures exchange within Canada or outside of Canada on which securities or derivatives that make up more than 50% of the value or underlyingexposure of the total assets of a Fund, not including any liabilities of a Fund, are traded and when those securities or derivatives are not traded on any other exchange that represents a reasonably practical alternativefor a Fund. The Fund is not subject to any externally imposed capital requirements.
The capital received by a Fund is utilized within the respective investment mandate of the Fund. This includes the ability to make liquidity available to satisfy unitholder unit redemption requirements upon theunitholder’s request.
Changes in issued and outstanding units for the annual periods ended December 31, 2016 and 2015 can be found on the Statements of Changes in Net Assets Attributable to Holders of Redeemable Units.x
6. Management Fees and Operating Expenses
Management fees are based on the net asset value of the Funds and are calculated daily. Management fees are paid to the Manager in consideration for providing, or arranging for the provision of, management,distribution, and portfolio advisory services. The maximum annual management fee expressed as a percentage of the average net asset value that can be charged by a Fund is reported in footnote MaximumChargeable Annual Management Fee Rates on the Statements of Comprehensive Income.
In addition to the management fees, the Funds are responsible for all expenses relating to the operation and conduct of the business of the Funds, which may include interest, operating, and administrative costs (otherthan advertising and promotional expenses, which are the responsibility of the Manager), brokerage fees, commissions, spreads, regulatory fees, Independent Review Committee fees, taxes, audit and legal fees andexpenses, safekeeping and custodial fees, investor servicing costs, and costs of unitholder reports, prospectuses, and other reports. All such operating expenses are paid by the Manager and recovered from the Funds.The Funds do not pay a fee to the Trustee.
The Manager may recover less than the actual operating expenses paid by the Manager, resulting in the Manager absorbing expenses. The Manager may also charge to a Fund less than the maximum managementfee in footnote Maximum Chargeable Annual Management Fee Rates on the Statements of Comprehensive Income, resulting in the Manager waiving management fees.
At its sole discretion, the Manager may stop absorbing operating expenses and/or waiving management fees at any time. Operating expenses absorbed and/or management fees waived by the Manager are disclosedon the Statements of Comprehensive Income.
In some cases, the Manager may charge management fees to a Fund that are less than the management fees the Manager is entitled to charge in respect of certain investors in a Fund. The difference in the amount ofthe management fees will be paid out by the Fund to the applicable investors as a distribution of additional units of the Fund (Management Fee Distributions). Management Fee Distributions are negotiable betweenthe Manager and the investor and are dependent primarily on the size of the investor’s investment in the Fund. Management Fee Distributions paid to qualified investors do not adversely impact the Fund or any of theFund’s other investors. The Manager may increase or decrease the amount of Management Fee Distributions to certain investors from time to time.
Where a Fund invests in units of an Underlying Fund, the Fund does not pay duplicate management fees on the portion of its assets that it invests in units of the Underlying Fund. In addition, the Fund will not payduplicate sales fees or redemption fees with respect to the purchase or redemption by it of units of the Underlying Fund. Some of the Underlying Funds held by the Funds may offer Management Fee Distributions. SuchManagement Fee Distributions of an Underlying Fund will be paid out as required for taxable distribution payments by a Fund. The manager of an Underlying Fund may, in some cases, waive a portion of an UnderlyingFund’s management fee and/or absorb a portion of an Underlying Fund’s operating expenses.
7. Income Taxes and Withholding Taxes
The Funds qualify as mutual fund trusts under the Income Tax Act (Canada). No income tax is payable by the Funds on net income and/or net realized capital gains that are distributed to unitholders. In addition, incometaxes payable on undistributed net realized capital gains are refundable on a formula basis when units of the Funds are redeemed. Sufficient net income and realized capital gains of the Funds have been, or will be,distributed to the unitholders such that no tax is payable by the Funds and, accordingly, no provision for income taxes has been made in the financial statements. Occasionally, a Fund may pay distributions in excess ofthe net income and net realized capital gains of the Fund. This excess distribution is called a return of capital and is non-taxable to the unitholder. However, a return of capital reduces the average cost of theunitholder’s units for tax purposes, which may result in a capital gain to the unitholder to the extent the average cost becomes less than zero.
Non-capital losses that arose in 2006 and thereafter are available to be carried forward for 20 years.
Capital losses for income tax purposes may be carried forward indefinitely and applied against capital gains realized in future years. Where applicable, a Fund’s net capital and non-capital losses are reported infootnote Net Capital and Non-Capital Losses on the Statements of Changes in Net Assets Attributable to Holders of Redeemable Units.
The Funds have a taxation year-end of December 15 (except Imperial Money Market Pool, which has a taxation year-end of December 31).
The Funds currently incur withholding taxes imposed by certain countries on investment income and capital gains. Such income and gains are recorded on a gross basis and the related withholding taxes are shown asa separate expense in the Statements of Comprehensive Income.
8. Brokerage Commissions and Fees
The total commissions paid by the Funds to brokers in connection with portfolio transactions are reported in footnote Brokerage Commissions and Fees on the Statements of Comprehensive Income of each Fund. Inallocating brokerage business to a dealer, consideration may be given by the portfolio sub-advisors of the Funds for the provision of goods and services by the dealer or a third party, other than order execution (referredto in the industry as “soft dollar” arrangements). These goods and services are paid for with a portion of brokerage commissions and assist the portfolio sub-advisors with their investment decision-making services tothe Funds or relate directly to executing portfolio transactions on behalf of the Funds. The total soft dollar payments paid by the Funds to brokers are reported in footnote Brokerage Commissions and Fees on theStatements of Comprehensive Income of each Fund. In addition, the Manager may enter into commission recapture arrangements with certain dealers with respect to the Fund. Any commission recaptured will be paidto the applicable Fund.
Fixed income and certain other securities are transacted in an OTC market, where participants are dealing as principals. Such securities are generally traded on a net basis and do not normally involve brokeragecommissions, but will typically include a “spread” (being the difference between the bid and the offer prices on the security of the applicable marketplace).
Spreads associated with fixed income securities trading and certain other securities are not ascertainable and, for that reason, are not included in the dollar amounts. In addition, the soft dollar amounts only includethe value of research and other services supplied by a third party to CIBC Asset Management Inc. (CAMI or the Portfolio Advisor) and any portfolio sub-advisors, as the value of the services supplied to the PortfolioAdvisor and any portfolio sub-advisors by the dealer is not ascertainable. When these services benefit more than one Fund, the costs are allocated among the Funds based on transaction activity or some other fairbasis as determined by the Portfolio Advisor and any portfolio sub-advisors.x
9. Related Party Transactions
CIBC and its affiliates have the following roles and responsibilities with respect to the Funds and receive the fees described below in connection with their roles and responsibilities. The Funds may hold securities ofCIBC. CIBC and its affiliates may also be involved in underwriting or lending to issuers of securities that may be held by the Funds, have purchased or sold securities from or to the Funds while acting as principal, havepurchased or sold securities from or to the Funds on behalf of another investment fund managed by CIBC or an affiliate, and also may have been involved as a counterparty to derivative transactions. Management feespayable and other accrued expenses on the Statements of Financial Position are amounts generally payable to a related party of the Fund.
Manager, Trustee, Portfolio Advisor, and certain Portfolio Sub-Advisors of the Funds
CIBC is the Manager, CIBC Trust Corporation is the Trustee, and CAMI is the Portfolio Advisor of each of the Funds. American Century Investment Management, Inc. (ACI) is a portfolio sub-advisor to certain Funds.Although not an affiliate, CIBC had previously owned a 41% equity interest in ACI. On December 21, 2015, CIBC announced that it entered into a definitive agreement to sell its minority position in ACI. The sale wascompleted on May 19, 2016.
The Manager also arranges for fund administrative services (other than advertising and promotional, which are the responsibility of the Manager), legal, investor servicing, and costs of unitholder reports,prospectuses, and other reports. The Manager is the registrar and transfer agent for the Funds and provides, or arranges for the provision of, all other administrative services required by the Funds. The dollar amount
21
p / 6 Notes to Financial Statements
(including all applicable taxes) of all fund administrative expenses (net of absorptions) that the Manager recovers from a Fund is reported in footnote Administrative and Other Fund Operating Expenses on theStatements of Comprehensive Income.
Brokerage Arrangements and Soft Dollars
The Portfolio Advisor generally delegates trading and execution authority to the portfolio sub-advisors. Where applicable, disclosure of the amounts of soft dollars can be found in the Brokerage Commission andFees schedule on the Statements of Comprehensive Income for each Fund.
The Portfolio Advisor and portfolio sub-advisors make decisions, including the selection of markets and dealers and the negotiation of commissions, with respect to the purchase and sale of portfolio securities, certainderivative products and the execution of portfolio transactions. Brokerage business may be allocated by the Portfolio Advisor and portfolio sub-advisors to CIBC World Markets Inc. and or CIBC World Markets Corp.,each a subsidiary of CIBC. The total commissions paid to related brokers in connection with portfolio transactions are reported in footnote Brokerage Commissions and Fees on the Statements of ComprehensiveIncome of each Fund.
CIBC World Markets Inc. and CIBC World Markets Corp. may also earn spreads on the sale of fixed income and other securities, and certain derivative products to the Funds. Dealers, including CIBC World Markets Inc.and CIBC World Markets Corp., may furnish goods and services, other than order execution, to the Portfolio Advisor and portfolio sub-advisors that process trades through them (referred to in the industry as “softdollar” arrangements). These goods and services are paid for with a portion of brokerage commissions and assist the Portfolio Advisor and portfolio sub-advisors with their investment decision-making services to theFund or relate directly to executing portfolio transactions on behalf of the Fund. As per terms of the portfolio sub-advisory agreements, such soft dollar arrangements are in compliance with applicable laws. Custodialfees directly related to portfolio transactions incurred by a Fund, otherwise payable by the Fund, shall be paid by CAMI, and/or dealer(s) directed by CAMI, up to the amount of the credits generated under soft dollararrangements from trading on behalf of the Fund, or a portion of the Fund, during that month. The total soft dollar payments paid by the Fund to related brokers are reported in footnote Brokerage Commissions andFees on the Statements of Comprehensive Income of each Fund. In addition, the Manager may enter into commission recapture arrangements with certain dealers with respect to the Funds. Any commissionrecaptured will be paid to the relevant Fund.
Custodian
The custodian holds all cash and securities for the Funds and ensures that those assets are kept separate from any other cash or securities that the custodian might be holding. The custodian also provides otherservices to the Funds including record keeping and processing of foreign exchange transactions. CIBC Mellon Trust Company is the custodian of the Funds (the Custodian). The Custodian may hire sub-custodians forthe Funds. The fees and spreads for services of the Custodian directly related to the execution of portfolio transactions by a Fund, or a portion of a Fund, are paid by CAMI and/or dealer(s) directed by CAMI up to theamount of the credits generated under soft dollar arrangements from trading on behalf of the Funds during that month. All other fees for the services of the Custodian are paid by the Manager, and charged tothe Funds on a recoverable basis. CIBC owns a 50% interest in CIBC Mellon Trust Company.
Service Provider
CIBC Mellon Global Securities Services Company (CIBC GSS) provides certain services to the Funds, including securities lending, fund accounting and reporting, and portfolio valuation. Such servicing fees are paid bythe Manager and charged to the Funds on a recoverable basis. CIBC indirectly owns a 50% interest in CIBC GSS.
The dollar amount paid by the Funds (including all applicable taxes) to CIBC Mellon Trust Company for custodial fees (net of absorptions) and to CIBC GSS for securities lending, fund accounting and reporting, andportfolio valuation (net of absorptions) for the annual periods ended December 31, 2016 and 2015 is reported in footnote Service Provider on the Statements of Comprehensive Income.
10. Hedging
Certain foreign currency denominated positions have been hedged, or partially hedged, by forward foreign currency contracts as part of the investment strategies of certain Pools. These hedges are indicated by ahedging reference number on the Schedule of Investment Portfolio and a corresponding hedging reference number on the Schedule of Derivative Assets and Liabilities Forward Foreign Currency Contracts for thosePools.
11. Collateral on Specified Derivatives
Short-term investments may be used as collateral for futures contracts outstanding with brokers.x
22
Independent Auditors’ Report
x
To the Unitholders ofxxxxxxxxx
xx
x..
Imperial Money Market Pool Imperial Canadian Equity Pool..
Imperial Short-Term Bond Pool Imperial U.S. Equity Pool..
Imperial Canadian Bond Pool Imperial International Equity Pool..
Imperial Canadian Diversified Income Pool Imperial Overseas Equity Pool..
Imperial International Bond Pool Imperial Emerging Economies Pool..
Imperial Equity High Income Pool Conservative Income Portfolio..
Imperial Canadian Dividend Income Pool Balanced Income Portfolio..
Imperial Global Equity Income Pool Enhanced Income Portfolio......
(collectively, the “Funds”)xx
We have audited the accompanying financial statements of each of the Funds, which comprise the statements of financial position as at December 31, 2016 and 2015, and the statements of comprehensive income,changes in net assets attributable to holders of redeemable units and cash flows for the periods then ended, and a summary of significant accounting policies and other explanatory information.
Management's Responsibility for the Financial StatementsManagement is responsible for the preparation and fair presentation of these financial statements in accordance with International Financial Reporting Standards, and for such internal control as managementdetermines is necessary to enable the preparation of financial statements that are free from material misstatement, whether due to fraud or error.
Auditors’ ResponsibilityOur responsibility is to express an opinion on these financial statements based on our audits. We conducted our audits in accordance with Canadian generally accepted auditing standards. Those standards requirethat we comply with ethical requirements and plan and perform the audit to obtain reasonable assurance about whether the financial statements are free from material misstatement.
An audit involves performing procedures to obtain audit evidence about the amounts and disclosures in the financial statements. The procedures selected depend on the auditors’ judgment, including the assessmentof the risks of material misstatement of the financial statements, whether due to fraud or error. In making those risk assessments, the auditors consider internal control relevant to the entity’s preparation and fairpresentation of the financial statements in order to design audit procedures that are appropriate in the circumstances, but not for the purpose of expressing an opinion on the effectiveness of the entity’s internalcontrol. An audit also includes evaluating the appropriateness of accounting policies used and the reasonableness of accounting estimates made by management, as well as evaluating the overall presentation of thefinancial statements.
We believe that the audit evidence we have obtained in our audits is sufficient and appropriate to provide a basis for our audit opinion.
OpinionIn our opinion, the financial statements present fairly, in all material respects, the financial position of each of the Funds as at December 31, 2016 and 2015, and their financial performance and their cash flows forthe periods then ended in accordance with International Financial Reporting Standards.xxxxxxxx
Toronto, CanadaMarch 20, 2017
23
Imperial PoolsIncome Generation Portfolios
CIBC
18 York Street, Suite 1300Toronto, Ontario
M5J 2T8
1-888-357-8777
Websitewww.cibc.com/mutualfunds