imperative needs to develop risk information
TRANSCRIPT

Imperative Needs to DevelopWater‐related Disaster Risk Information
June 23 2014
Hisaya SAWANO
Chief Researcher, International Center for Water Hazard and Risk managementunder the auspices of UNESCO (ICHARM), Japan (e‐mail: hs‐[email protected])
(Former Director of IWRM Strategy Office, Water and Disaster Management Bureau, MLIT, Japan)

What Information Is Missingin the Water‐Related Disaster Risk Management?
UNESCO International Hydrological Programme (2012): Eighth Phase (2014‐2021) Strategic Plan – Focal Area 1.1: Risk management as adaptation to global changes
There remains a big gap between the relatively accurate estimates by latest hydrological modelsand the information required to support decision making based on an evaluation of risk. Therelationship between flow volume or rain intensity and expected damages, such as number ofcasualties, economic losses, and affected area/population, are critical but poorly studied. There is aneed to establish methodologies to assess risk, considering the hydro‐climatological and socialconditions of the area of concern.
Compile, share, and analyze data on socio‐economic damages due to water‐relatedhazards, taking into consideration themagnitude of the hydrological hazard andthe social vulnerabilities.
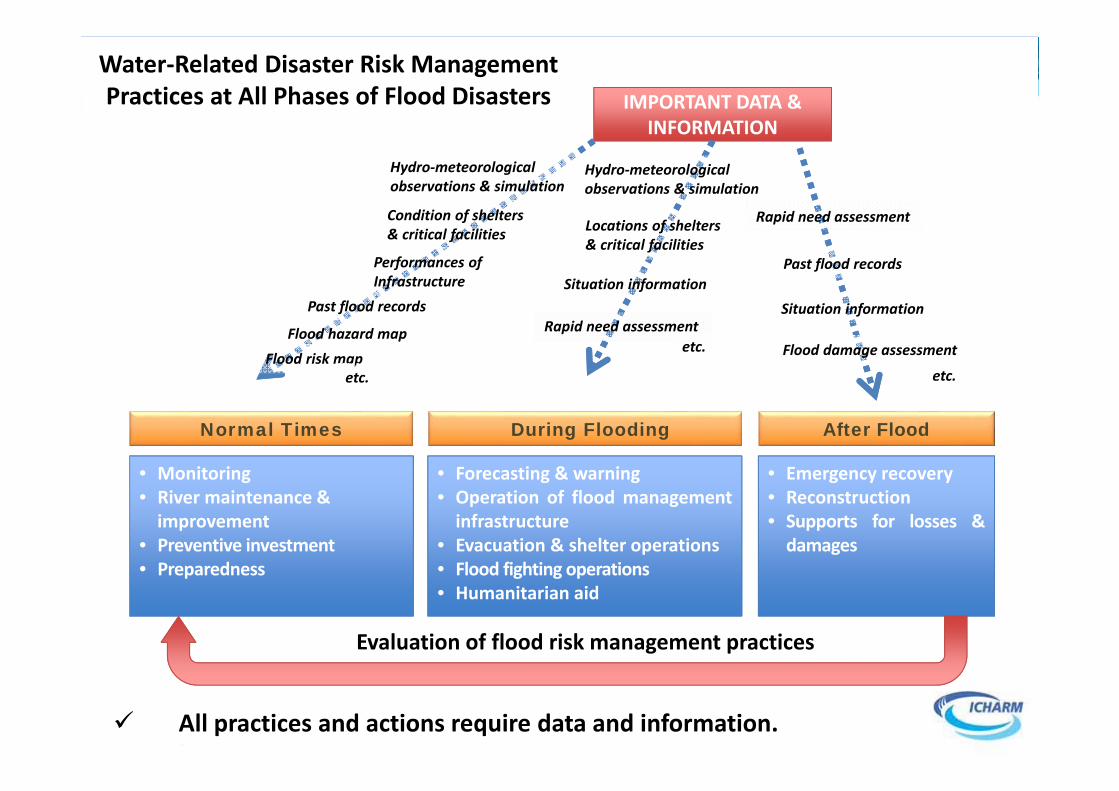
All practices and actions require data and information.
Water‐Related Disaster Risk Management Practices at All Phases of Flood Disasters
• Forecasting & warning• Operation of flood managementinfrastructure
• Evacuation & shelter operations• Flood fighting operations• Humanitarian aid
During Flooding
• Emergency recovery• Reconstruction• Supports for losses &damages
After Flood
• Monitoring• River maintenance &improvement
• Preventive investment• Preparedness
Normal Times
IMPORTANT DATA & INFORMATION
Evaluation of flood risk management practices
Hydro‐meteorological observations & simulation
Flood hazard map
Performances of Infrastructure
Flood risk map
Rapid need assessment
Hydro‐meteorological observations & simulation
Locations of shelters & critical facilities
Situation informationPast flood records Situation information
Rapid need assessment
Flood damage assessment
Past flood records
Condition of shelters & critical facilities
etc.
etc.
etc.
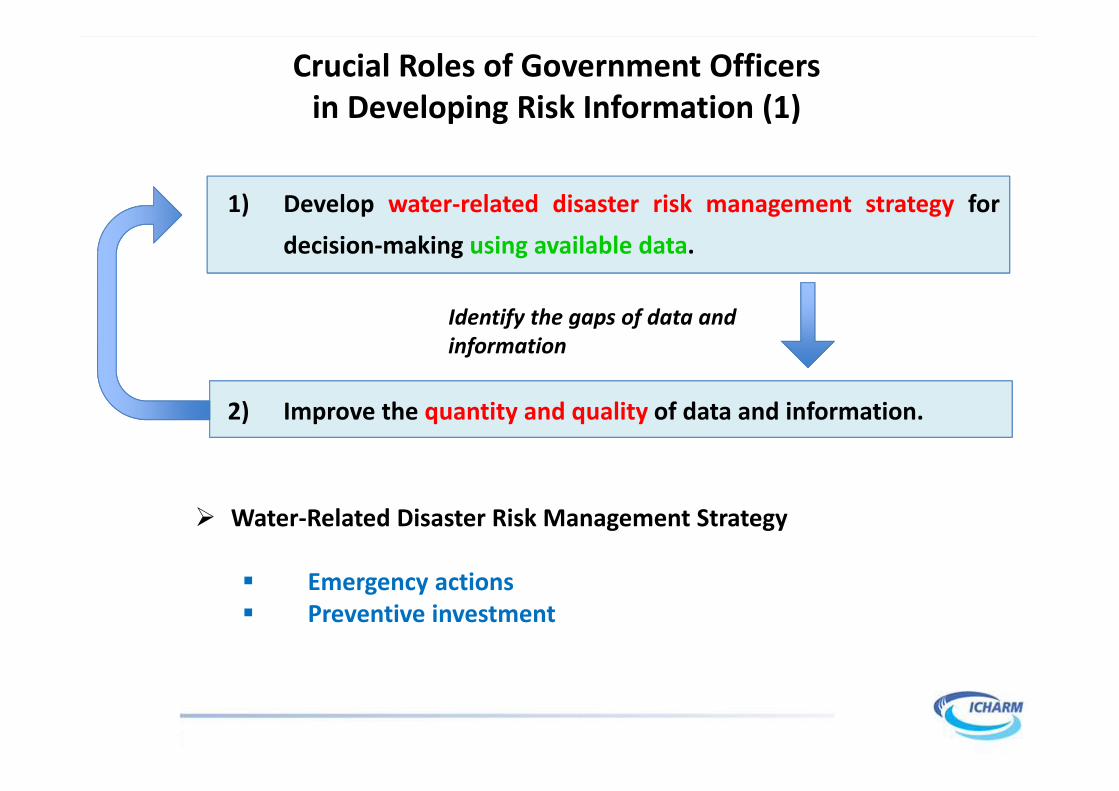
1) Develop water‐related disaster risk management strategy fordecision‐making using available data.
2) Improve the quantity and quality of data and information.
Crucial Roles of Government Officersin Developing Risk Information (1)
Identify the gaps of data and information
Water‐Related Disaster Risk Management Strategy
Emergency actions Preventive investment

Data/Information Requirement for Emergency Actions
Advanced Stage
First Stage
Example of the simple methodobservation system (gauging rainfall)
Grasp the situation precisely and in a timely manner.
‐ Simple method observation systems for weather and river condition‐ Simplified model for hydrologic simulation with satellite rainfall data
(BTOP, FID, IFAS, etc.)
‐ Development of network of telemetry systems‐ River cross section‐ increased number of stations‐ Advanced hydrologic simulation with local
measurements (RRI, etc.)
‐ X‐band data ‐ High‐resolution image data (camera, etc.)‐ Geographic data integration on GIS
Crucial Roles of Government Officersin Developing Risk Information (2)

Data/Information Requirement for Preventive Investment
‐ Risk evaluation
Show the current level of risk and the effectiveness of preventive investment to policy‐makers, practitioners, and the public
Hazard: data/information about hydrological characteristics Exposure: data/information about population, assets & socio‐
economic activities Vulnerability: data/information about socio‐economic conditions
and coping capacity
Number of casualties, socio‐economic damages and affected area/population
Crucial Roles of Government Officersin Developing Risk Information (3)

Hold the view that preventive investment isinevitable to protect people and economicgrowth from disasters.
Compile, share and analyze technical dataabout hazard, exposure, vulnerability, anddamage at all levels.
Conduct risk assessments at all levels in orderto understand how water‐related disasterscause casualties and economic damages.
Evaluate the effect of preventive investment interms of “information required to supportdecisionmaking”
Global datasets
Crucial Roles of Government Officersin Developing Risk Information (4)
Int. Research Organizationsand Academia
Theoretical knowledge
Hydrological models(especially, less data‐dependentsimulationmodels)
Risk assessment tools
Know‐how and experiences

A Pilot Practice
6/26/2014 8
Collaboration between ICHARM and Government of Philippines
Investigation of flood disaster risks in the Pampanga River Basin
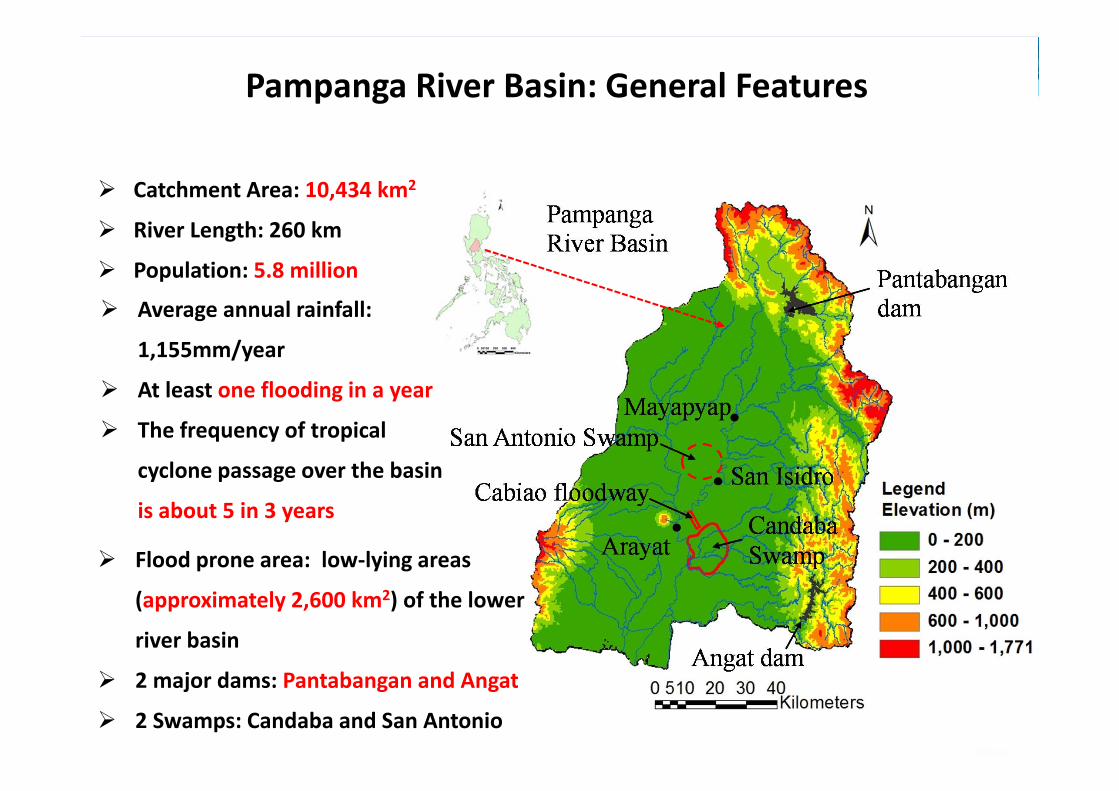
Pampanga River Basin: General Features
Catchment Area: 10,434 km2
River Length: 260 km
Population: 5.8 million
Average annual rainfall:
1,155mm/year
At least one flooding in a year
The frequency of tropical
cyclone passage over the basin
is about 5 in 3 years
Flood prone area: low‐lying areas
(approximately 2,600 km2) of the lower
river basin
2 major dams: Pantabangan and Angat
2 Swamps: Candaba and San Antonio
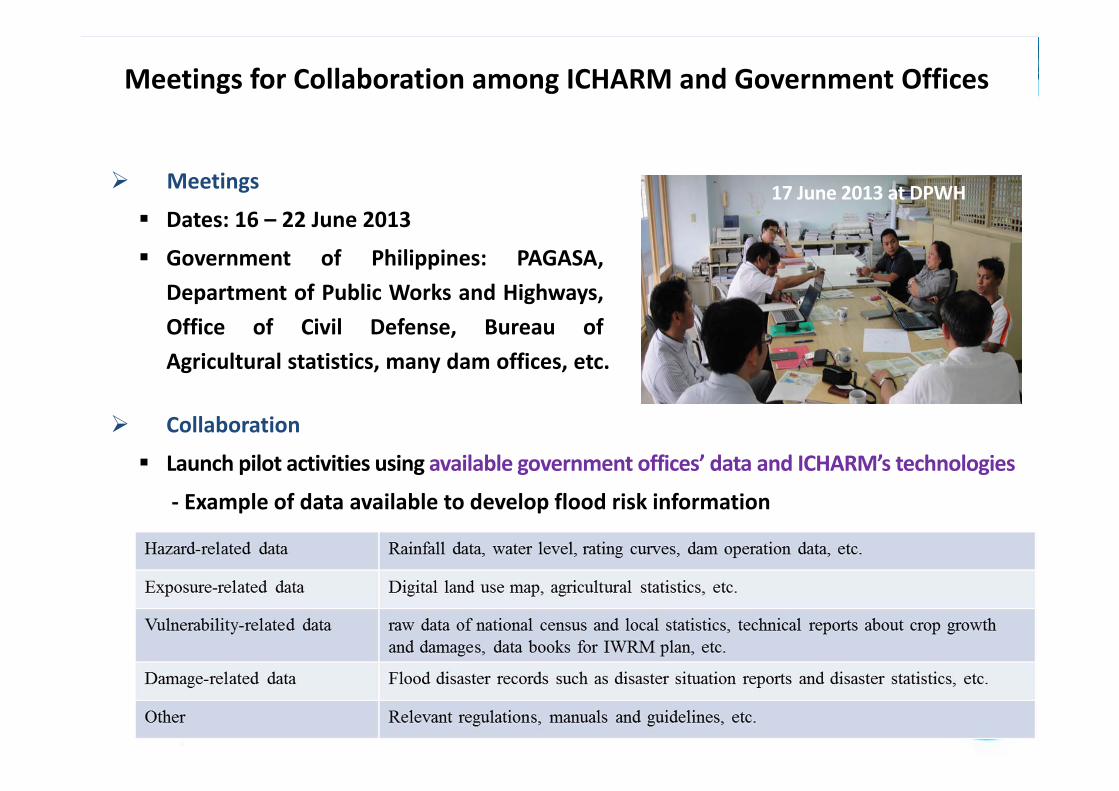
Meetings for Collaboration among ICHARM and Government Offices
Meetings
Dates: 16 – 22 June 2013
Government of Philippines: PAGASA,Department of Public Works and Highways,Office of Civil Defense, Bureau ofAgricultural statistics, many dam offices, etc.
Collaboration
Launch pilot activities using available government offices’ data and ICHARM’s technologies
‐ Example of data available to develop flood risk information
17 June 2013 at DPWH

Using ICHARM’s hydrologic simulation models (BTOP, FID, etc.) and collected data to develop the formula correlating human losses and flood conditions
Simulate the disaster for 50‐yr return period condition
Simulation results
Number of affected people (persons)Number of affected people (persons)
20,000
1
River basin boundaryRiver basin boundaryMunicipality expected to have deaths more than 1
Municipality expected to have deaths more than 1
(value)(value)Indicator for flood fatalities for the municipality
Indicator for flood fatalities for the municipality
The total number of affected people: 993,000 persons
The value of risk indicator: 301 (as an estimate correlated with the equivalent number of deaths)
Areas at high risk: Southern areas (municipalities in Pampanga and Bulacan provinces)
(1) Pulian: 22 (76,000 affected)(2) Calumpit: 17 (60,000 affected)(3) Macabebe: 16 (54,000 affected)
Identification of locations at higher risk due to floodfrom the viewpoint of human losses
Procedures: [data collection] [risk calculation formula building] [simulation]
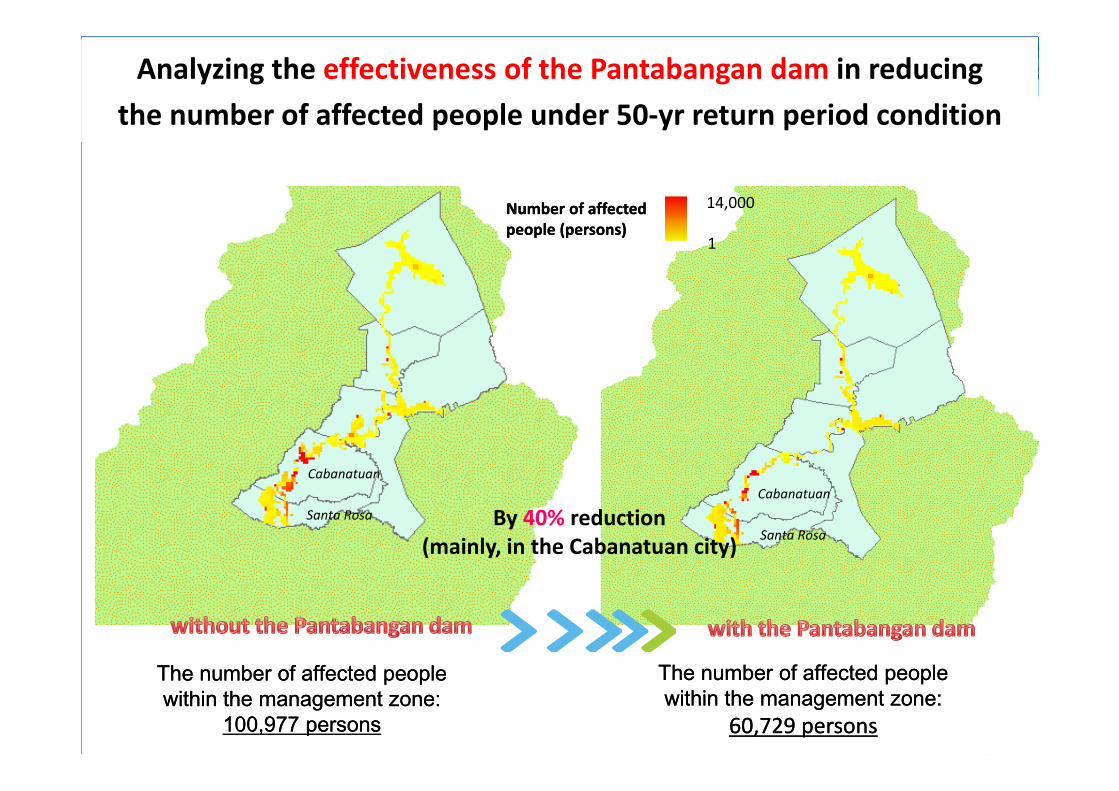
Analyzing the effectiveness of the Pantabangan dam in reducingthe number of affected people under 50‐yr return period condition
The number of affected peoplewithin the management zone:
100,977 persons
The number of affected peoplewithin the management zone:
100,977 persons
The number of affected peoplewithin the management zone:
60,729 persons
The number of affected peoplewithin the management zone:
60,729 persons
By 40% reduction(mainly, in the Cabanatuan city)
Number of affected people (persons)Number of affected people (persons)
14,000
1
Santa Rosa
Cabanatuan
Santa Rosa
Cabanatuan
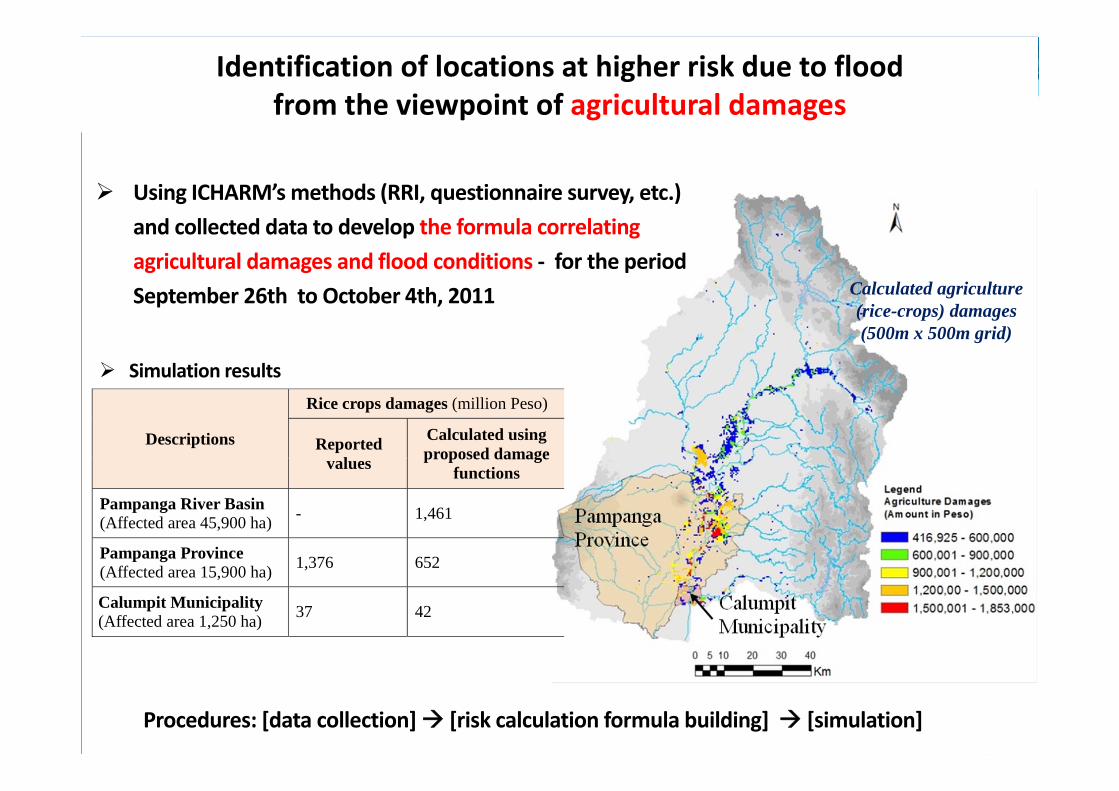
Using ICHARM’s methods (RRI, questionnaire survey, etc.) and collected data to develop the formula correlating agricultural damages and flood conditions ‐ for the period September 26th to October 4th, 2011
Identification of locations at higher risk due to floodfrom the viewpoint of agricultural damages
Descriptions
Rice crops damages (million Peso)
Reported values
Calculated using proposed damage
functions
Pampanga River Basin (Affected area 45,900 ha) - 1,461
Pampanga Province (Affected area 15,900 ha) 1,376 652
Calumpit Municipality (Affected area 1,250 ha) 37 42
Simulation results
Calculated agriculture (rice-crops) damages (500m x 500m grid)
Procedures: [data collection] [risk calculation formula building] [simulation]
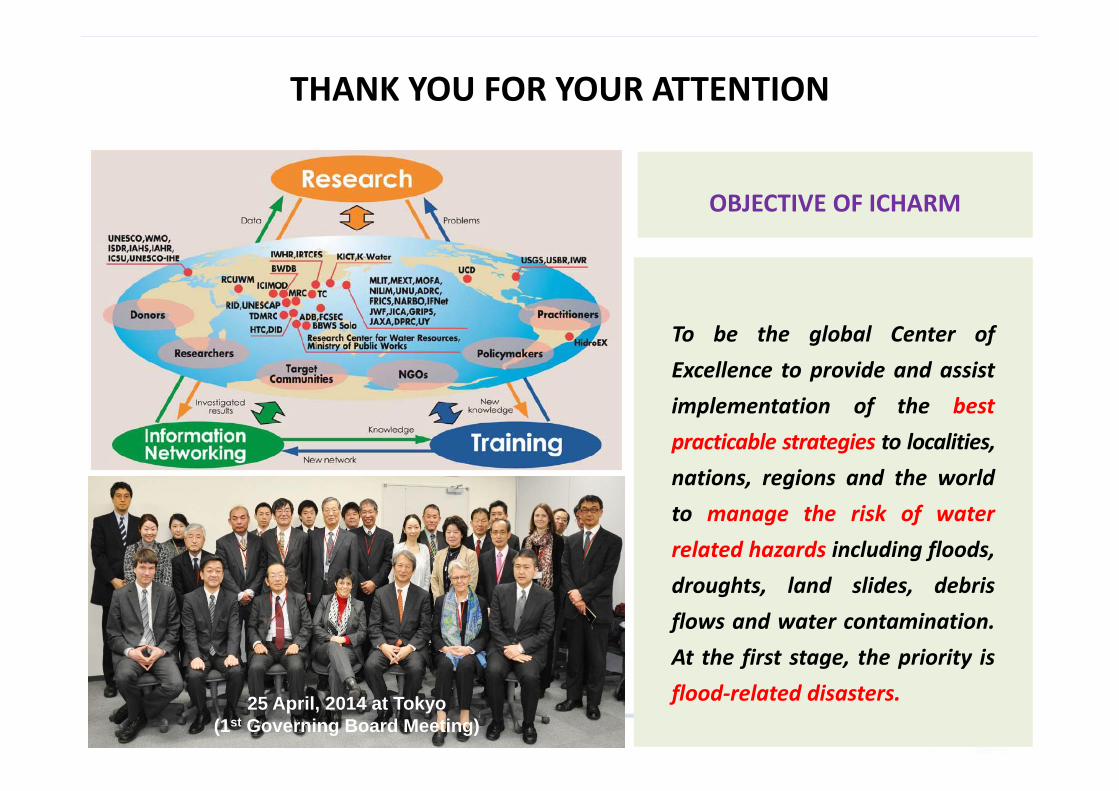
OBJECTIVE OF ICHARM
THANK YOU FOR YOUR ATTENTIONTHANK YOU FOR YOUR ATTENTION
25 April, 2014 at Tokyo(1st Governing Board Meeting)
To be the global Center ofExcellence to provide and assistimplementation of the bestpracticable strategies to localities,nations, regions and the worldto manage the risk of waterrelated hazards including floods,droughts, land slides, debrisflows and water contamination.At the first stage, the priority isflood‐related disasters.