impastor: a realistic surface display system
TRANSCRIPT

Vision Research 109 (2015) 166–177
Contents lists available at ScienceDirect
Vision Research
journal homepage: www.elsevier .com/locate /v isres
ImpastoR: A realistic surface display system
http://dx.doi.org/10.1016/j.visres.2014.10.0160042-6989/� 2014 Elsevier Ltd. All rights reserved.
E-mail address: [email protected]
James A. FerwerdaChester F. Carlson Center for Imaging Science, Rochester Institute of Technology, United States
a r t i c l e i n f o a b s t r a c t
Article history:Received 16 June 2014Received in revised form 18 September2014Available online 15 November 2014
Keywords:Material appearanceDisplay systemsTangible interfaces
In this paper we describe our efforts to create a surface display system that produces realistic representa-tions of real-world surfaces. Our system, based on a desktop PC with GPU hardware, LCD display, lightand position sensors, and custom graphics software, supports the photometrically accurate and visuallyrealistic real-time simulation and display of surfaces with complex color, gloss, and textural properties inreal-world lighting environments, and allows users to interact with and manipulate these virtual surfacesas naturally as if they were real ones. We explain the system design, illustrate its capabilities, describeexperiments we conducted to validate its fidelity, and discuss potential applications in material appear-ance research and computer-aided appearance design.
� 2014 Elsevier Ltd. All rights reserved.
1. Introduction
Surfaces are everywhere, and it is through the interaction oflight with surfaces that we perceive the properties of the world.We often create images of surfaces to document their properties,and it is self evident that images can serve quite well as surfacerepresentations. Nevertheless, the visual information we get froman image of a surface is not the same as the information providedby the surface itself.
We get a lot of visual information from interacting with sur-faces, either through direct manipulation, or through observing asurface from different viewpoints, and conventional images donot support either of these behaviors. For this reason we have beenworking to develop novel surface display systems Darling (2013),that harness the power of digital modeling, computer graphics,and sensor technologies to produce new kinds of images that lookand behave much more like the surfaces they represent.
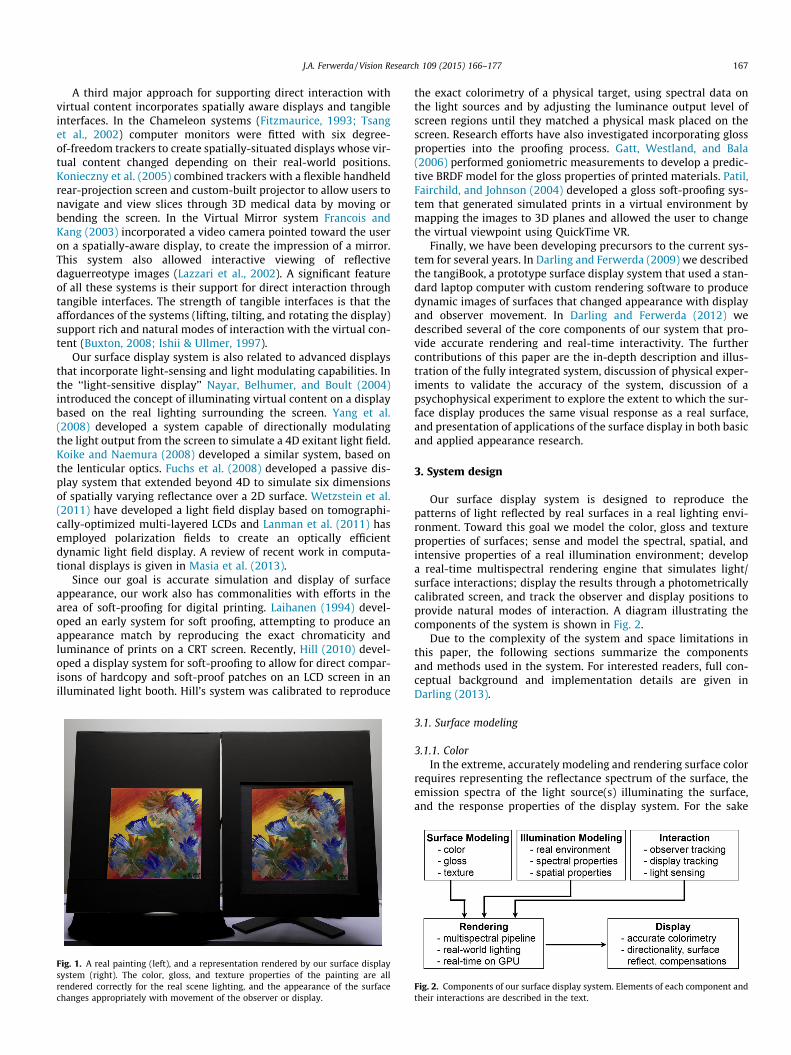
Fig. 1 shows ImpastoR, the surface display system described inthis paper. The system is displaying its rendering of an oil paintingmodel next to the painting itself. Computer graphics hardware andcustom software in the system allow the model to be rendered tothe screen in real-time, with lighting consistent with the real light-ing in the environment. Tracking systems change the renderingrealistically as the display and observer move. The experience pro-vided by the system is similar to that of holding and observing thereal painting.
Our goal is to develop a surface display system that bridges thereal and virtual worlds. To achieve this we have identified threerequirements: (1) the images produced by the system must be
realistic, accurately reproducing the appearance of real surfaces;(2) the images must be responsive, changing appearance appropri-ately with direct manipulation and changes in observer viewpoint;and (3) the images must be situated, appearing to be reflectivesurfaces in the observer’s environment. In the following sectionswe first discuss related efforts in this area. Next, we describe thecomponents of our system and illustrate its capabilities. We thendescribe experiments we conducted to validate the system’s fidelity.Finally, we outline potential applications and discuss future work.
2. Related work
There has been strong interest in developing natural interfacesfor interacting with virtual objects since the earliest days of com-puter graphics. Sutherland and colleagues, along with laying thefoundations for 3D graphics, did pioneering work on developinghead-mounted display systems and 3D input devices (Sutherland,1968; Vickers, 1974) Significant advances have been made in bothareas since that time (Burdea & Coiffet, 2003).
An alternative approach that supports direct interaction withvirtual content is the CAVE system (Cruz-Neira, Sandin, &DeFanti, 1993). Users are surrounded by projection screens thatdisplay computer graphics renderings, and tracking devicesprovide support for direct interaction. Another projector-basedapproach is represented by the shaderLamps and iLamps systemsdeveloped by Raskar et al. (2001) and Raskar et al. (2003), as wellas similar work by Bandyopadhyay, Raskar, and Fuchs (2001),Bimber and Raskar (2005) and (Konieczny & Meyer, 2006), wherewarped CG images are projected onto real three-dimensionalobjects to give the observer the experience of real objects withsurface properties that can be changed under computer control.
J.A. Ferwerda / Vision Research 109 (2015) 166–177 167
A third major approach for supporting direct interaction withvirtual content incorporates spatially aware displays and tangibleinterfaces. In the Chameleon systems (Fitzmaurice, 1993; Tsanget al., 2002) computer monitors were fitted with six degree-of-freedom trackers to create spatially-situated displays whose vir-tual content changed depending on their real-world positions.Konieczny et al. (2005) combined trackers with a flexible handheldrear-projection screen and custom-built projector to allow users tonavigate and view slices through 3D medical data by moving orbending the screen. In the Virtual Mirror system Francois andKang (2003) incorporated a video camera pointed toward the useron a spatially-aware display, to create the impression of a mirror.This system also allowed interactive viewing of reflectivedaguerreotype images (Lazzari et al., 2002). A significant featureof all these systems is their support for direct interaction throughtangible interfaces. The strength of tangible interfaces is that theaffordances of the systems (lifting, tilting, and rotating the display)support rich and natural modes of interaction with the virtual con-tent (Buxton, 2008; Ishii & Ullmer, 1997).
Our surface display system is also related to advanced displaysthat incorporate light-sensing and light modulating capabilities. Inthe ‘‘light-sensitive display’’ Nayar, Belhumer, and Boult (2004)introduced the concept of illuminating virtual content on a displaybased on the real lighting surrounding the screen. Yang et al.(2008) developed a system capable of directionally modulatingthe light output from the screen to simulate a 4D exitant light field.Koike and Naemura (2008) developed a similar system, based onthe lenticular optics. Fuchs et al. (2008) developed a passive dis-play system that extended beyond 4D to simulate six dimensionsof spatially varying reflectance over a 2D surface. Wetzstein et al.(2011) have developed a light field display based on tomographi-cally-optimized multi-layered LCDs and Lanman et al. (2011) hasemployed polarization fields to create an optically efficientdynamic light field display. A review of recent work in computa-tional displays is given in Masia et al. (2013).
Since our goal is accurate simulation and display of surfaceappearance, our work also has commonalities with efforts in thearea of soft-proofing for digital printing. Laihanen (1994) devel-oped an early system for soft proofing, attempting to produce anappearance match by reproducing the exact chromaticity andluminance of prints on a CRT screen. Recently, Hill (2010) devel-oped a display system for soft-proofing to allow for direct compar-isons of hardcopy and soft-proof patches on an LCD screen in anilluminated light booth. Hill’s system was calibrated to reproduce
Fig. 1. A real painting (left), and a representation rendered by our surface displaysystem (right). The color, gloss, and texture properties of the painting are allrendered correctly for the real scene lighting, and the appearance of the surfacechanges appropriately with movement of the observer or display.
the exact colorimetry of a physical target, using spectral data onthe light sources and by adjusting the luminance output level ofscreen regions until they matched a physical mask placed on thescreen. Research efforts have also investigated incorporating glossproperties into the proofing process. Gatt, Westland, and Bala(2006) performed goniometric measurements to develop a predic-tive BRDF model for the gloss properties of printed materials. Patil,Fairchild, and Johnson (2004) developed a gloss soft-proofing sys-tem that generated simulated prints in a virtual environment bymapping the images to 3D planes and allowed the user to changethe virtual viewpoint using QuickTime VR.
Finally, we have been developing precursors to the current sys-tem for several years. In Darling and Ferwerda (2009) we describedthe tangiBook, a prototype surface display system that used a stan-dard laptop computer with custom rendering software to producedynamic images of surfaces that changed appearance with displayand observer movement. In Darling and Ferwerda (2012) wedescribed several of the core components of our system that pro-vide accurate rendering and real-time interactivity. The furthercontributions of this paper are the in-depth description and illus-tration of the fully integrated system, discussion of physical exper-iments to validate the accuracy of the system, discussion of apsychophysical experiment to explore the extent to which the sur-face display produces the same visual response as a real surface,and presentation of applications of the surface display in both basicand applied appearance research.
3. System design
Our surface display system is designed to reproduce thepatterns of light reflected by real surfaces in a real lighting envi-ronment. Toward this goal we model the color, gloss and textureproperties of surfaces; sense and model the spectral, spatial, andintensive properties of a real illumination environment; developa real-time multispectral rendering engine that simulates light/surface interactions; display the results through a photometricallycalibrated screen, and track the observer and display positions toprovide natural modes of interaction. A diagram illustrating thecomponents of the system is shown in Fig. 2.
Due to the complexity of the system and space limitations inthis paper, the following sections summarize the componentsand methods used in the system. For interested readers, full con-ceptual background and implementation details are given inDarling (2013).
3.1. Surface modeling
3.1.1. ColorIn the extreme, accurately modeling and rendering surface color
requires representing the reflectance spectrum of the surface, theemission spectra of the light source(s) illuminating the surface,and the response properties of the display system. For the sake
Fig. 2. Components of our surface display system. Elements of each component andtheir interactions are described in the text.

Fig. 4. Color accurate multispectral rendering. Color patches with different spectrathat are metameric under source A are correctly rendered as matching, and are alsocorrectly rendered as not matching under source D65. The Supplementary videoshows that the lighting changes are sensed and color changes are rendered in real-time.
168 J.A. Ferwerda / Vision Research 109 (2015) 166–177
of performance, these full spectral calculations are typicallyreduced to products of normalized RGB values that are then scaledand sent as RGB digital counts to the display. While this approachis widespread, it can lead to significant errors in color rendering(Hall, 1989).
To preserve color accuracy while also supporting real-timegraphics performance, we developed a multispectral renderingpipeline. Fig. 3 illustrates the pipeline, where surface and sourcespectra are each resampled into signals in six channels coded asqd values in the Ward (1992) light reflection model with Dür(2006) corrections (hereafter referred to as the Ward–Dür model).
Since one of our interests was in accurately simulating artwork,our channel-sampling functions were derived from analysis of thespectral reflectance properties of an artist’s material database anda set of standard illuminants. While these materials and illumi-nants had a wide variety of spectral properties, and we verifiedthe accuracy of the sampling and rendering processes for surfacesof interest, six channels is not a magic number, and accuratelyrendering other materials and illuminants might require the useof more (or fewer) sampling functions with properties determinedby the dataset.
The sampled spectral values were then used by a customGPU-based shader we developed, to provide colorimetricallyaccurate renderings at real-time rates. Representative output ofthe system is shown in Fig. 4, where metameric color patches arecorrectly rendered as matching under tungsten light (source A)but not under daylight (source D65).
3.1.2. GlossReal surfaces often vary in gloss as well as color. We modeled
surface gloss using the specular components of the Ward–Dürmodel, where qs represents the specular reflectance, and a is aroughness parameter that controls the width of the specular lobe.
To model surfaces with spatially-varying reflectance properties,we stored the Ward–Dür parameters in image maps. Fig. 5 shows apainting with complex spatially-varying color and gloss properties,and three of the six image maps used to represent their Ward–Dürparameters. All parameters can be specified on a per-channel, per-pixel basis, offering great flexibility in surface reflectance modeling.
3.1.3. TextureIn addition to color and gloss, real surfaces often vary in height
and orientation, which produce complex patterns of shading andshadowing that create rich visual textures.
Fig. 3. Multispectral rendering pipeline. Surface reflectance spectra (Rk) and lightsource emission (Sk) spectra are multiplied by optimized sampling functions andintegrated into six-channel representations (R6ch, S6ch). The products of theserepresentations (U6ch) are then transformed through a 3 � 6 matrix into CIE XYZtristimulus values. This pipeline preserves color accuracy while providing real-timeperformance.
Fig. 5. System representation of surface properties (a) full rendering, (b) diffusecolor (qd), (c) specular reflectance map (qs), and (d) specular roughness map (a).(For interpretation of the references to color in this figure legend, the reader isreferred to the web version of this article.)
We used surface normal maps to represent surface orientationand height maps to represent surface elevation at each surfacepoint (Peercy, Airey, & Cabral, 1997). The normal maps were usedduring rendering to calculate surface shading, and the height mapswere used to derive horizon maps to calculate shadowing effects(Max, 1988; Sloan & Cohen, 2000). Fig. 6 shows a painting withcomplex textural properties and a rendering produced by our sys-tem of the shading and shadowing effects caused by this texture.
3.2. Illumination modeling
Our system models a real-world lighting environment to allowrendered surfaces to appear consistent with real surfaces at thesame position in the environment. For our lighting environment,we used a professional color evaluation booth (GTI ColorMatcher)

Fig. 6. System representation of texture. (a) Full rendering and (b) texture-onlyrendering showing shading and shadowing effects.
Fig. 7. Real-world lighting environment used in our system with overlays of world,screen and light source coordinate systems.
Fig. 8. Sources available in the light booth with overlays showing the point sourceapproximations produced by the median cut algorithm (see Section 3.5).
J.A. Ferwerda / Vision Research 109 (2015) 166–177 169
with switchable incandescent (CIE source A) and daylight fluores-cent (CIE D50, D65) light sources (see Fig. 8). We modeled the spec-tral, spatial, and intensive properties of these sources.
Fig. 9. Luminance fall-off for our LCD display as a function of horizontal detectorangle. The two curves plot the results for portrait and landscape modes. Theseeffects were compensated for during rendering.
3.2.1. Spectral propertiesTo account for the spectral properties of the sources, we
monitored the light in the booth using an Ocean OpticsUSB2000+ spectrometer, which sampled the visible spectrum at5 Hz. The sensor was attached to a pole behind the display screenand directed toward the top of the booth. The 10 nm spectral datafrom the sensor was resampled into the multispectral representa-tion described earlier and used in the rendering process. The real-time spectral sensing allowed the system to respond automaticallywhen sources were switched.
3.2.2. Geometry and luminanceWe also modeled the spatial luminance distributions of the
light sources. We captured these properties in an offline processby taking high-dynamic range images of each source with a cali-brated digital camera. We then mapped these images to the ceilingof a geometric model of the booth and used them as illuminationmaps when rendering. During the rendering process the illumina-tion map for the active source was chosen automatically using aclassifier that selected the appropriate map given the sensedspectral data.
3.3. Interaction tracking
3.3.1. Observer trackingWe used a NaturalPoint TrackIR infra-red (IR) tracking system
to track the position of an observer using the system. The observerwore a headband with a pattern of IR reflective dots attached. Thedots were illuminated by an IR source, and the pattern wascaptured by an IR camera. The tracker’s sampling rate was120 Hz, and its angular resolution was approximately 0.0065�within a 46� field of view. A software API used this informationto track the position of the observer relative to the camera. Weused this tracking data with offsets to calculate the observer’s posi-tion relative to the lighting environment. The geometric relationsused to determine the observer’s position are illustrated in Figs. 7and 10.
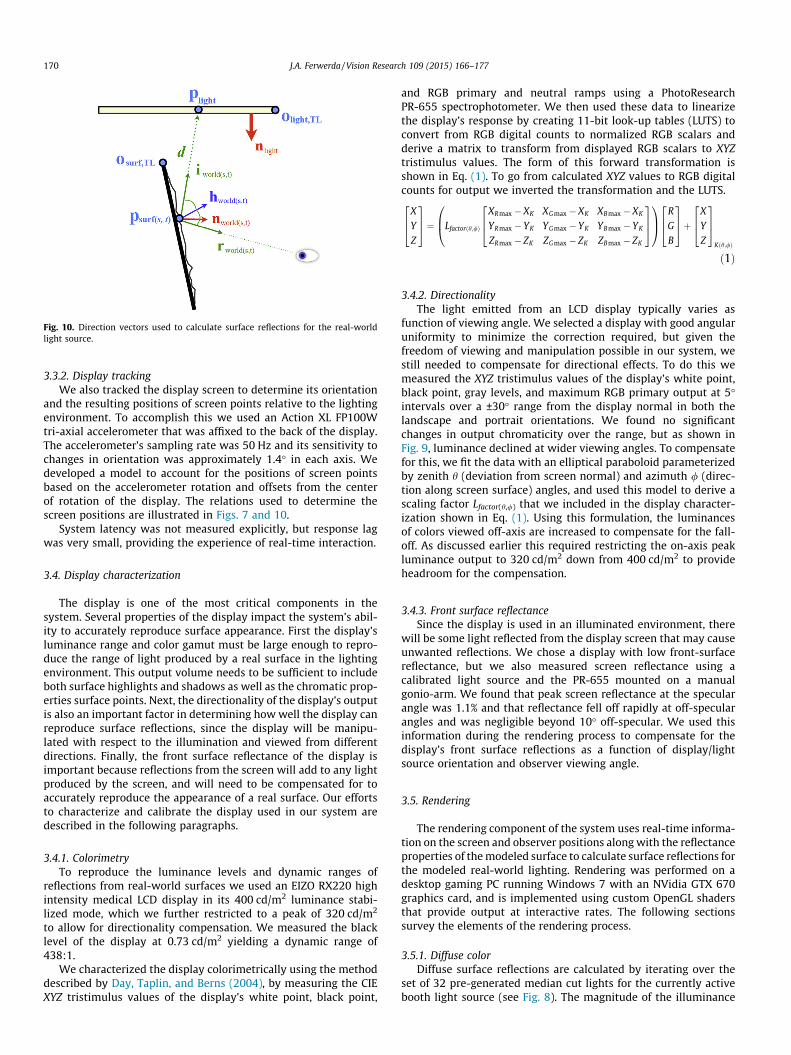
Fig. 10. Direction vectors used to calculate surface reflections for the real-worldlight source.
170 J.A. Ferwerda / Vision Research 109 (2015) 166–177
3.3.2. Display trackingWe also tracked the display screen to determine its orientation
and the resulting positions of screen points relative to the lightingenvironment. To accomplish this we used an Action XL FP100Wtri-axial accelerometer that was affixed to the back of the display.The accelerometer’s sampling rate was 50 Hz and its sensitivity tochanges in orientation was approximately 1.4� in each axis. Wedeveloped a model to account for the positions of screen pointsbased on the accelerometer rotation and offsets from the centerof rotation of the display. The relations used to determine thescreen positions are illustrated in Figs. 7 and 10.
System latency was not measured explicitly, but response lagwas very small, providing the experience of real-time interaction.
3.4. Display characterization
The display is one of the most critical components in thesystem. Several properties of the display impact the system’s abil-ity to accurately reproduce surface appearance. First the display’sluminance range and color gamut must be large enough to repro-duce the range of light produced by a real surface in the lightingenvironment. This output volume needs to be sufficient to includeboth surface highlights and shadows as well as the chromatic prop-erties surface points. Next, the directionality of the display’s outputis also an important factor in determining how well the display canreproduce surface reflections, since the display will be manipu-lated with respect to the illumination and viewed from differentdirections. Finally, the front surface reflectance of the display isimportant because reflections from the screen will add to any lightproduced by the screen, and will need to be compensated for toaccurately reproduce the appearance of a real surface. Our effortsto characterize and calibrate the display used in our system aredescribed in the following paragraphs.
3.4.1. ColorimetryTo reproduce the luminance levels and dynamic ranges of
reflections from real-world surfaces we used an EIZO RX220 highintensity medical LCD display in its 400 cd/m2 luminance stabi-lized mode, which we further restricted to a peak of 320 cd/m2
to allow for directionality compensation. We measured the blacklevel of the display at 0.73 cd/m2 yielding a dynamic range of438:1.
We characterized the display colorimetrically using the methoddescribed by Day, Taplin, and Berns (2004), by measuring the CIEXYZ tristimulus values of the display’s white point, black point,
and RGB primary and neutral ramps using a PhotoResearchPR-655 spectrophotometer. We then used these data to linearizethe display’s response by creating 11-bit look-up tables (LUTS) toconvert from RGB digital counts to normalized RGB scalars andderive a matrix to transform from displayed RGB scalars to XYZtristimulus values. The form of this forward transformation isshown in Eq. (1). To go from calculated XYZ values to RGB digitalcounts for output we inverted the transformation and the LUTS.
X
Y
Z
264
375¼ Lfactor h;/ð Þ
XR max �XK XG max �XK XB max �XK
YR max � YK YG max � YK YB max � YK
ZR max � ZK ZG max � ZK ZB max � ZK
264
375
0B@
1CA
R
G
B
264
375þ
X
Y
Z
264
375
Kðh;/Þ
ð1Þ
3.4.2. DirectionalityThe light emitted from an LCD display typically varies as
function of viewing angle. We selected a display with good angularuniformity to minimize the correction required, but given thefreedom of viewing and manipulation possible in our system, westill needed to compensate for directional effects. To do this wemeasured the XYZ tristimulus values of the display’s white point,black point, gray levels, and maximum RGB primary output at 5�intervals over a ±30� range from the display normal in both thelandscape and portrait orientations. We found no significantchanges in output chromaticity over the range, but as shown inFig. 9, luminance declined at wider viewing angles. To compensatefor this, we fit the data with an elliptical paraboloid parameterizedby zenith h (deviation from screen normal) and azimuth / (direc-tion along screen surface) angles, and used this model to derive ascaling factor Lfactor(h,/) that we included in the display character-ization shown in Eq. (1). Using this formulation, the luminancesof colors viewed off-axis are increased to compensate for the fall-off. As discussed earlier this required restricting the on-axis peakluminance output to 320 cd/m2 down from 400 cd/m2 to provideheadroom for the compensation.
3.4.3. Front surface reflectanceSince the display is used in an illuminated environment, there
will be some light reflected from the display screen that may causeunwanted reflections. We chose a display with low front-surfacereflectance, but we also measured screen reflectance using acalibrated light source and the PR-655 mounted on a manualgonio-arm. We found that peak screen reflectance at the specularangle was 1.1% and that reflectance fell off rapidly at off-specularangles and was negligible beyond 10� off-specular. We used thisinformation during the rendering process to compensate for thedisplay’s front surface reflections as a function of display/lightsource orientation and observer viewing angle.
3.5. Rendering
The rendering component of the system uses real-time informa-tion on the screen and observer positions along with the reflectanceproperties of the modeled surface to calculate surface reflections forthe modeled real-world lighting. Rendering was performed on adesktop gaming PC running Windows 7 with an NVidia GTX 670graphics card, and is implemented using custom OpenGL shadersthat provide output at interactive rates. The following sectionssurvey the elements of the rendering process.
3.5.1. Diffuse colorDiffuse surface reflections are calculated by iterating over the
set of 32 pre-generated median cut lights for the currently activebooth light source (see Fig. 8). The magnitude of the illuminance

J.A. Ferwerda / Vision Research 109 (2015) 166–177 171
E at each screen location is calculated from the physical light-to-screen-pixel distance and the orientation of the normal-mappedpixel relative to each light source
E ¼X32
n¼1
LnðNsurf � InÞðNlight � �InÞd2
n
AP
� �ð2Þ
where In is the surface-point to light-point unit vector for the nthlight point, dn is the distance between these points in meters, Ln isthe summed luminance stored in the nth light point, Nsurf is the sur-face normal at the point on the virtual object, Nlight is the normal tothe plane of the area light, and the area term A/P is the physical areaof the captured light surface divided by the number of pixels in thelight image. This physical illuminance value is used to scale theproduct of the normalized multispectral illumination representa-tion Sj and the multispectral diffuse reflectance qd,j to determinethe per-channel diffuse reflections on a luminance-based scale:
Lout;j ¼ðqd;jÞðSjÞ
p E; for j ¼ 1 to 6 ð3Þ
A similar calculation is performed to estimate the real diffusereflection from the front surface of the display screen(qd = 0.002). This value is subtracted from the calculated diffusereflection to help mitigate the screen surface flare.
3.5.2. Specular reflectionsSpecular reflections are rendered using the specular term of the
Ward–Dür model:
qbrdf ðhi;/i; hr;/rÞ ¼ qs1
coshicoshr
expð�tan2ðhhÞ=a2Þ4pa2 ð4Þ
where qs is the specular reflectance, a is a roughness parameter rep-resenting the width of the specular lobe, and hh is the angle betweenthe surface normal and the half vector of the illumination anddetection vectors.
One of our principal challenges in rendering specular reflectionswas developing a workflow that could produce accurate renderingsat real-time rates. While median cut point lighting (Viriyothai &Debevec, 2009) provides good accuracy and high performancewhen rendering low gloss surfaces, renderings of high gloss sur-faces can show artifacts. Conversely, filtered importance sampling(Colbert, Premoze, & François, 2010) often shows artifacts whenrendering low gloss surfaces, but excels in accuracy and perfor-mance in the high gloss range. To produce accurate renderings,at real-time rates, for surfaces with a wide range of gloss proper-ties, we developed a hybrid approach that automatically switchedbetween the two techniques on a per-pixel basis, using a customerror minimization metric.
3.5.3. ShadowingSince the system was designed to simulate the appearance of
surfaces with texture or ‘‘impasto’’, surface relief was modeledusing image-based height maps. Shadowing effects were repre-sented using horizon shadow maps derived from the height maps(Max, 1988; Sloan & Cohen, 2000). For each surface point, a horizonmap stored the critical elevation angle at which light would beblocked from reaching that point from a given azimuthal direction.We divided azimuth into 18 segments of 20� each. Employing threechannels per image, the 18 horizon maps were stored as six float-ing-point images. In the rendering shader, the horizon map corre-sponding to the calculated azimuth angle to a light source wasselected on a per-pixel basis. If the elevation angle to a sourcewas below the critical angle stored in the map, that source wasnot included in the rendering calculation for that pixel, producingthe shadowing effect.
3.5.4. Lighting coordinate systemIn the system, the geometric relationships between the real-
world light source, surface/display, and observer are considered,and the rendering equation is evaluated with respect to thereal-world coordinate system shown in Fig. 7. When renderingwith filtered importance sampling, the illumination direction isdetermined using the Ward–Dür model half-vector (calculatedfrom the accelerometer orientation data, modified by the surfacenormal and the real viewing vector of the observer derived fromthe IR tracker data). The four direction vectors required to evaluatesurface reflections (rworld, hworld, nworld and iworld) are shown inFig. 10. Using these vectors, it is possible to calculate the physicalposition on the light source that will be intersected by the illumi-nation vector, so that the corresponding lookup into the lightsource illumination map can be performed.
The position on the light source plane is determined by ray-polygon intersection. The distance along the illumination vectorfrom the object surface position (s, t) to the light plane is calculatedby:
d ¼ðoTL;light � psurf ðs;tÞÞ � ðnlightÞðiworldðs;tÞÞ � ðnlightÞ
ð5Þ
where psurf(s,t) is the physical position of the object surface point,and the light plane is specified by the plane normal nlight and a pointon the plane oTL,light. The light intersection point plight is found bymoving a distance d along the illumination unit vector:
p ¼ dðiworldðs;tÞÞ þ psurf ðs;tÞ ð6Þ
Fig. 7 illustrates that to determine the corresponding pixel inthe light source luminance image, the 2D parameterized positionon the light source is found by determining the 3D position of thispoint relative to the origin of the light coordinate system:
prelative ¼ ðplight � oTL;lightÞ ð7Þ
and then a pseudo-inverse calculation is used to determine the unitpixel coordinates (a, b) for the intersection:
a
b
� �¼ pinv
lA � Ax lB � Bx
lA � Ay lB � By
lA � Az lB � Bz
264
375
0B@
1CAprelative ð8Þ
where A = (Ax, Ay, Az) and B = (Bx, By, Bz) are the unit left-to-right andtop-to-bottom directions of the light source rectangle in worldspace, and lA and lB are the physical dimensions of the light source,as illustrated in Fig. 7. These (a, b) values serve as the texture lookupcoordinates to index the light source luminance image to calculatesurface reflections.
4. System capabilities
The system described above meets the three requirements weset out for surface display systems. First, the images produced bythe system are realistic, and faithfully represent color, gloss andtexture of modeled surfaces. Second, the images are responsive,and change appearance appropriately with direct manipulationand changes in user viewpoint. And third, the images are situatedwith respect to the scene illumination and the observer, andappear to be an integral part of the user’s environment. In the fol-lowing sections we illustrate the system’s capabilities.
4.1. Color
Fig. 11 illustrates the system’s color simulation capabilities.Each sub-image shows a real Macbeth ColorChecker chart on theleft and the chart image produced by the system on the right. Notefirst that the color rendering is realistic due to the multispectral
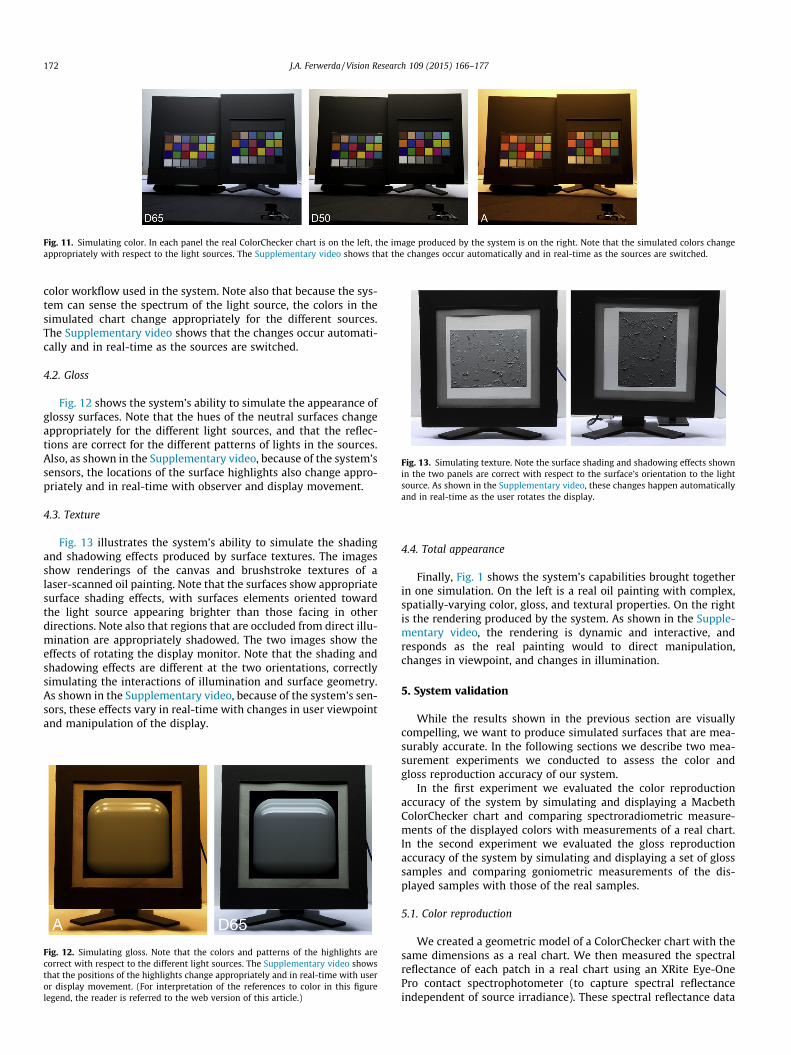
Fig. 11. Simulating color. In each panel the real ColorChecker chart is on the left, the image produced by the system is on the right. Note that the simulated colors changeappropriately with respect to the light sources. The Supplementary video shows that the changes occur automatically and in real-time as the sources are switched.
Fig. 13. Simulating texture. Note the surface shading and shadowing effects shownin the two panels are correct with respect to the surface’s orientation to the lightsource. As shown in the Supplementary video, these changes happen automaticallyand in real-time as the user rotates the display.
172 J.A. Ferwerda / Vision Research 109 (2015) 166–177
color workflow used in the system. Note also that because the sys-tem can sense the spectrum of the light source, the colors in thesimulated chart change appropriately for the different sources.The Supplementary video shows that the changes occur automati-cally and in real-time as the sources are switched.
4.2. Gloss
Fig. 12 shows the system’s ability to simulate the appearance ofglossy surfaces. Note that the hues of the neutral surfaces changeappropriately for the different light sources, and that the reflec-tions are correct for the different patterns of lights in the sources.Also, as shown in the Supplementary video, because of the system’ssensors, the locations of the surface highlights also change appro-priately and in real-time with observer and display movement.
4.3. Texture
Fig. 13 illustrates the system’s ability to simulate the shadingand shadowing effects produced by surface textures. The imagesshow renderings of the canvas and brushstroke textures of alaser-scanned oil painting. Note that the surfaces show appropriatesurface shading effects, with surfaces elements oriented towardthe light source appearing brighter than those facing in otherdirections. Note also that regions that are occluded from direct illu-mination are appropriately shadowed. The two images show theeffects of rotating the display monitor. Note that the shading andshadowing effects are different at the two orientations, correctlysimulating the interactions of illumination and surface geometry.As shown in the Supplementary video, because of the system’s sen-sors, these effects vary in real-time with changes in user viewpointand manipulation of the display.
Fig. 12. Simulating gloss. Note that the colors and patterns of the highlights arecorrect with respect to the different light sources. The Supplementary video showsthat the positions of the highlights change appropriately and in real-time with useror display movement. (For interpretation of the references to color in this figurelegend, the reader is referred to the web version of this article.)
4.4. Total appearance
Finally, Fig. 1 shows the system’s capabilities brought togetherin one simulation. On the left is a real oil painting with complex,spatially-varying color, gloss, and textural properties. On the rightis the rendering produced by the system. As shown in the Supple-mentary video, the rendering is dynamic and interactive, andresponds as the real painting would to direct manipulation,changes in viewpoint, and changes in illumination.
5. System validation
While the results shown in the previous section are visuallycompelling, we want to produce simulated surfaces that are mea-surably accurate. In the following sections we describe two mea-surement experiments we conducted to assess the color andgloss reproduction accuracy of our system.
In the first experiment we evaluated the color reproductionaccuracy of the system by simulating and displaying a MacbethColorChecker chart and comparing spectroradiometric measure-ments of the displayed colors with measurements of a real chart.In the second experiment we evaluated the gloss reproductionaccuracy of the system by simulating and displaying a set of glosssamples and comparing goniometric measurements of the dis-played samples with those of the real samples.
5.1. Color reproduction
We created a geometric model of a ColorChecker chart with thesame dimensions as a real chart. We then measured the spectralreflectance of each patch in a real chart using an XRite Eye-OnePro contact spectrophotometer (to capture spectral reflectanceindependent of source irradiance). These spectral reflectance data

J.A. Ferwerda / Vision Research 109 (2015) 166–177 173
were then resampled into our multispectral representation andused to define the qd reflectance values of patches in the model.The spectral power distributions of the three light sources in ourbooth were measured using a PhotoResearch PR-655 tele-spectro-radiometer and a PTFE white reflector (to capture spectral irradi-ance independent of surface reflectance) Similar to above, thesedata were then resampled into our multispectral representation.The chart model was then rendered using each light source andthe resulting images were displayed. For each of the chart/sourcerenderings, the light spectra emitted by the displayed patches weremeasured with the PR-655.
XYZ tristimulus values for each of the patches were calculatedusing the CIE 2� standard observer color matching functions. Inaddition a set of XYZ values for the pre-display simulations werecalculated to allow analysis of the display’s contributions to anycolor differences. The sets of XYZ values were converted to CIELABcoordinates and compared using the CIEDE2000 color differenceformula.
The mean, 90th percentile and maximum CIEDE2000 color dif-ferences between the real and simulated charts are shown in themiddle column of Table 1. The color differences between the realand displayed charts are shown in the right portion of the table.As shown on the left, the six-channel multispectral workflowprovided a very good level of color accuracy across lighting con-ditions. The mean CIEDE2000 for each of the D50 and D65sources was 0.4. While there was increased error for tungstensource A, the mean CIEDE2000 value was still only 0.8. For refer-ence, typical threshold values for perceived color differences havebeen found to be between 2.0 and 3.0 (Mahy, Van Eycken, &Oosterlinck, 1994).
As summarized in the right column of Table 1, the displayedoutput showed only slightly higher color differences than thesimulations for the D65 and D50 sources, but the differences inincreased dramatically in the displayed image simulated usingsource A. Here the maximum error was 14.0, with a 90th percen-tile error of 11.0. These errors can be attributed to screen gamutlimitations. Under source A, six patches (orange, yellow, orange-yellow, yellow-green, red, and black) fell outside of the display’sgamut and could not be physically reproduced by the display Asthe table shows, with these six out-of-gamut patches removed,the mean error decreased to 1.8, and maximum error decreasedto 5.9. It should be noted that due to the effects of the incandes-cent illuminant, the chromaticities of these patches are quiteextreme and would likely be out-of-gamut for many displaysystems.
Overall the results indicate that the color reproduction capabil-ities of our system are very good, but that the gamut limitations ofour display may introduce visible errors for extreme out-of-gamutcolors. This is a problem for any color-critical application ofrendering and display technology, and can be minimized by tuningthe color representation to the dataset of interest and confirmingthat the display gamut is sufficient to reproduce the colors in thatset.
Table 1Color validation. Color differences between a real ColorChecker chart and oursystem’s reproductions.
Six channel simulation Screen outputCIEDE2000 CIEDE2000
Mean Std. 90th Max. Mean Std. 90th Max.
D65 (24) 0.4 0.3 0.8 1.7 0.8 0.4 1.4 1.6D50 (24) 0.4 0.3 0.7 1.5 0.7 0.4 1.1 1.8IllA (24) 0.8 0.4 1.3 2.1 3.8 4.2 11.0 14.0IllA (18) 0.8 0.4 1.4 2.1 1.8 1.6 5.0 5.9
5.2. Gloss reproduction
We also evaluated our system’s ability to reproduce surfacegloss by measuring and simulating set of gloss samples. Thesamples were 4 cm � 4 cm glass plates that were painted withglossy gray latex paints made by mixing high gloss and flat paintsin different ratios. Nine samples were created with high glosspercentages of (100%, 98%, and incremental 5% mixes between95% and 60%). The sample surfaces were generally flat, uniform,and without significant texture.
The diffuse reflectance values of the physical samples weremeasured with an X-Rite Eye-One Pro spectrophotometer, whichuses a 45/0 illumination/detector measurement geometry. Thesespectral measurements were resampled into qd values in ourmultispectral representation.
The gloss properties of the samples were estimated using twomethods. For the higher gloss samples we imaged a line sourceand measured the resulting light distributions with a calibrateddigital camera. For the lower gloss samples we measured theBRDFs with a Murakami GCMS-10X goniospectrophotometer. Theimage-based method provided high-resolution angular measure-ment for samples with narrow specular lobes, and the goniome-ter-based method allowed broader lobes to be measured over awide angular range. Ward–Dür qs and a parameters were fit tothe measured distributions, and the models of the sample plateswere simulated and displayed by the system.
To validate the fidelity of the simulations, we constructed a cus-tom gonio-spectroradiometer to allow direct measurement of thereal and simulated samples. The device, shown in Fig. 14, consistedof a calibrated light source (Mille Luce M1000 lamp, fiber opticcable, integrating sphere, filters to achieve a 4700 K correlatedcolor temperature, and a 2.3 cm � 3.5 cm aperture) and a manualgonio-arm on which we mounted the PR-655. Either a sampleholder or the display could be mounted at the center-of-rotationof the device. Using this device we measured the luminance pro-duced by the real and simulated samples between 6� and 30� fromthe surface normal. Samples were taken at 0.5� intervals near the7.5� specular angle and at progressively larger intervals at largeroff-specular angles. The light source was on for the real samplesand off for the simulated samples.
The absolute luminance values produced as a function of anglefor the real and simulated samples are shown in Fig. 15. Although
Fig. 14. Measurement setup for our gloss validation experiments. The top panelshows the arrangement used to measure the real gloss samples. The bottom panelshows the arrangement used to measure the displayed reproductions.

Fig. 15. Gloss validation Goniometric measurements of the luminance from realphysical gloss samples (red lines) and our system’s reproductions (blue lines). (Forinterpretation of the references to color in this figure legend, the reader is referredto the web version of this article.)
Fig. 16. Images of the real and simulated gloss samples taken with a calibrateddigital camera. Note the similarities in the luminance patterns.
174 J.A. Ferwerda / Vision Research 109 (2015) 166–177
there are some deviations, in general the reflectance functions aresimilar in magnitude and shape. In the higher gloss samples (GL85–100), modeled using the line source, the peak values of thesimulated samples were marginally higher than the real samples.Conversely in the lower gloss samples (gloss level 60–80) modeledusing the goniospectrophotometer, the peak values of the simu-lated samples were marginally lower than the real samples. Thetwo mid-range gloss samples (GL 80 and 85) show the biggestdifferences and these were also the most difficult samples to mea-sure and model, since the widths of their specular lobes fellbetween the measurement capabilities of the line source andgoniospectrophotometer methods.
In addition to the physical measurements, high dynamic rangeimages of the real and simulated samples were created using acalibrated digital camera mounted to the gonio-arm and set atthe specular angle. The images of real and simulated samplesGL100. GL95 and GL85 are shown in Fig. 16.
Overall the results show that our system can reproduce surfacegloss with good fidelity as long as the surfaces reflectance proper-ties can be accurately measured, and then described by the Ward–Dür model. While this covers a wide and useful range of materials,reproducing more complex materials may require more complexmeasurement methods and models. In addition, while the currentsystem can accurately simulate gloss appearance in the lightboothenvironment, generalizing the system to more varied or extremelighting environments might require the use of a high dynamicrange display, and evaluation of whether that display’s ‘‘glossgamut’’ can reproduce the intensities and contrasts produced bya given combination of surface reflectance and lighting.
6. Applications
While the primary focus of this paper has been on thechallenges of developing a surface display system, the primarymotivation for this work is to develop a tool to facilitate the studyof surface and material perception. Although our research in thisarea is just beginning, in the following sections we outline howwe are starting use the surface display to address questions thatwould be difficult to investigate by other means.
6.1. Color perception
Images shown on emissive electronic displays (e.g. LCD, OLED)are widely used as stand-ins for real reflective surfaces ine-commerce, appearance design, and many other applications.Yet looking at an image on a display is not the same as lookingat a real reflective surface. For example, Gorzynski and Berns(1990) showed that while observers fully adapt to the chromaticityof the scene illuminant when viewing real colored patches, theyonly partially adapt when those patches are rendered as imageson an emissive display. This incomplete ‘‘discounting of the illumi-nant’’ for emissive displays can lead to significant errors in colorperception that can impact decision-making when emissive dis-plays are used in color-critical applications.
Since one of our goals in designing the surface display is to pro-duce an emissive display has the appearance of a real reflectivesurface, we replicated Gorzynski and Berns’ experiment to investi-gate if the surface display was seen more as a surface or more as adisplay. The stimuli used in the experiment are shown in Fig. 17and consisted of arrays of 21 colored patches seen against a whitebackground. The arrays were presented on the surface display,which was in the multi-source lightbooth. On each trial in theexperiment, the observer’s task was to choose the most neutralpatch in a given array. An adaptive procedure varied the chroma-ticities of the patches to estimate the observer’s ‘‘white point’’,indicating their state of chromatic adaptation.
We studied the effects of two factors (surround illuminant andrendering method) on the observers adaptation state. With respectto surround illuminant, the patch array was always rendered as if itwas lit by a tungsten source, but the illumination provided by thelightbooth was set to one of three states: tungsten (consistent);

Fig. 17. Stimuli used in the six conditions of our chromatic adaptation experiment.The flat or textured patch arrays were always rendered with respect to a tungstenilluminant. The real-world surround lighting was tungsten, daylight or no light (off).Note that the patch background was white and appeared near-neutral to observersin the no-light and tungsten conditions.
Fig. 18. (a) Results of our chromatic adaptation experiment) compared with (b) theresults of Gorzynski and Berns (1990). Note that the results for the surface displayshow a more systematic pattern of adaptation than the results for the standardemissive display used by Gorzynski and Berns.
J.A. Ferwerda / Vision Research 109 (2015) 166–177 175
daylight (inconsistent); or no light (neutral). With respect to therendering method, the patches were always shown on the surfacedisplay, but they were either rendered as uniform colored squares(flat), or were rendered using the real-time texturing, shading, andshadowing capabilities of the surface display to make the patcheslook like real reflective surfaces (textured). Fig. 17 shows the sixexperimental conditions resulting from the combination of thesetwo factors. Note that, the images in the figure only partially rep-resent what observers saw, and that in particular, in the ‘‘no light’’and ‘‘tungsten’’ conditions both the immediate backgrounds andsurrounds of the patches looked nearly-neutral.
The results of the experiment are shown in Fig. 18a. For com-parison, Gorzynski and Berns’ results are shown in Fig. 18b. Thelarge triangles in each figure represent the chromaticities of thebooth illuminants: daylight (lower left), and tungsten (upperright). The legends under each figure indicate the experimentalconditions. To set context, note that in Gorzynski and Berns’ exper-iment, while observers completely adapted to the tungsten boothilluminant when real reflective patches were used (red1 square),they showed middling levels of adaptation when the patches wererendered on a display. In contrast, our observers showed signifi-cantly different adaptation states in the three illumination condi-tions, however we did not find significant differences between the
1 For interpretation of color in Fig. 18, the reader is referred to the web version othis article.
f
‘‘flat’’ and ‘‘textured’’ rendering conditions. The result indicate thatwith respect to chromatic adaptation and color perception, the sur-face display produces results that are significantly more like thosefound for real surfaces than a standard display.
While this work is preliminary, and we need to do further inves-tigations to understand how the ways in which the surface displayappears like a reflective surface (illumination situatedness, respon-siveness, realistic materials/lighting) affects the observer’s degreechromatic adaptation, this work illustrates how a surface displaymight facilitate the study color in surface and material perception,by providing an emissive electronic display that is a quantitativelybetter surrogate for a real surface.
6.2. Gloss perception
Another area where the surface display could contribute to thestudy of surface and material perception is in the study of gloss.Perceived gloss is a multidimensional property that depends incomplex ways on the reflectance and topography of a surface,and the arrangement and structure of light sources in a scene. Italso has a dynamic character that is revealed through motion ofthe surface or movement of the observer. The capabilities of thesurface display allow the accurate simulation of all these aspectsof glossy surfaces, with the ease of parameter specification andexperimental control that come with digital modeling andrendering.
Fig. 19 shows examples of the kinds of glossy stimuli we havegenerated using the surface display. They are reproductions ofseven gray samples from the NCS gloss scale, a physical ‘‘book ofgloss’’ whose samples have been measured physically andvalidated for perceptual uniformity. The images in the figure showof models of the samples rendered to the surface display withaccurate geometry and reflectance properties. The samples are alsoilluminated by a simulated light source that is a geometrically andradiometrically accurate model of the actual lighting in the scene.Because of the real-time capabilities of the system, all the appear-ance properties of the surfaces change accurately in response tomanipulation of the display, movement of the observer, orcommands from the experimenter. While we have not yet usedthe surface display for the study of gloss perception, its capabilitiesshould greatly facilitate the design and execution of display-basedpsychophysical studies, and because of the realism of the display,those results should transfer well to predict the appearances ofreal-world surfaces.

Fig. 19. Simulated gloss samples from the NCS gloss scale. A simulated sample in-situ on the surface display is shown on the lower left.
Fig. 20. Composite screenshot from a prototype softproofing application based onthe surface display. Note the impact of the matte/canvas and glossy/smooth paperson the appearance of the photograph.
176 J.A. Ferwerda / Vision Research 109 (2015) 166–177
6.3. Softproofing for digital printing
A concrete example of where these kinds of results would bevaluable is in the area of softproofing for digital printing. Usersof high-end printing systems or online printing services that offermany choices of inks, papers, and finishing methods often want topreview what a print will look like onscreen before making theactual print. As described in Section 2, a variety of digital softproof-ing techniques have been developed, but they still often fall shortof providing WYSIWYG (what you see is what you get) previewingbecause of the complex interactions between printing inks, papers,illuminants, and viewing conditions.
We have been developing tools for softproofing using the sur-face display system. A screenshot from the application is shownin Fig. 20. Here a simulated digital print of a photograph has beenrendered to the surface display. The two halves of the simulatedprint show the effects of different kinds of paper. The left half usesa matte paper with a canvas-like texture, and the right half uses aglossy paper with a smoother texture. While the still image inFig. 20 illustrates the how the choice of paper will affect theappearance of the final print, the true value of the surface displaycomes from being able to directly manipulate and interact withthe simulated print dynamically under realistic lighting conditionsin to understand the effects that media choices will have on theappearance of the final print. While this work is also just begin-ning, and there is still significant development and validation workto do. This application demonstrates the potential utility of the sur-face display for not only basic appearance research, but for appliedappearance design and engineering as well.
7. Conclusions, limitations, and future work
In this paper we have described our efforts to create a surfacedisplay system that produces realistic digital representations ofreal-world surfaces. Our system supports the accurate simulationof the colors, glosses, and textures of surfaces with complexthree-dimensional properties, and allows users to view and inter-act with these virtual surfaces as if they were real ones.
While we believe this work is significant, there is still much tobe done. First, in our current system we model the properties offlat opaque reflective surfaces using the Ward–Dür model. Theworld is filled with surfaces with more complex geometric andreflectance properties, including effects of mesoscale geometryand translucency, so incorporating more sophisticated surfaceand light reflection models into our system would be one impor-tant effort. Second, in our current system we use a relatively sim-ple lighting environment, and we capture and model it in anoffline process. Real-time capture of complex illumination fieldswould be another worthwhile addition to the system. Next, theuser experience could benefit from device-free tracking, and moresophisticated displays that provide stereoscopic and high-dynamic range output, and more tangible form-factors such astablets and flexible screens. Finally, further validation of the sys-tem should be done both physically (particularly with respect tothe system’s representation of texture) and psychophysically, todetermine how well the system conveys the dynamic appearanceproperties of real surfaces.
Surface display systems such as the one described in this paperrepresent a powerful and achievable new approach to bridging thereal and virtual worlds. One that has important potential applica-tions in science, industry, commerce, education, the arts, or anyfield where it is important to represent, communicate, and under-stand the appearance of surfaces. The work described in this paperwill hopefully enable further steps in this direction.
Acknowledgment
This work was supported by a Grant from the National ScienceFoundation (#10644112) to James A. Ferwerda.
Appendix A. Supplementary material
Supplementary data associated with this article can be found, inthe online version, at http://dx.doi.org/10.1016/j.visres.2014.10.016.

J.A. Ferwerda / Vision Research 109 (2015) 166–177 177
References
Bandyopadhyay, D., Raskar, R., & Fuchs, H. (2001). Dynamic shader lamps: Paintingon real objects. In Proc. international symposium on augmented reality (ISAR ‘01)(pp. 207–216).
Bimber, O., & Raskar, R. (2005). Spatial augmented reality. Wellesley MA: A. K. PetersLtd..
Burdea, G., & Coiffet, P. (2003). Virtual reality technology (2nd ed.). Hoboken, NJ: JohnWiley & Sons.
Buxton, W. (2008). Surface and tangible computing, and the small matter of peopleand design. In IEEE international solid-state circuits conference digest of technicalpapers (Vol. 51, pp. 24–29).
Colbert, M., Premoze, S., & François, G. (2010). Importance sampling for productionrendering. ACM SIGGRAPH 2010 Course Notes.
Cruz-Neira, C., Sandin, D. J., & DeFanti, T. A. (1993). Surround-screen projection-based virtual reality: The design and implementation of the CAVE. ProceedingsACM SIGGRAPH, 93, 135–142.
Darling, B. (2013). Ph.D. dissertation, Rochester Institute of Technology. Availablethrough ProQuest/UMI.
Darling, B. A., & Ferwerda, J. A. (2009). The tangiBook: A tangible display system fordirect interaction with virtual surfaces. In Proceedings IS&T 17th color imagingconference (pp. 260–266).
Darling, B. A., & Ferwerda, J. A. (2012). Seeing virtual objects: Simulating reflectivesurfaces on emissive displays. In Proceedings IS-@@-T/SID 20th color imagingconference (pp. 135–141).
Day, E., Taplin, L., & Berns, R. (2004). Colorimetric characterization of a computer-controlled liquid crystal display. Color Research & Application, 29(5), 365–373.
Dür, A. (2006). An improved normalization for the Ward reflectance model. Journalof Graphics, GPU, and Game Tools, 11(1), 51–59.
Fitzmaurice, G. W. (1993). Situated information spaces and spatially aware palmtopcomputers. Communications of the ACM, 36(7), 39–49.
Francois, A. R., & Kang, E. Y. (2003). A handheld mirror simulation. In Proc. int. conf.on multimedia (pp. 6–9).
Fuchs, M., Raskar, R., Seidel, H. P., & Lensch, H. (2008). Towards passive 6Dreflectance field displays. ACM Transactions on Graphics, 27(3), 58 (SIGGRAPH2008).
Gatt, A., Westland, S., & Bala, R. (2006). Increasing the dimensionality of softproofing: Gloss and material. In Proceedings of the IS&T 14th color imagingconference (pp. 292–295).
Gorzynski, M., & Berns, R. (1990). Effects of ambient illumination and image colorbalance on the perception of neutral in hybrid image display systems.Proceedings of the SPIE, 1250, 111–118.
Hall, R. (1989). Illumination and color in computer generated imagery. New York:Springer-Verlag.
Hill, B. (2010). Softproofing system for accurate colour matching and study ofobserver metamerism. In Proceedings CGIV ‘10 (pp. 173–180).
Ishii, H., & Ullmer, B. (1997). Tangible bits: Towards seamless interfaces betweenpeople, bits and atoms. In Proceedings ACM CHI ‘97 (pp. 234–240).
Koike, T., & Naemura, T. (2008). BRDF display: Interactive view dependent texturedisplay using integral photography. In Proceedings ACM IPT/EDT ‘08.
Konieczny, J., Meyer, G. W. (2006). Material and color design using projectors. InProceedings of the IS&T third European conference on colour in graphics, imaging,and vision (pp. 438–442).
Konieczny, J., Shimizu, C., Meyer, G. W., & Colucci, D. (2005). A handheld flexibledisplay system. In Proceedings of IEEE visualization ‘05 (pp. 75–81).
Laihanen, P. (1994). Exact soft proofing. Journal of Image Science & Technology, 38(5),432–440.
Lanman, D., Wetzstein, G., Hirsch, M., Heidrich, W., & Raskar, R. (2011). Polarizationfields: Dynamic light field display using multi-layer LCDs. Proceedings ACMSIGGRAPH Asia (SA 2011) (Article No. 186).
Lazzari, M., Mclaughlin, M. L., Jaskowiak, J., Wong, W., & Akbarian, M. (2002). Ahaptic exhibition of daguerreotype cases for USC’s Fisher Gallery. In M. L.McLaughlin, J. Hespanha, & G. Sukhatme (Eds.), Touch in virtual environments:Haptics and the design of interactive system (pp. 260–269). Upper Saddle RiverNJ: Prentice-Hall.
Mahy, M., Van Eycken, L., & Oosterlinck, A. (1994). Evaluation of uniform colorspaces developed after the adoption of CIELAB and CIELUV. Color Research andApplication, 19(2), 105–121.
Masia, B., Wetzstein, G., Didyk, P., & Gutierrez, D. (2013). A survey on computationaldisplays: Pushing the boundaries of optics, computation, and perception.Computers and Graphics, 37(8), 1012–1038.
Max, N. L. (1988). Horizon mapping: Shadows for bump-mapped surfaces. TheVisual Computer, 4(2), 109–117.
Nayar, S. K., Belhumer, P. N., & Boult, T. E. (2004). Lighting sensitive display. ACMTransactions on Graphics, 23(4), 963–979 (SIGGRAPH 2004).
Patil, R. A., Fairchild, M. D., & Johnson, G. M. (2004). 3D simulation of prints forimproved soft proofing. In Proceedings of the IS&T 12th color imaging conference(pp. 193–199).
Peercy, M., Airey, J., & Cabral, B. (1997). Efficient bump mapping hardware.Proceedings of ACM SIGGRAPH, 97, 303–306.
Raskar, R., Welch, G., Low, K., & Bandyopadhyay, D. (2001). Shader lamps:Animating real objects with image-based illumination. In Proc. 12theurographics workshop on rendering techniques (pp. 89–102).
Raskar, R., van Baar, J., Beardsley, P., Willwacher, T., Rao, S., & Forlines, C. (2003).iLamps: Geometrically aware and self-configuring projectors. ACM Transactionson Graphics, 22(4), 809–818 (SIGGRAPH 2003).
Sloan, P. P., & Cohen, M. F. (2000). Interactive horizon mapping. EurographicsWorkshop on Rendering, 281–286.
Sutherland, I. E. (1968). A head-mounted three-dimensional display. ProceedingsAIFPS, 33, 757–764.
Tsang, M., Fitzmaurice, G. W., Kurtenbach, G., Khan, A., & Buxton, W. (2002). Boomchameleon: Simultaneous capture of 3D viewpoint, voice and gestureannotations on a spatially-aware display. Proceedings ACM UIST, 4(2), 111–120.
Vickers, D. L. (1974). Sorcerer’s apprentice: Head-mounted display and wand. Ph.D.dissertation, Univ. of Utah.
Viriyothai, K., & Debevec, P. (2009). Variance minimization light probe sampling.ACM SIGGRAPH 2009 Poster Proceedings (Article 92).
Ward, G. J. (1992). Measuring and modeling anisotropic reflection. Proceedings ACMSIGGRAPH, 92, 265–272.
Wetzstein, G., Lanman, D., Heidrich, W., & Raskar, R. (2011). Layered 3D:Tomographic image synthesis for attenuation-based light field and highdynamic range displays. ACM Transactions on Graphics, 30(4), 95 (SIGGRAPH2011).
Yang, R., Huang, X., Li, S., & Jaynes, C. (2008). Toward the light field display:Autostereoscopic rendering via a cluster of projectors. IEEE Transactions onVisualization and Computer Graphics, 14(1), 84–96.