impaired executive function signals in motor brain...
TRANSCRIPT

NeuroImage 60 (2012) 1156–1170
Contents lists available at SciVerse ScienceDirect
NeuroImage
j ourna l homepage: www.e lsev ie r .com/ locate /yn img
Impaired executive function signals in motor brain regions in Parkinson's disease☆
Ian G.M. Cameron a,g, Giovanna Pari a,b, Nadia Alahyane a, Donald C. Brien a, Brian C. Coe a,c,Patrick W. Stroman a,d,e, Douglas P. Munoz a,b,c,f,⁎a Centre for Neuroscience Studies, Queen's University, Kingston, ON, Canadab Department of Medicine, Queen's University, Kingston, ON, Canadac Department of Physiology, Queen's University, Kingston, ON, Canadad Department of Physics, Queen's University, Kingston, ON, Canadae Department of Diagnostic Radiology, Queen's University, Kingston, ON, Canadaf Department of Psychology, Queen's University, Kingston, ON, Canadag Helen Wills Neuroscience Institute, University of California, Berkeley, Berkeley, CA, USA
☆ Funding source: this work was supported by the Casearch [MOP 97741 to D.P.M and G.P.]; the Canada FoundD.P.M. and P.W.S.], the Canada Research Chairs programuate Scholarship program [I.G.M.C.].⁎ Corresponding author at: Centre for Neuroscienc
Kingston, ON, Canada K7L 3N6. Fax: +1 613 533 6840.E-mail address: [email protected] (D.P. Mun
1053-8119/$ – see front matter © 2012 Elsevier Inc. Alldoi:10.1016/j.neuroimage.2012.01.057
a b s t r a c t
a r t i c l e i n f oArticle history:Received 13 May 2011Revised 3 January 2012Accepted 5 January 2012Available online 15 January 2012
Keywords:Functional magnetic resonance imagingTask setAntisaccadeFrontal eye fieldsBasal gangliaPrefrontal cortex
Recent evidence has shown that patients with Parkinson's disease (PD) often display deficits in executivefunctions, such as planning for future behavior, and these deficits may stem from pathologies in prefrontalcortex and basal ganglia circuits that are critical to executive control. Using the antisaccade task (lookaway from a visual stimulus), we show that when the preparatory ‘readiness’ to perform a given action is dis-sociated from the actual execution of that action, PD patients off and on dopamine medication display behav-ioral impairments and reduced cortical brain activation that cannot be explained by a pathology related todysfunction in movement execution. Rather, they show that the appropriate task set signals were not inplace in motor regions prior to execution, resulting in impairments in the control of subsequent voluntarymovement. This is the first fMRI study of antisaccade deficits in Parkinson's disease, and importantly, thefindings point to a critical role of the basal ganglia in translating signals related to rule representation (exec-utive) into those governing voluntary motor behavior.
© 2012 Elsevier Inc. All rights reserved.
Introduction
To perform a voluntary movement requires not only that the brainis functioning optimally to guide its execution, but that the brain isalso properly preset in order for the correct movement to be initiated.Presetting means the adoption of a task set (a rule about how to be-have), which in the present study means preparing to execute a vol-untary eye movement based on a colored cue. In Parkinson's disease(PD), the traditional focus has been on understanding the better-known deficits in motor execution and tremor (Betchen and Kaplitt,2003), but recent evidence has pointed to the importance in under-standing deficits in executive control that often surface in the disor-der (Leh et al., 2010; Rodriguez-Oroz et al., 2009). Here, we providedirect evidence that these cognitive deficits related to task set estab-lishment may be more important to the impaired control of voluntarymovements in PD than previously thought.
nadian Institutes of Health Re-ation for Innovation [11439 to[D.P.M.] and the Canada Grad-
e Studies, Queen's University,
oz).
rights reserved.
We utilize a well-characterized measure of the ability for peopleto override an automatic response with an alternative, voluntary re-sponse that is more difficult to perform. Participants are required torefrain from initiating an automatic, visually-triggered eye-movement (a prosaccade) in the direction of an abruptly appearingvisual stimulus, and to instead initiate a voluntary saccade in the op-posite direction (an antisaccade) (Munoz and Everling, 2004). To dothis successfully, a network of cortical and sub-cortical brain regions,including dorsolateral prefrontal cortex (DLPFC) (Guitton et al., 1985;Pierrot-Deseilligny et al., 1991), frontal, parietal and supplementaryeye-fields (FEF, PEF and SEF) (Brown et al., 2007; Connolly et al.,2002; Curtis and D'Esposito, 2003; DeSouza et al., 2003; Ford et al.,2005), and the basal ganglia (BG) (Ford and Everling, 2009;Watanabe and Munoz, 2009, 2010) is required to come online priorto the appearance of the visual stimulus so that the motor system(i.e., FEF) is preset towards the appropriate action (Munoz andEverling, 2004).
We (Cameron et al., 2010; Chan et al., 2005) and others (Amadoret al., 2006; Briand et al., 1999; Hood et al., 2007; Rivaud-Pechoux etal., 2007) have shown that PD patients display deficits in the antisac-cade task, such that they are slower to initiate this voluntary re-sponse, and often execute a prosaccade in error with greaterfrequency. Recent evidence also shows that hypo-activation mea-sured by functional Magnetic Resonance Imaging (fMRI) occurs

1157I.G.M. Cameron et al. / NeuroImage 60 (2012) 1156–1170
throughout the frontal cortex during voluntary saccade initiation inPD (Rieger et al., 2008), following general observation of hypo-activation in the brains of PD patients during complex tasks demand-ing attentional control (Dagher and Nagano-Saito, 2007). In the pre-sent study we reveal for the first time correlates of these wellknown antisaccade deficits in PD, and more importantly, provide ev-idence that hypo-activation in fMRI signals in PD occur more promi-nently in motor areas crucial to antisaccade generation during apreparatory stage, rather than during the execution of the actual re-sponse. We suggest that this corresponds to the failure to establishthe appropriate task set, providing for a neural correlate of the behavioraldeficits observed in PD when performing voluntary actions.
Methods
PD patients, on and off (>18 h from the previous dose) their reg-ular dopaminergic medication (Table 1), and age-matched controlsubjects participated in a rapid event-related fMRI design with proand anti saccade trials interleaved with pro and anti instruction only(‘prep’) trials (Fig. 1). This design allowed us to examine activationrelated to establishing an antisaccade task set (prep trials), separatelyfrom executing the antisaccade response, and to examine the effect ofregular dopaminergic therapy on performance and fMRI activation.Correct anti trials were compared to pro trials and to errors on anti
Table 1Clinical information for PD patients.
Patients Sex Age(yrs)
Off MEDS UPDRS
MMSE BDI Part II(ADL)
Part III(motor)
Part V (Hoehnand Yahr)
Partand
1 m 69 29 9 6 10 2.0 902 m 57 30 12 15 32 2.5 903 f 74 30 12 7 21 2.5 904 m 66 28 15 8 10 2.0 905 m 71 30 2 7 16 1.0 1006 f 52 29 1 5 24 2.5 907 m 63 28 9 11 39 2.5 908 f 71 30 8 8 29 2.0 909 f 64 30 10 11 20 2.5 9010 f 59 30 5 11 23 2.5 9011 f 65 30 14 11 19 2.0 9012 m 60 28 1 3 18 1.5 9013 m 70 30 7 15 44 2.0 9014mo m 50 29 13 8 42 3.0 9015md m 67 30 4 3 10 1.0 10016 t1 m 59 29 12 16 31 3.0 9017 t1 f 68 29 15 54 3.0 8018 t1 m 38 – – – – – –
19 t1 f 64 – – – – – –
20 t2 m 54 30 5 11 26 2.0 9021bdi f 69 30 25 22 52 4.0 6022nv m 51 30 0 8 22 2.0 9023nv m 77 27 9 13 40 3.0 9024nv f 68 30 3 7 37 2.5 9025f1 m 67 27 7 11 39 3.0 9026f f 75 – – – – – –
27f m 80 – – – – – –
28f m 70 – – – – – –
mean(n=28)
17 m; 11f 64.2 29.3 8.3 10.1 28.6 2.3 89.1
mean(n=13)
7 m; 6f 64.7 29.4 8.1 9.1 23.5 2.1 90.8
Controls mean(n=13)
7 m; 6f 64.8
Symbols and definitions: A, anticholinergic (trihexyphenidyl); ADL, Activities Of Daily LivingEquivalent Dose; M, monoamine oxidase inhibitor (rasagiline); Med., medications; MMSE,amantadine; UPDRS, Unified Parkinson's Disease Rating Scale; Yrs, years; '–', not applicamedication history (participated in off meds session only); t1, failed eye tracking in 1session); t2, failed eye tracking in both sessions; bdi, Beck Depression Inventory scoresdegeneration, or cataracts); f1, could not perform task off meds (italicized); f, could not per
trials, to examine the differential patterns in brain activation acrossthe groups for these response types. All experiments were approvedby the Research and Ethics Board of Queen's University, and adheredto the principles of the Canadian Tri-council Policy Statement on EthicalConduct for Research Involving Humans, following the principles of theDeclaration of Helsinki.
Participants
Twenty-eight patients with mild to moderate PD were recruitedfrom the movement disorders clinic at the Kingston General Hospitalby co-author GP, and were required to participate in two sessions(counterbalanced for medication order). Patients underwent an eval-uation of motor function (Unified Parkinson's Disease Rating Scale),cognitive status (Mini-Mental State Examination) and depression(Beck Depression Inventory). Scores for each patient are shown inTable 1. Of this, 13 patients were utilized for full analysis because ofthe following exclusion criteria: patients could not score less than26/30 on the MMSE, could not score higher than 15 on the BDI,were required to participate in two sessions of the experiment (onand off their regular dopaminergic medication), were able to success-fully perform the task and provide online eye-tracking data, did notposses any visual abnormalities (e.g., macular degeneration or cata-racts) or structural abnormalities other than diffuse white matter
On MEDS UPDRS Med. LED(mg)
Yrs sinceinitialdiagnosis
VI (SchwabEngland)
MMSE BDI PartII
PartIII
PartV
PartVI
29 3 12 2.5 90 L 250 0.2530 13 29 2.5 80 L 200 8.0029 9 9 16 2.0 90 L, P 600 4.5029 13 8 13 2.0 90 P 150 6.7529 2 6 8 1.0 100 A, R 160 3.7528 4 7 15 2.0 90 P 450 3.0030 4 10 29 2.0 90 R 280 1.2529 8 9 20 2.0 90 L, P 300 1.5030 6 9 15 2.5 90 L 300 0.5030 9 11 26 3.0 90 R 15 1.0030 11 12 21 2.0 90 L, R 460 5.2527 0 2 18 2.0 100 P 37.5 0.0030 14 14 33 2.0 90 A, L, P 700 5.5029 13 4 10 2.0 90 L, M 900 4.75– – – – – – – 0 0.0028 16 14 30 3.0 90 L 700 1.0030 8 7 13 2.0 90 L, R 335 11.5029 2 18 2.0 A, E, L, R, S 1831 5.5030 5 16 2.5 90 P 200 1.5030 15 11 37 2.0 90 P 125 0.2529 37 24 40 4.0 60 L, P 1575 5.2530 0 8 29 2.0 90 P 150 0.2529 7 7 23 2.0 90 E, L, S 1131 8.0030 3 5 18 1.5 90 L, P 500 2.5025 6 14 40 3.0 90 L, S 875 0.50
14 27 3.0 80 L, P 675 8.7510 33 2.0 80 L 4.50
27 7 11 37 2.0 90 L, M, R 1070 5.7529.0 9.1 9.2 23.2 2.2 88.5 3.62
29.2 7.3 8.7 19.6 2.1 90.8 3.17
; BDI, Beck Depression Inventory; E, entacapone; L, levodopa/carbidopa; LED, LevodopaMini Mental State Examination; P, pramipexole dihydrochloride; R, ropinirole HCl; S,ble; (blank), not assessed. Exclusions: mo, motion>2 mm (both sessions); md, nosession (italicized) (subjects 18 and 19 were not required to participate in second>15; nv, neurological or visual confounds (atrophy in oculomotor regions, macularform task on meds (not required to participate in off meds session).
antisaccadetrial
prosaccadetrial
Target (T)
anti preptrial
1000 1300 200 100 1400 500
N=16
N=8
N=8
N=16
pro preptrial
Time (ms)
Saccade NeutralFixation
NeutralFixation
Instruction Gap
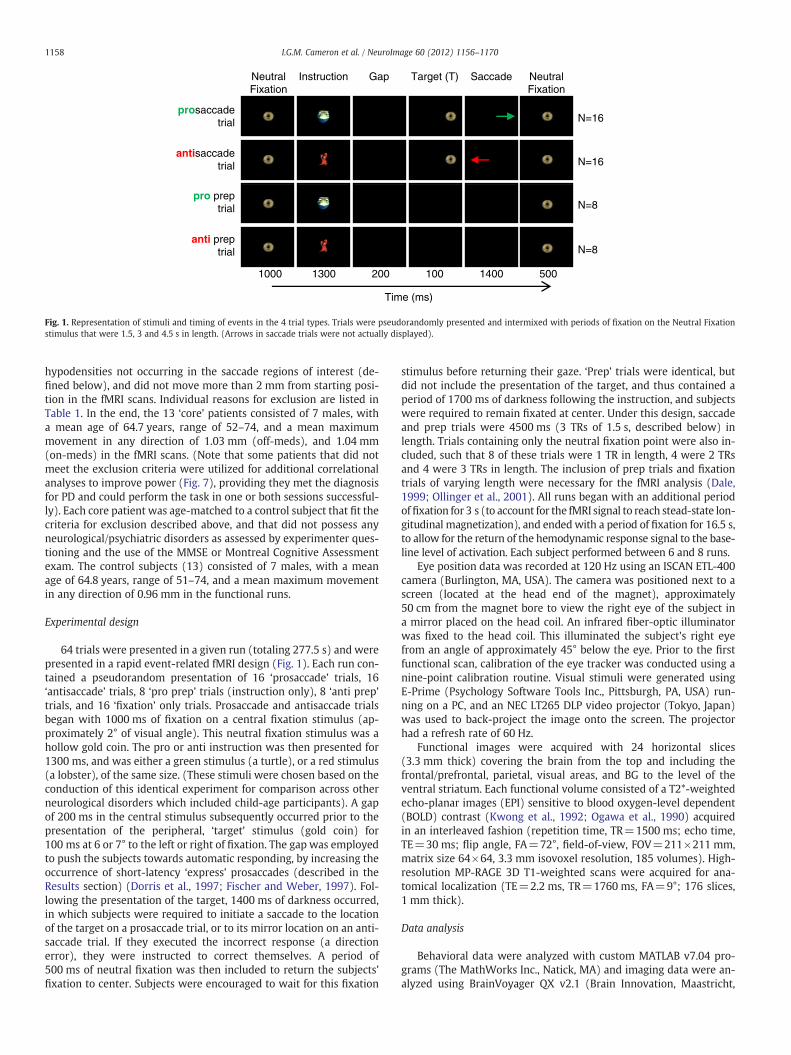
Fig. 1. Representation of stimuli and timing of events in the 4 trial types. Trials were pseudorandomly presented and intermixed with periods of fixation on the Neutral Fixationstimulus that were 1.5, 3 and 4.5 s in length. (Arrows in saccade trials were not actually displayed).
1158 I.G.M. Cameron et al. / NeuroImage 60 (2012) 1156–1170
hypodensities not occurring in the saccade regions of interest (de-fined below), and did not move more than 2 mm from starting posi-tion in the fMRI scans. Individual reasons for exclusion are listed inTable 1. In the end, the 13 ‘core’ patients consisted of 7 males, witha mean age of 64.7 years, range of 52–74, and a mean maximummovement in any direction of 1.03 mm (off-meds), and 1.04 mm(on-meds) in the fMRI scans. (Note that some patients that did notmeet the exclusion criteria were utilized for additional correlationalanalyses to improve power (Fig. 7), providing they met the diagnosisfor PD and could perform the task in one or both sessions successful-ly). Each core patient was age-matched to a control subject that fit thecriteria for exclusion described above, and that did not possess anyneurological/psychiatric disorders as assessed by experimenter ques-tioning and the use of the MMSE or Montreal Cognitive Assessmentexam. The control subjects (13) consisted of 7 males, with a meanage of 64.8 years, range of 51–74, and a mean maximum movementin any direction of 0.96 mm in the functional runs.
Experimental design
64 trials were presented in a given run (totaling 277.5 s) and werepresented in a rapid event-related fMRI design (Fig. 1). Each run con-tained a pseudorandom presentation of 16 ‘prosaccade’ trials, 16‘antisaccade’ trials, 8 ‘pro prep’ trials (instruction only), 8 ‘anti prep’trials, and 16 ‘fixation’ only trials. Prosaccade and antisaccade trialsbegan with 1000 ms of fixation on a central fixation stimulus (ap-proximately 2° of visual angle). This neutral fixation stimulus was ahollow gold coin. The pro or anti instruction was then presented for1300 ms, and was either a green stimulus (a turtle), or a red stimulus(a lobster), of the same size. (These stimuli were chosen based on theconduction of this identical experiment for comparison across otherneurological disorders which included child-age participants). A gapof 200 ms in the central stimulus subsequently occurred prior to thepresentation of the peripheral, ‘target’ stimulus (gold coin) for100 ms at 6 or 7° to the left or right of fixation. The gap was employedto push the subjects towards automatic responding, by increasing theoccurrence of short-latency ‘express’ prosaccades (described in theResults section) (Dorris et al., 1997; Fischer and Weber, 1997). Fol-lowing the presentation of the target, 1400 ms of darkness occurred,in which subjects were required to initiate a saccade to the locationof the target on a prosaccade trial, or to its mirror location on an anti-saccade trial. If they executed the incorrect response (a directionerror), they were instructed to correct themselves. A period of500 ms of neutral fixation was then included to return the subjects'fixation to center. Subjects were encouraged to wait for this fixation
stimulus before returning their gaze. ‘Prep’ trials were identical, butdid not include the presentation of the target, and thus contained aperiod of 1700 ms of darkness following the instruction, and subjectswere required to remain fixated at center. Under this design, saccadeand prep trials were 4500 ms (3 TRs of 1.5 s, described below) inlength. Trials containing only the neutral fixation point were also in-cluded, such that 8 of these trials were 1 TR in length, 4 were 2 TRsand 4 were 3 TRs in length. The inclusion of prep trials and fixationtrials of varying length were necessary for the fMRI analysis (Dale,1999; Ollinger et al., 2001). All runs began with an additional periodoffixation for 3 s (to account for the fMRI signal to reach stead-state lon-gitudinal magnetization), and endedwith a period of fixation for 16.5 s,to allow for the return of the hemodynamic response signal to the base-line level of activation. Each subject performed between 6 and 8 runs.
Eye position data was recorded at 120 Hz using an ISCAN ETL-400camera (Burlington, MA, USA). The camera was positioned next to ascreen (located at the head end of the magnet), approximately50 cm from the magnet bore to view the right eye of the subject ina mirror placed on the head coil. An infrared fiber-optic illuminatorwas fixed to the head coil. This illuminated the subject's right eyefrom an angle of approximately 45° below the eye. Prior to the firstfunctional scan, calibration of the eye tracker was conducted using anine-point calibration routine. Visual stimuli were generated usingE-Prime (Psychology Software Tools Inc., Pittsburgh, PA, USA) run-ning on a PC, and an NEC LT265 DLP video projector (Tokyo, Japan)was used to back-project the image onto the screen. The projectorhad a refresh rate of 60 Hz.
Functional images were acquired with 24 horizontal slices(3.3 mm thick) covering the brain from the top and including thefrontal/prefrontal, parietal, visual areas, and BG to the level of theventral striatum. Each functional volume consisted of a T2*-weightedecho-planar images (EPI) sensitive to blood oxygen-level dependent(BOLD) contrast (Kwong et al., 1992; Ogawa et al., 1990) acquiredin an interleaved fashion (repetition time, TR=1500 ms; echo time,TE=30 ms; flip angle, FA=72°, field-of-view, FOV=211×211 mm,matrix size 64×64, 3.3 mm isovoxel resolution, 185 volumes). High-resolution MP-RAGE 3D T1-weighted scans were acquired for ana-tomical localization (TE=2.2 ms, TR=1760 ms, FA=9°; 176 slices,1 mm thick).
Data analysis
Behavioral data were analyzed with custom MATLAB v7.04 pro-grams (The MathWorks Inc., Natick, MA) and imaging data were an-alyzed using BrainVoyager QX v2.1 (Brain Innovation, Maastricht,

1159I.G.M. Cameron et al. / NeuroImage 60 (2012) 1156–1170
The Netherlands) and SPSS Statistics version 17.0 (IBM, Chicago, IL).Correct trials were separated from incorrect trials, consisting of: di-rection errors on saccade trials, SRTsb90 ms (anticipatory errors),SRTs>1000 ms, saccades in the wrong direction after a correct re-sponse, and saccades during prep and fixation trials or periods. Thefirst two imaging volumes were removed for steady state magnetiza-tion, and then pre-processing steps were performed including rigid-body 3D motion correction to the first of the remaining volumes ineach run, slice scan-time correction with a cubic-spline interpolation,temporal filtering (high-pass filter with cut-off of 3 cycles/run andlinear trend removal), and 3D spatial smoothing with a 4 mmFWHM Gaussian kernel. A ‘deconvolution’ analysis was then per-formed in BrainVoyager, such that the hemodynamic response wasestimated using stick predictors in a 13-point time series with a tem-poral resolution of approximately 1TR (1.5 s) that was aligned withthe start of each trial (actual times displayed in seconds in Figs. 3B,6). This process was used to model the hemodynamic response foreach trial type and cover the temporal extent of a typical hemody-namic response of approximately 20 s (20 s /13≈1.5 s). The trialtypes of interest consisted of: correct anti prep, correct pro prep, cor-rect anti saccade, and correct pro saccade. Correctly performed fixa-tion trials were not modeled explicitly so as to provide a baselinemeasure (Ollinger et al., 2001). All incorrect trials were classified to-gether in the design matrix as an additional trial type of no interest,in order so that they would not contaminate the estimation of theBOLD signal for correct trials (Brown et al., 2007).
Main contrast analysisA random-effects multi-subject general linear model (GLM) with a
Z-normalization was run using the 5th to 7th time points (7.7, 9.3 and10.8 s) from the onset of a saccade trial, to account for a reliable mea-sure surrounding peak activation from trial onset as determined bypreliminary examination. Data from correctly performed prosaccadetrials was subtracted from correctly performed antisaccade trials,and group-level statistical maps were generated at a threshold ofPb0.01 (T value=3.06), corrected for multiple comparisons acrossthe voxel population at Pb0.01 (8 contiguous voxels). For eachgroup, these statistical maps are superimposed on the average ofthe subjects' 3D anatomical data transformed into Talairach coordi-nate space (Fig. 3A). These statistical maps constitute the main con-trast, and were used for subsequent Region of Interest (ROI)analysis pertaining to task set establishment, and response executionin saccade ROIs. ROI analysis was done in this fashion because theantisaccade requires additional control mechanisms (automatic re-sponse suppression, attention redirection, saccade ‘vector inversion’to a location void of a stimulus) on top of more automatic prosaccadeprocesses (Munoz and Everling, 2004), and so the contrast of antisac-cade to prosaccade trials allows us to define ROI's where greater acti-vation magnitudes on antisaccade trials is hypothesized to reflectthese additional mechanisms.
ROI analysisTwo ROI analyses were conducted using random-effects GLMs to
extract beta-weight parameter estimates of BOLD signal changefrom each of the saccade ROIs. These ROIs were selected as the 125contiguous voxels (5×5×5) within a cubic cluster centered on thepoint of peak activation from the main contrast in the DLPFC, FEF,SEF, PEF and caudate nucleus (CN), defined by anatomical landmarksand known locations in Talairach space. For analysis pertaining topreparatory effects (Figs. 4A, 5A), the mean of the beta values fromthe 5th and 6th time points relative to prep trial onset was used to ac-count for a measure of the peak preparatory activation. For analysis ofsaccade execution processes (Figs. 4B, 5B), the time points wereshifted by 1.5 s to include only the 6th and 7th time points, as theonset of the peripheral target occurs 1.5 s (one time point) after theappearance of the instruction (Brown et al., 2007).
Direction error analysisA comparison of BOLD signal time courses (13 time points) on cor-
rect and erroneously executed antisaccade trials (anti direction er-rors) was also conducted (Fig. 6), and for this, direction errors onboth pro and antisaccade trials were incorporated as distinct eventsin an ROI analysis. The initial prosaccade was corrected on the major-ity of anti direction error trials (PD off-meds: 91%, PD on-meds: 92%,Controls: 91%) and therefore all anti direction error trials wereincluded.
Statistical analysis
For behavioral data, one-way ANOVAs were performed across thethree groups for pro and antisaccade responses separately (to confirmwhether this study would reveal the known antisaccade performancedeficits in PD, but also, possible differences in prosaccade perfor-mance), and t-tests were performed between two groups (illustratedin Fig. 2, and listed in full in Supplementary Table 1). Partial etasquared (η2) and Hedges' g values are provided for effect sizes forANOVAs and t-tests, respectively. One-way ANOVAs were also per-formed for fMRI ROI analyses across the three groups for pro andanti trials separately (Fig. 4), with independent t-tests performed be-tween two groups (Supplementary Table 1). Note that because of thedeconvolution design, a full factorial (ANOVA) analysis was not con-ducted to produce pro and anti contrast maps; this method wouldnot provide sensible interpretations because each time point is mod-eled separately in the GLM, resulting in interactions between timepoints in the same response type (e.g., see Fig. 3B). Instead, anti pro-cesses were contrasted to pro processes within each group to producecontrast maps (Figs. 3, 5, Supplementary Figs. 1, 3, 4), which is a com-mon approach in the saccade field. Our hypothesis was that therewould be differences across the groups in anti activation magnitudesin the ROI analysis (Fig. 4), corresponding to impaired antisaccadegeneration in PD; however, we also investigated if there were differ-ences in pro activation magnitudes. We were not interested in task(pro, anti) by group interactions, because the ROI's were already de-fined by an antisaccade–prosaccade contrast within each group, andbecause these interactions would not identify group deficits relatedspecifically to antisaccade generation. Linear regressions were per-formed for correlations (Correlational analysis section andMedication effects section), and the t-test values on the coefficientsare reported.
Results
Behavior
Fig. 2 illustrates the antisaccade deficits we observed in PD thatwere identical to those described previously (Amador et al., 2006;Briand et al., 1999; Cameron et al., 2010; Chan et al., 2005; Hood etal., 2007), providing the basis for an fMRI investigation of well-characterized antisaccade impairments in PD. Specifically, PD patientsexecuted a higher proportion of anti direction errors (Fig. 2B, exem-plified in Fig. 2A), and appeared to be overall slower at antisaccadeinitiation (increased saccade reaction time (SRT)) (Fig. 2D). Interest-ingly, superior prosaccade performance, in terms of fewer percentagedirection errors, was observed in PD in comparison to controls(Fig. 2B), which was consistent with our recent study that also uti-lized an interleaved design containing trials that varied in the degreeof executive control (Cameron et al., 2010). When a difference in % di-rection errors between pro and antisaccade trials in the current studywas calculated (Fig. 2C), the result approached significance across thegroups, F(2,36)=2.80, P=0.07, η2=0.13. (The results from indepen-dent t-tests between two groups are illustrated throughout Fig. 2). PDpatients also appeared to be faster at initiating a prosaccade, butslower at initiating an antisaccade (as described above) (Fig. 2D),

Time from T onset (ms)
Pos
ition
(de
g)
20
0
-20
-1500 -1000 -500 500 1000
correct
SRT
direction error
0
(anti-instruction)T
A
SR
T (
ms)
200
250
300
350
400
D
10
20
30
40
50
CV
(%
)
pro anti
*
G
B
Dire
ctio
n E
rror
s (%
)
0
10
20
30
†
*
Exp
ress
Sac
cade
s (%
)
0
5
10
15
pro anti
F20
Ant
i – P
ro S
RT
(m
s)
0
20
40
80
100
E
60
*†
*
* P < 0.05 † P < 0.07
t -tests (independent)
Ant
i – P
roD
irect
ion
Err
ors
(%)
0
5
10
20
25
C
15
*
PD OFF meds
PD ON meds
Control
H
SRT (ms)
cum
ulat
ive
prob
abili
ty (
%)
0
20
40
60
80
100
-20
pro anti
SRT (ms)
Fig. 2. Behavior. (A) Sample eye traces comparing correct antisaccade trials and anti-saccade direction error trials. (B) Mean percentage direction errors (initial saccadeaway from T on prosaccade trial, towards T on antisaccade trial). (C) Mean % anti direc-tion errors–% pro direction errors. (D) Mean saccade reaction time (SRT) on correct tri-als. (E) Mean anti SRT–pro SRT. (F) Mean percentage ‘express’ saccades(90bSRTb160 ms). (G) Mean intrasubject coefficient of variation (CV) in SRT (stan-dard deviation/mean×100). Error bars correspond to standard error of the mean(SE). (H) Cumulative probabilities of saccade distributions for all three groups (pooledSRT across subjects). Positive Y values indicate correct saccades, while negative Yvalues indicate direction errors (colored to indicate saccade type executed, e.g., antior pro). Gray shaded region highlights the region calculated as ‘express saccades’(90bSRTb160 ms).
1160 I.G.M. Cameron et al. / NeuroImage 60 (2012) 1156–1170
resulting in a significant SRT difference between pro and antisaccadetrials across the groups, F(2,36)=3.34, Pb0.05, η2=0.16 (Fig. 2E). PDpatients also displayed a higher proportion of pro ‘express saccades’than the controls (Fig. 2F), which are the shortest-latency populationof automatic saccades to a visual stimulus, with latencies typically de-scribed between 90 and 140 ms (Dorris et al., 1997; Fischer et al.,
1993), but with the upper boundary dependent on the participantsage and laboratory conditions (Peltsch et al., 2011). The upper bound-ary was set atb160 ms in the current study, based on an observedseparation between two SRT distribution sub-populations at thisepoch in all three groups (not shown). It was also observed that PDpatients were more variable in prosaccade SRT (Fig. 2G), as reportedpreviously (Chan et al., 2005). Finally, the cumulative distributionsof reaction times for correct and direction error trials summarizesthe saccade behavior in each group (Fig. 2H); PD patients off-medsdisplayed the largest prosaccade ‘bias’ in reaction time (e.g., slowerantisaccade SRT, but faster prosaccade SRT with a higher percentageof ‘express’ saccades and, interestingly, another population of short-latency prosaccadesb200 ms in SRT) which contributes to their in-creased execution of inappropriate prosaccades on antisaccade trials.
Overall the behavior we observed was consistent with previousstudies, highlighting the fact that PD patients are biased towards ex-ecuting the more automatic prosaccade, and against the more volun-tary antisaccade. Note however that medication did not result insignificant improvements in performance, though it did make the be-havior of PD patients more like the control subjects' than in their off-meds state.
fMRI
As described above, we based the fMRI analysis on comparingantisaccade to prosaccade processes, with the hypothesis that activa-tion should be greater in saccade areas on anti trials, because antisac-cades require additional executive processes critical to implementingthe voluntary components of antisaccade generation (automatic re-sponse suppression, attention redirection, saccade vector inversion)that are not required on prosaccade trials (Munoz and Everling,2004). Furthermore, we hypothesized that these processes shouldnot be successfully implemented when an anti direction error isgenerated.
Main contrastAn initial contrast of correct antisaccade trials minus correct pro-
saccade trials was made for all three groups (Fig. 3A) in order to iden-tify regions previously shown with fMRI to display greater activationfor antisaccades compared to prosaccades: DLPFC, FEF, SEF, PEF andcaudate nucleus (CN) (Brown et al., 2006; Connolly et al., 2002,2005; Curtis and D'Esposito, 2003; DeSouza et al., 2003; Luna et al.,1998; Luna et al., 1998; Sweeney et al., 1996). Fig. 3B exemplifieshow this contrast was made using the 5th, 6th and 7th time points(see Methods subsection Main contrast analysis) for one of these re-gions. Talairach locations of the peak locations in all regions exceed-ing the statistical threshold are provided in Table 2. Havingconfirmed that greater activation for antisaccade generation com-pared to prosaccade generation occurs in these 5 ROIs in all threegroups, we subsequently extracted the magnitudes of BOLD activa-tions from two critical sub-processes of pro and antisaccade genera-tion: task set establishment and response execution.
ROI analysisPrep trials contain the task set component only, and we expected
the prep trials to comprise the same preparatory state that would alsobe present in the first part of the saccade trials before the target waspresented (Fig. 1). Therefore, prep trial activation should reveal thesame underlying component of task set in the same ROIs defined bythe main contrast. A random effects analysis of the peak locationswithin the DLPFC, SEF, FEF, PEF and CN ROIs, was conducted for proand anti prep trials (Fig. 4A). (Unless indicated by ‘R’ for ‘right’, valuesfrom bilateral activations were averaged.) One-way ANOVAs revealedthat significant or marginally significant group differences resultedfor pro prep in CN, F(2,36)=5.75, Pb0.01, η2=0.24 and SEF,F(2,36)=2.37, P=0.1, η2=0.12, and significant or marginally

A
time (s)
FEF (Control)
mea
n be
ta w
eigh
t
-0.4
0
0.4
0.8
1.2
4.6 7.7 10.8 13.8 16.9 20.01.5
Antisaccade – Prosaccade
PD OFF ControlPD ON
R L
SEF
FEF
PEF PEF
FEF
SEF
DLPFC
CN CN
Z=55
X=13
Y=35
8.00
3.06-3.06
-8.00
T value
P < 0.01
DLPFC
B
Y=40
antipro
time points3 5 7 9 11 131
Fig. 3. Saccade trial contrast map. (A) Contrast of prosaccade trials subtracted from antisaccade trials (Fig. 1), thresholded at Pb0.01, and cluster size corrected at Pb0.01 (8 con-tiguous voxels). Significantly greater BOLD activation is shown in the saccade regions of interest for antisaccades (‘hot’ colors) as labeled. Dotted lines indicate putative DLPFC re-gions. Coordinate values of planes in Talairach space are indicated. (B) Representation of mean BOLD signal time course for pro and antisaccade trials from FEF region in controlsubjects in A. Shaded area corresponds to a region of peak activation from trial onset. The three time points (5,6,7) under the shaded area were used to compute the contrastmaps in A. Error bars correspond to standard error of the mean (SE), R=right, L=left.
1161I.G.M. Cameron et al. / NeuroImage 60 (2012) 1156–1170
significant differences resulted for anti prep in CN, F(2,36)=7.27,Pb0.01, η2=0.29, PEF, F(2,36)=3.19, P=0.05, η2=0.15 and SEF,F(2,36)=2.64, P=0.09, η2=0.13. Subsequently, independent t-tests were performed to compare one group to another (uncorrected;shown in Fig. 4). Note that in general, the two frontal motor areas in-volved in antisaccade programming, SEF and FEF (Everling andMunoz, 2000; Schlag-Rey et al., 1997) had greater activation forboth pro and anti preparation in the controls. A similar trend wasshown in the PEF and CN.
The activation patterns related only to the saccade execution com-ponents were calculated using the same ROIs defined in the maincontrast; however, prep trial activation was first subtracted from sac-cade trial activation, prior to pro being subtracted from anti, to isolatethe components related to target appearance and saccade execution(Fig. 4B). No statistical differences between the group responseswere observed, F(2,36)=2.50, P>0.09, other than between PD pa-tients that were off- and on-meds in PEF for prosaccades (Pb0.05, t-test, Fig. 4B).
Taken together, there were several differences in the ROI activa-tion patterns between the groups that occurred during task set estab-lishment, whereas there was only one difference between the groupsfound during saccade execution.
Direct prep trial and execution period contrastsTo complement the above analysis, we also contrasted pro and anti
prep trial and execution period activations directly. The importance of
direct contrasts is that they allow us to directly identify ROIsshowing greater activation for anti task set compared to pro taskset, or anti execution compared to pro execution, as the ROIsidentified from the main contrast (Fig. 3A) contain both compo-nents. These results show that there was greater activation foranti preparation throughout in the frontal ROIs (FEF, SEF, DLPFC)in controls and in PD on-meds (Fig. 5A, Talairach locations ofpeak activations given in Table 3), but not in PD off-meds. ForPD patients that were off-meds, greater anti prep activation wasseen in the CN instead. Table 3 lists all brain regions that showedgreater activation for anti or pro preparation in each group. How-ever, there were no significant increases in anti execution com-pared to pro execution in any of the frontal ROIs, other than ina putative left DLPFC region in the PD off-meds group, and inthe left FEF in controls (Fig. 5B, Table 4). Thus, the significant dif-ferences across the groups between pro and antisaccade processesat the contrast level were also more apparent during task setestablishment.
Anti direction error analysisTo determine if greater preparatory activation correlated to better
antisaccade performance, the BOLD response curves in the ROIs oncorrect and direction error trials were compared, which also allowedus to determine if any differences arose for the time points corre-sponding more to preparation (e.g., time point 5) than to the execu-tion component (e.g., time point 7). BOLD response curves were

A
B
mea
n be
ta w
eigh
t(a
t pea
k)
-0.2
0
0.2
0.4
0.6 SEF
Execution
Preparation
-0.2
0
0.2
0.4
0.6
-0.2
0
0.2
0.4
0.6
pro anti
CN (R)
**
**
SEF*
†
†
*
pro anti-0.2
0
0.2
0.4
0.6 CN (R) DLPFC (R)
pro anti
DLPFC (R)
†
pro anti
PEF
*
FEF PEF
*
FEF †
mea
n be
ta w
eigh
t(a
t pea
k)
* P < 0.05
† P < 0.1
t -tests (independent)
PD OFF meds
PD ON meds
Control
Fig. 4. Region of interest (ROI) analysis for saccade preparation and saccade execution. (A) Mean beta weight values for time points 5 and 6 from an analysis of pro prep and antiprep trials for 125 cubic voxels surrounding peak activations in the saccade ROIs in Fig. 3A. (Bilateral activations were averaged unless indicated. Note that ‘DLPFC(R)’ includes pu-tative right DLPFC in PD OFF and control groups). Error bars correspond to standard error of the mean (SE). (B) Mean beta weight values for time points 6 and 7 for the saccadeexecution period (saccade trials–prep trials).
1162 I.G.M. Cameron et al. / NeuroImage 60 (2012) 1156–1170
extracted from a random effects analysis from the main contrastROIs (Fig. 3A). It can be seen in Fig. 6 that PD patients off-medsdisplayed enhanced early activation on correct antisaccade trialsin the putative right DLPFC region, but not in the frontal motorregions (SEF and FEF). In contrast, controls and PD patients on-meds did show trends for enhanced activation in SEF and FEFfor correct antisaccade trials. Because the differences occurredmost prominently at the 5th time point (7.7 s) from trial onset,repeated measures ANOVAs with the factors of ‘time point’ (4th,5th, 6th) and ‘performance’ (correct and error) were conductedto assess the statistical significance of this enhanced activation.The results revealed that in control subjects only, FEF activationfor correct antisaccades was significantly greater across thesethree time points compared to erroneous antisaccades, F(1,12)=4.98, Pb0.05, η2=0.29 (Fig. 6). No other tests reached signifi-cance, F(1,12)b2.68, P>0.1, other than in the putative rightDLPFC in PD off-meds, F(1,12)=4.89, Pb0.05, η2=0.29. Notethat this same analysis was conducted from peak activation loca-tions in ROIs defined by antisaccade trials compared to baseline(fixation), but the results revealed similar results overall (e.g., en-hanced FEF activation for correct antisaccade trials in controlsonly) and so are not reported. The prosaccade and antisaccadecontrast maps relative to baseline are shown in SupplementaryFig. 1.
Correlational analysisTo determine whether differences in the magnitudes of anti task
set activation across subjects correlated to behavior and UPDRS scoresfor PD patients (Table 1), beta weights from the 5th and 6th timepoints of anti prep trials were extracted from an ROI analysis of the
peak locations of FEF in antisaccade activation maps defined foreach subject separately (not shown). The 5th, 6th and 7th time pointswere used to define the subject specific FEF ROI. The analysis was con-ducted on FEF because of the findings described above, and ourknowledge of the role of FEF neuronal populations in antisaccadegeneration (Everling and Munoz, 2000).
It can be seen that PD patients that were off-meds displayedtrends for negative correlations of anti preparatory activation withanti direction errors, as well as with measures of disease state basedon UPDRS scores (Fig. 7). Additional participants were includedwhere appropriate (see Fig. 7 caption and Table 1), and separate lin-ear regressions are displayed for the larger dataset (dotted line) aswell as the core 13 (solid line). The correlation involving UPDRS PartIII (N=18) approached significance for PD off-meds, t(16)=−1.90,P=0.075, as did the correlation involving SRT for the control groupwhich included an additional 4 participants from our database(N=17), t(15)=−1.85, P=0.08. No correlations were significantlydifferent fromone another, (Fisher's z-test, Zb1.12, P>0.26). In general,the higher the preparatory activation, the less severe was the diseasestate for PD patients that were off-meds, and the better the subject'sperformance was.
To support this observation, we converted the heterogeneousmedication regimens of the on-meds group into Levodopa EquivalentDoses (LED), based on the methods of Tomlinson et al. (2010). Be-cause LDOPA was not prescribed to patients unless a therapeutic ben-efit from taking dopamine agonists primarily was not sufficient, wehypothesized that there would be a negative correlation of anti prepactivation with LED, but positive correlations with behavior (direc-tion errors and SRT) reflecting the fact that a greater LEDmight corre-spond to patients whose disease state was greater. As expected, there

Table 2Talairach coordinates (X,Y,Z) of peak activations in GLM contrast maps for Antisac-cade–Prosaccade contrast (Fig. 3A) (saccade ROIs in bold).
Group and region X Y Z T value Volume of cluster(voxels)
PD OFFRight DLPFC (putative) 36 32 43 4.19 12Right FEF† 24 −7 58 5.33 43Left FEF −21 −16 55 5.52 23SEF† 0 −10 52 6.04 31Right CN 12 −1 19 8.74 114Left PEF†† −15 −64 46 5.97 158Right PEF†† 9 −67 55 5.11 25Right medial frontal gyrus† 3 41 40 7.50 428Left claustrum −30 5 10 5.28 42Left putamen −24 −4 13 5.29 47Right inferior parietal lobule 60 −37 25 7.40 57Left superior parietal lobule −39 −55 52 4.67 22Right superior parietal lobule†† 30 −58 52 6.16 352*Right cuneus 3 −76 13 −4.61 47
PD ONRight DLPFC 33 32 40 5.63 38Right FEF(superior frontal sulcus)†
21 −7 67 10.04 486
Right FEF (lateral)† 39 −7 52 6.18 29Left FEF −24 −13 55 7.56 209SEF† −3 −4 49 5.50 37Right CN 9 11 7 6.69 193Left PEF†† −12 −64 43 7.95 236Right PEF†† 24 −64 55 5.79 44Right insula 30 23 13 4.72 33Left putamen −21 5 4 4.78 26Right precentral gyrus 48 2 34 6.12 49Left cingulate cortex −3 −2 31 6.09 26Left thalamus −12 −16 7 4.53 18Right inferior parietal lobule†† 42 −31 37 8.54 1,183
ControlRight DLPFC (putative) 36 47 40 4.38 17Right FEF 27 −10 49 5.22 104Left FEF −21 −10 55 4.69 35SEF 9 −4 55 5.50 215Right CN 15 −1 13 3.98 17Left PEF −33 −61 49 6.04 99Right PEF 12 −67 49 5.12 146Right medial frontal gyrus 6 38 31 4.45 22Right insula 33 17 16 4.34 35Left insula −39 17 4 4.29 14Right medial frontal gyrus 21 5 52 4.45 17Right inferior parietal lobule 60 −37 31 4.44 15Right inferior parietal lobule 30 −46 43 5.71 69Left inferior parietal lobule −39 −46 43 3.95 30
Symbols and definitions: DLPFC, dorsolateral prefrontal cortex; CN, caudate nucleus;FEF, SEF, PEF, frontal, supplementary, parietal eye fields; *, pro>anti; †,††, saccadeROI included in larger cluster area indicated by identical symbols (>300 voxels).
1163I.G.M. Cameron et al. / NeuroImage 60 (2012) 1156–1170
was a trend for a negative correlation between LED and FEF meanbeta weight in the 13 participants (Fig. 7), however it did notreach significance (P=0.13). A positive correlation of LED withSRT did reach significance with N=20 participants (notshown), R2=0.22, t(18)=2.23, Pb0.05, but correlations withanti direction errors did not (P>0.27). However, anti directionerrors were affected by one outlier (91% direction errors),which when removed, also yielded a significant positive correla-tion of anti direction errors with LED for the 12 (remaining)core participants, R2=0.42, t(10)=2.67, Pb0.05, and for 19 pa-tients, R2=0.21, t(17)=2.06, P=0.05. This suggests worse per-formance in patients who were taking greater amounts ofmedication, reflecting a relationship to disease state. Indeed, wealso observed positive correlations between UPDRS Part III(motor) scores and antisaccade SRT in PD patients off-meds,R2=0.43, t(11)=2.90, Pb0.05 and on-meds, R2=0.48, t(11)=3.17,Pb0.01; R2=0.52, t(18)=4.45, Pb0.01. Correlations involving UPDRSPart III scores and anti direction errors did not approach significance(P>0.40).
Medication effects
Following these findings, we analyzed medication effects withmore detail, by dividing the patients into those regularly taking levo-dopa (‘LDOPA’) (N=7), and those not regularly taking (‘no-LDOPA’)(N=6) (Table 1). Doing so roughly divided the group into half andprovided enough participants in each sub-group for random effectsanalyses. This also allowed us to further examine disease severity in-directly (because LDOPA was not prescribed to patients unless thetherapeutic benefit from taking dopamine agonists primarily wasnot sufficient). As confirmed from Table 1, the mean UPDRS motorscores for the PD patients not taking LDOPA was lower (21.7 off-meds session; 18.2 on-meds session) than for the patients takingLDOPA (25.0 off-meds; 20.9 on-meds session).
The results from behavioral comparisons between these groups areillustrated in Supplementary Analysis, and in Supplementary Fig. 2. Re-sults from fMRI contrasts (conducted in identical fashions as in Figs. 3and 5) are described in Supplementary Analysis, and in SupplementaryFigs. 3 and 4. We also directly contrasted anti and pro activations acrossthe two medication groups (Supplementary Figs. 5 and 6). In general,the ‘LDOPA group’, on-meds, displayed similar cortical activation pat-terns to the control subjects and Figs. 3 and 5, but interestingly theydid not perform the antisaccade task as well as the controls, or eventhe ‘no-LDOPA group’ (Supplementary Fig. 2A). Most interestingly, anemerging trend showed that, in general, CN activation was greater forantisaccades off-meds in the no-LDOPA group (Supplementary Figs. 5and 6), but DLPFC activation was greater in the LDOPA group, on-meds (Supplementary Figs. 3 ,4 and 6). Moreover, despite the greaterDLPFC activation on-meds, the LDOPA group did not get as much of aperformance benefit from taking medication (Supplementary Fig. 2A).
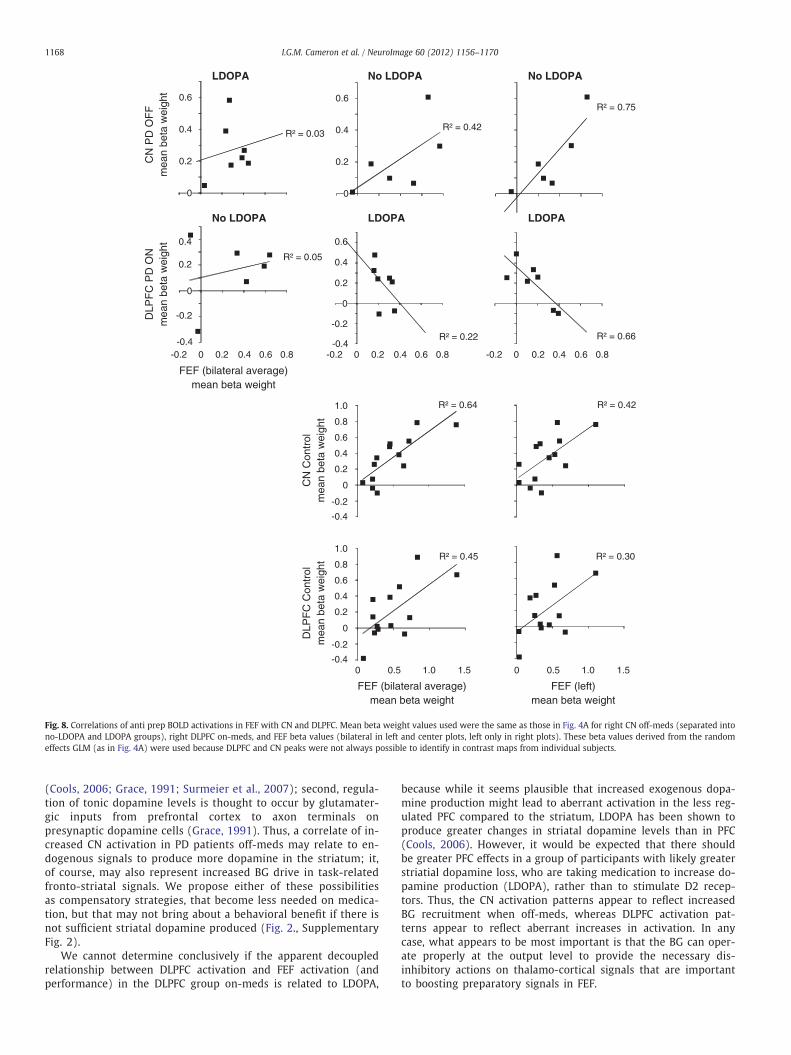
To further explore these findings, we examined correlations be-tween anti prep CN activation and anti prep FEF activation (derivedfrom the beta values in Fig. 4) when patients were off-meds, and be-tween anti prep DLPFC and FEF activation when patients were on-meds. A positive correlation resulted between the no-LDOPA group'soff-meds activation in RCN and FEF, R2=0.42 that interestingly,reached significance when correlated with left FEF only (R2=0.75,t(4)=3.42, Pb0.05) (Fig. 8). Only a weakly positive trend was seenin the LDOPA group off-meds between RCN and FEF, R2=0.17.However, there was a negative correlation between RDLPFC andFEF activation in the LDOPA group on-meds, R2=0.22, that wasagain stronger, and significant, with left FEF (R2=0.66, t(5)=−3.09, Pb0.05) (Fig. 8). For controls, it can be seen that strongpositive correlations resulted between RCN and FEF (bilateral)(R2=0.65, t(11)=4.46, Pb0.01), and RDLPFC and FEF (bilateral)(R2=0.45, t(11)=3.00, Pb0.05) (Fig. 8) suggesting that the neg-ative DLPFC–FEF correlations in PD patients taking LDOPAreflected something aberrant to performance, and the lateraliza-tion effect in these correlations was specific to the participantswith PD. The DLPFC–FEF correlations between the LDOPA groupand controls were significantly different for both FEF bilateral(Fisher's z-test, Z=2.23, Pb0.05), and FEF left (Z=2.96, Pb0.01).
Discussion
Here, we propose that in Parkinson's disease (PD), reduced brainactivation in the frontal cortex corresponds to ineffective pre-settingof networks important to voluntary saccade generation. First, where-as controls showed greater activation for anti preparation throughoutthe cortical saccade network in the anti prep compared to pro prepcontrast (Fig. 5A), PD patients off medication did not. Second, a re-duced enhancement of an early rise in preparatory activation in FEFon correct antisaccade trials compared to incorrect antisaccade trialswas also observed in PD compared to the controls (Fig. 6), providingan important neural correlate to performance in a motor commandregion. Finally, medication led to improved performance trends,

A
B
Anti Prep – Pro Prep
PD OFF ControlPD ON
R L
X=13
Y=35
SEF
FEF
PEF PEF
FEF
SEF
DLPFC DLPFC
CN
Y=40
8.00
3.06-3.06
-8.00
T value
P < 0.01
Anti Exec – Pro Exec
Z=50
X=13
Y=40
PEF
FEF
DLPFC DLPFC
8.00
3.06-3.06
-8.00P < 0.01
T value
Z=55
Fig. 5. Saccade preparation and saccade execution contrast maps. (A) Preparation contrast: anti prep–pro prep, thresholded at Pb0.01, and cluster size corrected at Pb0.01 (8 con-tiguous voxels). The 5th and 6th time points relative to trial onset were used. The 5 saccade ROIs are indicated. (B) Execution contrast: (antisaccade–anti prep)–(prosaccade–proprep). The 6th and 7th time points from trial onset were used. Dotted line indicates putative DLPFC region.
1164 I.G.M. Cameron et al. / NeuroImage 60 (2012) 1156–1170
however not to the levels attained by controls; it also produced al-tered activation patterns between DLPFC, CN and FEF when PD pa-tients were divided based on medication regimen, suggesting adecoupling between these regions. From these findings, we proposethat PD patients were less efficient at establishing voluntary task setin networks important to controlling a voluntary motor behavior.This is consistent with a general view that decreased cortical func-tioning can occur in PD, as the result of disrupted dis-inhibitorymechanism of the BG direct pathway on thalamo-cortical excitation(Dagher and Nagano-Saito, 2007; Mink, 1996; Nambu, 2005).
There were two main observations from our results that permit usto make the inference that PD patients have impaired dis-inhibitorymechanisms affecting antisaccade task set. First, it has been shownconsistently that antisaccade activation in the 5 saccade ROIs westudied is greater than prosaccade activation (Brown et al., 2006,2007; Connolly et al., 2002, 2005; Curtis and Connolly, 2008; Curtisand D'Esposito, 2003; DeSouza et al., 2003; Ford et al., 2005; Luna etal., 1998; Sweeney et al., 1996), and this greater activation is pre-sumed to reflect, in part, the executive processes (e.g., response inhi-bition, top-down attentional direction) necessary for generating acorrect antisaccade (Munoz and Everling, 2004). Importantly, it isknown that the prefrontal and premotor cortices containing DLPFC,
SEF and FEF are influenced by BG output (Alexander et al., 1986).Throughout these saccade ROIs, we observed that control subjectstypically showed higher levels of preparatory activation on both proand anti trials (Fig. 4A), suggesting that they were better able to es-tablish a task set based on a given instruction. Second, the measuresof the preparatory component of activation for correct antisaccadeswere greater in magnitude compared to those for antisaccade direc-tion errors in FEF for control subjects (Fig. 6), and anti prep trial acti-vation was greater, in general, than pro prep trial activation forcontrol subjects, and for PD patients on-meds to some extent(Figs. 4A, 5A). Overall, this suggests that controls were best able toutilize the instruction-related information to configure the appropri-ate task set in the oculomotor network required for optimal behavior-al performance.
To understand what antisaccade task set may be at the neurallevel, knowledge from monkey neurophysiology provides a sensibleinterpretation based on how neurons in FEF are configured to appro-priate levels of activity prior to the generation of a desired behavior.FEF has a specialized role in generating voluntary saccade motor com-mands (Hanes and Schall, 1996), and it also contains mechanisms tosuppress automatic saccades, via enhanced activity in a distinct pop-ulation of ‘fixation’ neurons along with reduced activity in ‘saccade’

Table 3Talairach coordinates (X,Y,Z) of peak activations in GLM contrast maps for Anti Prep–Pro Prep contrast (Fig. 5A) (saccade ROIs in bold).
Group and region X Y Z T value Volume of cluster(voxels)
PD OFFRight CN 12 2 13 6.71 49Left PEF −24 −64 46 5.31 14Superior frontal gyrus 0 11 49 5.08 54Right anterior cingulate cortex 9 −4 43 4.72 18Left inferior parietal lobule −39 −37 40 4.43 15Right inferior parietal lobule 36 −49 37 5.30 56Right precuneus 27 −70 37 5.31 14
PD ONRight DLPFC 33 29 37 4.91 20Left DLPFC −36 35 40 5.60 66Right FEF 24 −10 49 5.26 64Right FEF(superior frontal sulcus)
18 −10 70 4.96 14
Left FEF −30 −7 46 5.13 14Left FEF (lateral) −45 −7 46 3.98 18Left FEF (superior frontal sulcus) −18 −16 67 4.92 36SEF 3 −1 58 3.6 22Left PEF −15 −55 46 5.50 30Right middle frontal gyrus 30 41 25 7.65 14Right inferior frontal gyrus 42 41 7 4.94 13Right anterior cingulate cortex 6 23 34 5.67 25Left claustrum −27 26 10 4.95 16Right claustrum 27 17 13 5.60 30Left putamen −24 5 7 6.21 97Right precentral gyrus (inf. lat.) 54 2 13 4.71 35Right inferior parietal lobule 30 −40 55 4.34 77Left inferior parietal lobule −36 −43 46 4.85 31Right supramarginal gyrus 60 −46 28 5.74 101Right parahippocampal gyrus 39 −49 4 4.30 16Left superior temporal gyrus −60 −49 22 5.53 11Right precuneus 3 −55 46 6.16 186Right middle temporal gyrus 27 −55 31 4.01 17
ControlRight DLPFC 30 41 43 4.08 19Right FEF(superior frontal sulcus)
21 −16 70 5.58 84
SEF −6 −10 52 4.58 35Left PEF −15 −61 52 5.83 54Superior frontal gyrus 0 32 43 4.78 29Right middle frontal gyrus 45 23 40 3.95 19*Left posterior cingulate gyrus −21 −28 31 −5.09 18Right inferior parietal lobule 48 −31 31 4.39 26Right precuneus 9 −55 55 5.50 61
Symbols and definitions: DLPFC, dorsolateral prefrontal cortex; CN, caudate nucleus;FEF, SEF, PEF, frontal, supplementary, parietal eye fields; *, pro>anti.
Table 4Talairach coordinates (X,Y,Z) of peak activations in GLM contrast maps for Anti Exec–Pro Exec contrast (Fig. 5B) (saccade ROIs in bold).
Group and region X Y Z T value Volume of cluster(voxels)
PD OFFLeft DLPFC (putative) −30 44 40 5.37 21Medial frontal gyrus 0 44 13 4.25 15*Left insula −36 26 19 −5.18 68*Left inferior frontal gyrus −42 −1 19 −5.89 25*Left superior temporal gyrus −54 −22 7 −4.59 25*Left postcentral gyrus −34 −25 52 −5.42 34*Right superior temporal gyrus 45 −55 31 −5.60 68*Left superior temporal gyrus −51 −55 22 −7.28 30*Left inferior parietal lobule −45 −64 40 −5.28 26
PD ONRight medial frontal gyrus 6 44 31 5.86 70Left medial frontal gyrus −9 53 1 6.91 25Right superior frontal gyrus 21 53 25 4.19 25Right middle frontal gyrus 42 11 43 4.62 28*Right corpus callosum 6 −7 25 −6.67 28*Left corpus callosum −9 −34 16 −4.37 14*Left insula (dorsal) −30 −10 25 −5.50 33Posterior cingulate cortex 0 −25 31 4.94 26*Left paracentral lobule −9 −40 61 −5.37 57*Left inferior parietal lobule −42 −43 40 −8.29 37Right posterior cingulate cortex 9 −46 28 4.99 56*Right parahippocampal cortex 36 −49 4 −4.79 35*Left precuneus −6 −55 55 −5.57 58*Left inferior parietal lobule −36 −58 46 −5.01 19Right superior occipital gyrus −36 −76 28 4.68 35Right cuneus 3 −79 34 6.26 37*Middle occipital gyrus 21 −85 16 −5.25 33*Left cuneus −18 −88 28 −5.43 17
ControlLeft FEF −24 −10 46 5.49 26*Left anterior frontal cortex −15 53 4 −5.07 17*Left middle frontal gyrus −21 32 28 −4.87 34Left anterior cingulate cortex −3 32 16 5.87 43Right anterior cingulate cortex 3 20 34 4.42 14Right corpus callosum 9 −7 31 4.79 34*Left cuneus −9 −79 22 −5.89 18
DLPFC, dorsolateral prefrontal cortex; CN, caudate nucleus; FEF, SEF, PEF, frontal,supplementary, parietal eye fields; Exec= execution period (Saccade–Prep); *, pro>anti.
1165I.G.M. Cameron et al. / NeuroImage 60 (2012) 1156–1170
neurons, during the antisaccade instruction period (Everling andMunoz, 2000; Munoz and Everling, 2004). Therefore, execution of asuccessful antisaccade requires that firing rates of fixation and sac-cade neurons are configured to appropriate levels prior to respond-ing, representing a neural correlate of antisaccade task set. Note thatwhile similar patterns of greater activation for anti preparation com-pared to pro preparation in the saccade network were also observedin PD patients on-meds (Fig. 5A), PD patients on-meds did not per-form the antisaccade task as well as the control subjects (Fig. 2). Cor-respondingly, they did not show the same magnitudes of antisaccadepreparatory activation in FEF compared to control subjects (Fig. 4A),nor did they show the same degree of enhanced preparatory activa-tion on correct trials compared to error trials (Fig. 6), suggestingthat FEF neurons were not as effectively configured.
Our understanding of the nature of the BOLD signal relates to theproposal that enhanced fixation and reduced saccade neuron activityshould correspond with increased BOLD activation in a given brainarea. The BOLD signal correlates with synaptic activity (input), aswell as (and perhaps more than) the spiking activity (output) of a re-gion (Logothetis and Wandell, 2004; Logothetis et al., 2001). Fromthis, one could predict that the proper presetting of FEF neural
activity could be the result of incoming neural signals, and thus, re-duced BOLD activation in FEF could correspond with reduced inputsignals critical to establishing the correct preparatory levels in FEFneurons. However, where these task set signals originate is unknown,given the complex relationship between BG, DLPFC and FEF networks.
One possibility is that they are carried directly by DLPFC inputs toFEF (Munoz and Everling, 2004). While the motor, premotor (FEF andSEF), and prefrontal (DLPFC) cortices are all influenced by BG output(Alexander et al., 1986), the latter (DLPFC) is associated with generalexecutive control (Gazzaley and D'Esposito, 2007; Miller and Cohen,2001). The DLPFC is believed to be a crucial brain region involved inestablishing an antisaccade task set, because patients with DLPFC le-sions make more direction errors on antisaccade trials (Guitton etal., 1985). Patients with PD also display a variety of deficits in execu-tive control, which mirror those of prefrontal cortical dysfunction(Monchi et al., 2004; Owen, 2004; Rodriguez-Oroz et al., 2009;Williams-Gray et al., 2006), however, it has also been shown thatPD patients off medication can show enhanced prefrontal functiondepending on task demands (Cools et al., 2010). We observed thatenhanced DLPFC activation for anti prep trials compared to pro preptrials was not present in the PD off-meds group (Fig. 5A), suggestingthat the resolution of the instruction into the establishment of an ap-propriate task set was less efficient in PD patients when off medica-tion. This follows a hypothesis that DLPFC is important toestablishing appropriate voluntary task set signals. However, we didobserve that there was enhanced activation in putative DLPFC for cor-rect compared to erroneous antisaccade trials in PD patients off-meds

mea
n be
ta w
eigh
t
PD OFFSEF PEF CN (R) † DLPFC (R)
-0.4-0.2
00.20.40.60.8
FEF
PD ON
-0.4-0.2
00.20.40.60.8
DLPFC (R)
time (s)
-0.4-0.2
00.20.40.60.8
Anti Correct
Anti Error
† DLPFC (R)Control
**
*
* **
Fig. 6. Comparison of BOLD activation on correct and erroneous antisaccade trials, extracted from the 125 cubic voxels surrounding peak activations in the 5 saccade ROIs (Fig. 3A).Light gray dotted lines indicate 5th time point, with pink shading used to highlight enhanced activation around the 5th time point on correct anti trials in frontal regions (SEF, FEFand putative DLPFC). †DLPFC(R) corresponds to putative right DLPFC regions (Fig. 3A dotted lines). Error bars correspond to standard error of the mean (SE). *Pb0.05 (ANOVA)between correct anti trials and anti direction errors.
1166 I.G.M. Cameron et al. / NeuroImage 60 (2012) 1156–1170
(Fig. 6), and we did also see that putative left DLPFC showed en-hanced anti compared to pro execution activation in PD patientsoff-meds (Fig. 5B), though we hypothesize that enhanced activationduring the execution component occurs too late to be related to suc-cessful task performance. This supports another possibility (thoughnot independent), that for task set signals to be translated to FEF, a‘boosting’ mechanism, derived from BG-mediated dis-inhibition ofthalamo-FEF signals is required (Alexander et al., 1986; Hikosakaand Isoda, 2010; Mink, 1996; Munoz and Everling, 2004), and thismechanism would be expected to be impaired in PD, where de-creased striatal dopamine is thought to result in a shift towards in-creased BG inhibitory output. Similar to this hypothesis, is a case inwhich task set signals originate in DLPFC inputs to FEF, however theestablishment of the appropriate task set signals in DLPFC is also de-pendent on the assistance of BG-mediated dis-inhibition.
To reconcile these possibilities, we examined the effects of medi-cation in PD patients more specifically because this was what pro-duced interesting CN and DLPFC activation patterns (Figs. 4–6). Indoing so, we also took advantage of the fact that we were comparingpeople with a less advanced disease state to a more advanced state.Our interpretations based on group medication effects are explainedin the following section, and do suggest the importance of the re-quirement of functioning BG signals to properly establish task set sig-nals in FEF.
Medication effects
While medication appeared to improve behavioral performance, itdid not result in a statistical improvement (Fig. 2). Patients not takingLDOPA did show improved performance trends on antisaccade trialswhen taking medication, but those taking LDOPA did not (see Supple-mentary Fig. 2). This is interesting, because it has been shown in an-other study of 14 PD patients taking LDOPA with dopamine agoniststhat medication did reduce antisaccade direction error rate (Hood etal., 2007). A likely possibility for this discrepancy, is that our taskwas more complex because anti and pro trials were interleaved, andthe prep trials introduced an added complexity of not responding
on every trial. Cognitive inflexibility in PD patients is a known prob-lem (Cools, 2006; Monchi et al., 2004; Rodriguez-Oroz et al., 2009),and we have observed that PD patients on-meds (including LDOPA)do display greater difficulty in antisaccade preparation when movingfrom blocked designs to interleaved trials containing unpredictablechanges in task requirement (Cameron et al., 2010). Thus, it wouldnot be surprising that a group of patients taking LDOPA would showimproved performance in simpler tasks only.
When fMRI contrasts between anti and pro processes within med-ication groups were produced (Supplementary Figs. 3 and 4), as wellas contrasts between groups for anti processes (Supplementary Figs.5 and 6), it was revealed that greater anti activation in CN generallyresulted for the no-LDOPA group off-meds, while greater DLPFC acti-vation resulted for the LDOPA group on-meds. Recall that only the no-LDOPA group received a marginal benefit of decreased anti-saccadeerror rates when on-meds (Supplementary Fig. 2), suggesting thatenhancing DLPFC activation does not, on its own, correlate with im-proved performance. Greater DLPFC activations in the LDOPA group,off- or on-meds, could reflect a compensatory component to BG im-pairment that is simply not effective. Indeed, it has been observedby others that PD patients can show increased PFC activation inde-pendent of BG activation (Leh et al., 2010), This also fits with the find-ing that greater putative DLPFC activation was seen in correctcompared to erroneous antisaccade trials off-meds (Fig. 6), but over-all, PD patients off-meds performed the worst. We did not, however,observe a further behavioral detriment when the LDOPA group tooktheir medication (Supplementary Fig. 2), so we cannot assume tohave an ‘overdosing’ effect of dopamine in DLPFC (Cools, 2006;Williams and Goldman-Rakic, 1995). What can be stated clearly how-ever, is that despite the observed increases in DLPFC activation,there was not a corresponding increase in FEF activation duringcritical components of preparation (Fig. 6, Supplementary Figs.4–6), suggesting DLPFC activation in PD may not relate to estab-lishing necessary task set signals in FEF. We propose that it iscritical that task set signals result in effective FEF neuronal con-figuration, which we suggest depends on functional BG dis-inhibitory mechanisms.

R² = 0.11
R² = 0.10
R² = 0.14R² = 0.00
0
20
40
60
80
100
R² = 0.00R² = 0.03
R² = 0.19R² = 0.18
250
300
350
400
450
500
0 0.5 1 1.5 2
R² = 0.01R² = 0.03
250
300
350
400
450
500
550
R² = 0.18R² = 0.07
0
10
20
30
40
50
60
R² = 0.02R² = 0.00
0
10
20
30
40
50
R² = 0.00R² = 0.03
0
5
10
15
20
25
0 0.4 0.8 1.2
All (Core 13 + additional participants)
Core 13
All (Core 13 + additional participants)
Core 13
R² = 0.14R² = 0.10
0
5
10
15
20
25
0.2 0.4 0.6 0.8 1 1.2
R² = 0.00
R² = 0.14
250
300
350
400
450
500
mean beta weight
mean beta weight
SR
T (
ms)
Dire
ctio
n E
rror
s (%
)U
PD
RS
Par
t III
(mot
or)
UP
DR
S P
art I
I (A
DL)
PD OFF PD ON Control
0
10
20
30
40
0
20
40
60
80
R² = 0.00
R² = 0.12
1800
1200
600
0
LED
mean beta weight
Fig. 7. Correlations of BOLD activation in FEF with antisaccade behavior (direction errors and SRT) and disease state. Mean beta weight values were extracted from time points 5 and6 from an analysis of anti prep trials for 125 cubic voxels surrounding peak FEF activations on individual subject's antisaccade activation maps (averaged between hemispheres).‘Core 13’ corresponds to the 13 participants used in the full analysis, whereas ‘All’ consists of the Core 13 plus additional participants (listed in Table 1) as follows: PD OFF: 15, 21, 22,23, 24; PD ON: 16, 17, 21, 22, 23, 24, 25. Additional control subjects from our database that could be age-matched to the additional PD patients were included (N=4). ADL, Activitiesof Daily Living. LED, Levodopa Equivalent Dose.
1167I.G.M. Cameron et al. / NeuroImage 60 (2012) 1156–1170
If the BOLD signal does reflect a significant component of syn-aptic processes (input) as described previously, this stronglysuggests that the depleted dopamine levels in PD patients off-meds does not in itself result in decreased CN BOLD activation.We suggest instead that CN activation in the PD patients off-meds may also reflect compensatory recruitment of BG process-es, especially in the relatively less advanced patients, but in-creased DLPFC may be related to aberrant activation in moreadvanced patients when on medication. It has been shown thatexogenous dopamine can exert beneficial, as well as detrimental
effects on behavior based on its relation to intrinsic levels instriatal areas (Cools, 2006; Cools et al., 2001, 2010), and in PFC(Seamans and Yang, 2004; Williams and Goldman-Rakic, 1995;Yang and Seamans, 1996). The fact that the LDOPA groupshowed greater DLPFC activation on-meds, but neither groupshowed greater CN activation on-meds, makes sense when oneconsiders the following points: first, dopamine agonists are ac-tive on D2 receptors which are much more abundant in the stria-tal indirect pathway neurons than the PFC, and auto-regulationof dopamine levels is stronger in the striatum than in the PFC
R² = 0.03
R² = 0.05
FEF (bilateral average)mean beta weight
DLP
FC
PD
ON
mea
n be
ta w
eigh
t
LDOPA No LDOPA
0.2
0.4
0.6
No LDOPA
No LDOPA LDOPA LDOPA
0.2
0.4
-0.4
-0.2
0
R² = 0.22
0.2
0.4
0.6
0
-0.4
-0.2
0
R² = 0.42
0.2
0.4
0.6
0
R² = 0.75
R² = 0.66
0.2 0.4 0.6 0.80-0.2 0.6 0.80-0.2 0.6 0.80-0.2 0.2
FEF (left)mean beta weight
FEF (bilateral average)mean beta weight
R² = 0.64 R² = 0.42
R² = 0.45 R² = 0.30
0.2
0.4
0.6
-0.4
-0.2
0.8
1.0
0
0.2
0.4
0.6
-0.4
-0.2
0.8
1.0
0
0.5 1.00 1.5 0.5 1.00 1.5
0.2 0.4 0.4
CN
PD
OF
Fm
ean
beta
wei
ght
DLP
FC
Con
trol
mea
n be
ta w
eigh
tC
N C
ontr
olm
ean
beta
wei
ght
Fig. 8. Correlations of anti prep BOLD activations in FEF with CN and DLPFC. Mean beta weight values used were the same as those in Fig. 4A for right CN off-meds (separated intono-LDOPA and LDOPA groups), right DLPFC on-meds, and FEF beta values (bilateral in left and center plots, left only in right plots). These beta values derived from the randomeffects GLM (as in Fig. 4A) were used because DLPFC and CN peaks were not always possible to identify in contrast maps from individual subjects.
1168 I.G.M. Cameron et al. / NeuroImage 60 (2012) 1156–1170
(Cools, 2006; Grace, 1991; Surmeier et al., 2007); second, regula-tion of tonic dopamine levels is thought to occur by glutamater-gic inputs from prefrontal cortex to axon terminals onpresynaptic dopamine cells (Grace, 1991). Thus, a correlate of in-creased CN activation in PD patients off-meds may relate to en-dogenous signals to produce more dopamine in the striatum; it,of course, may also represent increased BG drive in task-relatedfronto-striatal signals. We propose either of these possibilitiesas compensatory strategies, that become less needed on medica-tion, but that may not bring about a behavioral benefit if there isnot sufficient striatal dopamine produced (Fig. 2., SupplementaryFig. 2).
We cannot determine conclusively if the apparent decoupledrelationship between DLPFC activation and FEF activation (andperformance) in the DLPFC group on-meds is related to LDOPA,
because while it seems plausible that increased exogenous dopa-mine production might lead to aberrant activation in the less reg-ulated PFC compared to the striatum, LDOPA has been shown toproduce greater changes in striatal dopamine levels than in PFC(Cools, 2006). However, it would be expected that there shouldbe greater PFC effects in a group of participants with likely greaterstriatial dopamine loss, who are taking medication to increase do-pamine production (LDOPA), rather than to stimulate D2 recep-tors. Thus, the CN activation patterns appear to reflect increasedBG recruitment when off-meds, whereas DLPFC activation pat-terns appear to reflect aberrant increases in activation. In anycase, what appears to be most important is that the BG can oper-ate properly at the output level to provide the necessary dis-inhibitory actions on thalamo-cortical signals that are importantto boosting preparatory signals in FEF.

1169I.G.M. Cameron et al. / NeuroImage 60 (2012) 1156–1170
Lateralization
The correlational analysis (Fig. 8), as well as the general hemi-spheric dominance for right side activations in DLPFC and CNthroughout the main results suggests that there are lateralization fac-tors to consider. Supplementary Fig. 1, which shows pro and antisac-cade activation compared to baseline, does illustrate a right-hemisphere dominance for DLPFC. CN activations were bilateral, butwere dominant in the right-hemisphere in terms of spread and mag-nitude. The fact that there is dominance for the right hemisphere isinteresting, but we are not aware of any study that has conclusivelyexplained why. The striatum receives cortical projections from bothhemispheres (McGeorge and Faull, 1989), and we recently modeledantisaccade programming with respect to the BG as requiring ipsilat-eral and contralateral signals to generate a correct antisaccade(Watanabe and Munoz, 2010). However, in a previous fMRI study ofthe CN during a pro and antisaccade switch task, we observed greateractivation of the right CN (Cameron et al., 2009), and a recent studyby others observed that theta burst transcranial magnetic stimulation(TMS) over left, but not right, DLPFC impaired performance in aswitching task, and correspondingly, less dopamine release was ob-served in the CN bilaterally (Ko et al., 2008). Together, this suggeststhat different task requirements may recruit differences in DLPFC-BG hemispheric recruitment, however, further studies are needed tounderstand this. The stronger correlations in the PD patients betweenRCN and left FEF, and RDLPC and left FEF is interesting, though mayreflect the fact that the patients in this study were as a majorityright-side affected (i.e., UPDRS motor scores were higher on theright side than left).
SEF and PEF
While our focus has been on understanding FEF activation pat-terns in relation to DLPFC and CN, we must address the fact that SEFand PEF showed patterns for greater activation in antisaccade prepa-ration and generation as well, that was overall greater in the controlsubjects. SEF has also been shown to be important in antisaccade pro-gramming, in particular, in mediating voluntary saccade generationwhen alternative or conflicting responses are possible (Coe et al.,2002; Parton et al., 2007; Schlag-Rey et al., 1997). Moreover, SEF neu-rons show enhanced firing rates prior to antisaccade generation com-pared to prosaccade generation (Schlag-Rey et al., 1997), suggestingthat insufficient presetting of SEF in PD may also contribute to im-paired antisaccade behavior. PEF also showed greater activation incontrols and PD patients on-meds compared to off-meds, suggestingthat it too may be related to antisaccade deficits in PD, or at least tochanges in processing in the oculomotor network. Enhanced PEFBOLD activation for antisaccade processes has been observed previ-ously (Brown et al., 2007; Curtis and Connolly, 2008; Ford et al.,2005) and might reflect modulation of attention in fronto-parietalnetworks (Bisley and Goldberg, 2010; Curtis et al., 2005; Desimoneand Duncan, 1995; Miller and Cohen, 2001) important to generatinga saccade away from a peripheral stimulus. Tasks that require ‘top-down’ attentional deployment typically result in decreased corticalactivation in PD (Dagher and Nagano-Saito, 2007), and frontal–parie-tal networks have been implicated as being important to executivefunction, attention, and spatial working memory (Leh et al., 2010).Thus, it is likely that SEF and PEF also play a role in a network relatedto antisaccade preparation, which as we suggest, is dependent onproper task set configuration in cortical regions important to volun-tary motor output.
Future directions and conclusion
What might these results mean in a broad context beyond saccadecontrol? Decreased frontal cortical fMRI activations in PD have been
described previously, especially in relation to BG signaling and im-paired task performance (Leh et al., 2010). However, as with thisstudy, it is not clear what increased activation means in PFC and theBG. If behavior is improved, then ‘abnormal’ (relative to control sub-jects) increases in activation are interpreted as compensatory mecha-nisms. However, if behavior is not improved, it suggests an‘overdosing’ effect of medication, failed compensation, or aberrant ac-tivations associated with worse performance. We cannot addressthese issues with this study, however, what we have shown morebroadly, is that it is important to look at executive deficits at amotor output stage where activation patterns are more interpretablewith behavioral production: this is more difficult to do in areas suchas primarymotor cortex, where there has not been, to our knowledge,characterization of neuronal signatures related to specifically to taskset. It can be concluded from this study, using the oculomotor system,that the degree to whichmotor areas can be properly configured priorto response initiation dictates subsequent performance, and might bethe major reason why PD patients display deficits in the voluntary be-havioral control. Future research studies, and treatments, of PD mighttherefore benefit from assessing how signals related to cognitivemechanisms such as task set preparation, decision making, and gen-eral executive control are modulated in motor regions.
Supplementary materials related to this article can be found on-line at doi:10.1016/j.neuroimage.2012.01.057.
Acknowledgments
Wewish to thank Sharon David for operating the MRI scanner andthe participants for their time and dedication to the study.
References
Alexander, G.E., DeLong, M.R., Strick, P.L., 1986. Parallel organization of functionallysegregated circuits linking basal ganglia and cortex. Annu. Rev. Neurosci. 9,357–381.
Amador, S.C., Hood, A.J., Schiess, M.C., Izor, R., Sereno, A.B., 2006. Dissociating cognitivedeficits involved in voluntary eye movement dysfunctions in Parkinson's diseasepatients. Neuropsychologia 44 (8), 1475–1482.
Betchen, S.A., Kaplitt, M., 2003. Future and current surgical therapies in Parkinson's dis-ease. Curr. Opin. Neurol. 16 (4), 487–493.
Bisley, J.W., Goldberg, M.E., 2010. Attention, intention, and priority in the parietal lobe.Annu. Rev. Neurosci. 33, 1–21.
Briand, K.A., Strallow, D., Hening, W., Poizner, H., Sereno, A.B., 1999. Control of volun-tary and reflexive saccades in Parkinson's disease. Exp. Brain Res. 129 (1), 38–48.
Brown, M.R., Goltz, H.C., Vilis, T., Ford, K.A., Everling, S., 2006. Inhibition and generationof saccades: rapid event-related fMRI of prosaccades, antisaccades, and nogo trials.NeuroImage 33 (2), 644–659.
Brown, M.R., Vilis, T., Everling, S., 2007. Frontoparietal activation with preparation forantisaccades. J. Neurophysiol. 98 (3), 1751–1762.
Cameron, I.G., Coe, B., Watanabe, M., Stroman, P.W., Munoz, D.P., 2009. Role of the basalganglia in switching a planned response. Eur. J. Neurosci. 29 (12), 2413–2425.
Cameron, I.G., Watanabe, M., Pari, G., Munoz, D.P., 2010. Executive impairment in Par-kinson's disease: response automaticity and task switching. Neuropsychologia 48(7), 1948–1957.
Chan, F., Armstrong, I.T., Pari, G., Riopelle, R.J., Munoz, D.P., 2005. Deficits in saccadiceye-movement control in Parkinson's disease. Neuropsychologia 43 (5), 784–796.
Coe, B., Tomihara, K., Matsuzawa, M., Hikosaka, O., 2002. Visual and anticipatory bias inthree cortical eye fields of the monkey during an adaptive decision-making task. J.Neurosci. 22 (12), 5081–5090.
Connolly, J.D., Goodale, M.A., Menon, R.S., Munoz, D.P., 2002. Human fMRI evidence forthe neural correlates of preparatory set. Nat. Neurosci. 5 (12), 1345–1352.
Connolly, J.D., Goodale, M.A., Goltz, H.C., Munoz, D.P., 2005. fMRI activation in thehuman frontal eye field is correlated with saccadic reaction time. J. Neurophysiol.94 (1), 605–611.
Cools, R., 2006. Dopaminergic modulation of cognitive function-implications for L-DOPA treatment in Parkinson's disease. Neurosci. Biobehav. Rev. 30 (1), 1–23.
Cools, R., Barker, R.A., Sahakian, B.J., Robbins, T.W., 2001. Enhanced or impaired cogni-tive function in Parkinson's disease as a function of dopaminergic medication andtask demands. Cereb. Cortex 11 (12), 1136–1143.
Cools, R., Miyakawa, A., Sheridan, M., D'Esposito, M., 2010. Enhanced frontal function inParkinson's disease. Brain 133 (Pt 1), 225–233.
Curtis, C.E., Connolly, J.D., 2008. Saccade preparation signals in the human frontal andparietal cortices. J. Neurophysiol. 99 (1), 133–145.
Curtis, C.E., D'Esposito, M., 2003. Success and failure suppressing reflexive behavior. J.Cogn. Neurosci. 15 (3), 409–418.

1170 I.G.M. Cameron et al. / NeuroImage 60 (2012) 1156–1170
Curtis, C.E., Cole, M.W., Rao, V.Y., D'Esposito, M., 2005. Canceling planned action: anFMRI study of countermanding saccades. Cereb. Cortex 15 (9), 1281–1289.
Dagher, A., Nagano-Saito, A., 2007. Functional and anatomical magnetic resonance im-aging in Parkinson's disease. Mol. Imaging Biol. 9 (4), 234–242.
Dale, A.M., 1999. Optimal experimental design for event-related fMRI. Hum. BrainMapp. 8 (2–3), 109–114.
Desimone, R., Duncan, J., 1995. Neural mechanisms of selective visual attention. Annu.Rev. Neurosci. 18, 193–222.
DeSouza, J.F., Menon, R.S., Everling, S., 2003. Preparatory set associated with pro-saccades and anti-saccades in humans investigated with event-related FMRI. J.Neurophysiol. 89 (2), 1016–1023.
Dorris, M.C., Pare, M., Munoz, D.P., 1997. Neuronal activity in monkey superior collicu-lus related to the initiation of saccadic eye movements. J. Neurosci. 17 (21),8566–8579.
Everling, S., Munoz, D.P., 2000. Neuronal correlates for preparatory set associated with pro-saccades and anti-saccades in the primate frontal eye field. J. Neurosci. 20 (1), 387–400.
Fischer, B., Weber, H., 1997. Effects of stimulus conditions on the performance of anti-saccades in man. Exp. Brain Res. 116 (2), 191–200.
Fischer, B., Weber, H., Biscaldi, M., Aiple, F., Otto, P., Stuhr, V., 1993. Separate popula-tions of visually guided saccades in humans: reaction times and amplitudes. Exp.Brain Res. 92 (3), 528–541.
Ford, K.A., Everling, S., 2009. Neural activity in primate caudate nucleus associated withpro- and antisaccades. J. Neurophysiol. 102 (4), 2334–2341.
Ford, K.A., Goltz, H.C., Brown, M.R., Everling, S., 2005. Neural processes associated withantisaccade task performance investigated with event-related FMRI. J. Neurophy-siol. 94 (1), 429–440.
Gazzaley, A., D'Esposito, M., 2007. Unifying prefrotnal cortex function: executive con-trol, neural networks, and top-down modulation. In: Miller, B.L., Cummings, J.L.(Eds.), The Human Frontal Lobes. Guildford Publications, New York, pp. 187–206.
Grace, A.A., 1991. Phasic versus tonic dopamine release and the modulation of dopa-mine system responsivity: a hypothesis for the etiology of schizophrenia. Neuro-science 41 (1), 1–24.
Guitton, D., Buchtel, H.A., Douglas, R.M., 1985. Frontal lobe lesions in man cause diffi-culties in suppressing reflexive glances and in generating goal-directed saccades.Exp. Brain Res. 58 (3), 455–472.
Hanes, D.P., Schall, J.D., 1996. Neural control of voluntary movement initiation. Science274 (5286), 427–430.
Hikosaka, O., Isoda, M., 2010. Switching from automatic to controlled behavior: cortico-basal ganglia mechanisms. Trends Cogn. Sci. 14 (4), 154–161.
Hood, A.J., Amador, S.C., Cain, A.E., Briand, K.A., Al-Refai, A.H., Schiess, M.C., Sereno, A.B.,2007. Levodopa slows prosaccades and improves antisaccades: an eye movementstudy in Parkinson's disease. J. Neurol. Neurosurg. Psychiatry 78 (6), 565–570.
Ko, J.H., Monchi, O., Ptito, A., Bloomfield, P., Houle, S., Strafella, A.P., 2008. Theta burststimulation-induced inhibition of dorsolateral prefrontal cortex reveals hemi-spheric asymmetry in striatal dopamine release during a set-shifting task: aTMS-[(11)C]raclopride PET study. Eur. J. Neurosci. 28 (10), 2147–2155.
Kwong, K.K., Belliveau, J.W., Chesler, D.A., Goldberg, I.E., Weisskoff, R.M., Poncelet, B.P.,Kennedy, D.N., Hoppel, B.E., Cohen, M.S., Turner, R., 1992. Dynamic magnetic reso-nance imaging of human brain activity during primary sensory stimulation. Proc.Natl. Acad. Sci. U. S. A. 89 (12), 5675–5679.
Leh, S.E., Petrides, M., Strafella, A.P., 2010. The neural circuitry of executive functions inhealthy subjects and Parkinson's disease. Neuropsychopharmacology 35 (1), 70–85.
Logothetis, N.K., Wandell, B.A., 2004. Interpreting the BOLD signal. Annu. Rev. Physiol.66, 735–769.
Logothetis, N.K., Pauls, J., Augath, M., Trinath, T., Oeltermann, A., 2001. Neurophysiolog-ical investigation of the basis of the fMRI signal. Nature 412 (6843), 150–157.
Luna, B., Thulborn, K.R., Strojwas, M.H., McCurtain, B.J., Berman, R.A., Genovese, C.R.,Sweeney, J.A., 1998. Dorsal cortical regions subserving visually guided saccadesin humans: an fMRI study. Cereb. Cortex 8 (1), 40–47.
McGeorge, A.J., Faull, R.L., 1989. The organization of the projection from the cerebralcortex to the striatum in the rat. Neuroscience 29 (3), 503–537.
Miller, E.K., Cohen, J.D., 2001. An integrative theory of prefrontal cortex function. Annu.Rev. Neurosci. 24, 167–202.
Mink, J.W., 1996. The basal ganglia: focused selection and inhibition of competingmotor programs. Prog. Neurobiol. 50 (4), 381–425.
Monchi, O., Petrides, M., Doyon, J., Postuma, R.B., Worsley, K., Dagher, A., 2004.Neural bases of set-shifting deficits in Parkinson's disease. J. Neurosci. 24(3), 702–710.
Munoz, D.P., Everling, S., 2004. Look away: the anti-saccade task and the voluntary con-trol of eye movement. Nat. Rev. Neurosci. 5 (3), 218–228.
Nambu, A., 2005. A new approach to understand the pathophysiology of Parkinson'sdisease. J. Neurol. 252 (Suppl. 4) IV1–IV4.
Ogawa, S., Lee, T.M., Kay, A.R., Tank, D.W., 1990. Brain magnetic resonance imagingwith contrast dependent on blood oxygenation. Proc. Natl. Acad. Sci. U. S. A. 87(24), 9868–9872.
Ollinger, J.M., Shulman, G.L., Corbetta, M., 2001. Separating processes within a trial inevent-related functional MRI. NeuroImage 13 (1), 210–217.
Owen, A.M., 2004. Cognitive dysfunction in Parkinson's disease: the role of frontostria-tal circuitry. Neuroscientist 10 (6), 525–537.
Parton, A., Nachev, P., Hodgson, T.L., Mort, D., Thomas, D., Ordidge, R., Morgan, P.S.,Jackson, S., Rees, G., Husain, M., 2007. Role of the human supplementary eye fieldin the control of saccadic eye movements. Neuropsychologia 45 (5), 997–1008.
Peltsch, A., Hemraj, A., Garcia, A., Munoz, D.P., 2011. Age-related trends in saccadecharacteristics among the elderly. Neurobiol. Aging 34 (4), 669–679.
Pierrot-Deseilligny, C., Rivaud, S., Gaymard, B., Agid, Y., 1991. Cortical control of reflex-ive visually-guided saccades. Brain 114 (Pt 3), 1473–1485 (Pt 3).
Rieger, J.W., Kim, A., Argyelan, M., Farber, M., Glazman, S., Liebeskind, M., Meyer, T.,Bodis-Wollner, I., 2008. Cortical functional anatomy of voluntary saccades in Par-kinson disease. Clin. EEG Neurosci. 39 (4), 169–174.
Rivaud-Pechoux, S., Vidailhet, M., Brandel, J.P., Gaymard, B., 2007. Mixing pro- andantisaccades in patients with Parkinsonian syndromes. Brain 130 (Pt 1),256–264.
Rodriguez-Oroz, M.C., Jahanshahi, M., Krack, P., Litvan, I., Macias, R., Bezard, E., Obeso, J.A.,2009. Initial clinical manifestations of Parkinson's disease: features and pathophysio-logical mechanisms. Lancet Neurol. 8 (12), 1128–1139.
Schlag-Rey, M., Amador, N., Sanchez, H., Schlag, J., 1997. Antisaccade performance pre-dicted by neuronal activity in the supplementary eye field. Nature 390 (6658),398–401.
Seamans, J.K., Yang, C.R., 2004. The principal features and mechanisms of dopaminemodulation in the prefrontal cortex. Prog. Neurobiol. 74 (1), 1–58.
Surmeier, D.J., Ding, J., Day, M., Wang, Z., Shen, W., 2007. D1 and D2 dopamine-receptormodulation of striatal glutamatergic signaling in striatal medium spiny neurons.Trends Neurosci. 30 (5), 228–235.
Sweeney, J.A., Mintun, M.A., Kwee, S., Wiseman, M.B., Brown, D.L., Rosenberg, D.R., Carl,J.R., 1996. Positron emission tomography study of voluntary saccadic eye move-ments and spatial working memory. J. Neurophysiol. 75 (1), 454–468.
Tomlinson, C.L., Stowe, R., Patel, S., Rick, C., Gray, R., Clarke, C.E., 2010. Systematic re-view of levodopa dose equivalency reporting in Parkinson's disease. Mov. Disord.25 (15), 2649–2685.
Watanabe, M., Munoz, D.P., 2009. Neural correlates of conflict resolution between au-tomatic and volitional actions by basal ganglia. Eur. J. Neurosci. 30 (11),2165–2176.
Watanabe,M.,Munoz, D.P., 2010. Presetting basal ganglia for volitional actions. J. Neurosci.30, 10144–10157.
Williams, G.V., Goldman-Rakic, P.S., 1995. Modulation of memory fields by dopamineD1 receptors in prefrontal cortex. Nature 376 (6541), 572–575.
Williams-Gray, C.H., Foltynie, T., Lewis, S.J., Barker, R.A., 2006. Cognitive deficits andpsychosis in Parkinson's disease: a review of pathophysiology and therapeutic op-tions. CNS Drugs 20 (6), 477–505.
Yang, C.R., Seamans, J.K., 1996. Dopamine D1 receptor actions in layers V–VI rat pre-frontal cortex neurons in vitro: modulation of dendritic–somatic signal integration.J. Neurosci. 16 (5), 1922–1935.