impacts of u.s. sugar policy and the north american free trade
TRANSCRIPT
Impacts of U.S. Sugar Policy and the North American Free
Trade Agreement on Trade in North American Sugar
Containing Products
Ross Pruitt
Daniel S. Tilley*
Selected Paper prepared for Presentation at the
American Agricultural Economics Association Annual Meeting
Long Beach, California, July 23-26, 2006
Copyright 2006 by Ross Pruitt and Daniel S. Tilley. All rights reserved. Readers may
make verbatim copies of this document for non-commercial purposes by any
means, provided that this copyright notice appears on all such copies.
* Graduate Research Assistant and Professor, Department of Agricultural Economics,
Oklahoma State University, Stillwater, Oklahoma.
Contact: Ross Pruitt, Oklahoma State University, Dept. of Agricultural Economics, 421H
Agricultural Hall. Stillwater, OK 74078, Phone: (405)744-9809, Fax: (405)744-8210,
e-mail: [email protected].

2
Impacts of U.S. Sugar Policy and the North American Free Trade Agreement on
Trade in Sugar Containing Products
Production allotments, preferential marketing agreements, tariffs, and quotas are used to
protect sweetener markets. In the United States, the price of raw sugar is augmented by a
system of price supports which are feasible due to the quotas and production allotments.
These price supports stem from federally allocated domestic allotments to U.S. sugar beet
and sugarcane producers while guaranteeing to the maximum extent possible the supports
operate at “no cost” to the federal government (Haley and Suarez 2002). Price floors in
place for U.S. producers of sugarcane and sugar beets not only guarantee a minimum
price of 18 and 22.9 cents, respectively, for sugarcane and sugar beets, but lead to higher
costs for manufacturers of sugar containing products in the U.S. These price floors raise
the price of sugar in the U.S. to approximately twice the world price of raw sugar and
four times the world price for refined sugar. Higher sweetener prices make it more
difficult for confectionery manufacturing plants in the U.S. to compete with plants in
Canada and Mexico. A few non-empirical articles (Jusko, 2002; Napolitano, 2004) have
focused, in part, on why these companies choose to either close their doors or relocate to
avoid the higher costs of sweeteners in the U.S. A recent publication by the Department
of Commerce’s International Trade Administration (2006) states that for every one job
saved in the growing and harvesting of sugar costs the nation approximately three jobs in
confectionery manufacturing.
Due to the artificially high price of U.S. sugar, theory would suggest that
domestic manufacturers of products with high sugar content would relocate to markets
where sugar can be obtained at the lower world price or change to a cheaper, substitutable
3
input (such as high fructose corn syrup in the carbonated beverage market). As a result,
trade of sugar containing products in North America would shift due to the policy-
induced comparative advantage. This paper presents a game theoretical Cournot model
to illustrate how trade in sugar containing products and the location of sugar containing
product manufacturers in North America is impacted by the combined effects of domestic
U.S. sugar policy and the North American Free Trade Agreement (NAFTA). This paper
develops the implications of the current sugar policies of the three countries involved in
NAFTA.
Literature Review
The U.S. has a long history of protecting its sugar industry dating back to shortly after the
Revolutionary War. Only approximately the past thirty years of U.S. sugar policy are
shown in table 1. The Jones-Costigan Act of 1934 laid the framework for sugar policy in
place today. These policy provisions include
(1) an annual determination of U.S. domestic requirements for sugar; (2) the
division of the U.S. sugar market among domestic and foreign suppliers via the
use of quotas; (3) the allotment of quotas among processors of sugar in domestic
areas (i.e. marketing allotments); and (4) the adjustment of cane and beet
production in each area to the established quotas (i.e. acreage allotments), (U.S.
International Trade Commission 2001).
The basic objectives of the Jones-Costigan Act of 1934 (as denoted by the Sugar Act of
1948 in table 1) remained in place until 1974 (U.S. International Trade Commission
2001; Alvarez and Polopolus 2002). High prices for sugar that prevailed at the time of
the expiration of the Sugar Act of 1948 soon disappeared leading to the reinstatement of
price support programs in 1977. Minor changes in sugar policy occurred from 1977 until
4
the present day, with most of the changes due to international agreements that the U.S.
negotiated.
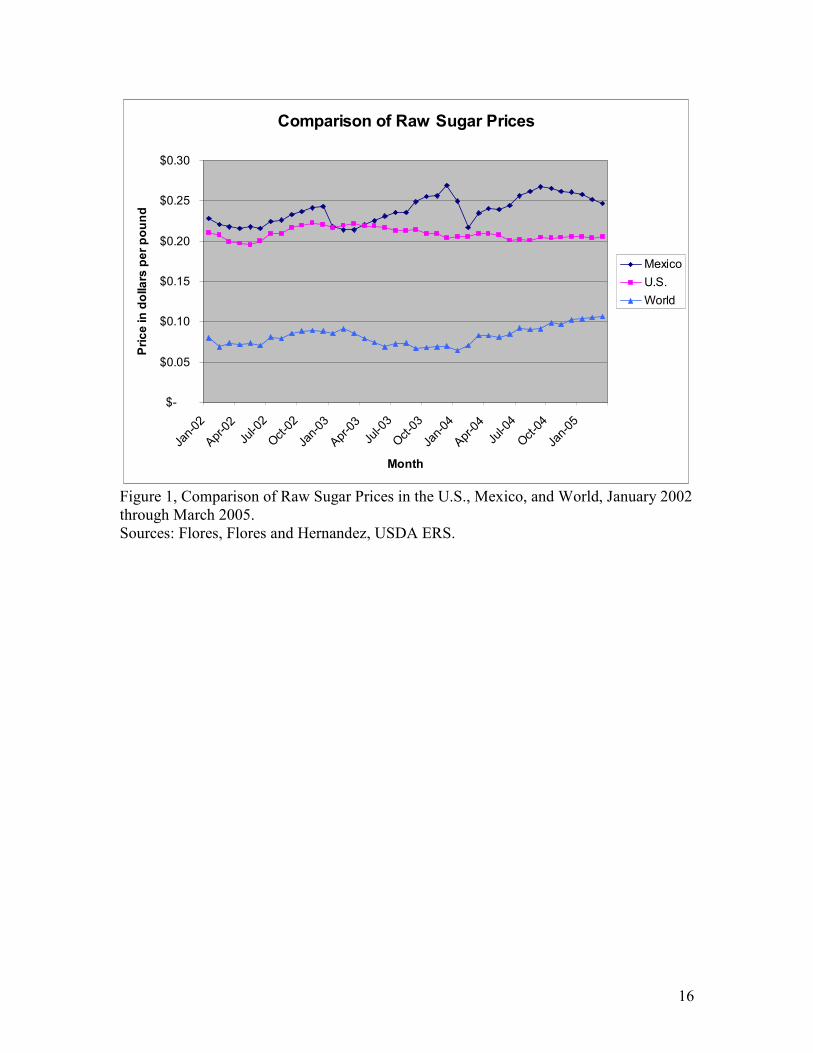
Current U.S. sugar policy guarantees sugar cane producers a minimum of 18 cents
per pound and sugar beet producers a minimum of 22.9 cents per pound, which is two to
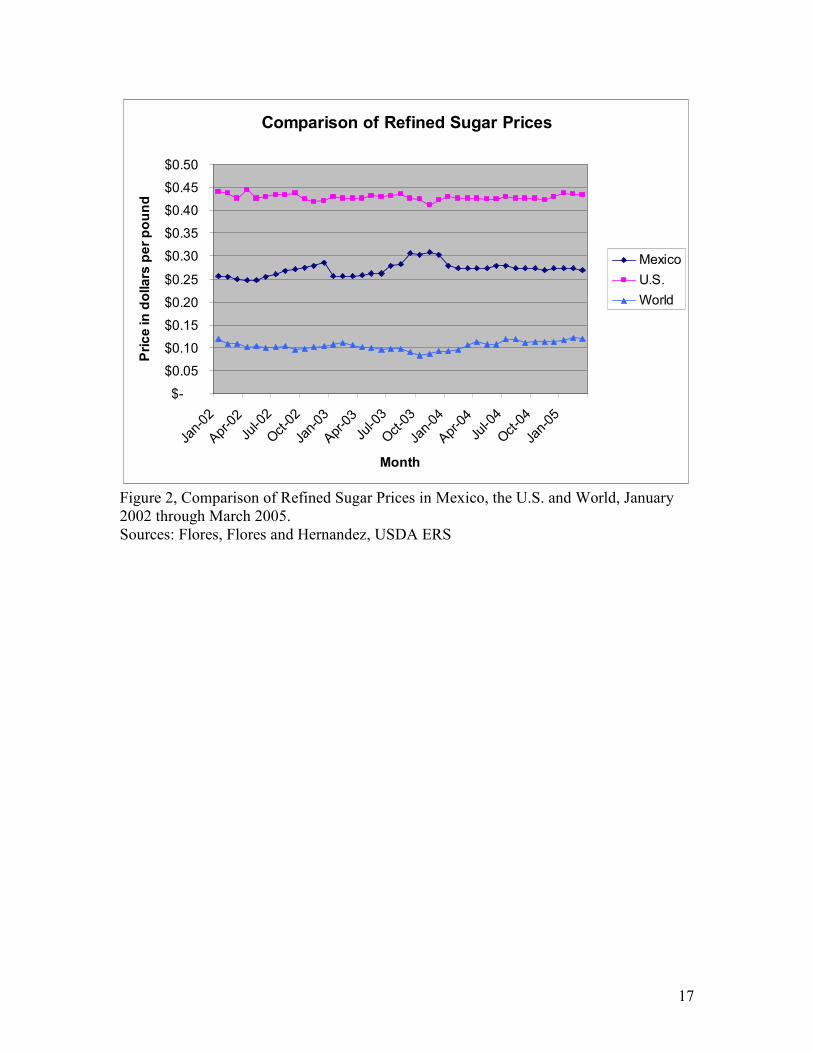
three times higher than the world price for sugar (see figure 1). Upon refinement of the
sugar, the price of sugar in the U.S. is nearly quadruple the world price of refined sugar
(see figure 2). During the 1970s the process of extracting high fructose corn syrup
(HFCS) from cornstarch became reliable enough for industrial purposes (Severson 2004).
Changes in sugar policy during this time period (as noted in table 1) led to HFCS
replacing sugar in many products including carbonated soft drinks. Since this time,
deliveries of high fructose corn syrup have steadily been growing to the point that U.S.
residents consume more HFCS each year than sugar (Haley et al. 2005) and at a cheaper
price than sugar, approximately fourteen cents per pound during the 2005 calendar year
(USDA ERS 2005). The total volume of U.S. corn production in a given year leads to
corn sweeteners substituting for sugar in many products partially because of the lower
price.
Sugar production in Mexico is also highly regulated leading to a price received by
producers that is approximately two and a half times the world price for raw sugar.
However, the price of Mexican refined sugar is roughly three cents per pound greater
than the Mexican price of raw sugar. This price differential is also the same for world
priced refined and raw sugar. Canada is the only North American country that does not
protect its domestic sugar beet producers and has no import restrictions on raw sugar and
minimal tariffs on refined sugar. Concerns from U.S. and Mexican sugar containing
5
product manufacturers’ ability to remain competitive in export markets led to programs in
each respective nation that allow manufacturers to import world priced sugar for use in
products intended for export. These concerns stem from the fact that any products made
in the U.S. and Mexico that are destined for the local markets must be made with
domestic sugar purchased at the augmented price.
Duty free access is granted to the U.S. sugar markets to Mexico and Canada
through the North American Free Trade Agreement with full implementation of the
agreement to occur in 2008. Beginning in 2008, Mexico will have free and unlimited
export access to the U.S. sugar market. Currently, there is still debate over the
interpretation of the U.S. and Mexican agreement regarding the amount of surplus
domestic sugar Mexico can export to the U.S. prior to 2008. The debate revolves around
whether or not the agreement includes high fructose corn syrup as part of net surplus
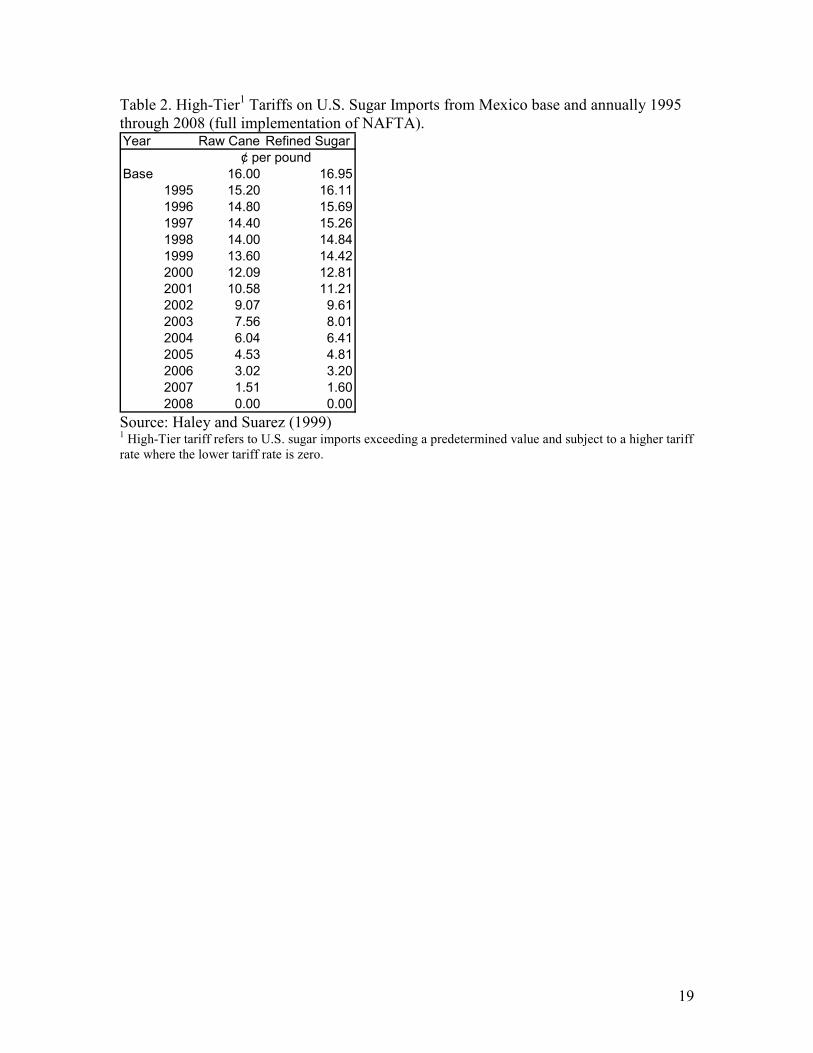
production of sweeteners. Prior to full implementation of NAFTA, once Mexican exports
of sugar to the U.S. have reached their agreed upon level, then the duty as shown in table
2 will be charged. However, as Haley (2003) notes, more sugar currently enters the U.S.
than is explicitly agreed due to the fact that tariff classifications do not take into account
the sugar contained in manufactured products. Tariffs on imported sugar containing
products are governed by Chapters 17, 18, 19, and 21 of the U.S. Harmonized Tariff
Schedule. Tariff rates for Canada and Mexico are non-existent on the majority of items
listed in these chapters with the remaining items having either no tariff in place or an ad
valorem tariff ranging from three and a half percent to seventeen and a half percent
depending on the product being imported (Haley 2003).

6
Because the price of domestic sugar in the U.S. is above the world sugar price,
some government programs seek to remedy the disadvantage caused for domestic sugar-
using manufacturers. The Sugar-Containing Products Re-Export Program (SCPREP)
allows for the purchase of sugar at the world price to be imported into the U.S. for the
purpose of processing the sugar into any number of goods that will be exported.
Furthermore, the North American Free Trade Agreement allows duty free access to the
sugar confectionery markets of NAFTA countries.
Currently, domestic Mexican policy ensures that Mexican sugar producers also
receive a price for their sugar above the world price. Like the U.S., this raises the price
Mexican sugar-containing manufacturers pay for sugar. However, the Program of
Temporary Importation for Producing Articles of Exportation (PITEX) and Maquila
Export Program allow Mexican manufacturers to import sugar at the world price for use
in making products intended for export. The report published by the International Trade
Administration (2006) states that Mexican sugar prices are approximately two-thirds of
the price of refined sugar in the U.S. while Canadian prices are approximately half the
U.S. price for sugar.
Any complete discussion of trade in sugar containing products can not ignore the
impact that sweeteners derived from corn have affected consumer products with HFCS
being the type of corn sweetener often found in products. Corn derived sweeteners can
be found in products such as carbonated beverages to frozen foods to dinner rolls. One
12 ounce can of Coca-Cola® contains the USDA daily allowance of sugar (in HFCS
form) (Severson 2004). The possibility of increased use of ethanol derived from corn to
help offset higher petroleum prices will continue to ensure that abundant sources of corn
7
will be available for U.S. food processors to obtain HFCS. Ethanol derived from sugar is
also a possibility that would alter sweetener deliveries to sugar confectionery
manufacturers. However, until sugar costs less than corn-based sweeteners, U.S. food
manufacturers will be reluctant to increase sugar purchases for use in production and as
long as cheaper sweeteners are available. Although the International Trade
Administration (2006) report states that three (sugar) confectionery manufacturing jobs
are lost due to the high U.S. sugar prices, the reports does not appear to take into account
the number of increased jobs in the processing of corn into HFCS. The transition to
HFCS as the predominant sweetener consumed may be occurring in Mexico (Sano,
House, and Spreen 2004). Transition to the use of HFCS in Mexico is occurring even
though the Mexican sugar industry is attempting to limit adoption of HFCS through a
twenty percent usage tax which has recently been deemed against World Trade
Organization rules (USTR 2005b). In addition, the corn-based sweeteners are versatile
and tend to keep foods soft (Severson 2004).
Much research has been focused on the effects of governmental intervention on
international trade (Brander and Spencer 1985; Paarlberg and Abbott 1998; Paarlberg
1995). Elobeid and Beghin (2005) and Paarlberg (1995) in their analyses of the sugar
and wheat markets, respectively, use a partial equilibrium model. Paarlberg explores the
effects of an export subsidy on wheat specifically in the trade of intermediate goods in a
two country model. Elobeid and Beghin (2005) analyze the changes in world-wide sugar
production and consumption under complete trade liberalization and consider elimination
of consumption distortions through the use of consumer subsidies. The General
Accounting Office (GAO 2000) measured changes in welfare from a liberalization of
8
only the U.S. sugar policy and found that this would result in nearly a billion dollar gain
to the U.S. economy over an unspecified length of time.
The Hecksher-Ohlin-Samuelson model of international trade demonstrates a
country will produce goods for trade for which it possesses a comparative advantage.
Furthermore, trade in this model will only occur between countries that differ in terms of
endowments and technologies, but empirical evidence points to the fact that this model
does not hold true (Bierman and Fernandez, 1998). This model of international trade and
available data can be reconciled by relaxing either the assumption of perfectly
competitive markets or no increasing returns to scale in the production of the good
(Bierman and Fernandez, 1998). Due to the degree of processing that occurs in sugar
containing products, the commodity nature of sugar is lost. For example, a Butterfinger®
candy bar is not the same as a Snickers® candy bar. The differentiated nature of these
branded products leads to different demand curves being faced by the firm that makes
each of these candy bars implying that these goods are substitutes. Relaxing the
assumption of perfectly competitive markets is one step to aid in bringing the Hecksher-
Ohlin-Samuelson model into agreement with empirical evidence.
Empirical evidence on international trade, as pointed out by Bierman and
Fernandez (1998), is dominated by a few countries that have similar resource
endowments and subsequently trade similar goods with other like countries. Singh and
Vives (1984) model Cournot and Bertrand equilibria in a differentiated duopoly where
the goods can be substitutes or complements. The advantage of a Cournot oligopoly is
the fact that firms simultaneously set quantity to be produced without regards to any other
firm’s output.

9
Cournot Model
A three country model (Canada, Mexico, and the U.S.) is presented with one sugar
confectionery manufacturer in each country. These three countries are used in the model
due to the incorporation of NAFTA into the model. As mentioned earlier, the assumption
of perfectly competitive markets in the neoclassical trade model is relaxed and each
manufacturer is assumed to sell a branded product in the markets of each country. Total
quantity of sugar products in the U.S. is
j
M
j
C
j
US
US qqqQ ++= (1)
where j
iq is the quantity of sugar confectionery products available in the U.S. produced
by firm owned in country i (where US refers to the U.S., C represents Canada, and M is
for Mexico) with production facilities located in country j. This equation can also be
changed to represent the quantity of sugar containing products in Canada or Mexico.
Each firm chooses the level of output to produce.
The inverse demand for sugar confectionery products in the U.S. market is
US
i
US
i QaP βρ −= which after substituting equation (1) in for QUS
becomes
)( 321
j
M
j
C
j
US
US
i qqqaP βββρ ++−= (2)
where i is the nationality of the firm and j refers to the factory location of the producing
firm. The intercept term, aρ, is an index with ρ taking on a value between one
(representative of the U.S. firm) and three (representative of Mexico). Equation (2) is
adapted from the work of Singh and Vives (1984) for the purpose of three firms based in
one of the three countries participating in NAFTA with each firm producing a
differentiated product. Singh and Vives (1984) note that if the value of the β’s are equal
along with the respective values of aρ, then consumers in country i view each firm’s

10
products as perfect substitutes. Similarly, the inverse demand equations for sugar
confectionery markets in Canada and Mexico is
)( 321
j
M
j
C
j
US
C
i qqqcP τττρ ++−= (3)
)( 321
j
M
j
C
j
US
M
i qqqdP νννρ ++−= . (4)
Sugar is converted into confectionery in fixed proportions in each country, that
is j
i
j
i xq λ= , where λ represents the technological coefficient that converts the amount of
sugar, j
ix , to its confectionery equivalent, j
iq , by the ith
firm in the jth
country.
Production technologies are assumed to be constant across all three NAFTA countries.
The resulting cost functions for each firm are given by
j
i
j
iii
j
i qC θδγω +++= )( (5)
where ω is the world price of (refined) sugar, γi is the labor cost, δi is the cost of utilities
associated with producing the confectionery good in country j by firm i, and j
iθ are the
fixed costs of production. Each firm is a price taker in the input markets regardless of the
country that the firm locates its production facility. The cost function exhibits constant
returns to scale for each firm which may lead to a profit maximizing solution not existing.
Constant return to scales is also exhibited in the production function and therefore is
homogenous of degree one which leads to the marginal cost, average variable cost, and
average cost being identical for the firm since costs are linear in output.
Current sugar policy in the U.S. raises the effective price of sugar to
approximately four times the world market price for refined sugar. Adjusting for this fact
changes the cost structure of the U.S. firm and is shown in its profit function for its
domestic market

11
US
US
US
USUSUS
US
US
j
M
j
C
US
US
US
US qqqqqa θδγωβββπ −++−++−= )4())(( 3211 (6)
where the j superscript refers to the location of the manufacturing facility which may be
located in any of the North American countries to obtain sugar at its lowest possible
price. For Mexican products entering the U.S. (or Canada), the firm would be located in
Mexico due to the presence of PITEX and the Maquila Export Program which allows for
the purchase of world priced sugar. Due to Canadian sugar policy, Canada sugar
containing manufacturers are able to purchase sugar at the world price regardless of
whether the final product is destined for Mexico, the U.S. or its domestic market. The
domestic profit function for the Canadian firm is
C
C
C
CCC
C
C
j
M
C
C
j
US
C
C qqqqqc θδγωτττπ −++−++−= )())(( 3211 . (7)
The effective Mexican price for sugar is two and a half times the world price for sugar
and is reflected in its profit function for the Mexican firm in its domestic market
M
M
M
MMM
M
M
M
M
j
C
j
US
M
M qqqqqd θδγωνννπ −++−++−= )5.2())(( 3213 . (8)
However, the exporting ith
firm’s profit function is altered only in the cost
function so that it is the same as equation (5) due to the Sugar Containing Products Re-
Export Program (in the U.S.), PITEX policy interventions in the price of sugar (Mexico),
or no sugar price protectionist policies (Canada). By differentiating equation (6) for the
U.S. based firm and the corresponding profit functions for the Canadian and Mexican
firms with respect to own quantity and solving simultaneously for US
iq , the response
functions for each firm in the U.S. market are calculated and shown in the equations
below
1
321
4
33103
β
δγδγδγω MMCCUSUSUS
US
aaaq
++++−−−−−= , (9)

12
2
312
4
3323
β
δγδγδγω MMUSUSCCUS
C
aaaq
++++−−+−−= , (10)
and
3
213
4
3323
β
δγδγδγω CCUSUSMMUS
M
aaaq
++++−−+−−= , (11)
the resulting price for the U.S. firm is then
4
3
2
3 321 MMCCUSUSUS
US
aaaP
δγδγδγω ++++++−−+= . (12)
Similar prices are obtained for the other two North American firms in the U.S. market
with the differences occurring in the sign and magnitude of aρ (this statement holds true
in the price determination for the other two North American markets). It’s interesting to
note that the exporting firms to the U.S. market are positively benefited by the world
price of refined sugar whereas the U.S. firm’s production levels are negatively impacted
by the U.S. sugar price giving firms an incentive to locate outside the U.S. to achieve the
ability to purchase sugar at its lowest possible price.
A similar situation occurs in the Canadian market by differentiating equation (7)
and the corresponding profit functions for the U.S. and Mexican firms and solving
simultaneously for j
iq . The response functions for each firm in the Canadian market are
1
321
4
333
τ
δγδγδγω MMCCUSUSC
US
cccq
++++−−−−−= , (13)
2
312
4
333
τ
δγδγδγω MMUSUSCCC
C
cccq
++++−−−−−= , (14)
and
3
213
4
333
τ
δγδγδγω CCUSUSMMC
M
cccq
++++−−−−−= , (15)
13
with the price for the U.S. firm in the Canadian market being
4
33 321 MMCCUSUSC
US
cccP
δγδγδγω ++++++−−+= . (16)
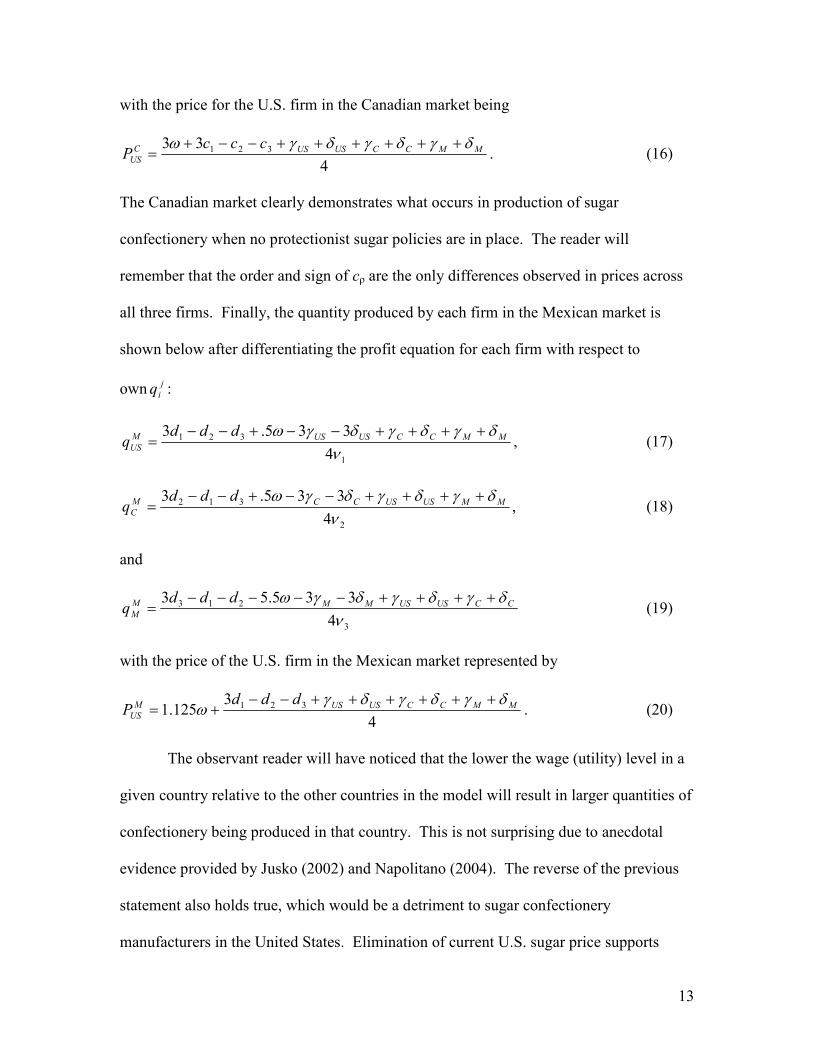
The Canadian market clearly demonstrates what occurs in production of sugar
confectionery when no protectionist sugar policies are in place. The reader will
remember that the order and sign of cρ are the only differences observed in prices across
all three firms. Finally, the quantity produced by each firm in the Mexican market is
shown below after differentiating the profit equation for each firm with respect to
own j
iq :
1
321
4
335.3
ν
δγδγδγω MMCCUSUSM
US
dddq
++++−−+−−= , (17)
2
312
4
335.3
ν
δγδγδγω MMUSUSCCM
C
dddq
++++−−+−−= , (18)
and
3
213
4
335.53
ν
δγδγδγω CCUSUSMMM
M
dddq
++++−−−−−= (19)
with the price of the U.S. firm in the Mexican market represented by
4
3125.1 321 MMCCUSUSM
US
dddP
δγδγδγω
++++++−−+= . (20)
The observant reader will have noticed that the lower the wage (utility) level in a
given country relative to the other countries in the model will result in larger quantities of
confectionery being produced in that country. This is not surprising due to anecdotal
evidence provided by Jusko (2002) and Napolitano (2004). The reverse of the previous
statement also holds true, which would be a detriment to sugar confectionery
manufacturers in the United States. Elimination of current U.S. sugar price supports
14
would result in a situation similar to the current Canadian market allowing U.S. sugar
confectionery manufacturers to be more competitive in their own market. This would
help to stem the tide of this sector of the U.S. economy downsizing or choosing to
relocate across the border.
After full implementation of NAFTA in 2008, few changes may occur in the
current location of sugar confectionery markets as long as the sugar policy distortions
that created this situation are still in place. By eliminating the re-export programs of the
U.S. and Mexico for sugar containing products along with their domestic sugar policy
which sets a price floor, more noticeable changes in location of sugar confectionery
manufacturers may occur. Furthermore, widespread production of ethanol in the U.S.
may lead to the price of HFCS increasing to the point that whatever advantage firms
possess by using HFCS is eroded. Subsequently, this may lead to a further exodus of
sugar confectionery manufacturers leaving the U.S.
Conclusions
Sugar has historically been one of the most subsidized commodities not only in the U.S.
but also in many of the main sugar producing countries. Preferential agreements and
quotas dominate the policy of major sugar producing countries that benefit producers of
sugar beets and sugarcane. However, this puts sugar confectionery manufacturers at a
disadvantage to countries that do not protect their domestic sugar producers. This paper
has sought to develop a simple, game theoretical model that demonstrates the nature of
sugar confectionery trade flows in North America due to the failure of the theory of
comparative advantage.
15
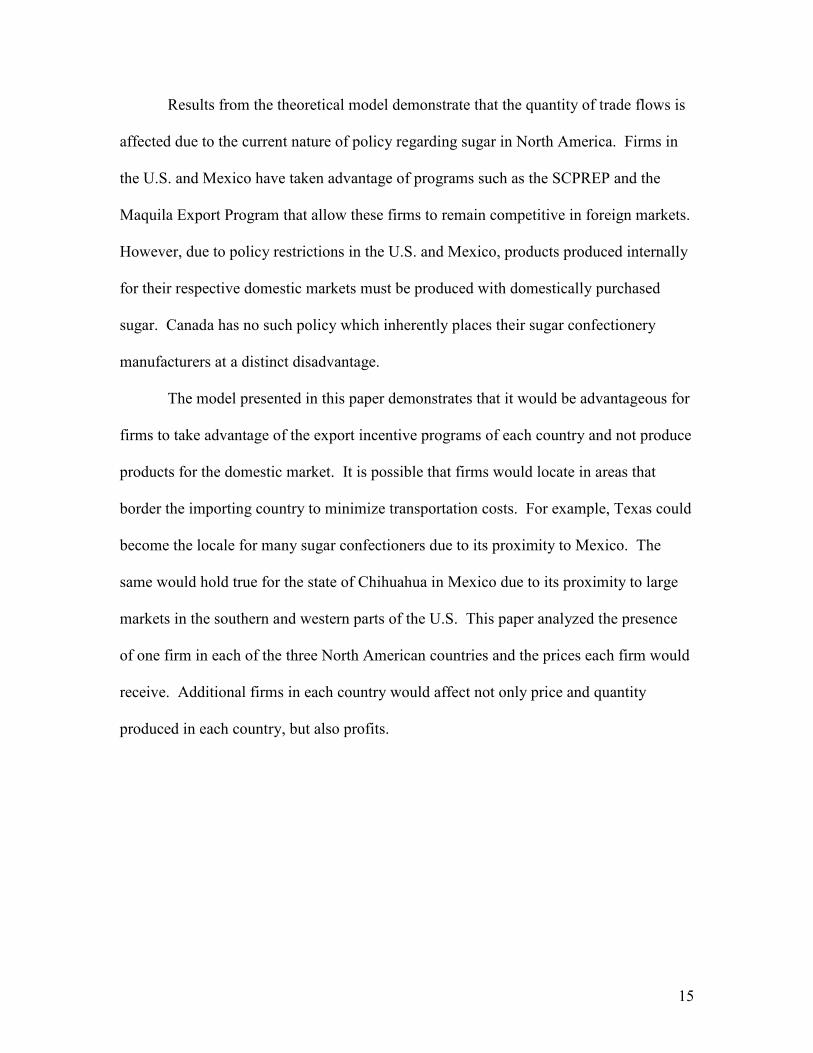
Results from the theoretical model demonstrate that the quantity of trade flows is
affected due to the current nature of policy regarding sugar in North America. Firms in
the U.S. and Mexico have taken advantage of programs such as the SCPREP and the
Maquila Export Program that allow these firms to remain competitive in foreign markets.
However, due to policy restrictions in the U.S. and Mexico, products produced internally
for their respective domestic markets must be produced with domestically purchased
sugar. Canada has no such policy which inherently places their sugar confectionery
manufacturers at a distinct disadvantage.
The model presented in this paper demonstrates that it would be advantageous for
firms to take advantage of the export incentive programs of each country and not produce
products for the domestic market. It is possible that firms would locate in areas that
border the importing country to minimize transportation costs. For example, Texas could
become the locale for many sugar confectioners due to its proximity to Mexico. The
same would hold true for the state of Chihuahua in Mexico due to its proximity to large
markets in the southern and western parts of the U.S. This paper analyzed the presence
of one firm in each of the three North American countries and the prices each firm would
receive. Additional firms in each country would affect not only price and quantity
produced in each country, but also profits.
16
Comparison of Raw Sugar Prices
$-
$0.05
$0.10
$0.15
$0.20
$0.25
$0.30
Jan-02
Apr-02
Jul-02
Oct-02
Jan-03
Apr-03
Jul-03
Oct-03
Jan-04
Apr-04
Jul-04
Oct-04
Jan-05
Month
Price in dollars per pound
Mexico
U.S.
World
Figure 1, Comparison of Raw Sugar Prices in the U.S., Mexico, and World, January 2002
through March 2005.
Sources: Flores, Flores and Hernandez, USDA ERS.
17
Comparison of Refined Sugar Prices
$-
$0.05
$0.10
$0.15
$0.20
$0.25
$0.30
$0.35
$0.40
$0.45
$0.50
Jan-02
Apr-02
Jul-02
Oct-02
Jan-03
Apr-03
Jul-03
Oct-03
Jan-04
Apr-04
Jul-04
Oct-04
Jan-05
Month
Price in dollars per pound
Mexico
U.S.
World
Figure 2, Comparison of Refined Sugar Prices in Mexico, the U.S. and World, January
2002 through March 2005.
Sources: Flores, Flores and Hernandez, USDA ERS

18
Table 1, Changes in Sugar Policy Since 1974.
Year Change 1974 Expiration of Sugar Act of 1948; elimination of direct payments; global quota of seven million tons at current duty rates; unrestricted domestic production
1977 Food and Agriculture Act of 1977; established loan rates for Commodity Credit Corporation (CCC) 1981 Agriculture and Food Act of 1981; price support programs for 1982-85 crop years; import duties increased and country by country import quotas established 1985 Food Security Act of 1985; continued programs from 1981 act; sugar program to act at no cost to federal government through domestic production quotas 1990 Food, Agriculture, Conservation, and Trade Act of 1990; minimum import quota of 1.25 million short tons under two-tiered tariff scheme 1994 North American Free Trade Agreement (NAFTA) takes effect 1996 Federal Agricultural Improvement and Reform Act; recourse loans when imports less than 1.5 million tons 2002 Farm Security and Rural Investment Act; terminated processors’ forfeiture penalties to the government; marketing allotments suspended if imports exceed 1.532 million tons, raw value 2005 Central American Free Trade Agreement signed 2008 NAFTA fully implemented
Source: Alvarez and Polopolus, U.S. International Trade Commission.
19
Table 2. High-Tier1 Tariffs on U.S. Sugar Imports from Mexico base and annually 1995
through 2008 (full implementation of NAFTA). Year Raw Cane SugarRefined Sugar
Base 16.00 16.95
1995 15.20 16.11
1996 14.80 15.69
1997 14.40 15.26
1998 14.00 14.84
1999 13.60 14.42
2000 12.09 12.812001 10.58 11.21
2002 9.07 9.61
2003 7.56 8.01
2004 6.04 6.41
2005 4.53 4.81
2006 3.02 3.20
2007 1.51 1.60
2008 0.00 0.00
¢ per pound
Source: Haley and Suarez (1999) 1 High-Tier tariff refers to U.S. sugar imports exceeding a predetermined value and subject to a higher tariff
rate where the lower tariff rate is zero.
20
Works Cited
Alvarez, J. and L.C. Polopolus. 2002. “The History of U.S. Sugar Protection.” SC 019,
Institute of Food and Agricultural Sciences, University of Florida.
Bierman, H.S. and L. Fernandez. 1998. Game Theory with Economic Applications, 2nd
ed. New York: Addison-Wesley.
Brander, J.A. and B.J. Spencer. 1985. “Export Subsidies and International Market Share
Rivalry.” Journal of International Economics. 18:83-100.
Elobeid, A. and J. Beghin. 2005. “Multilateral Trade and Agricultural Policy Reforms in
Sugar Markets.” Working Paper 04-WP 356, Center for Agricultural and Rural
Development, Iowa State University.
Flores, D. 2005. Mexican Sugar Annual. Washington DC: U.S. Department of
Agriculture, Foreign Agricultural Service GAIN Rep. MX5027, March.
Flores, D. and G. Hernandez. 2003. Mexican Sugar Annual. Washington DC: U.S.
Department of Agriculture, Foreign Agricultural Service GAIN Rep. MX3046,
April.
General Accounting Office. 2000. Sugar Program: Supporting Sugar Prices Has
Increased Users’ Costs While Benefiting Producers. GAO/RCED–00–126.
Washington DC, June.
Haley, S. 2003. Measuring the Effect of Imports of Sugar-Containing Products on U.S.
Sugar Deliveries. Washington DC: U.S. Department of Agriculture, Economics
Research Service SSS-237-01, September.
Haley, S. 2005. Sugar and Sweeteners: Background.
http://www.ers.usda.gov/Briefing/Sugar/background.htm. Accessed on December
20, 2005.
Haley, S. and N.R. Suarez. 1999. Agricultural Outlook – U.S.-Mexico Sweetener Trade
Mired in Dispute.
http://www.ers.usda.gov/publications/agoutlook/sep1999/ao264g.pdf, June 8,
2005.
Haley, S. and N.R. Suarez. 2002. Sugar and Sweeteners Outlook. Washington DC: U.S.
Department of Agriculture, Economic Research Service SSS-235, September.
Haley, S., J. Reed, B. Lin, and A. Cook. 2005. Sweetener Consumption in the United
States. Washington DC: U.S. Department of Agriculture, Economic Research
Service SSS-243-01, August.
21
Jusko, J. 2002. “Bitter Goodbye.” http://www.industryweek.com. July. Accessed on
September 9, 2005.
Napolitano, J. 2004. “Chicago to Lose Two Historic Candy Brands.” New York Times.
January 20, page A14.
Paarlberg, P.A 1995. “Agricultural Export Subsidies and Intermediate Goods Trade.”
American Journal of Agricultural Economics. 77:119-28.
Paarlberg, P.A. and P.C. Abbot. 1998. “Oligopolistic Behavior by Public Agencies in
International Trade: The World Wheat Market.” American Journal of
Agricultural Economics. 68:528-42.
Sano, D., L.A. House, and T.H. Spreen. 2004. “Analysis of the U.S.-Mexico Sugar
Trade – 10 years of NAFTA Regime and 10 Years From Now.” Paper presented
at AAEA annual meeting, Denver CO, 1-4 August.
Severson, K. 2004. “Sugar coated: We’re drowning in high fructose corn syrup. Do the
risks go beyond our waistline?” San Francisco Chronicle. February 18, page E1.
Singh, N. and X. Vives. 1984. “Price and quantity competition in a differentiated
duopoly.” Rand Journal of Economics. 15:546-54.
U.S. Department of Agriculture, Economic Research Service (ERS). 2005. and
Sweeteners: Data Tables 3 and 4.
http://www.ers.usda.gov/Briefing/Sugar/Data/data.htm. Accessed on January 30,
2005.
U.S. Department of Agriculture, Foreign Agricultural Service (FAS). 2005. World
Market Profile for Confectionery Products.
http://www.fas.usda.gov/agx/ISMG/WorldMarketProfileConfProductsMay2005.p
df. Accessed on November 21, 2005.
U.S. Department of Commerce, International Trade Administration. 2006. Employment
Changes in U.S. Food Manufacturing: The Impact of Sugar Prices. Washington
DC, February 14.
U.S. International Trade Commission. 2001. Industry and Trade Summary: Sugar.
Washington DC, March.
U.S. Trade Representative (USTR). 2005a. “Sugar: A Spoonful a Week.” February.
U.S. Trade Representative. 2005b. “U.S. Wins Mexico Beverage Tax Dispute.”
http://www.ustr.gov/Document_Library/Press_Releases/2005/October/US_Wins_
Mexico_Beverage_Tax_Dispute.html. Accessed on February 20, 2006.