impacts of the widening divide: los angeles at the forefront of the rent burden crisis
DESCRIPTION
Our study show severe housing burden among poor renters has existed since 1970, and that during periods of increasing inequality the burden has grown even more severe. Vacancy rates have risen only slightly – even dipping at times when housing burden has increased. And renters are paying more for the same quality housing, suggesting that neither market forces nor changing housing quality fully explain the increasing rents.TRANSCRIPT

1 | P a g e
Impacts of the Widening Divide:
Los Angeles at the Forefront of the Rent Burden Crisis
Rosalie Ray
Paul Ong
Silvia Jimenez
Center for the Study of Inequality
UCLA Luskin School of Public Affairs
Revised September 2014*
Abstract
Recent media coverage has focused on growing rent burdens as an important
manifestation of widening economic inequality. What has been missing from this
coverage is that high and increasing rent burdens represent a long-standing
problem. In this research we track and analyze changes in Los Angeles income
and rent levels over the last four decades and compare them with national
trends. We find that rent burdens have been severe for low-income renters since
the 1970s, that burdens have also increased substantially for the middle class
over the period studied, and that Los Angeles consistently exceeds the nation in
both the share of renters burdened and the severity of the burden. Moreover,
we find that neither tight housing market conditions nor housing quality are
sufficient to explain the extent to which housing costs have outpaced income
growth over the last four decades.
We thank the Howard and Irene Levine Program in Housing and Social Responsibility at the UCLA Ziman
Center for Real Estate and the Haynes Foundation for their generous funding. The authors alone are
responsible for the content. We are grateful to Batul Joffrey for her research assistance and to Adam Dorr
and Terra Bennett for reviewing this paper. This paper complements parallel research on income inequality
in Los Angeles funded by the Haynes Foundation. The Haynes project does not cover the topic of housing.
* Income figures in the text on page 7 of the July 2014 version have been revised as well as rates on page
12. Graphs remain unchanged. The revisions are due to a technical problem with the data spreadsheet
that caused a misalignment of the data by year. The revisions in no way impact the conclusions of the
research.
2 | P a g e
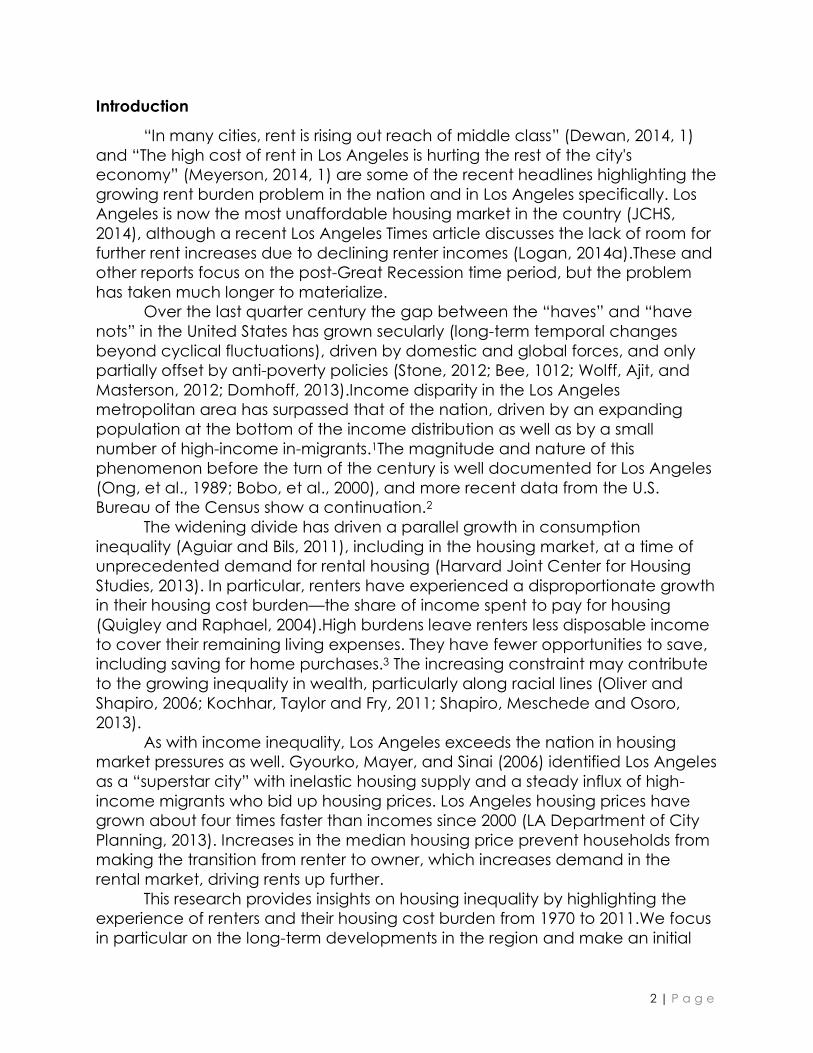
Introduction
“In many cities, rent is rising out reach of middle class” (Dewan, 2014, 1)
and “The high cost of rent in Los Angeles is hurting the rest of the city's
economy” (Meyerson, 2014, 1) are some of the recent headlines highlighting the
growing rent burden problem in the nation and in Los Angeles specifically. Los
Angeles is now the most unaffordable housing market in the country (JCHS,
2014), although a recent Los Angeles Times article discusses the lack of room for
further rent increases due to declining renter incomes (Logan, 2014a).These and
other reports focus on the post-Great Recession time period, but the problem
has taken much longer to materialize.
Over the last quarter century the gap between the “haves” and “have
nots” in the United States has grown secularly (long-term temporal changes
beyond cyclical fluctuations), driven by domestic and global forces, and only
partially offset by anti-poverty policies (Stone, 2012; Bee, 1012; Wolff, Ajit, and
Masterson, 2012; Domhoff, 2013).Income disparity in the Los Angeles
metropolitan area has surpassed that of the nation, driven by an expanding
population at the bottom of the income distribution as well as by a small
number of high-income in-migrants.1The magnitude and nature of this
phenomenon before the turn of the century is well documented for Los Angeles
(Ong, et al., 1989; Bobo, et al., 2000), and more recent data from the U.S.
Bureau of the Census show a continuation.2
The widening divide has driven a parallel growth in consumption
inequality (Aguiar and Bils, 2011), including in the housing market, at a time of
unprecedented demand for rental housing (Harvard Joint Center for Housing
Studies, 2013). In particular, renters have experienced a disproportionate growth
in their housing cost burden—the share of income spent to pay for housing
(Quigley and Raphael, 2004).High burdens leave renters less disposable income
to cover their remaining living expenses. They have fewer opportunities to save,
including saving for home purchases.3 The increasing constraint may contribute
to the growing inequality in wealth, particularly along racial lines (Oliver and
Shapiro, 2006; Kochhar, Taylor and Fry, 2011; Shapiro, Meschede and Osoro,
2013).
As with income inequality, Los Angeles exceeds the nation in housing
market pressures as well. Gyourko, Mayer, and Sinai (2006) identified Los Angeles
as a “superstar city” with inelastic housing supply and a steady influx of high-
income migrants who bid up housing prices. Los Angeles housing prices have
grown about four times faster than incomes since 2000 (LA Department of City
Planning, 2013). Increases in the median housing price prevent households from
making the transition from renter to owner, which increases demand in the
rental market, driving rents up further.
This research provides insights on housing inequality by highlighting the
experience of renters and their housing cost burden from 1970 to 2011.We focus
in particular on the long-term developments in the region and make an initial

3 | P a g e
attempt to identify, or at least rule out, potential mechanisms by which the rent
burden is growing. Growth in renter burden may be driven by changes in both
housing cost and income. Understanding the root cause of increased renter
burden, as one of declining income or one of housing will provide local
knowledge to help inform policy, planning, and action at the local and regional
level. Detailed knowledge can help mobilize stakeholders, inform decision-
making, and formulate sound housing and economic development strategies
that benefit both the region as a whole and those populations most at risk.
The research has three major parts. Part I examines changes in the
demographic and socioeconomic composition of renters relative to owners. Is
there a widening economic divide between these two classes of households?
The report finds that the income gap between renters and owners widened over
time. Further, rentership rates grew fastest within the bottom 20% of income
earners. Part II investigates changes in housing burden on renters. We analyze
the share of income going to shelter over time, first for the population as a whole
and then by quintiles. Severe housing burden among poor renters existed since
1970, but during the period of increasing inequality the burden grew even more
severe. The proportion of all renters who experience a severe burden has also
grown. Part III evaluates possible causes of rising rents, including both market
forces and changing housing quality. Vacancy rates are roughly the same and
renters are paying more for the same quality housing, suggesting that neither
market forces nor changing housing quality explains the increasing rents.
Data and Methods
This analysis employs public-use micro samples (PUMSs) from the 1970,
1980, 1990 and 2000 decennial censuses, and from the 2009-2011 3-year
American Community Survey (ACS). From 1970 to 2000, the Bureau of the
Census conducted decennial census surveys and “long-form” surveys
simultaneously, the latter of which collected detailed housing, demographic
and socioeconomic data. The long-form survey was discontinued after 2000
and has since been replaced by the ACS, a continuous survey that collects
similar housing, demographic and socioeconomic information.
The size of the PUMS ranges from 3% to 5% of all households and
individuals in Los Angeles County, varying from year to year. The data for
households include information on tenure (renters and owners), household
income, monthly housing costs, size of housing units (rooms and bedrooms), and
other characteristics (size and composition of households, building size and age,
etc.). We combined these household data with information on heads of
households to yield a dataset that supports investigation of how demographic
and socioeconomic characteristics relate to rentership and monthly housing
costs.
All dollar values were adjusted to 2012 using CPIU-RS. Vacant units and
group quarters were excluded. Income from household members under 16 were
4 | P a g e
removed from 1970 data to ensure consistency with later years. For the quintile
analysis in Part II, we grouped the middle three quintiles together as the middle
60%.
Rent burden is defined as the percent of income devoted to the payment
of gross rent. Gross rent includes utilities as well as the rent payment, referred to
as cash rent by the Census. Renters who did not pay cash rent were assumed to
be unburdened regardless of income. Those who did not receive any income or
had negative income amounts and still paid rent were assumed to be severely
burdened. Burden was top-coded at 101% of income.
For this research, renter households that contribute more than 30% of their
income towards rent are considered rent-burdened. This definition varies slightly
from other sources, such as the Bureau of the Census which uses a measure of
35% or greater. Some research on the topic categorizes rent burden by severity.
In the State of the Nation’s Housing Needs report, for example, the Joint Center
for Housing Studies at Harvard University separates burden into Moderate (when
30% to 50% of income is spent on rent) and Severe (when over 50% of income is
spent on rent). But while the specific measures used may vary, there is consensus
among housing studies that the nation’s rent burden has increased considerably
in the last decade.
Part I: The Widening Divide between Owners and Renters
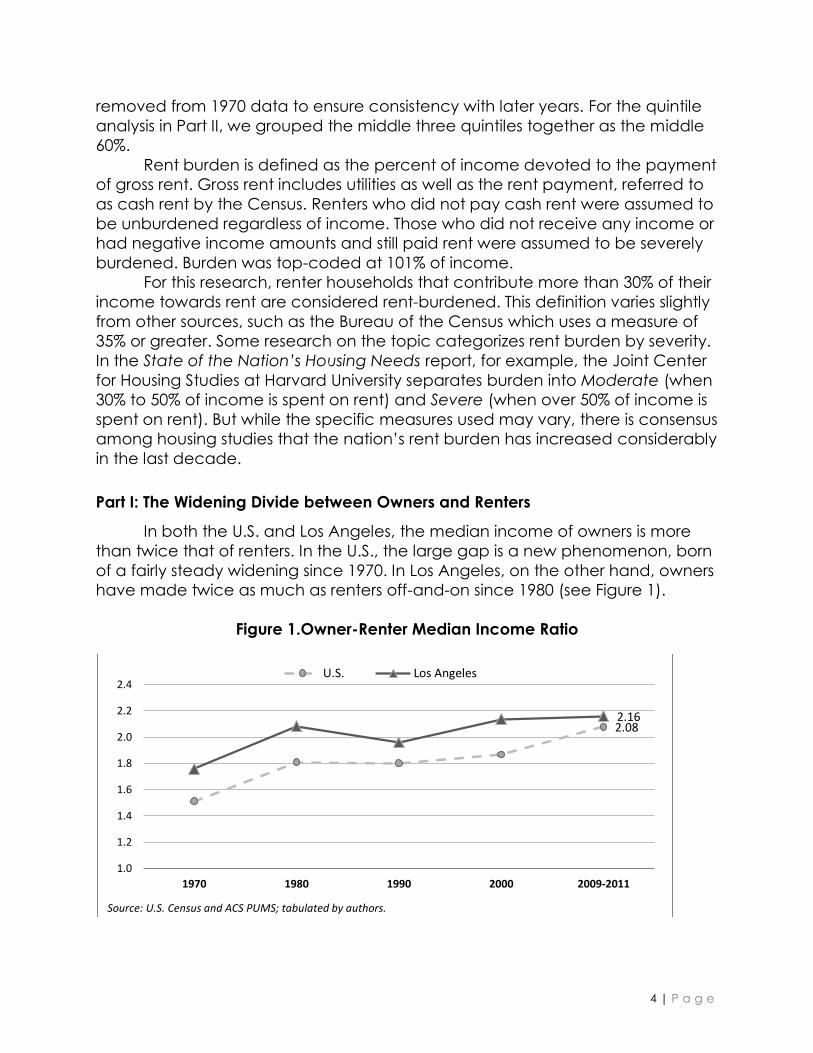
In both the U.S. and Los Angeles, the median income of owners is more
than twice that of renters. In the U.S., the large gap is a new phenomenon, born
of a fairly steady widening since 1970. In Los Angeles, on the other hand, owners
have made twice as much as renters off-and-on since 1980 (see Figure 1).
Figure 1.Owner-Renter Median Income Ratio
2.08 2.16
1.0
1.2
1.4
1.6
1.8
2.0
2.2
2.4
1970 1980 1990 2000 2009-2011
U.S. Los Angeles
Source: U.S. Census and ACS PUMS; tabulated by authors.

5 | P a g e
In part, the temporal differences in the widening divide are the result of
different tenure patterns in Los Angeles versus the U.S. Los Angeles has been a
majority renter city since 1970, while the U.S. rentership rate has fluctuated
around 35% (see Figure 2). Los Angeles is now the metro area with the highest
share of renters in the country, at 52% (Joint Center for Housing Studies, 2013).
Figure 2.Rentership Rates
In addition, the income composition of renters has differed between the
two areas. Over time, those in the bottom 20% of the income distribution have
become more likely to rent in the U.S. while those above them have become
less likely. In 1970, even people in the bottom 20% of the national income
distribution were more likely to be homeowners than renters. Today, roughly 60%
of households in the bottom quintile rent, while fewer than 15% of the top
quintile do so (see Figure 3). Much of what the media has picked up on is a
recent trend among the middle three quintiles towards renting, reversing the
longer-term trend towards homeownership. Within our decadal data set, the
trend is barely noticeable, but a recent Census report confirms a steady rise in
rentership in the last few years (Flanagan and Schwartz, 2013).
0%
10%
20%
30%
40%
50%
60%
1960 1970 1980 1990 2000 2009-2011
US Los Angeles
Source: U.S. Census and ACS PUMS; tabulated by authors.

6 | P a g e
Figure 3.Renter Rates by Income Quintile, US
Los Angeles, on the other hand, has seen a rising rentership rate overall,
while the rentership rates by quintile have remained fairly stable.
Homeownership peaked among high income earners in 1980 and has since
fallen slightly, while Los Angeles earners in the bottom quintile experienced a
modest downturn in rentership during the 1980s.For the most part, however, rates
within quintiles have remained stable.
Figure 4.Renter Rates by Income Quintile, Los Angeles
While the nature of the widening divide in the U.S. can be in the differing
trends in rentership by quintile, the ways in which the Los Angeles housing
market differs from the nation’s overall pattern can be seen in its median
0%
15%
30%
45%
60%
75%
90%
1960 1970 1980 1990 2000 2009-2011
Bottom 20 Middle 60 Top 20
Source: U.S. Census and ACS PUMS; tabulated by authors.
0%
15%
30%
45%
60%
75%
90%
1970 1980 1990 2000 2009-2011
Bottom 20 Middle 60 Top 20
Source: U.S. Census and ACS PUMS; tabulated by authors; data not available for 1960 for LA County.

7 | P a g e
income trends (See Figure 5).Overall, owner incomes rose 25% since 1970 in Los
Angeles, and 23% in the U.S. With the increasing tendency of bottom quintile
households to be renters in the U.S., median renter incomes fell 10% between
1970 and 2011, from $36,000 to $32,000, while Los Angeles renter incomes
gained 2%. More recently, however, median incomes for both owners and
renters in the city declined between 1990 and 2011, stabilizing the income gap
somewhat.
Income stagnation is not the way one would ideally like to close a gap. It
becomes even more problematic when one looks at the diverging trends
between rent and renter incomes, the subject of the next part.
Figure 5. Median Income by Tenure, US and LA
Part II: The Widening Divide Between Rent and Renter Incomes
Rent burden is the ratio of rent to income and is generally expressed as
the percentage of income devoted to rent. It rises when rents rise relative to
incomes. In the face of declining median incomes in Los Angeles, rents too
would have had to stagnate or fall for the rent burden to remain steady.
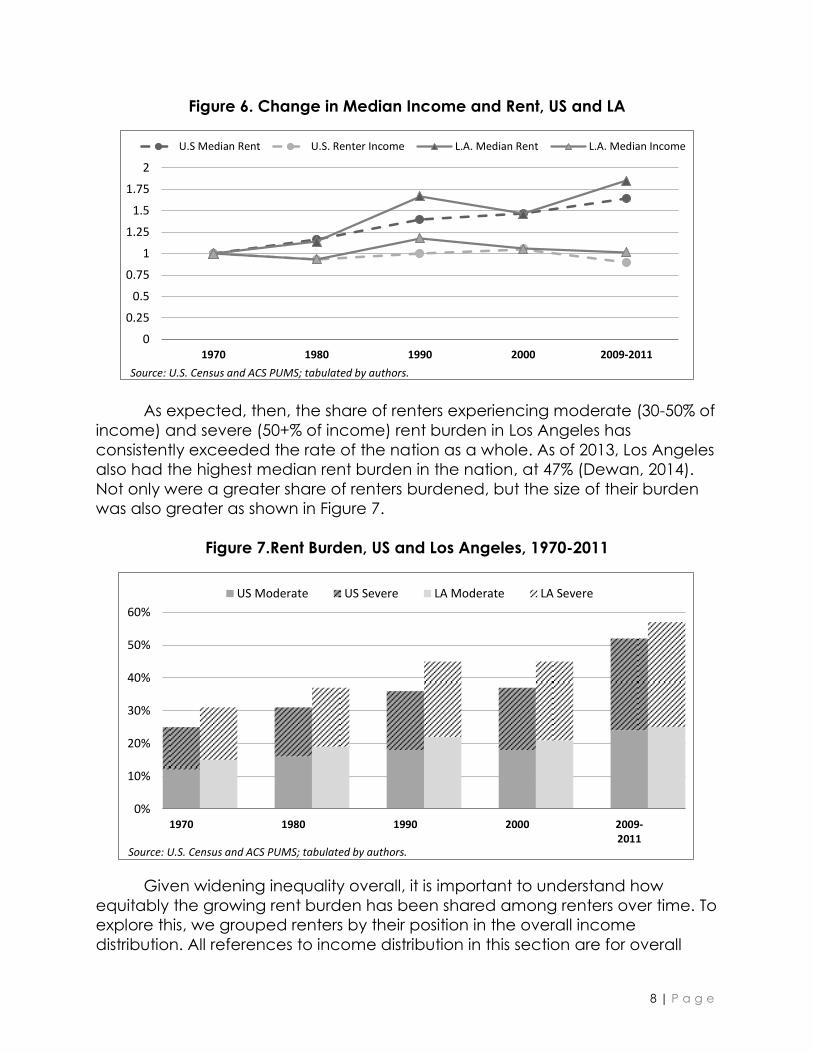
Instead, as can be seen in Figure 6, rents have risen faster in Los Angeles than in
the nation as a whole.
In order to show both trends on the same graph, Figure 6 shows the
growth of income and of rent in the U.S. and Los Angeles relative to their level in
1970. Thus, in 1970, all equal 1while in 2009-2011, Los Angeles rent is more than
175% that of 1970 Los Angeles rent. What is clear from the chart is that the gap
between rent and renter incomes has widening, and that rent growth in Los
Angeles has outpaced growth elsewhere in the U.S. despite declining incomes.
$0
$20
$40
$60
$80
$100
1960 1970 1980 1990 2000 2009-2011
Tho
usa
nd
s (A
dju
ste
d t
o 2
01
2 S
)
U.S. Renters U.S. Owners L.A. Renters L.A. Owners
Source: U.S. Census and ACS PUMS; tabulated by authors; data not available for 1960 for LA County.
8 | P a g e
Figure 6. Change in Median Income and Rent, US and LA
As expected, then, the share of renters experiencing moderate (30-50% of
income) and severe (50+% of income) rent burden in Los Angeles has
consistently exceeded the rate of the nation as a whole. As of 2013, Los Angeles
also had the highest median rent burden in the nation, at 47% (Dewan, 2014).
Not only were a greater share of renters burdened, but the size of their burden
was also greater as shown in Figure 7.
Figure 7.Rent Burden, US and Los Angeles, 1970-2011
Given widening inequality overall, it is important to understand how
equitably the growing rent burden has been shared among renters over time. To
explore this, we grouped renters by their position in the overall income
distribution. All references to income distribution in this section are for overall
0
0.25
0.5
0.75
1
1.25
1.5
1.75
2
1970 1980 1990 2000 2009-2011
U.S Median Rent U.S. Renter Income L.A. Median Rent L.A. Median Income
Source: U.S. Census and ACS PUMS; tabulated by authors.
0%
10%
20%
30%
40%
50%
60%
1970 1980 1990 2000 2009-2011
US Moderate US Severe LA Moderate LA Severe
Source: U.S. Census and ACS PUMS; tabulated by authors.

9 | P a g e
incomes. When looking by quintiles, we find that rent burden has long been a
problem for those at the bottom end of the income distribution.
Of particular concern are renters in the lowest quintile, or bottom 20%, of
the income distribution. In 1970, 54% of these Los Angeles renters shouldered a
severe rent burden (i.e. were devoting half or more of their income to housing),
and 85% of them bore a moderate rent burden (i.e. were paying 30 to 50% of
their income).Although national figures are less drastic, 46% of the lowest quintile
renters were nonetheless severely burdened and more than half were
moderately burdened. These figures are summarized in Table 1 below.
Table 1. 1970 Rent Burden Rates
Bottom 20% Middle 60% Top 20%
U.S. 30-50% of Income 24.2% 8.5% 0.2%
> 50% of Income 46.2% 0.9% 0%
L.A 30-50% of Income 31.2% 9.8% 0.2%
> 50% of Income 53.6% 0.8% 0%
Source: U.S. Census and ACS PUMS; tabulated by authors.
Not surprisingly, for renters with higher incomes rent burden was less
onerous, with roughly 10% of middle-income renters moderately burdened in
both the U.S. and Los Angeles, and virtually none in the top quintile of earners
burdened. The reason why this is the case is clearly evident in the rent-to-income
ratio, which differs starkly between the top and bottom of the U.S. income
distribution: rent for those in the top quintile was roughly twice that of bottom
quintile, but incomes of the top quintile were roughly 10 times larger.
Table 2 below breaks down the income and rent growth seen in Figure
6by income quintiles. During the period of analysis from 1970 to 2011 the rent
burden situation deteriorated for bottom quintile renters, particularly in Los
Angeles, and the city also witnessed substantial rent increases across all
quintiles. Both the U.S. and Los Angeles had a U-shaped pattern of rent
increases, with larger increases at the top and bottom of the distribution than in
the middle. Renter income growth for the nation followed the same pattern as
rental price increases. However, Los Angeles did not follow that trend. Los
Angeles income growth was lowest at the bottom of the income distribution and
highest at the top.

10 | P a g e
Table 2. Rent and Renter Income Growth by Quintiles
Bottom 20% Middle 60% Top 20%
U.S. Median Rent 80% 76% 96%
Median Renter Income 19% 6% 45%
L.A Median Rent 93% 90% 109%
Median Renter Income 9% 11% 36%
Source: U.S. Census and ACS PUMS; tabulated by authors.
In both the U.S. and Los Angeles the gap between rents paid by the top
and bottom quintiles has stayed roughly constant, but the gap between top
and bottom quintile renter incomes has increased (See Figure 8). Los Angeles’s
income gap peaked in 2000 well above the U.S., while the U.S. income gap
continues to rise. In 2000, the incomes of Los Angeles renters in the top quintile
were 12.6 times that of bottom quintile renters. Top quintile incomes fell to 12
times that of the bottom quintile in 2009-2011, only slightly larger than the
comparable U.S. gap.
Figure 8. Change in Rent and Income Levels
Rent burden in Los Angeles has increased to stunning proportions. By 2009-
2011, more than three-quarters of the lowest-income Los Angeles renters were
severely burdened (See Table 3). Further, more than nine in ten were burdened,
though not “severely.” Middle income renters are being squeezed by similar
trends. Throughout the U.S., steep rent increases and small income increases
0
2
4
6
8
10
12
14
1970 1980 1990 2000 2009-2011
US Median Renter Income US Median Rent
LA Median Renter Income LA Median Rent
Source: U.S. Census and ACS PUMS; tabulated by authors.

11 | P a g e
burdened more than a third of middle-income renters by 2009-2011.In Los
Angeles, roughly half of middle income renters experienced rent burden. The
pattern diverges for high-income renters. Despite the doubling of rent for top
income earners in Los Angeles, a slightly smaller share of top income renters are
burdened in Los Angeles compared to the U.S.
Table 3. 2009-2011 Rent Burden Rates
Bottom 20% Middle 60% Top 20%
U.S. 30-50% of Income 19.2% 27.4% 2.0%
> 50% of Income 63.1% 8.3% 0%
L.A 30-50% of Income 11.5% 34.8% 1.9%
> 50% of Income 77.8% 14.8% 0%
Source: U.S. Census and ACS PUMS; tabulated by authors.
As Figure 9 shows, there are two major trends in rent burdens over the last
40 years, and both have played out more strongly in Los Angeles than in the
nation as a whole. First, burdens among the bottom quintile have gone from
bad to worse. It is worth noting that as early as 1983, it was possible to publish
books called America’s Housing Crisis about the nation’s inability to house its
poorest citizens (Hartman, 1983). Since then, the rent burden for poor
households has only worsened. Second, rent burden has expanded to become
a problem faced by the middle class as well. Most renters in these middle
income quintiles still pay less than half their income in rent. However, 50% of mid-
range renters in Los Angeles experience some sort of burden, as do a third of
U.S. middle class renters overall.

12 | P a g e
Figure 9. Rent Burden by Quintiles
Part III: Exploration of Potential Causes in Los Angeles
The increase in burden over time has largely been the result of increasing
rents rather than decreasing incomes, a finding confirmed by Quigley and
Raphael (2004). Incomes increased across all quintiles from 1970 to 2009-2011 in
Los Angeles, but rents increased far faster.4As a result, severe rent burdens have
become a problem that affects not only the bottom quintile, which has been
severely burdened for over 40 years, but increasingly the middle class as well.
There are a number of possible explanations for the increasing rents. The
rental market could have tightened as demand exceeded supply. Additionally,
publicly mandated and/or market demanded quality increases could have
translated in higher rents for a better product. In either case, the increasing rents
would likely be unrelated to increasing inequality. However, neither appears to
be the case in Los Angeles.
The housing market was only slightly looser in Los Angeles in 1970 than in
2009-2011, according to the vacancy rates. The market had a 5.2% vacancy
rate in 1970 and a 5.1% rate in 2009-2011. The market was at its tightest in 2000
(3.3%) and loosest a decade earlier, at 6%. It is possible to see the effects of the
recession in recent years in the form of an increased vacancy rate, climbing
from 3.6% in 2005 to over 5% in 2009-2011.
In Los Angeles, increasing rent is also not the result of improvement in
quality and size of the housing stock offered. Quigley and Raphael (2004) find
some evidence for this hypothesis in national data, though it does not explain all
of the U.S. increase. To explore the possibility of the housing stock explanation for
Los Angeles, we regressed the number of bedrooms, building age, housing type
(single-family, duplex, mobile, multi-family), presence of kitchen facilities, and
0%
15%
30%
45%
60%
75%
90%
1970 2009-2011
1970 2009-2011
1970 2009-2011
Bottom Quintile Middle 60 Top Quintile
US Moderate US Severe LA Moderate LA Severe
Source: U.S. Census and ACS PUMS; tabulated by authors.

13 | P a g e
year on the log of gross rent using the 1970 and 2009-2011 data. (See Appendix
A for details.) Using the log provides estimates of the percent change in gross
rent expected over time. For the U.S., controlling for such quality improvements
accounts for just under half of the percent increase in rent over time. In Los
Angeles, on the other hand, the coefficient on the year variable, the expected
percent increase between 1970 and 2009-2011, actually increases if quality
factors are added in, signaling that renters are getting less for more money over
time.
Neither tight markets nor improved quality holds in Los Angeles. Instead,
the problem appears to be two-fold. Los Angeles has a lower median household
income than comparable cities such as New York or San Francisco but only a
small difference in median rents. At the same time, Los Angeles has relatively
fewer publicly subsidized units and weaker rent control. This is particularly true in
comparison to New York. The Los Angeles section 8 voucher program waiting list
has been closed for almost a decade. Affordable housing production and
preservation also slowed with the decline in state and federal funding.
According to the Los Angeles Department of City Planning Housing Needs
Assessment, the city needs to produce roughly 5,300 units per year that are
affordable to moderate-income households or below (Los Angeles Department
of City Planning, 2013).Los Angeles has instead averaged roughly 1,100 units per
year since 2006.Since 2000, 143,000 rental units that had been affordable to
those making less than $44,000 a year became unaffordable.
At the same time, high-end apartment construction is booming. A recent
Los Angeles Times article noted that 17,000 new apartment and condominium
units were permitted in 2013, and the permit rate for the first quarter of 2014 was
up 30% from last year (Logan, 2014b). Nearly all of the building is aimed at top
renters and is unlikely to lessen the steep rent increases and high rent burdens
faced by low and middle income renters.
Additionally, the condominium market may convert older, more
affordable units to condos. This strategy, also aimed at high-income earners,
further reduces affordable housing stock. The Economic Roundtable recognized
the growing pressure on low-income renters and recommended that the Los
Angeles Housing Department (now the Housing and Community Investment
Department) halt condo conversions in community plan areas with vacancy
rates under 5% (Economic Roundtable, 2009).
Conclusion
Los Angeles residents face a harsher version of the national rent burden
crisis. The severity of the burden, particularly among the poorest, is a persistent
problem, not a new one. Rent burdens have been severe for the poorest 20%
since the 1970s, while growing more serious for the middle class.
The data show there has not been enough done to address the housing
burdens of the poorest. A solution must address both components of the housing

14 | P a g e
burden, low incomes and high rents, by increasing renter earnings and the
supply of affordable housing units. Policies designed to address relatively low
incomes, such as increasing the minimum wage. A recent Economic
Roundtable report calculates that a $15 minimum wage would lead to $1.8
billion extra dollars spent on housing annually, largely by allowing households to
buy rather than rent (Flaming and Burns, 2013).
Simultaneously, affordable housing production and preservation needs to
accelerate. Los Angeles’s affordable housing trust fund is chronically
underfunded, particular since the dissolution of the California Redevelopment
Authority and with the reduction in federal funding (Reyes, 2014). Money from
the fund is needed to leverage other federal programs like the Low Income
Housing Tax Credit. The recently passed California state budget allocates 10% of
funds from the cap-and-trade program to affordable housing, but the total
amount projected for the state would not make up the shortfall in Los Angeles’s
fund (NLIHC, 2014).

15 | P a g e
References
Aguiar, Mark A. and Mark Bils, “Has Consumption Inequality Mirrored Income
Inequality?” Working Paper 16807, National Bureau of Economic Research,
2011,www.Nber.Org/Papers/W16807.
Bee, Adam. "Household income inequality within US counties: 2006–2010
American Community Survey Briefs." 2012.
Bobo, Lawrence, Melvin Oliver, James Johnson, and Abel Valenzuela, editors.
Prismatic Metropolis: Inequality in Los Angeles. Russell Sage Foundation
Publications, 2000.
California Housing Partnership Corporation (2014). How California’s Housing
Market is Failing to Meet the Needs of Low-Income Families: Recommendations
to the Leaders of the State of California. California Housing Partnership
Corporation.
Dewan, Shaila (2014) “In Many Cities, Rent Is Rising Out of Reach of Middle
Class” New York Times April 14, 2014
Domhoff, G. William. "Power in America: Wealth, Income, and Power." Who Rules
America (2013).http://www2.ucsc.edu/whorulesamerica/power/wealth.html
Economic Roundtable (2009) Economic Study of the Rent Stabilization
Ordinance and the Los Angeles Housing Market, prepared for the City of Los
Angeles Housing
Department.http://lahd.lacity.org/lahdinternet/Portals/0/Rent/RSO_Study_Exec_
Summary_wCover.pdf
Flaming, Daniel and Patrick Burns (2013).Effects of a $15 Dollar an Hour Minimum
Wage in the City of Los Angeles Economic Roundtable, underwritten by the Los
Angeles County Federation of Labor, AFL-CIO Available online:
http://www.economicrt.org/pub/Effects_15Dollar_MinWage_LA_City/Effects_15
Dollar_MinWage_LA_City.pdf
Flanagan, Christine and Mary Schwartz (2013).Rental Housing Market Condition
Measures: A Comparison of U.S. Metropolitan Areas from 2009-2011 American
Community Survey Briefs, U.S. Department of Commerce Economics and
Statistics Administration U.S. Census Bureau, Washington, D.C.
Gyourko, Joseph, Christopher Mayer, and Todd Sinai. (2006). “Superstar Cities”
(Working Paper 12355) National Bureau of Economic Research website:
http://www.nber.org/papers/w12355

16 | P a g e
Hartman, Chester W. (1983) America’s Housing Crisis: What is to be done?
Routledge/Thoemms Press
Heathcote, Jonathan, Fabrizio Perri, and Giovanni L. Violante. "Unequal we
stand: An empirical analysis of economic inequality in the United States, 1967–
2006." Review of Economic Dynamics 13.1:15-51, 2010.
Joint Center for Housing Studies of Harvard University (2014) The State of the
Nation’s Housing 2014 Cambridge, MA: Joint Center for Housing Studies of
Harvard University
Joint Center for Housing Studies of Harvard University (2013) America’s Rental
Housing: Evolving Markets and Needs Cambridge, MA: Joint Center for Housing
Studies of Harvard University
Logan, Tim (2014a) “Rent prices in the Southland may be topping out” Los
Angeles Times July 2, 2014http://www.latimes.com/business/la-fi-apartment-
rents-20140703-story.html
Logan, Tim (2014b) “Apartment construction surges across the Southland amid
rising rents” Los Angeles Times May 16,
2014http://www.latimes.com/business/realestate/la-fi-apartment-rents-
20140517-story.html
Los Angeles Department of City Planning (2013) “Chapter 1: Housing Needs
Assessment” in Housing Element 2013-2021 Adopted December 3, 2013
http://cityplanning.lacity.org/HousingInitiatives/HousingElement/Text/Ch1.pdf
Meyerson, Harold (2014) “What to do about LA’s sky-high rents” Los Angeles
Times April 24, 2014.http://www.latimes.com/opinion/op-ed/la-oe-meyerson-
rent-los-angeles-20140424-story.html
National Low Income Housing Coalition (2014) “California Advocates Secure
Key Budget Victories” June 27, 2014 http://nlihc.org/article/california-
advocates-secure-key-budget-victories
Oliver, Melvin and Thomas Shaprio. Black Wealth/White Wealth: A New
Perspective on Racial Inequality. New York: Routledge, 2006.
Ong, Paul M. and J. Eugene Grigsby III, "Race and Life-Cycle Effects on Home
Ownership in Los Angeles, 1970 to 1980," Urban Affairs Quarterly, 1988, 23(4):601-
615.

17 | P a g e
Ong, Paul, Eulalio Castellanos, Luz Echavarria, Ann Forsyth, Yvette Galindo, Mary
Richardson, Sara Rigdon Bensinger, Paul Schimek and Holly Van Houten, The
Widening Divide: Income Inequality and Poverty in Los Angeles, The Research
Group on the Los Angeles Economy, 255 pages, 1989.
Ortalo-Magne, Francios, and Andrea Prat (2007).“The Political Economy of
Housing Supply: Homeowners, Workers, and Voters” [Discussion paper
TE/2007/514] The Suntory-Toyota International Centers for Economics and
Related Disciplines, London School of Economics and Political Science Available
online: http://eprints.lse.ac.uk/3678/1/politicaleconomy.pdf
Quigley, John M. and Steven Raphael, “Is Housing Unaffordable? Why Isn’t It
More Affordable?” Journal of Economic Perspectives, 18(1):191-214, Winter 2004.
Raya, Josep and Jaume Garcia, “Which Are the Real Determinants of Tenure? A
Comparative Analysis of Different Models of the Tenure Choice of a House,”
Urban Studies, 49(16):3645–3662, December 2012.
Shapiro, Thomas, Tatjana Meschede, and Sam Osoro. “The Roots of the
Widening Racial Wealth Gap: Explaining the Black-White Economic Divide.”
Institute on Assets and Social Policy, Feb 2013.
Reyes, Emily Alpert (2014) “L.A. politicians weigh plan to replenish affordable
housing trust fund” Los Angeles Times May 12, 2014
http://www.latimes.com/local/la-me-affordable-housing-fund-20140513-
story.html
Stone, Chad, DaniloTrisi, and Arloc Sherman."A Guide to Statistics on Historical
Trends in Income Inequality." Center on Budget and Policy Priorities, 12 Oct.
2013. Web. 13 Mar. 2013.
<http://www.cbpp.org/cms/index.cfm?fa=view>.
Wolff, Edward N., Ajit Zacharias, and Thomas Masterson. "Trends in American
Living Standards and Inequality, 1959–2007." Review of Income and Wealth
58.2:197-232, 2012.

18 | P a g e
Appendix A: Multivariate Analysis of Rent Levels
We ran an ordinary least squares regression that examines the log of gross rent
as a function of various quality factors and the data year. We adjusted variables
that changed between 1970 and 2009-2011, particularly the housing structure
type and building age. The use of the log of gross rent allows an analysis of
expected percent change. The model and results are below:
OLS model:
log (Gross Rent) = f(year built, number of bedrooms, dummies for unit type,
kitchen facilities, plus a dummy for 2009-11).
Table A1. Los Angeles Log Gross Rent Without Quality Variables
Variable Parameter
Estimate
Standard Error t Value Pr> |t|
Intercept 6.45353 0.00472 1368.08 <.0001
2011 Dummy 0.60407 .00525 115.01 <.0001
N = 57,196
Table A2. Los Angeles Log Gross Rent With Quality Variables
Variable Parameter
Estimate
Standard Error t Value Pr> |t|
Intercept 6.09513 0.00950 641.78 <.0001
Year Built 0.0234 0.00094431 24.78 <.0001
# of Bedrooms 0.19054 0.00209 91.07 <.0001
Single Family
Detached
0.05067 0.00872 5.81 <.0001
Duplex -0.00019792 0.01185 -0.02 0.9867
Mobile Home -0.40327 0.02479 -16.27 <.0001
Small multi-
family (3-9)
0.00043819 0.00863 0.05 0.9595
Large multi-
family (10+)
0.02842 0.00839 3.39 0.0007
Kitchen -0.11423 0.00911 -12.54 <.0001
2011 Dummy 0.64825 .00525 115.01 <.0001
N=57,196
[Note that Kitchen is 1 for Yes and 2 for No in the Census]
Source: U.S. Census and ACS PUMS; tabulated by authors.
Source: U.S. Census and ACS PUMS; tabulated by authors.

19 | P a g e
Table A3. U.S. Log Gross Rent with Quality Variables
Variable Parameter
Estimate
Standard Error t Value Pr> |t|
Intercept 6.30570 0.00437 1444.18 <.0001
2011 Dummy 0.45997 0.00441 104.42 <.0001
N = 984,425
Table A2. Los Angeles Log Gross Rent With Quality Variables
Variable Parameter
Estimate
Standard Error t Value Pr> |t|
Intercept 6.11178 0.00489 1249.98 <.0001 Year Built 0.01832 0.00021656 84.62 <.0001
# of Bedrooms 0.14525 0.00061114 237.68 <.0001 Single Family
Detached -0.05535 0.00249 -22.27 <.0001
Duplex -0.14610 0.00292 -49.95 <.0001 Mobile Home -0.48349 0.00349 -138.65 <.0001
Small multi-
family (3-9) -0.15971 0.00252 -63.33 <.0001
Large multi-
family (10+) -0.07366 0.00249 -29.56 <.0001
Kitchen 0.00326 0.00385 0.85 0.3973 2011 Dummy 0.37675 0.00555 67.85 <.0001
N=984,425
[Note that Kitchen is 1 for Yes and 2 for No in the Census]
Source: U.S. Census and ACS PUMS; tabulated by authors.
Source: U.S. Census and ACS PUMS; tabulated by authors.

20 | P a g e
Endnotes
1 Los Angeles County is geographically coterminous with the metropolitan statistical area as defined during
the period before the turn of the century.
2 From 1989 to 2007, the percent of Los Angeles families with an annual income of less than $25,000
increased from 16.2% to 18.7% (inflation adjusted). The latter percentage for Los Angeles in 2007 (18.7%) is
considerably higher than the 16.5% of American families that fell into this low-income category. During that
same year, 12.6% families in Los Angeles had an annual income of $150,000, compared to 10.2% for the
nation. In other words, income inequality in Los Angeles is higher than for the nation.
3Home ownership rate in Los Angeles is considerable lower than that for the nation. According to the 2011
American Community survey, 46.3% of Los Angeles households are home owners, while the rate for the
nation is 64.6%. The lower rate for this region is likely due to a combination of a disproportionate number of
low-income households and higher housing cost. Worse, the ownership rate in Los Angeles has declined
over the last quarter century, indicating increasing difficulties in making the transition away from being
renters.
4Carrying out the analysis by decade would show periods of income decline in Los Angeles but were
beyond the scope of this research.