impacts of the global financial crisis on households
TRANSCRIPT


Impacts of the Global Financial Crisis on Households:
Follow-Up Case Study in Bangladesh --Final Report--
Prepared by Issa Sanogo Food Security Analysis Service
-ODXF-
2
Table of Content
Abbreviations and Acronyms ........................................................................................................................................ 4
Acknowledgements ....................................................................................................................................................... 5
Executive Summary....................................................................................................................................................... 6
1- Introduction............................................................................................................................................................... 9 1.1. Background.....................................................................................................................................................................................9 1.2. Objectives of the Follow-Up Case Study ...........................................................................................................................................9
2- Methodology and Limitations .................................................................................................................................. 9 2.1. Data Collection, Collation and Review.............................................................................................................................................9 2.2. Limitations...................................................................................................................................................................................10
3- Impacts of the Global Financial Crisis on the Macro-Economic Performance ..................................................... 11 3.1. Recent Macro-Economic Performance .............................................................................................................................................11 3.1.1 GDP Growth Led by Domestic Demand ....................................................................................................................................11 3.1.2 Food Inflation on the Rise Again ................................................................................................................................................11 3.1.3 Continued Accommodative Monetary Policy to Support Fiscal Policy ............................................................................................12 3.1.4 Stable Fiscal Performance............................................................................................................................................................13 3.1.5 Improved Performance of the Capital Market...............................................................................................................................13 3.2. Macro-Impacts of the Global Financial Crisis ................................................................................................................................13 3.2.1 Degree of Exposure to the Global Economy .................................................................................................................................13 3.2.2 Stable Remittance Inflows despite Significant Deceleration of Outmigration ...................................................................................14 3.2.3 Signs of Resilience after a Poor Trade Performance in FY09 ........................................................................................................15 3.2.4 Aid Flows Increased and Foreign Direct Investment Flows Decreased ...........................................................................................17 3.3.4 Slight Appreciation of Real Exchange Rates and Reduction of Export Competitiveness Margin ....................................................18
4- Effects of the Global Financial Crisis on Households between March 2009 and March 2010...............................19 4.1. Changes in Livelihoods and Income Sources....................................................................................................................................19 4.2. Changes in Employment and Wage Patterns..................................................................................................................................20 4.3. Changes in Migration Patterns and Remittances.............................................................................................................................21 4.4. Changes in Expenditures and Food Consumption ..........................................................................................................................22 4.5. Coping Strategies and Priority Needs .............................................................................................................................................24
5- Perspectives and Ongoing Interventions ................................................................................................................24 5.1. Future Outlook.............................................................................................................................................................................24 5.2. Ongoing Response Interventions .....................................................................................................................................................25
6- Conclusions and Recommendations .......................................................................................................................26
References: ...................................................................................................................................................................26
Annexes.........................................................................................................................................................................28 Annex 1. Selected Macro-Economic Performance Indicators...................................................................................................................29 Annex 2. Sample Sites for Focus Group Discussions ............................................................................................................................30 Annex 3. Checklist for Focus Group Discussion...................................................................................................................................31
Boxes
Box 1. When the Collapse of Incomes Becomes Synonymous of a Descent into Hell: The Story of I. S. a Shrimp Farmer of Vattagram Village in Bagerhat District..………………………………………………………………………..20
Box 2. How Can the Job Loss Become a Major Source of Vulnerability for an Entire Household? The Story of J.A., a Migrant Worker of Ramda Village in Sylhet District …………………………..………………………………22
3

Abbreviations and Acronyms
AARCPP Annual Agriculture/Rural Credit Policy and Program ADB Asian Development Bank ADP Annual Development Program BB Bank of Bangladesh BBS Bangladesh Bureau of Statistics BIDS Bangladesh Institute of Development Studies BMET Bureau of Manpower Employment and Training BRAC Bangladesh Rural Advancement Committee CNRS Center for Natural Resource Studies CPD Centre for Policy Dialogue DFID UK Department for International Development DSE Dhaka Stock Exchange EU European Union FAO Food and Agriculture Organization FDI Foreign Direct Investment FGD Focus Group Discussion GDP Gross Domestic Product IMF International Monetary Fund IPHN Institute of Public Health and Nutrition IRS Interest Rate Spread LDC Least Developed Countries NGO Non Government Organizations NPL Non-Performing Loans NSD National Savings Directorate ODA Official Development Assistance OMS Open Market Sale ROA Return on Asset ROE Return on Equity RMG Ready-Made Garment RWCAR Risk Weighted Capital Asset Ratio UD Utilization Declaration UNICEF United Nations Children's Fund US United States USITC United States International Trade Commission VAM WFP Vulnerability Analysis and Mapping WB World Bank WFP World Food Programme
4

Acknowledgements
I wish to thank Dr. M. Habibur Rahman for his great support in updating the macro-economic and key informant data. I am also extremely grateful to CNRS and their enumerators for leading focus group discussions and compiling data in a very tight deadline.
The preparation of this follow-up case study of the impacts of the global financial crisis was greatly supported by WFP country office in Bangladesh. I would like to thank John Aylieff (Country Director) and Michael Dunford (Deputy Country Director) for their support and advice during this study. I would also like to acknowledge the diligence with which the country office administration and finance units handled all the administrative processes involved in this follow-up study. A special thank goes also to the country office vulnerability and mapping (VAM) staff, namely John McHarris, Nusha Choudhury, Malik Kabir and particularly to Md. Mahabubul Alam, who invested a great deal of his time supporting the preparation of primary data collection and field work.
Finally, thank you to Joyce Luma (Chief ODXF) and Mario Musa (Communications Advisor) for the very useful comments and suggestions during the finalization of the report.
I am solely responsible for any remaining errors.
5
Executive Summary
Overview
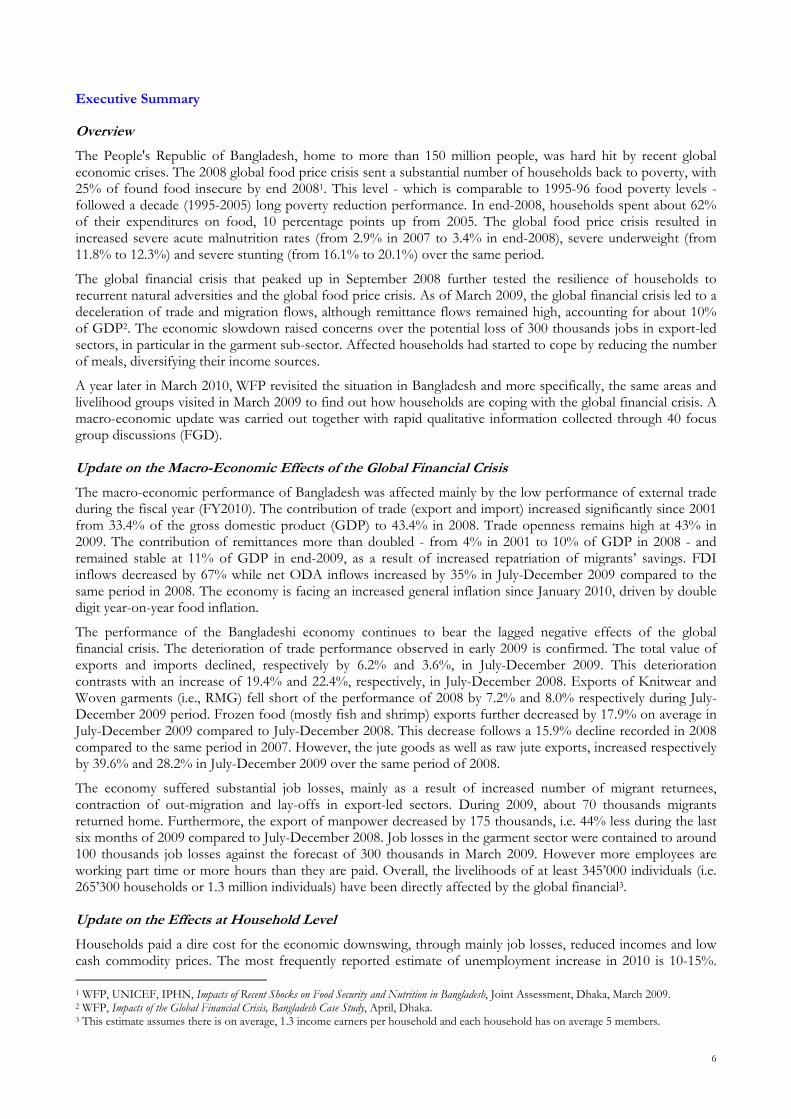
The People's Republic of Bangladesh, home to more than 150 million people, was hard hit by recent global economic crises. The 2008 global food price crisis sent a substantial number of households back to poverty, with 25% of found food insecure by end 20081. This level - which is comparable to 1995-96 food poverty levels - followed a decade (1995-2005) long poverty reduction performance. In end-2008, households spent about 62% of their expenditures on food, 10 percentage points up from 2005. The global food price crisis resulted in increased severe acute malnutrition rates (from 2.9% in 2007 to 3.4% in end-2008), severe underweight (from 11.8% to 12.3%) and severe stunting (from 16.1% to 20.1%) over the same period.
The global financial crisis that peaked up in September 2008 further tested the resilience of households to recurrent natural adversities and the global food price crisis. As of March 2009, the global financial crisis led to a deceleration of trade and migration flows, although remittance flows remained high, accounting for about 10% of GDP2. The economic slowdown raised concerns over the potential loss of 300 thousands jobs in export-led sectors, in particular in the garment sub-sector. Affected households had started to cope by reducing the number of meals, diversifying their income sources.
A year later in March 2010, WFP revisited the situation in Bangladesh and more specifically, the same areas and livelihood groups visited in March 2009 to find out how households are coping with the global financial crisis. A macro-economic update was carried out together with rapid qualitative information collected through 40 focus group discussions (FGD). Update on the Macro-Economic Effec s of the Global Financial Crisis t
The macro-economic performance of Bangladesh was affected mainly by the low performance of external trade during the fiscal year (FY2010). The contribution of trade (export and import) increased significantly since 2001 from 33.4% of the gross domestic product (GDP) to 43.4% in 2008. Trade openness remains high at 43% in 2009. The contribution of remittances more than doubled - from 4% in 2001 to 10% of GDP in 2008 - and remained stable at 11% of GDP in end-2009, as a result of increased repatriation of migrants’ savings. FDI inflows decreased by 67% while net ODA inflows increased by 35% in July-December 2009 compared to the same period in 2008. The economy is facing an increased general inflation since January 2010, driven by double digit year-on-year food inflation.
The performance of the Bangladeshi economy continues to bear the lagged negative effects of the global financial crisis. The deterioration of trade performance observed in early 2009 is confirmed. The total value of exports and imports declined, respectively by 6.2% and 3.6%, in July-December 2009. This deterioration contrasts with an increase of 19.4% and 22.4%, respectively, in July-December 2008. Exports of Knitwear and Woven garments (i.e., RMG) fell short of the performance of 2008 by 7.2% and 8.0% respectively during July-December 2009 period. Frozen food (mostly fish and shrimp) exports further decreased by 17.9% on average in July-December 2009 compared to July-December 2008. This decrease follows a 15.9% decline recorded in 2008 compared to the same period in 2007. However, the jute goods as well as raw jute exports, increased respectively by 39.6% and 28.2% in July-December 2009 over the same period of 2008.
The economy suffered substantial job losses, mainly as a result of increased number of migrant returnees, contraction of out-migration and lay-offs in export-led sectors. During 2009, about 70 thousands migrants returned home. Furthermore, the export of manpower decreased by 175 thousands, i.e. 44% less during the last six months of 2009 compared to July-December 2008. Job losses in the garment sector were contained to around 100 thousands job losses against the forecast of 300 thousands in March 2009. However more employees are working part time or more hours than they are paid. Overall, the livelihoods of at least 345’000 individuals (i.e. 265’300 households or 1.3 million individuals) have been directly affected by the global financial3. Update on the Effects at Household Level
Households paid a dire cost for the economic downswing, through mainly job losses, reduced incomes and low cash commodity prices. The most frequently reported estimate of unemployment increase in 2010 is 10-15%.
1 WFP, UNICEF, IPHN, Impacts of Recent Shocks on Food Security and Nutrition in Bangladesh, Joint Assessment, Dhaka, March 2009. 2 WFP, Impacts of the Global Financial Crisis, Bangladesh Case Study, April, Dhaka. 3 This estimate assumes there is on average, 1.3 income earners per household and each household has on average 5 members.
6

Remittance earners, daily labourers and shrimp farmers are the most affected by the global financial crisis. The job losers are partly absorbed by the agriculture sector and the casual labour market.
Remittance earners faced significant declines in both the frequency and amount of remittances received from relatives who managed to stay abroad. In March 2009, remittances were the first source of income of remittance earners with an estimate of 80% contribution. In March 2010, remittances have become second to third source of income with an average 20% contribution to household incomes, according to the majority of focus groups. Several focus groups estimated that about 10% of migrants have returned home. They report that the frequency of remittances decreased by 50% while the amount decreased by 40% in one year.
Household’s budget spent on food increased on average by 5% during the last 12 months to 60% in March 2010. This increase is due to food price inflation. In general, the share of education has decreased by about 20% during the last 12 months, due to the expanded coverage of free school books provision to primary and secondary school students, resulting in a reported 10% increase of school attendance, compared to 2009. Expenditures on health have generally increased due to increased costs of medicines, except for shrimp farmers and tea estate workers. Tea estate workers benefited from subsidies provided by the employers whereas shrimp farmers cut down health expenditures as a way of coping. The burden of debt remains particularly high on shrimp farming households, who faced the collapse of the shrimp exports. Most urban focus groups reported an increase of the share of transport, utilities and rents in total expenditures by 10-50 percent during the last 12 months.
In response to the challenges they face (i.e. price increases and income losses) households cope by cutting down consumption of protein sources, dairies and fruits. They also diversify their income sources by involving more family members, in particular women and children, in income earning activities (mainly casual labour). Reduction of health care expenses is another negative coping mechanism adopted by households, in particular those involved in shrimp farming.
When asked to rank their priority needs, focus groups indicated employment and income generation activities as their first priority, followed by health, water and sanitation and infrastructure including irrigation systems and roads. It is worth noting that the majority of urban focus groups mentioned water and sanitation as their first priority. Price subsidies were also mentioned as a priority, especially by urban focus groups. Future Outlook
Projections by international financial organisations converge on the fact that GDP growth will be lower (ranging from 5.2 to 6.0%) against the actual growth of 5.9% in the last fiscal year (FY09). However, economic growth in Bangladesh is expected to regain momentum in the second half of 2010.
Although there are signs of improvement in trade indicators and significant increase in foreign reserves, the recent deceleration of export growth may lead to a contraction of foreign reserves and thus weaken the food import capacity of the country and depreciate the exchange rate of the Taka against major currencies. Currency depreciation could lead to some losses of real income and purchasing power through inflation driven by imported goods. In addition to the current accommodative policy stance of the central bank, an expected increase in government spending for rescue packages (including tax breaks, cash subsidies and food rationing programs) could result in monetary financing of increased fiscal deficits beyond the 5.0% target, fuelling inflation. This will further compound the living conditions of vulnerable households.
Double digit food inflation raises concerns about vital needs (health care and nutritious food) and their implications for vulnerable households’ food security and nutrition in the near future. It is worth noting that the impacts of the recent increases in food price inflation on households’ expenditures are yet to get back to their 2005 normal level. It is also feared that the decline in the manpower exports, the reduction of the incomes of shrimp farmers and job losses in the garment sectors will fuel household vulnerability as most affected households of both urban and rural areas will increasingly recourse to casual labour and irregular wage labour. Ongoing Responses and Recommendations
The Government of Bangladesh and its partners continue to maintain and expand the social safety net system designed to address mainly transient food insecurity and support social sectors. The coverage of the partially free school fee program was further expanded in the primary and secondary schools in 2009. The government also raised the salary scale of civil servants in 2009. Beside, substantial effort is being made to support productive sectors through stimulus packages, investment in infrastructure, interest rate cuts and improved macro-economic monitoring.
7
Besides partnering with the government on social safety net programs such as VGD, WFP has also initiated a cash transfer program in 2009 to mitigate the effects of the combined global food, fuel and financial crises on the most affected households.
However, the importance of job losses and the great number of migrant returnees underscore the need for rapid job creation in services, manufacturing and agriculture sectors to mitigate the adverse impacts of the global financial crisis. Further efforts can be made to:
• Improve and expand the health and nutrition care coverage to the most vulnerable households such as casual labourers, shrimp farmers and remittance earners.
• Accelerate the implementation of the Annual Development Plan (ADP) in investing more in labour intensive income generating activities (e.g. basic infrastructure, water supply, sanitation, rural roads and electricity) through cash for work.
• Consider building the skills of candidates to outmigration to reduce their vulnerability to job losses in host countries.
• Accelerate investment to increase agricultural productivity to face the increasing population pressure on arable land. Supporting productivity growth in food and cash crop production, fish/shrimp farming and livestock rearing is expected to partly absorb migrant returnees and less-skilled domestic workers who have lost their jobs in the face of the financial crisis. The AARCPP initiative of BB is a step in the right direction, assuming it is sustained.
• Establish a food security and market monitoring system, building on existing systems that monitor remittances, out-migration flows, flows of returnees, less-skilled wage rates in nonfarm and farm activities, staple food, cash and livestock prices, nutrition indicators, etc.
8

1- Introduction
1.1. Background
Following the deepest global downturn in recent history, economic growth of advanced economies in the second half of 2010 is expected to firm up and expand at different speeds in the various regions. Recent IMF World Economic Outlook Update foresees that the world output is expected to rise by 4 percent in 2010. Economic recovery is expected to gain momentum slowly in developed countries. In many emerging and developing economies, economic activity is expected to be relatively vigorous, largely driven by buoyant internal demand.4
While Bangladesh’s economy has withstood several challenges since 2006 (political instability, natural disasters and the global food, fuel and financial crises), its economic resilience is still being challenged by the recent global financial crisis and domestic inflation. The recent hike of food prices is taking away the comfort that the affected households were enjoying from relatively low commodity prices during the crisis period. This price hike along with the lagged effects of the global economic recession is now likely to further worsen the situation of the most vulnerable households, who depend on agriculture and non-agriculture wage labour and casual labour. A review of literature by the Centre for Policy Dialogue (CPD, 2009) reveals that the most affected sectors are export-oriented sectors, manpower export, remittance and domestic resource mobilization. The livelihoods in the areas dependent on these sectors are also the most affected by food price rises.
1.2. Objectives of the Follow-Up Case Study
This case study is conducted to provide an update on the effects of the global economic crisis in Bangladesh, as a follow-up of the rapid assessment undertaken in March 20095. It aims at understanding how households are currently coping with the effects of the global financial crisis at a time when global economic growth is firming up.
The follow-up case study provides:
An update of the macro-economic performance including transmission channels of the global financial crisis to the domestic economy and households, and policy/responses implemented.
An assessment of the changes observed at household level (changes in livelihoods, expenditures, coping strategies, priority needs, assistance received…).
The next section provides a brief overview of the methodology and the limitations of the case-study. Section 3 focuses on the update of the macro-economic performance. Section 4 reports on the findings of the current impacts of the global financial crisis on households. Section 5 sheds some lights on the mitigation responses implemented by the government and its partners in country. Some concluding remarks and recommendations are provided in section 6.
2- Methodology and Limitations
2.1. Data Collection, Collation and Review
Secondary data were reviewed to update the impacts of the global financial crisis on macro-economic performance. Besides, primary data were collected through focus group discussions (FGD) to assess the impacts of the crisis on households’ livelihoods and food security. Field visits took place from 01 to 20 March, 2010. Forty FGD were held (annex 2). Survey areas were maintained unchanged to enable comparability with the 2009 assessment. Therefore, areas with high concentration of migration and dependent on remittances in the North East and South East, areas with high concentration of agricultural labour and cash crops such as tea estates in the North East and shrimp farms in the South West and areas with high concentration of non agricultural unskilled labour (e.g., garment industry) of the two biggest cities Dhaka (capital city) and Chittagong were revisited. Two
4 World Economic Outlook Update, January 26, 2010. 5 The present report complements similar follow-up case studies undertaken by WFP in February/March 2010 in Bangladesh, Nicaragua, Ghana and Zambia, as an effort to continue documenting the impact of the global economic crisis on vulnerable households in a variety of settings applicable to other countries.
9
locations selected in Khulna and Rajshahi as control groups in both rural and urban areas to represent other categories of casual labour were also revisited.
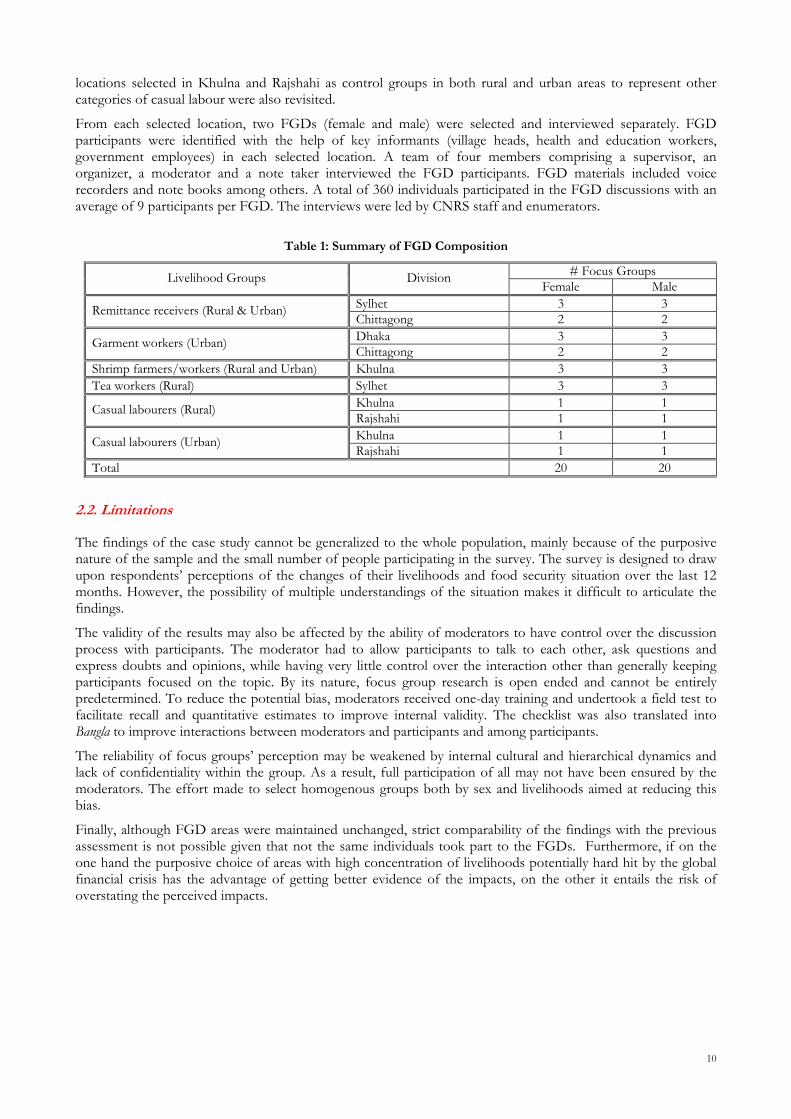
From each selected location, two FGDs (female and male) were selected and interviewed separately. FGD participants were identified with the help of key informants (village heads, health and education workers, government employees) in each selected location. A team of four members comprising a supervisor, an organizer, a moderator and a note taker interviewed the FGD participants. FGD materials included voice recorders and note books among others. A total of 360 individuals participated in the FGD discussions with an average of 9 participants per FGD. The interviews were led by CNRS staff and enumerators.
Table 1: Summary of FGD Composition
# Focus Groups Livelihood Groups Division Female Male
Sylhet 3 3 Remittance receivers (Rural & Urban) Chittagong 2 2 Dhaka 3 3 Garment workers (Urban) Chittagong 2 2
Shrimp farmers/workers (Rural and Urban) Khulna 3 3 Tea workers (Rural) Sylhet 3 3
Khulna 1 1 Casual labourers (Rural) Rajshahi 1 1 Khulna 1 1 Casual labourers (Urban) Rajshahi 1 1
Total 20 20
2.2. Limitations
The findings of the case study cannot be generalized to the whole population, mainly because of the purposive nature of the sample and the small number of people participating in the survey. The survey is designed to draw upon respondents’ perceptions of the changes of their livelihoods and food security situation over the last 12 months. However, the possibility of multiple understandings of the situation makes it difficult to articulate the findings.
The validity of the results may also be affected by the ability of moderators to have control over the discussion process with participants. The moderator had to allow participants to talk to each other, ask questions and express doubts and opinions, while having very little control over the interaction other than generally keeping participants focused on the topic. By its nature, focus group research is open ended and cannot be entirely predetermined. To reduce the potential bias, moderators received one-day training and undertook a field test to facilitate recall and quantitative estimates to improve internal validity. The checklist was also translated into Bangla to improve interactions between moderators and participants and among participants.
The reliability of focus groups’ perception may be weakened by internal cultural and hierarchical dynamics and lack of confidentiality within the group. As a result, full participation of all may not have been ensured by the moderators. The effort made to select homogenous groups both by sex and livelihoods aimed at reducing this bias.
Finally, although FGD areas were maintained unchanged, strict comparability of the findings with the previous assessment is not possible given that not the same individuals took part to the FGDs. Furthermore, if on the one hand the purposive choice of areas with high concentration of livelihoods potentially hard hit by the global financial crisis has the advantage of getting better evidence of the impacts, on the other it entails the risk of overstating the perceived impacts.
10
3- Impacts of the Global Financial Crisis on the Macro-Economic Performance
3.1. Recent Macro-Economic Performance 3.1.1 GDP Growth Led by Domestic Demand
In recent years, Bangladesh enjoyed a substantial growth of the real GDP recording a growth of 5.9 percent in FY09 based on a strong agriculture sector output growth. Although intra-year output growth estimates are not available for the Bangladesh economy, the expected acceleration of the world economy’s recovery process from the global financial crisis, anticipates a healthy growth prospect of real sector output in FY10 (July 2009-June 2010). Growth momentum in crops and horticulture, animal husbandry, forestry, and fishing subsectors of agriculture sector are expected to continue in FY10. Robust domestic demand supported by growing workers’ remittance inflows and budgetary stimulus packages and higher social safety net spending are expected to contribute to the high growth expectation of the industrial sector in FY10. The growth performance of the service sector continues to be buoyant due to the recovery in private consumption, export and import growth; booming trend in construction activities including residential and commercial housing activities will also create momentum in service sector growth.
On the basis of the optimistic domestic demand outlook, the Bangladesh economy is conservatively projected by Bangladesh Bank to grow by 5.5-6.0 percent in FY10 as mentioned in the latest monetary policy statement (MPS, January 2010). However, the real GDP growth projections for Bangladesh made by World Bank (WB) and Asian Development Bank (ADB) remain somewhat lower at 5.5 percent and 5.2 percent respectively in FY10. 3.1.2 Food Inflation on the Rise Again
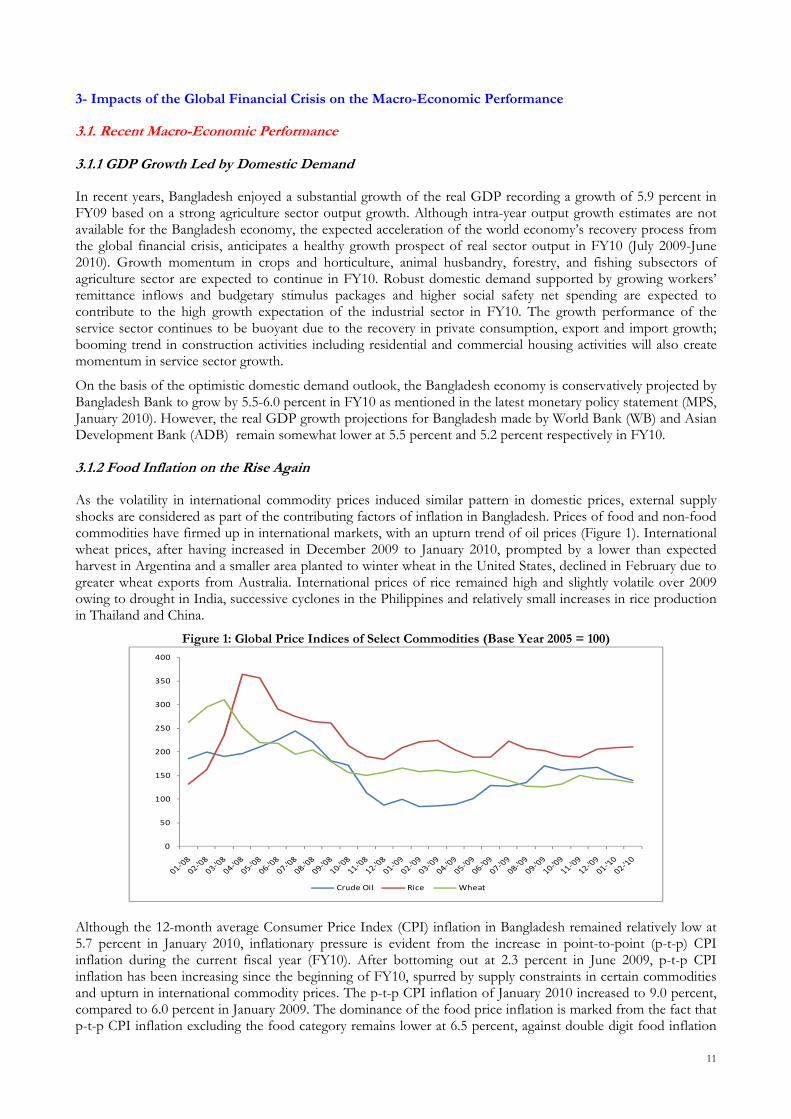
As the volatility in international commodity prices induced similar pattern in domestic prices, external supply shocks are considered as part of the contributing factors of inflation in Bangladesh. Prices of food and non-food commodities have firmed up in international markets, with an upturn trend of oil prices (Figure 1). International wheat prices, after having increased in December 2009 to January 2010, prompted by a lower than expected harvest in Argentina and a smaller area planted to winter wheat in the United States, declined in February due to greater wheat exports from Australia. International prices of rice remained high and slightly volatile over 2009 owing to drought in India, successive cyclones in the Philippines and relatively small increases in rice production in Thailand and China.
Figure 1: Global Price Indices of Select Commodities (Base Year 2005 = 100)
0
50
100
150
200
250
300
350
400
Crude Oil Rice Wheat
Although the 12-month average Consumer Price Index (CPI) inflation in Bangladesh remained relatively low at 5.7 percent in January 2010, inflationary pressure is evident from the increase in point-to-point (p-t-p) CPI inflation during the current fiscal year (FY10). After bottoming out at 2.3 percent in June 2009, p-t-p CPI inflation has been increasing since the beginning of FY10, spurred by supply constraints in certain commodities and upturn in international commodity prices. The p-t-p CPI inflation of January 2010 increased to 9.0 percent, compared to 6.0 percent in January 2009. The dominance of the food price inflation is marked from the fact that p-t-p CPI inflation excluding the food category remains lower at 6.5 percent, against double digit food inflation
11
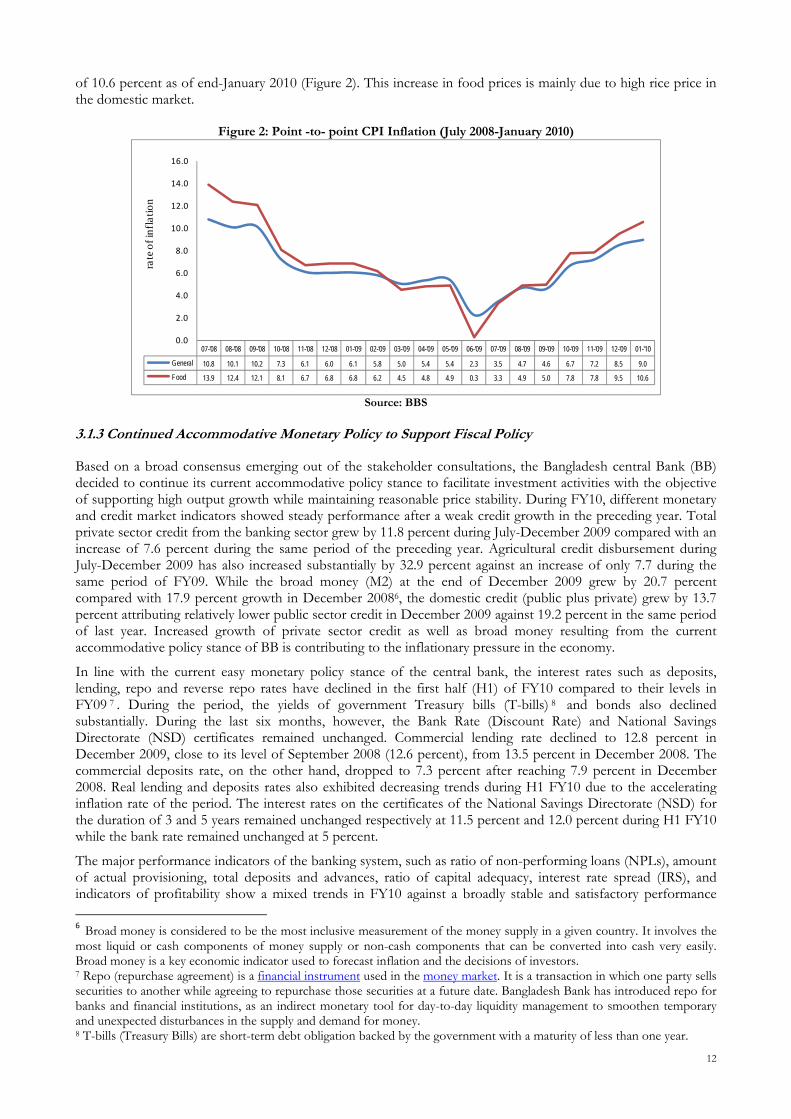
of 10.6 percent as of end-January 2010 (Figure 2). This increase in food prices is mainly due to high rice price in the domestic market.
Figure 2: Point -to- point CPI Inflation (July 2008-January 2010)
07-'08 08-'08 09-'08 10-'08 11-'08 12-'08 01-'09 02-'09 03-'09 04-'09 05-'09 06-'09 07-'09 08-'09 09-'09 10-'09 11-'09 12-'09 01-'10
General 10.8 10.1 10.2 7.3 6.1 6.0 6.1 5.8 5.0 5.4 5.4 2.3 3.5 4.7 4.6 6.7 7.2 8.5 9.0Food 13.9 12.4 12.1 8.1 6.7 6.8 6.8 6.2 4.5 4.8 4.9 0.3 3.3 4.9 5.0 7.8 7.8 9.5 10.6
0.0
2.0
4.0
6.0
8.0
10.0
12.0
14.0
16.0ra
te o
f inf
latio
n
Source: BBS
3.1.3 Continued Accommodative Monetary Policy to Support Fiscal Policy
Based on a broad consensus emerging out of the stakeholder consultations, the Bangladesh central Bank (BB) decided to continue its current accommodative policy stance to facilitate investment activities with the objective of supporting high output growth while maintaining reasonable price stability. During FY10, different monetary and credit market indicators showed steady performance after a weak credit growth in the preceding year. Total private sector credit from the banking sector grew by 11.8 percent during July-December 2009 compared with an increase of 7.6 percent during the same period of the preceding year. Agricultural credit disbursement during July-December 2009 has also increased substantially by 32.9 percent against an increase of only 7.7 during the same period of FY09. While the broad money (M2) at the end of December 2009 grew by 20.7 percent compared with 17.9 percent growth in December 20086, the domestic credit (public plus private) grew by 13.7 percent attributing relatively lower public sector credit in December 2009 against 19.2 percent in the same period of last year. Increased growth of private sector credit as well as broad money resulting from the current accommodative policy stance of BB is contributing to the inflationary pressure in the economy.
In line with the current easy monetary policy stance of the central bank, the interest rates such as deposits, lending, repo and reverse repo rates have declined in the first half (H1) of FY10 compared to their levels in FY09 7 . During the period, the yields of government Treasury bills (T-bills) 8 and bonds also declined substantially. During the last six months, however, the Bank Rate (Discount Rate) and National Savings Directorate (NSD) certificates remained unchanged. Commercial lending rate declined to 12.8 percent in December 2009, close to its level of September 2008 (12.6 percent), from 13.5 percent in December 2008. The commercial deposits rate, on the other hand, dropped to 7.3 percent after reaching 7.9 percent in December 2008. Real lending and deposits rates also exhibited decreasing trends during H1 FY10 due to the accelerating inflation rate of the period. The interest rates on the certificates of the National Savings Directorate (NSD) for the duration of 3 and 5 years remained unchanged respectively at 11.5 percent and 12.0 percent during H1 FY10 while the bank rate remained unchanged at 5 percent.
The major performance indicators of the banking system, such as ratio of non-performing loans (NPLs), amount of actual provisioning, total deposits and advances, ratio of capital adequacy, interest rate spread (IRS), and indicators of profitability show a mixed trends in FY10 against a broadly stable and satisfactory performance 6 Broad money is considered to be the most inclusive measurement of the money supply in a given country. It involves the most liquid or cash components of money supply or non-cash components that can be converted into cash very easily. Broad money is a key economic indicator used to forecast inflation and the decisions of investors. 7 Repo (repurchase agreement) is a financial instrument used in the money market. It is a transaction in which one party sells securities to another while agreeing to repurchase those securities at a future date. Bangladesh Bank has introduced repo for banks and financial institutions, as an indirect monetary tool for day-to-day liquidity management to smoothen temporary and unexpected disturbances in the supply and demand for money. 8 T-bills (Treasury Bills) are short-term debt obligation backed by the government with a maturity of less than one year.
12

during FY09. The risk weighted capital asset ratio (RWCAR) for all banks increased while the ratio of NPL to total loan for the banking sector, in both gross and net terms, decreased. On the other hand, the return on asset (ROA) and the return on equity (ROE), two important measures of bank probability increased to 1.4 percent and 17.6 percent respectively in 2009 from 1.2 percent and 15.6 percent respectively in 2008. The interest rate spread (IRS) for all banks also increased during the period. The amount of both total deposit and advances for the whole banking sector increased during H1 FY10. Although, the banking sector of Bangladesh remained broadly unaffected by the global financial turmoil, mainly due to its low level of foreign capitalization, it would be important to stay alert and refresh the surveillance of the banking sector and revisit the financial sector management to counteract any potential adverse impact on the country's banking sector. 3.1.4 Stable Fiscal Performance
During the first six months of FY10, fiscal developments remained mostly in line with the targets set in the FY10 budget. Preliminary estimates of total revenue and total expenditure stood respectively at 5.7 percent and 6.3 percent of GDP against the yearly targets of 11.6 percent and 16.6 percent, ,respectively, for FY10. The overall fiscal deficit, during July-November of FY10 stood at Tk. 111.2 billion, against the yearly revised target of Tk. 343.58 billion (4.6 percent of GDP). Total deficit financing during July-November of FY10 amounted to Tk. 38.4 billion of which Tk. (-) 25.9 billion was accommodated from domestic sources that included bank financing of Tk. (-) 77.3 billion while the remaining amount of Tk.64.35 billion came from foreign sources. During H1 FY10, the total government expenditure is estimated at Tk.429.6 billion (annual target of Tk.1138.2 billion) which is 1.3 percent higher than the level of last year. It is likely that the current expenditure would also increase in the second half (H2) of FY10 due to government’s implementation of the new national pay scale and other social safety nets programs. 3.1.5 Improved Performance of the Capital Market
In the backdrop of the global financial turmoil, the shaky condition of the country’s capital market during H2 FY09 has reversed in H1 FY10. The capital market experienced robust performance with healthy growth recorded in all the indicators. The Dhaka Stock Exchange (DSE) general index (DSEG) has been rising since July 2009 with some volatility and reached a record level 4535.5 in December 2009 from 3010.3 in December 2008. All the other indicators of the capital market, such as all share price index (DSI), DSE20, turnover and market capitalization witnessed increasing trends as well. 3.2. Macro-Impacts of the Global Financial Crisis 3.2.1 Degree of Exposure to the Global Economy
Despite efforts made by the government to mitigate the negative impacts of the high food prices on households, the implementation of the Annual Development Program (ADP) remained very low up to end-December 2009, raising some concerns about the country’s capacity to efficiently and effectively scale-up public expenditures to protect vulnerable groups and reduce poverty. The utilization of the ADP allocation stood at 29.0 percent of the annual allocation which is 1.3 percent of GDP in the first half of FY10, compared with the annual target of 4.4 percent of GDP.
Bangladesh’s economy is highly exposed to global economic shocks, given its increased integration with the global economy during the last decade. The contribution of trade (export and import) increased significantly since 2001 from 33.4 percent of the gross domestic product (GDP) to 43.0 percent in FY09. About 85 percent of exports are destined to developed countries and roughly 60 percent of import originates from those countries. Exports take up 18 percent of the GDP in Bangladesh. Ready-made garment (RMG) is the main driver of exports, with a share of almost 80 percent of total exports (i.e., 14 percent of GDP). Almost half of the exports go to the European Union (EU), while 25 percent goes to the United States (US). The dependence on foreign aid has progressively reduced since the 1990s, while foreign direct investment remains low at 1 percent of the GDP over the last decade (2000-2009).
13

Table 2: Bangladesh’s Degree of Openness to the Global Economy
FY1981 FY1991 FY2001 FY2007 FY2008 FY2009
(Export + Import)/GDP 13.5 16.8 33.4 43.3 43.4 42.8 Remittances/GDP 1.9 2.5 4.0 8.8 10.0 10.9 ODA Disbursed/GDP 5.8 5.6 2.9 2.3 2.4 1.9 ODA Disbursed/Export 158.1 100.9 21.2 12.9 13.3 10.7
Foreign Direct Investment (FDI)/GDP - 0.1 1.2 1.2 0.8 1.1 Source: Centre for Policy Dialogue (CPD, 2009), adapted. Note: FY stands for Fiscal Year, i.e. July-June.
The contribution of remittances to the domestic economy remained high in FY09. Bangladesh is a huge labour surplus country, putting it on the supply side of the global labour market and at the fifth position among the top remittance recipient countries in the world. As a result, the economy is heavily dependent on migrants’ earnings in the Gulf countries and Western countries. In FY09, total remittances (i.e., USD9.7 billion) accounted for 11 percent of the GDP compared to 10 percent of GDP in FY08. As per the latest statistics, more than 6.0 million Bangladeshis are currently working abroad. About 65 percent of these workers are semi-skilled (16 percent) and low-skilled (49 percent). Two-thirds of the migrants work in Middle East countries, mainly in Saudi Arabia, Kuwait, Qatar, and United Arab Emirates (Table 3). They constitute 25.3 percent of the total labour in those countries and contribute 63 percent of the total remittance inflows in Bangladesh. The inflow of remittances from these countries more than doubled from USD2.4 billion in FY04 to USD6.4 billion in FY08, as a result of the construction boom in the Gulf, especially in Dubai.
Table 3: Importance of Migrant Workers and Remittances Labour Force
(Million) Share of Bangladeshis in
Labour Force (%) Share in Total Remittance
Inflow (%) Kingdom of Saudi Arabia 6.7 27.8 30 Kuwait 2.2 14.2 11 Qatar 1.1 10.0 4 United Arab Emirates 3.3 33.4 14 Bahrain 0.5 26.2 2 Oman 0.9 23.8 3 Total 14.7 25.3 63
Source: BBS (Statistical Yearbook) and Bureau of Manpower Employment and Training (BMET)
The most recent data (July-December 2009) suggest that the pass-through of the global economic crisis into Bangladesh economy is real. Even though Bangladesh is not integrated to the global capital market, the economy is facing the lagged effects of the global financial crisis. There is evidence that international trade, exports of manpower and inflow of foreign official development assistance (ODA) were adversely affected (Table 4). The major source of the potential adverse impact emanated from the projected contraction of foreign aggregate demand. Recent trends in the value of both the exports and imports declined by 6.2 percent and 3.6 percent respectively during H1 FY10.
Table 4: Recent Developments in Trade, Remittances and Aid Flows Jul-Dec. 2009 Jul-Dec. 2008 Jul-Dec. 2007 Growth in Growth in Growth in
(Provisional) (Revised) Jul.-Dec. 2009 Jul.-Dec. 2008 (FY09)
1. Cargo (export plus import) handled in CTG port ('000 MT) 17855.7 13488.9 14244.0 32.4 -5.3 5.3
2. Exports (fob) 7273.9 7754.7 6495.9 -6.2 19.4 10.13. Imports (Settlement of LCs) 10717.4 11115.4 9078.4 -3.6 22.4 5.34. Remittances 5533.2 4504.7 3440.5 22.8 30.9 22.45. Gross ODA inflow 1179.6 898.3 903.2 31.3 -0.5 -15.06. Net ODA inflow 931.6 579.6 630.0 60.7 -8.0 -25.77. Foreign direct investment (FDI) 259.0 706.0 285.0 -63.3 147.7 25.88. Gross foreign exchange reserves of Bangladesh Bank, end period 10344.8 5787.8 5514.6 78.7 5.0 21.59. Exchange rate (Tk. / USD), end period 69.3 68.9 68.6 --- --- ---Sources: (1) Bangladesh Bank, (2) Export Promotion Bureau (EPB), (3) Chittagong Port Authority, and (4) External Resources Division (ERD) of theAll figures are in millions of USD unless otherwise mentioned. 3.2.2 Stable Remittance Inflows despite Significant Deceleration of Outmigration
According to the statistics of the Bureau of Manpower Employment and Training (BMET), the export of manpower decreased by 44 percent in July-December 2009 compared to the same period in 2008. The number of migrant workers stood roughly at 285 thousand during July 2009-February 2010, a 42 percent decrease compared to the same period of last year. Likewise, a declining trend is also observed in the number of clearance
14

certificates issued by BMET for migrant workers. The number of certificates cleared came down to around 2 thousand per day in early 2010 from around 6 thousand per day in early 2008. Virtually, there was no new recruitment in Kuwait during the last two years. Both Saudi Arabia and Malaysia reduced recruitment of Bangladeshi workers to a monthly average of about 1,000 in 2009 compared to a monthly average of about 11,000 workers in 2008. The definitive cancellation of work visas for 55,000 Bangladeshi jobseekers by Malaysia raised concerns about the future outlook of migration to traditional destinations as the issue is yet to be settled despite high level negotiations undertaken in 2009. Migrant workers in the United Arab Emirates (UAE) continue to be sent back to Bangladesh on long-term vacation due to the construction crisis in Dubai. Figures of the BMET indicate continued returns of migrants: about 4,800 workers returned home in January 2009 which further increased substantially to 8,000 per month during the February-June 2009 period and moderately afterwards to roughly 3,000-4,000 in recent months totaling about 70 thousands returnees over the last 12 months.
The latest data from BB indicate that the upward trend of inflows of wage earners' remittances continued in 2009. Remittance inflows increased by 22.8 percent to USD 5533.2 million in July-December 2009 from USD 4504.7 million July-December 2008. So far, this pattern is fuelled by the repatriation of migrant workers’ savings. With the slowdown of the modernization and infrastructure building process in the Middle-Eastern countries, the reduction of new recruitments along with partial lay-offs of existing jobs are very likely to curve down the inflow of remittances in Bangladesh in the near future. This will in turn hurt the domestic demand mainly in construction, financial and telecommunications services. As most of the low skilled remittance earners are from rural areas, it is also feared that the decline in the manpower exports and inflow of remittances will affect negatively the livelihood of the rural population who is still paying a dire cost for recent domestic and international price volatility.
Figure 3: Flow of Remittances (Year-on-Year Basis)
07‐'08
08‐'08
09‐'08
10‐'08
11‐'08
12‐'08
01‐'09
02‐'09
03‐'09
04‐'09
05‐'09
06‐'09
07‐'09
08‐'09
09‐'09
10‐'09
11‐'09
12‐'09
Flow of Remitances 820.7721.9794.2648.5761.4758.0859.0784.5885.7841.0895.3919.1885.4935.2887.6900.71050.873.9
500.0
600.0
700.0
800.0
900.0
1000.0
1100.0
in m
illion
USD
Source: Central Bank of Bangladesh
3.2.3 Signs of Resilience a ter a Poor Trade Performance in FY09 f
Although the fall in the volume of both cargo handled exports and imports during the first half of FY09 has reversed in H2 FY09, the trends in the value of exports and imports remained depressed, due mainly to the drastic fall in the international as well as domestic demand.9 The latest data on the volume of Cargo handled in the Chittagong (CTG) port indicate an increase of around 32 percent during July-December 2009 against a fall of 5.3 percent in the same period of 2008. The number of exports and imports ships declined further to 163 and 177 in January 2009 respectively from 176 and 190 in January 2008.
The movements in exports earnings during H1 FY10 (July-December 2009) were quite discouraging (Figure 4). While FY09 started with about 71 percent export growth in July 2008, subsequent months faced a downward trend which culminated to a growth of 10.3 percent in June 2009. The positive growth in exports ceases from the very beginning of FY10 registering a decline of 6.8 percent in July 2009 and again a decline of 6.2 percent in H1 FY10.
9 The volume of cargo handled in Chittagong Sea Port, one of the largest of the country, covering around two-third of international trade volume is considered as an indicator of trade performance in Bangladesh.
15

Figure 4: Exports Growth (Year-on-Year Basis)
‐20
‐10
0
10
20
30
40
50
60
70
80
07‐'08
07'08‐08
'08
07'08‐09
'08
07'08‐10
'08
07'08‐11
'08
07'08‐12
'08
07'08‐01
'09
07'08‐02
'09
07'08‐03
'09
07'08‐04
'09
07'08‐05
'09
07'08‐06
'09
07'‐09
07'09‐08
'09
07'09‐09
'09
07'09‐10
'09
07'09‐11
'09
07'09‐12
'09
grow
th in
percent
Source: Central Bank of Bangladesh
The adverse impact of the global financial crisis on Bangladesh’s exports has lately been observed on the exports of readymade garment (RMG) as well. Exports of knitwear and woven garments both declined by more than 7 percent during July-December 2009 compared to the same period of 2008. In addition to a decrease of about 20 percent of RMG products prices in the international market, the volume of Utilization Declaration (UD) declined by about 15.0 percent in July 2009 and by about 7.5 percent in January 2010, resulting in about 3.1 percent overall decline in UD during July-December 2009 (Figure 5).
To keep the competitive advantage and productivity, especially in low-end RMG, efforts were made to reduce wasting. Workers were laid-off and the ones retained faced real wage decreases through longer working hours with unchanged salaries. Sub-contracting firms resorted more to part time work as a survival strategy.
With recent trends showing signs of resilience of the RMG sector in the near future, it is likely that jobs will stabilize. Data from Bangladesh Garments Manufacturers and Exporters’ Association (BGMEA) indicate that the trends in export orders (EO) jumped up significantly in H1 FY10 recording a growth of 16.3 percent in July 2009. This level of growth was maintained at 15.1 percent during July-December 2009 compared with the same period of 2008. This increase in export orders may be an indication that the worst is over. The upturn of the rate of UD will likely be reflected in an improved performance of the industry in late 2010.
Figure 5: Growth of UD and EO (year-on-year basis)
‐20.0
‐10.0
0.0
10.0
20.0
30.0
40.0
07‐'09
07‐'09‐08
‐'09
07‐'09‐09
‐'09
07‐'09‐10
‐'09
07‐'09‐11
‐'09
07‐'09‐12
‐'09
07‐'09‐01
‐'10
grow
th in
per
cent
Utilization Declaration (UD) Export Order (EO)
Source: Bangladesh Garments Manufacturers and Exporters’ Association (BGMEA)
There is a clear indication that traditional agricultural exports faced a significant downturn during the last 12 months. The latest official data from the Export Promotion Bureau (EPB) indicate that despite the reversal of the decline of jute exports, the overall exports of primary products declined by 6.0 percent with tea, leather and frozen exports declining by respectively 57.5 percent, 6.9 percent and 17.9 percent during July-December 2009.
16

It is worth mentioning that these sub-sectors were experiencing negative growth before the global economic crisis.
Overall, the impact of the global financial crisis was felt through the fall of imports, reflected in the recent trends of actual import payments and in the growth of settlements of letter of credits (LCs). Figure 6 shows that the cumulative growth of LCs settlements suffered a 3.6 percent reduction in July-December 2009 compared to the same period of 2008. This decline is attributed mainly to a decline of the imports of intermediate goods, industrial raw materials, capital machinery and petroleum products registering respectively -8.8 percent, -13.0 percent, -6.6 percent and -20.1 percent growth during the period.
However, a positive development is that the cumulative growth of LCs opening has started to increase after a significant drop, resulting in lower imports with negative impacts on import duty, investment, employment and economic growth during 2009. Reportedly, some 100’000 jobs were retrenched from the export-led sectors in 2009. a significantly lower figure compared with the 300’000 projected in 2009.
The latest figures from the Bangladesh Bank show that the cumulative growth of letter of credits (LCs) opening started the financial year 2010 with a yearly decline of 8.8 percent in July 2009 and returned to a yearly positive growth of 18.1 percent in December 2009. LCs opening data for July-December 2009 portray more than 95 percent growth in consumer goods, followed by 37.4 percent and 2.9 percent growth for capital machineries and industrial raw materials over July-December 2009. The positive impact of the growth of LCs opening will translate into actual imports growth in the coming months.
Figure 6: Growth of Settlement and Opening of LCs (Year-on-Year Basis)
‐30.0
‐20.0
‐10.0
0.0
10.0
20.0
30.0
40.0
50.0
07‐'08
07'08‐08
'08
07'08‐09
'08
07'08‐10
'08
07'08‐11
'08
07'08‐12
'08
07'08‐01
'09
07'08‐02
'09
07'08‐03
'09
07'08‐04
'09
07'08‐05
'09
07'08‐06
'09
07'‐09
07'09‐08
'09
07'09‐09
'09
07'09‐10
'09
07'09‐11
'09
07'09‐12
'09
grow
th in
percent
LCs Settlement LCs Opening
Source: Central Bank of Bangladesh
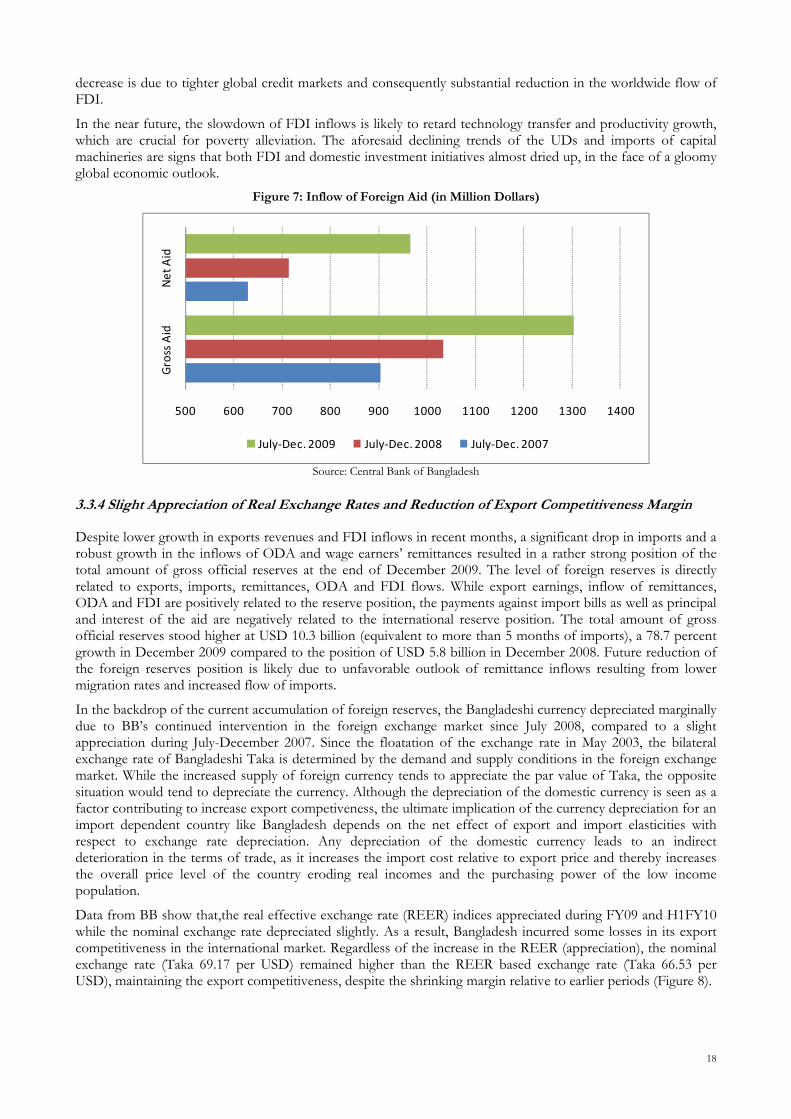
3.2.4 Aid Flows Increased and Foreign Direct Investment Flows Decreased
The total amount of gross and net Official Development Assistance (ODA) received by Bangladesh increased significantly during July-December 2009. The latest available data show that the total amount of gross and net ODA inflow to Bangladesh increased respectively by 26.3 percent and 35.1 percent (to USD 1304.1 million and USD 965.8 million) during July-December 2009 compared to the same period in 2008 (Figure 7). The period of July-December 2008 witnessed relatively lower growth in gross and net ODA inflows, negatively affecting the execution rate of foreign aid dependent infrastructure and social safety net programs in Bangladesh. Despite the improved trend in H1 FY10, the amount of ODA flowing to Bangladesh remained constrained by the low absorption capacity of the country during the last two years.
Unlike ODA flows, the amount of foreign direct investment (FDI) flow to Bangladesh decreased sharply in 2009. FDI contribution to GDP is historically low (at less than 1 percent of the GDP) due to the limited international exposure to capital markets. Indeed the non-convertible capital account restricts somehow the outflow of foreign exchange, making it difficult for the government to attract more FDI into the country. Efforts are made to create export processing zones (EPZs) which are mainly run by foreign shared joint ventures. Provisional data on the inflow of FDI stood at USD 197 million during July-December 2009, a decline of more than 67 percent compared to the amount of USD 603 million of the same period in 2008. This sharp
17
decrease is due to tighter global credit markets and consequently substantial reduction in the worldwide flow of FDI.
In the near future, the slowdown of FDI inflows is likely to retard technology transfer and productivity growth, which are crucial for poverty alleviation. The aforesaid declining trends of the UDs and imports of capital machineries are signs that both FDI and domestic investment initiatives almost dried up, in the face of a gloomy global economic outlook.
Figure 7: Inflow of Foreign Aid (in Million Dollars)
500 600 700 800 900 1000 1100 1200 1300 1400
Gross Aid
Net Aid
July‐Dec. 2009 July‐Dec. 2008 July‐Dec. 2007
Source: Central Bank of Bangladesh
3.3.4 Slight Appreciation of Real Exchange Rates and Reduction of Export Competitiveness Margin
Despite lower growth in exports revenues and FDI inflows in recent months, a significant drop in imports and a robust growth in the inflows of ODA and wage earners’ remittances resulted in a rather strong position of the total amount of gross official reserves at the end of December 2009. The level of foreign reserves is directly related to exports, imports, remittances, ODA and FDI flows. While export earnings, inflow of remittances, ODA and FDI are positively related to the reserve position, the payments against import bills as well as principal and interest of the aid are negatively related to the international reserve position. The total amount of gross official reserves stood higher at USD 10.3 billion (equivalent to more than 5 months of imports), a 78.7 percent growth in December 2009 compared to the position of USD 5.8 billion in December 2008. Future reduction of the foreign reserves position is likely due to unfavorable outlook of remittance inflows resulting from lower migration rates and increased flow of imports.
In the backdrop of the current accumulation of foreign reserves, the Bangladeshi currency depreciated marginally due to BB’s continued intervention in the foreign exchange market since July 2008, compared to a slight appreciation during July-December 2007. Since the floatation of the exchange rate in May 2003, the bilateral exchange rate of Bangladeshi Taka is determined by the demand and supply conditions in the foreign exchange market. While the increased supply of foreign currency tends to appreciate the par value of Taka, the opposite situation would tend to depreciate the currency. Although the depreciation of the domestic currency is seen as a factor contributing to increase export competiveness, the ultimate implication of the currency depreciation for an import dependent country like Bangladesh depends on the net effect of export and import elasticities with respect to exchange rate depreciation. Any depreciation of the domestic currency leads to an indirect deterioration in the terms of trade, as it increases the import cost relative to export price and thereby increases the overall price level of the country eroding real incomes and the purchasing power of the low income population.
Data from BB show that,the real effective exchange rate (REER) indices appreciated during FY09 and H1FY10 while the nominal exchange rate depreciated slightly. As a result, Bangladesh incurred some losses in its export competitiveness in the international market. Regardless of the increase in the REER (appreciation), the nominal exchange rate (Taka 69.17 per USD) remained higher than the REER based exchange rate (Taka 66.53 per USD), maintaining the export competitiveness, despite the shrinking margin relative to earlier periods (Figure 8).
18

Figure 8: Exchange Rate Movements
50.0
60.0
70.0
80.0
90.0
100.0
Jun‐05 Dec‐05 Jun‐06 Dec‐06 Jun‐07 Dec‐07 Jun‐08 Dec‐08 Jun‐09 Dec‐09
Nominal ER REER Index REER Based ER
Source: Central Bank of Bangladesh
In summary, the global financial crisis led to a substantial reduction of exports revenues, FDI inflows and import volumes over the last 12 months. The poor trade performance was somewhat compensated by a robust growth in the inflows of ODA and a slight increase of wage earners’ remittances, leading to a strong position of the total amount of gross official reserves at the end of December 2009. Government interventions to mitigate the negative impacts of the crisis were supported by an accommodative monetary policy, which contributed to overall inflation, also driven by domestic food price inflation. The next section provides insights into the actual impacts of the crisis on households’ livelihoods and food security.
4- Effects of the Global Financial Crisis on Households between March 2009 and March 2010
Five divisions were covered namely Chittagong, Dhaka, Khulna, Rajshahi and Sylhet. The same areas and livelihood groups were visited to find out how households are coping with the global financial crisis, a year after the March 2009 study. Like in March 2009, 40 FGDs were organized in both urban and rural areas, 12 with remittance earners, 8 with garment workers, 12 with workers of export-oriented agriculture (shrimp and tea estate) and 8 control groups made up with casual workers not involved in the former activities.
4.1. Changes in L velihoods and Income Sources i
In general, households derive a greater share of their incomes from their first main livelihoods, though the contribution declined compared to March 2009. As shown in table 5, garment workers derive 2/3 of their income from working in garment factories, followed by daily labour and petty business. Daily labourers derive about 50 percent of their incomes from daily labour, followed by agriculture farming and petty businesses. Tea estate workers derive 60 percent of their incomes from permanent jobs in tea estates, followed by casual labour and rickshaw pulling.
Table 5: Main Income Sources and Changes in Livelihoods from March 2009 to March 2010
Source 1Most frenquently
reported share (%) Source 2Most frenquently
reported share (%) Source 3Most frenquently
reported share (%)
Remittance earners Remittances (1/2 FGDs)
60 Remittances (1/3 FGDs)
20-30 Remittances (1/3 FGDs)
20 From migration to agriculture, casual labor or petty business
Garment workers Garment (2/3 FGDs)
75 Casual labour (1/2 FGDs)
20 Petty business (1/2 FGDs)
10 From garment to casual labor and petty business
Shrimp farmers Daily labor (1/2 FGDs)
80 Shrimp farming (2/3 FGDs)
30 Petty business (1/2 FGDs)
2-5 From shrimp farming to agriculture casual labor
Daily labourers Daily labor (All FGDs)
50 Agriculture (1/2 FGDs)
15 Petty business (1/2 FGDs)
15 From day labour to domestic migrants to petty business
Tea estate workers Tea estate (All FGDs)
60 Casual labour (2/3 FGDs)
25 Rickshaw pulling (1/2)
10 From agriculture to casual labour and rickshaw pulling
Main income sources and average contribution
LivelihoodsMain changes in livelihoods from March 2009 to March
2010
Remittance earners derive a smaller share of their incomes from their first livelihoods compared to March 2009. As a first source of income, less than half of the FGDs reported that remittances contribute to 60 percent of their incomes, compared to 80 percent a year ago. As a first source of income, the contribution of remittances
19

has dropped from 80 percent in March 2009 to 60 percent in March 2010, according to the majority of remittance earning focus groups. As a second source of income, remittances contribute to just about 20 percent. The decline of the contribution of remittances shows an extreme feature which contrasts with the stable level of remittances at macro-level because the surveyed areas and households of Sylhet and Chittagong are the most reliant on remittances. The deep decline of remittances has become a source of increased vulnerability for this category of households (see section 4.3 below).
Shrimp farmers derive also more of their incomes from daily labour (80 percent) than shrimp farming (30 percent). This finding is in line with the collapse of the shrimp sector mentioned above in the macro-economic performance update. Indeed the shrimp sector faced a triple shock over the last two years. First, a shrimp disease which negatively impacted demand from the European countries; second, the global financial crisis resulting in a reduction in both exports volumes and prices; third, the destruction of the embankment and the increased salinity of the shrimp farms.
The magnitude of the stress on shrimp farmers is illustrated in box 1.
Box 1
When the Collapse of Incomes Becomes Synonymous of a Descent into Hell: The Story of I.S, a Shrimp Farmer fromVattagram Village in Bagerhat District
Gloom and tensed in appearance, I. S., 30, is the head of a household of four members. He’s got two children- one girl of eight years and another boy of six years who are enrolled in primary school which is totally free of charge. I.S. lost his parents at the age of five.
He never got a chance to go to school and got involved in wage earning from his childhood as an agriculture wage labourer and rickshaw puller. With the savings (Tk. 30,000) he made from his hard work and a loan, he started shrimp farming in mid-2008. He leased 22 decimal of land and invested Tk. 430,000 in land/pond preparation, collecting and introducing fingerlings and feeding.
When the global financial crisis stroke, shrimp exports decreased and virtually stopped since mid-2009. The situation worsened further when the European Union (EU) sanctioned shrimp imports from Bangladesh because of the presence of an intolerable high rate of a deadly chemical namely Nitrofuron found in shrimps.
As a result, he lost almost all his investment in shrimp farming. I. S. said this situation seems to be a bolt from blue but he is trying hard to minimize the loss. He managed to collect Tk 146,000 by selling export quality and local varieties of shrimp on local markets but lost Tk. 23,000. He has abandoned his pond.
He is now pulling rickshaw again in Khulna city to meet his family’s daily basic needs and reimburse his debt. He earns Tk. 140 a day of which Tk. 30 go into paying the rickshaw rental and around Tk. 80 for food. He can barely save Tk. 30 a day which is far from being enough to pay back the weekly installment of Tk. 375. “I don’t know how I will repay the loan!”, he says.
Since the assessment of March 2009, there has been evidence that livelihood changes occurred in all the surveyed areas, at the expense of sustainable livelihoods. When asked whether households have changed activities in the past 12 months, remittance earners indicate that migrant returnees are absorbed by agriculture, casual labour or petty businesses. According to all the remittance earning focus groups interviewed, the main reasons for the livelihood changes are job losses abroad and visa cancellations. Focus groups from the garment sector indicate that garment workers tend to move to casual labour mainly because of lay-offs and reduced incomes. Reportedly, shrimp farmers have moved to daily labour because of shrimp price decreases and collapse of shrimp exports. Meanwhile, daily labourers tend to migrate in other areas - including cities - in response to increased competition on the labour market, reduced job opportunities or to seize seasonal job opportunities. 4.2. Changes in Employment and Wage Patterns
Unlike in March 2009, focus groups reported job losses in all the livelihoods targeted by this follow-up assessment, i.e. shrimp farmers, garment workers, remittances earners, tea estate workers and casual labourers (Table 6). The most frequently reported estimate of unemployment increase within a year (March 2009-March 2010) is 10-15 percent. This estimate is in line with the 10 percent estimate reported by focus groups in March 2009. In general, job cuts and reduced job opportunities are reported as the main reasons for the increase of unemployment rate. Interestingly, male focus groups from the garment sector reported significant increases of unemployment within a year: from 20-30 percent in Dhaka to 50 percent in Chittagong. Meanwhile, female focus groups reported small increases in unemployment rates (less than 5 percent) indicating male garment workers are likely worst hit by the global financial crisis than female garment workers. However, it is worth noting that the
20

garment sector is female labour intensive and female workers are generally paid less than men in Bangladesh. This pattern can therefore be interpreted as a cost saving strategy adopted by garment factories to cope with the negative impacts of the global financial crisis on their activities.
Newly unemployed workers from migration, the garment sector and tea estates are partially absorbed by casual labour market and self-employment, while shrimp farmers and casual labourers continue to face job scarcity. Focus groups of remittance earners, garment workers and tea estate workers reported an increase in irregular wage labour as well as self-employment (Table 6). Reportedly, households engage increasingly in self-employment and irregular wage labour activities to diversify their incomes and compensate the reduction of incomes due to job losses faced by family members. It is noticeable from table 6 that casual labour focus groups report a decline in irregular wage labour over the last 12 months. This is an indication of increased competition on casual labour market. Both casual labourers and shrimp farmers reported a decline in self-employment. Shrimp farmers who are either self-employed or casual labourers on shrimp farms faced two consecutive years of poor performance of the sector as mentioned above. Casual labourers face more competition in the face of increased job losses in other sectors.
Table 6: Changes in Employment Patterns from March 2009 to March 2010
Change Main reasons Change Main reasons Change Main reasons Change* Main reasons
Remittance earners N/A N/A Increased (1/2 FGDs)
Migrant returnees engaged in casual labour
Increased (2/3 FGDs)
Income diversification
Increased by 10-20% (All FGDs)
Job losses in migration, agriculture and petty business
Garment workers Decreased (2/3 FGDs)
Lay-offs Increased (2/3 FGDs)
Reduced activity in garment sector
Increased (1/2 FGDs)
Income diversification
Increased by 5% (1/3 FGDs)
Job losses in garment sector
Shrimp farmersDecreased (1/3 FGDs)
Destruction of embankment and collapse of exports
Decreased (1/2 FGDs)
Job losses in shrimp farming and related casual labour
Decreased (2/3 FGDs)
Destruction of embankment and collapse of exports
Increased by 15-30% (1/2 FGDs)
Job losses in shrimp farming and related daily labour
Daily labourers N/A N/A Decreased (All FGDs)
Reduced job opportunities
Decreased (1/3 FGDs)
Job losses in petty business
Increased by 15% (All FGDs)
Lack of job opportunities and increased competition
Tea estate workers Unchanged (All FGDs)
Permanent workers Increased (All FGDs)
More family members involved in income generation
Increased (1/3 FGDs)
Income diversification
Increased (1/2 FGDs)
Job losses in agriculture and daily labour
(*) The percentage increases reported correspond to the most frequently reported figures
UnemploymentLivelihoods Regular salaried employment Irregular wage labour Self-employment
Reportedly, regular salaried jobs in tea estates and garment sectors enjoyed an increase of wages in 2009, an alignment which followed the government’s new pay scale. According to focus group discussants, regular salaried employees of the estates benefitted from a 50 percent wage increase. Irregular wage labourers of the tea estates were also granted a daily rate increase. Unlike for the tea estate workers, the salary increases for regular employees of the garment sector were achieved at the expense of irregular wage labourers who faced a decrease of about 25 percent in their daily rates. This is an indication of another cost saving strategy adopted in the garment sector in response to the global financial crisis. Shrimp farmers and labourers reported a general decrease in their wages during the last 12 months.
4.3. Changes in Migration Patterns and Remittances
The number of households receiving remittances remains high in Bangladesh, in particular in Sylhet and Chittagong divisions, though households are currently deriving a smaller share of their incomes from remittances as opposed to 12 months ago. The March 2009 assessment found that the proportion of households receiving remittances could reach 75 percent in Sylhet and between 25-50 percent in Chittagong divisions. When asked to estimate the percentage of migrant returnees, remittance earners of Sylhet division reported that 10-20 percent of their community migrants have returned home, with male focus groups on the upper end of the estimates. This estimate has remained unchanged ever since.
In the last 12 months, both the frequency and amount of remittances have shown a strong negative trend, in relation with the global financial crisis. Remittance dependent focus group discussants estimate the fall in frequency and amount of remittances received by households between 1/3 and 1/2. The main reasons of the decrease in frequency and amount of remittances are job losses and salary decreases abroad.
Compared to March 2009, focus group discussants described a slightly different pattern of domestic migration. Domestic migration seems to have increased according to daily labourers and tea estate casual labourers mainly because of new seasonal jobs and income opportunities such as construction and infrastructure works. In
21

comparison with table 6, the decrease of irregular job opportunities reported by casual laborers is likely to have contributed to increased seasonal migration reported in table 7.
Table 7: Changes in Migration and Remittance Patterns from March 2009 to March 2010
Change* Main reasons Change* Main reasons Frequency Amount
Remittance earners Decreased (10%) (All FGDs)
Job losses and salary decreases
Decreased (1/2 FGDs)
Job losses and low salaries
Decreased (50%) (2/3 FGDs)
Decreased (40%) (All FGDs)
Garment workers Decreased (1/3 FGDs)
Job losses Unchanged (All FGDs)
Situation not better elsewhere
Decreased (33%) (1/6 FGDs)
Decreased (50%) (1/6 FGDs)
Shrimp farmers N/A N/A Increased (2/3 FGDs) Seasonal migration for job opportunities
N/A N/A
Daily labourers Decreased (33%) (1/6 FGDs)
Job losses Increased (2/3 FGDs) Seasonal migration for job opportunities
Decreased (1/2 FGDs)
Decreased (1/2 FGDs)
Tea estate workers Unchanged (All FGDs)
Not used to migrating abroad
Increased (1/6 FGDs) Income diversification N/A N/A
(*) The percentage figures in brackets represent the most frequently reported percentage change
Changes in RemittancesLivelihoods
Migration Abroad Domestic Migration
The importance of remittances cannot be overstated given their role as a major social safety net. A decline in remittances can easily become a major source of vulnerability in some areas such as Sylhet (see box 2). Remittances allow families to meet their basic needs; open up opportunities for investing in education, health care, etc.; reduce constraints in the family budget to invest in business or to save; are a kind of emergency resource; provide a social security for the elderly.
Box 2.
How Can the Job Loss Become a Major Source of Vulnerability for an Entire Household? The Story of J.A., a Migrant Worker from Ramda Village in Sylhet District
J. A., 23, is the second child among 11 children. He used to be the second income earner of his family together with his father. His father has been working in Kuwait since 1994, as a wielder. In 2005, J. A. migrated to Dubai to work with his relatives in embroidery. To cover his family needs, J. A. used to remit Tk 5,000-10,000/month, alternating with his father. His father used to send Tk. 10,000/month. From 2005 to 2008, his average monthly income almost doubled from Tk. 5,000 to 8,000-10,000/month.
When the global economic crisis hit Dubai, his income collapsed by 50 percent in February 2009. With such a decline, he could hardly manage food and rental costs without depleting his savings. He finally stopped sending money back home. He struggled to stay but as the situation continued to worsen in Dubai, he returned home in March 2010, almost bankrupt. Back home he has not yet been able to find a new job and he cannot start any self-employment activity as he his saving is exhausted and in the absence of credit facility.
Now that he has returned home, his father is having troubles in meeting the needs of the family alone. The joint financing was crucial in meeting the minimum requirements such as food and healthcare costs but also the education costs of his four younger brothers. The curtailing of remittances is already hitting hard the family. One of his brothers has dropped out of school to minimize family expenses. J. A. added: “it is better to avoid being sick in the current circumstances”. The only perspective J.A. sees in the short term as a solution to the difficulties encountered by his family, is to take a loan to go back to Dubai. But he is not optimistic as he is aware of current restrictions imposed on visa acquisition.
4.4. Changes in Expenditures and Food Consumption
The share of expenditure on food in total expenditures increased to about 60 percent, from 57 percent in March 2009. This increase is in line with the overall increase in food inflation reported in the macro-economic update. Casual labourers reported relatively higher food expenditure increases (up to 10 percent) compared to other livelihood groups (Table 8). This may be due to the fact that they consistently reported reduced purchasing power (price increases combined with income decreases) as the main reasons for an increased budget share of food (see section 4.2).
In response to food price increases and income losses, food consumption is being adjusted to the detriment of protein sources and diaries. About 2/3 of the focus groups reported a decrease in the consumption of meat, fish, eggs, milk and fruits by 25-50 percent during the last 12 months. The concerned focus groups reported an increase in prices of meat, fish and fruits, in addition to the rice price increase. Consumption of vegetables remained stable due to increased seasonal availability, resulting in price reduction. The tendency is to maintain the quantity of cereal consumed while foregoing quality.
FGDs were also asked to provide their perception of changes in other expenditure categories:
22

The most vulnerable livelihood groups, i.e. remittance earners, daily labourers and shrimp farmers, reported a significant decrease in the share of expenses on education in total expenditures, resulting in an increase in school attendance rates during the last 12 months. The most frequently reported decrease in the last 12 months is about 20 percent. This reversed trend from March 2009 is due to the improved coverage of the totally free primary schooling program and the further expansion of the partially free secondary schooling program by the government and its partners. The impact of this program is reflected in an increase of the primary school attendance rate up to 10 percent as reported by the majority of the focus groups. About 2/3 of the focus groups reported also an increase of the secondary school attendance rate by 10-20 percent during the last 12 months. To the contrary, tea estate workers reported an increase in the share of education in total expenses. However, this is not reflected in a decrease in school attendance rates as the increase of the share of education in total expenditures is mainly due to an increase in the number of children enrolled into school.
There is evidence that the share of health expenditure on total expenditures has increased during the last 12 months, except for shrimp farmers and tea estate workers. Overall, an increase in healthcare costs is reported by remittance earners, garment workers and daily labourers (table 8). Tea estate workers reported a decrease due to increased subsidized provision of health care facilities and salary increases by the companies and increased sensitization on health and hygiene by NGOs. To the contrary, shrimp farmers reported a decrease due to reduced purchasing power and increased healthcare costs. Overall, the perceived increased healthcare costs is reflected by a reduction of access to healthcare services as reported by more than half of the focus groups interviewed. The concerned focus groups also mentioned that the health status of households has consequently deteriorated over the last 12 months.
According to the majority of the livelihood groups interviewed, transport and utility costs have increased by 25-50 percent during the last 12 months. Urban focus groups, in particular garment workers, casual laborers and remittance earners reported more often such increases. Moreover, all the garment workers’ focus groups of Dhaka and Chittagong cities reported an increase of the share of rents in total expenditures up to 10 percent during the last 12 months.
It is interesting to note that focus group discussants are now reporting that the share of debt in total expenditures has either remained unchanged or decreased during the last 12 months, except shrimp farmers. The overall reduction of the share of debt in total expenditures was achieved through substantial reduction of other budget lines as shown in table 8. Another reason is that households already indebted last year could no longer
have access to new loans until the reimbursement of old debts is completed. Shrimp farmers are more indebted than last year as they lost their livelihoods and incomes over two consecutive years (2008-2009).
Table 8: Perceived Changes in Expenditure Patterns from March 2009 to March 2010
Remittance earners Garment workers Shrimp farmers Daily laborers Tea estate workersPerception Increased (2/3 FGDs) Increased (2/3 FGDs) Decreased (1/2 FGDs) Increased (2/3 FGDs) Decreased (All FGDs)Most frequently reported % change
10% 10% -20-33% 50% -40%
Perception Decreased (1/2 FGDs) Decreased (1/2 FGDs) Decreased (2/3 FGDs) Decreased (2/3 FGDs) Increased (All FGDs)Most frequently reported % change
-20% -50% -20% -20% 33%
Perception Increased (2/3 FGDs) Increased (1/2 FGDs) Increased (2/3 FGDs) Increased (2/3 FGDs) Unchanged (All FGDs)Most frequently reported % change
50% 20% 50% 50% 0%
Perception Increased (All FGDs) Increased (All FGDs) Increased (All FGDs) Increased (All FGDs) Increased (All FGDs)Most frequently reported % change
5% 3% 5% 10% 1%
Perception Unchanged (2/3 FGDs) Unchanged (2/3 FGDs) Increased (1/2 FGDs) Decreased (1/3 FGDs) Decreased (2/3 FGDs)Most frequently reported % change
0% 0% 40% -20% -50%
Perception Unchanged (All FGDs) Increased (All FGDs) Unchanged (All FGDs) Unchanged (5/6 FGDs) Unchanged (All FGDs)Most frequently reported % change
0% 10% 0% 0% 0%
Perception Increased (2/3 FGDs) Increased (2/3 FGDs) Unchanged (All FGDs) Increased (2/3 FGDs) Increased (All FGDs)Most frequently reported % change
25-50% 25% 0% 15% 50%
Perception Decreased (All FGDs) Decreased (All FGDs) Decreased (All FGDs) Decreased (2/3 FGDs) Decreased (1/3 FGDs)Most frequently reported % change
-75% -75% -50-100% -75% -50%
Rent
Utilities
Others
Education
Transport
Food
Debt
Livelihood GroupsExpenditure Type
Health
23

4.5. Coping Strategies and Priority Needs
In response to the challenges they face (i.e. price increases and income losses) the majority of focus groups said households cope by cutting down consumption of protein sources, diaries and fruits. They also diversify their income sources by involving more family members, in particular women and children, in income earning activities (mainly casual labour). One in eight FGDs reported that children are being involved in income generation activities. As shown above, reduction of health care expenses is another negative coping mechanism adopted by households, in particular those involved in shrimp farming.
When asked to rank their needs by order of priority, the following were expressed by the focus groups (Table 9): employment and income generation activities were mentioned by the majority of FGDs as a priority, except tea estate workers. It is worth noting that the majority of tea estate workers reported that their permanent jobs have not changed (see section 4.2 above). Health, water and sanitation are mentioned by all the livelihood groups either as a first priority (for tea workers) or a second priority for the other livelihoods. It is also interesting to note that among those mentioning water and sanitation as a priority, the majority are urban focus groups. Infrastructure (including irrigation systems, roads and utilities) is generally mentioned as a third priority. Price subsidies are mentioned by urban garment workers and daily labourers as part of their priorities.
Table 9: Priority Needs Reported by the Focus Groups
First Second Third
Remittance earners Employment generation activities (2/3 FGDs)
Access to credit (1/2 FGDs)
Health and WatSan (1/3 FGDs)
Garment workersEmployment generation
activities and price subsidies (All FGDs)
Health and WatSan (1/2 FGDs)
Access to electricity and gas (1/3 FGDs)
Shrimp farmers Employment generation activities (All FGDs)
Health and WatSan (All FGDs)
Road access (All FGDs)
Daily labourers Employment generation activities (All FGDs)
Health and WatSan (2/3 FGDs)
Price subsidies (1/3 FGDs)
Tea estate workers Health and WatSan (All FGDs)
Employment generation activities (2/3 FGDs)
Education (1/2 FGDs)
LivelihoodsPriority Needs
5- Perspectives and Ongoing Interventions
5.1. Future Outlook
Although Bangladesh economy has circumvented major negative impact of the recent global financial crisis, the lagged effects of the crisis are still dragging the economy with significant downside risks related to the external sector in the coming months. Given the overall stake of total trade and remittances as a ratio of GDP (around 54 percent), the FY10 growth rate of the Bangladesh economy is likely to remain stable or decrease slightly, compared to FY09. Assuming the resilience of the world economy from the downturn triggered by the global financial crisis will hold pace or strengthen further, as expected by the IMF, the real GDP in Bangladesh is projected to grow by 5.5-6.0 in FY10, compared to 5.9 percent growth in FY09 (MPS, January 2010).
In the backdrop of the deceleration of export growth and the inflow of remittances, the current account as well as the overall balance is likely to deteriorate further from the current surplus position. This pattern is likely to deplete the current position of foreign reserves. The contraction of foreign reserves is likely to further depreciate the exchange rate of the Taka (Tk.) against major currencies. Domestic currency depreciation could lead to some losses of real income and purchasing power through inflation driven by imported goods.
As of March 2010, there are around 3.5 million people working in more than 5 thousands factories in the RMG sector alone. According to a preliminary estimate, around 20-30 percent of the factories do not have any direct foreign customer. They just survive as sub-contractors of factories with international customers. As the direct orders from abroad are showing increasing trends in the form of increased UD, RMG exports are likely to increase in the near future. As a result, it is anticipated that job losses in the RMG sector will curve down from the second half of 2010.
The expected increase of government spending (in the short-term) in terms of rescue package including tax breaks, cash subsidies and food rationing programs to safeguard the external sector and socially vulnerable
24

people, could lead to further monetary financing of increased fiscal deficits beyond the fiscal deficit target of 5.0 percent of the GDP in FY10. Beside, the central Bank of Bangladesh is also following an accommodative monetary policy stance in the form of higher and easy credit flow to the economy. As a result, increased inflationary pressure triggered by domestic policies is already in the scene with stronger stress on the food items, raising concerns that another food price crisis is likely to come, with its consequences on the most vulnerable households. 5.2. Ongoing Response Interventions
The Government of Bangladesh and its partners continue to maintain and expand an extensive social safety net system designed to address mainly transient food insecurity - stemming from adverse shocks and setbacks - and support social sectors. Substantial effort has been made during the last 12 months to improve the coverage of the provision of school books to both primary and secondary school students. Public food stocks are maintained and used for both ongoing food-based development programs and for emergency purposes during periods of acute or transitory food insecurity10. Although the Public Food Distribution System (PFDS) has numerous programs or channels through which food assistance is provided; the bulk of assistance, which covers more than 30 million people, is provided via several channels such as Open Market Sales (OMS), Vulnerable Group Development (VGD), Vulnerable Group Feeding (VGF), Food for Work (FFW), Test Relief (TR), Gratuitous Relief (GR), Food Assistance for CHT Area and Cash for Work.
In order to safeguard the income losses due to the global financial crisis, the scaling up and extension of the open market sale (OMS) program decided in March 2009 is still ongoing. The OMS is expected to provide subsidized rice to all sorts of poor people regardless of their working status.
Besides partnering with the government and partners on the above listed social safety net programs such as the VGD program, WFP launched a cash transfer program in 2009, to mitigate the effects of the combined global food, fuel and financial crises on the most affected households.
At the macro-economic level, the government of Bangladesh continues to monitor the day-to-day developments of the major economic indicators, through a broad-based national committee ('27-member taskforce') established in March 2009. The government adopted the first stimulus package in April 2009 to support the export of non-RMG products namely, agriculture, exports, power, and social safety net programs. After the April 2009 stimulus package, the government introduced measures to boost domestic demand and increase supply-side competitiveness, through the FY10 budget in June 2009, including a new salary scale which increased the base salary of workers. The government also introduced a new public–private partnership scheme to encourage private participation in infrastructure financing through the FY10 budget.
In view of safeguarding Bangladesh's key exports such as readymade garments, jute, leather, and frozen foods, a stimulus/rescue package including some form of incentives through tax breaks, interest rate cuts and cash subsidies have also been announced with some conditionalities to avoid misappropriation of the money allocated for rescue purposes. Besides, in order to protect the loss of future remittance flows, the government of Bangladesh is taking various steps such as facilitating faster and easy transfer of remittances through official channels, finding new labour export markets, and negotiating with migrant workers’ host countries to preserve jobs.
The central bank (BB) is further accompanying government efforts by easing the lending capacity of commercial banks. The interest rates for the repo as well as reverse repo were slashed substantially to 4.5 percent and 2.5 percent respectively in December 2009 from 8.5 percent and 6.5 percent in September 2009. In addition to the imposition of lending rate cap on all types of loans except credit card and consumer loans at 13 percent to offset the fallout of global meltdown, there are significant cuts of interest rates for loans in some priority sectors such as agriculture and small and medium-size enterprises. BB has also formulated an Annual Agricultural/Rural Credit Policy and Program (AARCPP) for the current fiscal year 2010 with a record disbursement target of around Tk. 115 billion. This policy and program is expected to expand agricultural production fisheries, livestock and employment generating activities by increasing the flow of credit to the agricultural/ rural sector. By forming a Forex Investment Committee to monitor and manage the currency composition of foreign exchange reserves, BB avoided major losses through the management of currency composition or withdrawing its investment from international banks which were perceived to be at risk during the global financial crisis.
10 The PFDS is the Government’s main mechanism for addressing household level food access shortfalls.
25

6- Conclusions and Recommendations
The extent of the impact of the global financial crisis on the domestic economy remained partly under control mainly due to timely interventions of the government and its partners. However, the magnitude of the contraction of outmigration, the number of returnee migrants, the scope of job losses in export-led sectors such as the garment and shrimp sectors, underscores the urgent need for job creation in services, manufacturing and agriculture sectors to mitigate further adverse impacts of the crisis on households’ livelihoods and food security. Additional efforts can be made to:
• Further improve and expand the health and nutrition care coverage to the most vulnerable households such as casual labourers, shrimp farmers and remittance earners.
• Accelerate the implementation of the Annual Development Plan (ADP) in investing more in labour intensive income generating activities (e.g. basic infrastructure, water supply, sanitation, rural roads and electricity) to mitigate the impacts of job losses in economic sectors and the downturn of the export of migrants.
• Accelerate investment to increase agricultural productivity to face the increasing population pressure on arable land. Supporting productivity growth in food and cash crop production, fish/shrimp farming and livestock rearing is expected to partly absorb migrant returnees and less-skilled domestic workers who have lost their jobs in the face of the financial crisis. The AARCPP initiative of BB is a step in the right direction, assuming it is sustained. It is expected to increase endowment of households in productive assets – both physical as well as financial (microcredit) capital.
• Build skills of migrant workers to reduce their vulnerability to job losses abroad. While exploring new destinations for migrant workers, there is a general sense in the country that further effort is required to strengthen the skills of candidates for migration. This is seen as a means to increase the likelihood of protecting jobs abroad and entering a new era of quality migration in the aftermath of the global financial crisis.
• Establish a food security and market monitoring system, building on existing systems that monitor remittances, out-migration flows, flows of returnees, less-skilled wage rates in nonfarm and farm activities, staple food, cash and livestock prices, nutrition indicators, etc. The current follow-up assessment was undertaken at a time when one more episode of high (double digit) food price inflation is threatening the living conditions of vulnerable households who have already suffered enough due to the previous episode of price hikes in 2007-08 followed by the second round impact of the global financial crisis in 2008-09.
References:
1. 22 April 2006, Golden Tulip (Bel Air Hotel), The Hague. 2. Asian Development Bank, Bangladesh Quarterly Economic Update, December 2008. 3. Bangladesh Bank, Annual Reports (Various Issues). 4. Bangladesh Bank, Bangladesh Bank Quarterly (Various Issues). 5. Bangladesh Bank, Monetary Policy Review and Financial Sector Review (Various Issues). 6. Bangladesh Bank, Monetary Policy Statement (MPS, January 2010). 7. Bangladesh Bank, Navigating the Global Financial Storm: Challenges for Bangladesh, Policy Paper Series 0903:
November 2008. 8. Bangladesh Bank, Recent Employment Situation and Labour Market Developments in Bangladesh, Policy Paper
Series 0807: June 2008. 9. De Bruyn T. (2006): “Dynamics of Remittance Utilization in Bangladesh”, Forum on “Remittances and
Expatriates: Development in Bangladesh”, organised by the Bangladesh Support Group (BASUG), 10. Eurostat, Trade Data Online, 2009, available in the website: ec.europa.eu/eurostat. 11. International Monetary Fund, Article IV Consultation, Country Report No. 334, October 2008. 12. International Monetary Fund, IMF Survey, January 2009. 13. Ministry of Finance, Economic Review (Various issues). 14. Rahman M., K. G. Moazzem and S. S. Hossain, Impact of the Global Financial Crisis on the Employment and
Labour Market of Bangladesh, a Preliminary Assessment, Paper 80, CPD in collabouration with ILO, Dhaka. 15. UNCTAD, Assessing the impact of the current financial and economic crisis on global FDI flows, January 2009.
26

16. WFP, UNICEF, IPHN, Impacts of Recent Shocks on Food Security and Nutrition in Bangladesh, Joint Assessment, Dhaka, March 2009.
17. World Bank, Global Financial Crisis: Implications for Bangladesh, (preliminary draft), October 2008, Dhaka: Bangladesh Resident Mission, World Bank.
18. World Bank, Poverty Assessment for Bangladesh: Creating Opportunities and Bridging the East-West Divide, November 2008, Bangladesh Development Series, Paper No. 26, Dhaka: Bangladesh Resident Mission, World Bank.
19. World Bank, The Global Economic Crisis: Assessing Vulnerability with a Poverty Lens, 2009, Washington, D.C.
27

Annexes
28

Annex 1. Selected Macro-Economic Performance Indicators
FY06 FY07 FY08 FY09 FY10 (Jul-Dec.)
Real Economy
Real GDP 6.63 6.43 6.19 5.88
5.5 (MTMF)* 5.5‐6.0 (BB)* 5.2 (ADB)* 5.5
(WB)*
Quantum index of manufacturing output 16.30 11.70 7.80 5.50 ‐‐ Cargo handled (export + import) in the port 7.01 7.32 3.35 5.27 23.50
GDP deflator 5.17 6.79 8.78 6.38 5.80 (MTMF)* CPI (average) 7.16 7.20 9.94 6.66
CPI (point to point) 7.54 9.20 10.04 2.25Money and Credit Domestic credit 20.32 14.85 20.95 16.66 13.71 (Dec.)
Private sector credit from all banks 18.12 15.01 24.94 15.47 19.15 (Dec.)Broad money (M2) 19.29 17.07 17.63 18.94 20.67 (Dec.)
Balance of Payments Exports 21.45 15.76 15.70 10.12 ‐6.20Imports 12.06 16.62 25.63 4.16 ‐5.70Remittances 24.78 24.51 32.38 22.40 22.89
Gross domestic investment 24.65 24.46 24.21 24.18 -- Gross domestic savings 20.25 20.35 20.31 20.02 -- Budget deficit 3.24 3.58 4.08 3.57 5.00 Total revenue 10.79 10.47 10.93 11.18 11.57
Tax 8.70 8.31 9.10 8.96 9.31Nontax 2.09 2.16 1.83 2.22 2.26
Total expenditure 14.03 14.05 15.01 14.75 16.57Current expenditure 7.99 8.28 9.23 10.74 11.25Annual Development Program 5.20 4.60 4.20 3.70 4.44
Financing (net) 3.24 3.58 4.08 3.57 5.00Domestic financing 2.02 1.99 2.88 2.43 2.99
Banking System 1.36 1.06 2.14 1.71 2.44Non-bank 0.66 0.93 0.74 0.72 0.55
Foreign financing 1.22 1.59 1.20 1.14 2.01 External current account balance 1.33 1.39 0.85 0.98 --Exchange Rate Nominal (Taka per USD) 69.08 69.03 68.60 69.05 69.17 REER based exchange rate 57.96 59.75 59.01 63.68 66.53 REER Index (base FY01=100) 83.90 86.55 86.02 92.23 96.18
Gross official reserves 3483.80 5077.20 6148.80 7471.00 10344.75In term of import months 2.84 3.55 3.41 3.98 5.76Foreign aid 1567.64 1624.62 1956.70 1664.03 1304.1
Source: Bangladesh Bank, Ministry of Finance and Bangladesh Bureau of Statistics.Notes: FY=Financial Year (July-June), *=Target/Projection/Estimate, and -- = not available.
As a percent of GDP
Growth (in percent)
(in million of U.S. dollars)
29

Annex 2. Sample Sites for Focus Group Discuss ons i
Division District Upazila Union No. FGD
Remittance earners Sylhet Sylhet Biswanath Dashghar 2 Sylhet Sylhet Bianibazar Alinagar 2 Sylhet Comilla Chauddagram Kashinagar 2 Sylhet Noakhali Noakhali Sadar Paurashava 2 Sylhet Chandpur Chandpur Sadar Paurashava 2 Sylhet Maulvibazar Maulvibazar sadar Paurashava 2 Subtotal 12
Garment workers
Dhaka Dhaka Dhaka Metro Slums 2
Dhaka Dhaka Savar Amin bazar 2
Dhaka Gazipur Gazipur sadar Paurashana 2 Chittagong Chittagong (Ctg) Ctg Metro Slums 2 Subtotal 8
Export oriented agriculture labourers (shrimp, tea estate)
Khulna Satkhira Assasuni (shrimp) Sobhnali 2 Khulna Satkhira Shyamnagar (shrimp) Padma Pukur 4 Khulna Bagerhat Fakirhat (shrimp) Lakhpur 2 Sylhet Maulvibazar Srimangal (Tea) Kalighat 2 Sylhet Maulvibazar Srimangal (Tea) Rajghat 2 Sylhet Maulvibazar Kulaura (Tea) Baramchal 2 Subtotal 12
Control group rural (casual labour)
Rajshahi Gaibandha Sadullapur Naldanga 2 Rajshahi Panchagarh Debganj Tepriganj 2 Subtotal 4
Control group urban (casual labour)
Rajshahi Rajshahi R. Sadar Rajshahi Metro 2 Khulna Khulna K. Sadar Khulna Metro 2 Subtotal 4 Total FGDs 18 20 40
30

Annex 3. Checklist for Focus Group D scussion i
1. Identification
Date Gender group
Province Name of moderator
District Name of note-taker
Village Name of organizer
City cluster Name of supervisor
Number of participants Name of field report writer Introduction We are here today to hear from you about the living situation in your community, what people are doing for their living, what difficulties they are facing and how they are managing. [ WHERE THIS IS THE CASE:] We have visited you already last year (March 2009) and are coming back to enquire about changes in the situation since then] In particular, we are interested to hear about changes that have occurred during the past year, that is between March 2009 and now (February 2010). [ IN OTHER CASES:] We are particularly interested to hear about changes that have occurred during the past year, that is, between March 2009 and now (February 2010). The assessment is conducted by the World Food Program with support from MITRA. Your community was selected among several others to provide an overview of the current living situation in Bangladesh. The information you provide us today will assist decision-makers to have a better understanding of the situation and to identify practical steps to help address some of the issues and difficulties. Participation is voluntary but we would like to encourage you to be present throughout the entire discussion. The discussion will take about two hours. Everybody should get equal chance to speak and nobody should dominate the discussion. Everybody should be allowed to express their opinions and share ideas openly w thout being interrupted o judged by others. Thank you in advance for your participation and contributions. i r 2. Profile of participants (up to 8-10 participants)
First name Main occupation Is the head of household a man or woman?
How many people at total live in the household?
(1)
(2)
(3)
(4)
(5)
(6)
(7)
(8)
(9)
(10)
3. Changes in main livelihood groups
How do people [in this village/city neighborhood] earn a living?
• Rank in order of importance based on approximate proportions of people or families involved • Describe briefly the nature of the occupations now and a year ago. Explain why there is a change, if any Rank Main occupations now (early 2010) Main occupations a year ago (early 2009)
(1)
(2)
(3)
(4)
(5)
31

4. Changes in migration and remittances compared to one year ago
Changes in migration and perspectives
(1) Households with migrants who work seasonally outside of the country
• Comparing now (early 2010) with one year ago (early 2009), have there been changes in the number of households having migrants who work abroad? If yes, why?
• What do you think will be the possibilities for migration abroad in the coming year?
(2) Households with migrants who work seasonally in other villages or cities in Bangladesh?
• Comparing now (early 2010) with one year ago (early 2009), have there been changes in the number of households having migrants who work in other villages or towns in Bangladesh? If yes, why?
• What do you think will be the possibilities for migration within Bangladesh in the coming year?
(3) Households who receive remittances
• Comparing now (early 2010) with one year ago (early 2009), has the frequency of receipt of remittances changed, for households who receive them?
• Comparing now (early 2010) with one year ago (early 2009), has the average amount of remittances received by households changed?
• What do you think will be the possibilities for receiving remittances in the coming year?
5. Changes in employment compared to one year ago
You may drop some of the questions depending on the profile of the Focus Group participants Reasons for change and perspectives
(1) Regular salaried employment
During the last 12 months (From early 2009 to early 2010), have there been changes in the number of people who have a regular employment? If yes:
• What type of change? (increased, reduced, unchanged)
• In which sector or sectors of work?
• Why have there been these changes?
• What do you think will be the possibilities for regular salaried employment in the coming year?
(2) Irregular wage labour
During the last 12 months (From early 2009 to early 2010), have there been changes in the number of people who have irregular works? If yes:
• What type of change? (more, less)
• In which sector or sectors have there been changes in irregular wage labour during the last 12 months?
• Why have there been these changes?
• What do you think will be the possibilities for this kind of employment in the coming year?
32

Reasons for change and perspectives
(3) Unemploy-ment
During the last 12 months (From early 2009 to early 2010), have there been changes in the number of people unemployed? If yes:
• In which sector or sectors have there been most losses of job during 2009?
• How do you think unemployment will change in the coming year?
(4) Self-employment (artisans, micro-entrepreneurs, small traders)
During the last 12 months (From early 2009 to early 2010), have there been changes in the number of people having their own small enterprise, business or activity? If yes:
• Which types of activities have changed during 2009?
• Why have there been these changes?
• What do you think will be the possibilities for these kinds of activities in the coming year?
6. Changes in agriculture
You may drop some of the questions depending on the profile of the Focus Group participants Changes in agriculture and perspectives
(1) Households engaged in farming
Comparing now (early 2010) with one year ago (early 2009), have there been changes in the number of people engaged in farming? If yes:
• Which type of changes? (increased, reduced, unchanged)
• Why have there been these changes?
(2) Households having livestock (cows, pigs, goats)
Comparing now (early 2010) with one year ago (early 2009), have there been changes in the number of people raising animals? It yes:
• Which type of changes? (increased, reduced, unchanged)
• Why have there been these changes?
7. Changes in expenditures
Comparing now (early 2010) with one year ago (early 2009), have there been changes in the main expenditure categories of households like you? Please provide the shares of each category (this should add-up to 100%) and the reasons of the changes if any. Please fill in the table.
Expenditure category At present (%) A year ago (%) Main reasons of changes
Health
Education
Transport
Food
Debt reimbursement
Rent
Utilities (water, electricity, gas,
33

telephone, cooking fuel)
Other
8. Specific changes in access to education and health
You may drop the question depending on the profile of the Focus Group participants Attendance/ enrolment
in… Comparing now (early 2010) with one year ago (early 2009), have there been changes in
attendance or enrolment in…? If yes, why?
(1)…primary school
(2) … secondary school
(3) … tertiary education/ university
You may drop the question depending on the profile of the Focus Group participants Comparing now (early 2010) with one year ago (early 2009), have there been changes
in…. If yes, why?
… going to a doctor or health service in case of illness
… the health status of people in general
9. Changes in consumption patterns
Changes in consumption patterns
Comparing now (early 2010) with one year ago (early 2009), have there been changes in the types of food that households like you are eating? If yes:
• Which type of changes? (quantity or/and quality consumed increased, reduced, unchanged)
• Why have there been these changes?
10. Coping strategies
What are the main difficulties that households like you have experienced during the past year (March 2009-February 2010)? Why? Were other families or individuals also affected? Which types? Clearly differentiate between new and chronic problems
Main difficulties in the past year Why? Type of other families/individuals affected
(1)
(2)
(3)
(4)
(5)
How are your households and other people coping with the difficulties? Have these coping strategies changed compared to what you did before? If yes, why?
Main coping mechanisms Differences compared to a year ago and reasons for changes
(1)
(2)
(3)
(4)
(5)
34

11. Changes in social assistance
Changes in social assistance and perspectives
(1) Families who receive Family Benefits
Comparing now (early 2010) with one year ago (early 2009), have there been changes in the number of families receiving benefits? If yes: • Which type of changes? (increased, reduced, unchanged) • Which types of families are concerned? • Why have there been these changes?
(2) Unemployment benefits
Comparing now (early 2010) with one year ago (early 2009), have there been changes in the number of people receiving unemployment benefits? If yes:
• Which type of changes? (increased, reduced, unchanged)
• Why have there been these changes?
12. External assistance During the past 12 months (March 2009-February 2010), has the government or other organizations implemented assistance programmes in [village/city neighborhood]? If yes: What did these programmes consist of? Who benefited from them? What difference did they make to their ability to meet their needs for food, education, health and others?
Types of intervention implemented in 2009
Types of beneficiaries Effects on ability to meet essential needs (improved, deteriorated, unchanged access to food, health, education or others)
(1)
(2)
(3)
(4)
13. Priority needs in 2010-2011
In view of the changes occurred in 2009 and perspectives for 2010, what would be the priority needs for the households like yourselves or other households? Who should be targeted in priority? Who could provide the support required?
Priorities Who should be targeted? Who could provide the support?
(1)
(2)
(3)
(4)
35

36