impacts of shale gas development: myths and realities
TRANSCRIPT
Impacts of Shale Gas Development:
Myths and Realities Alan J. Krupnick, Senior Fellow and Co-Director,
Center for Energy and Climate Economics
JRC-PIT-UH Conference
Alan Krupnick
June 20-21, 2017
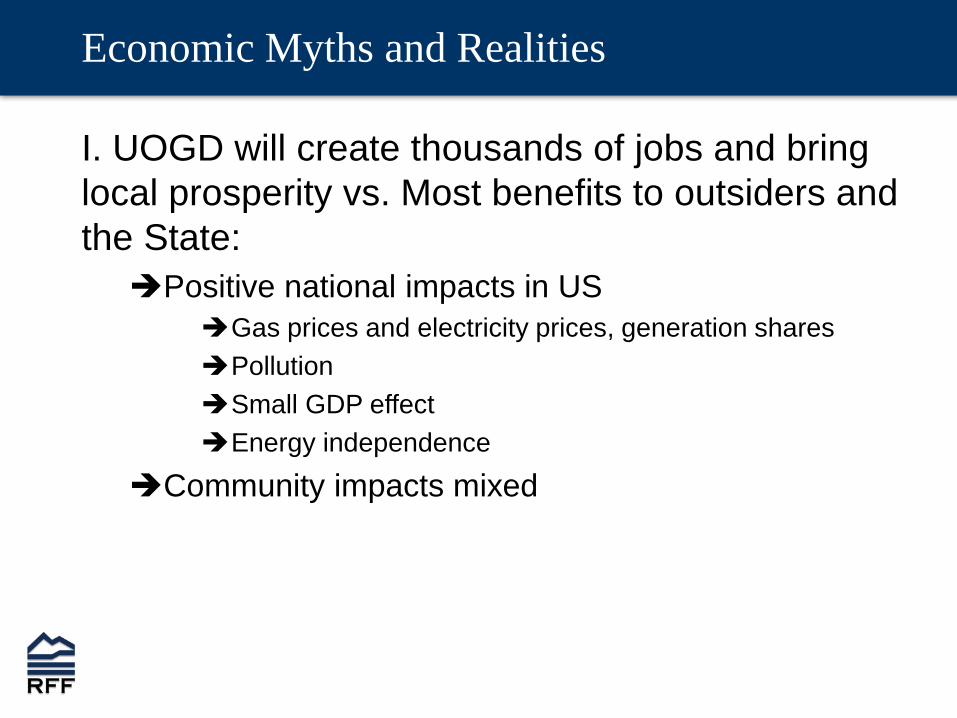
Economic Myths and Realities
I. UOGD will create thousands of jobs and bring
local prosperity vs. Most benefits to outsiders and
the State:
Positive national impacts in US
Gas prices and electricity prices, generation shares
Pollution
Small GDP effect
Energy independence
Community impacts mixed
3
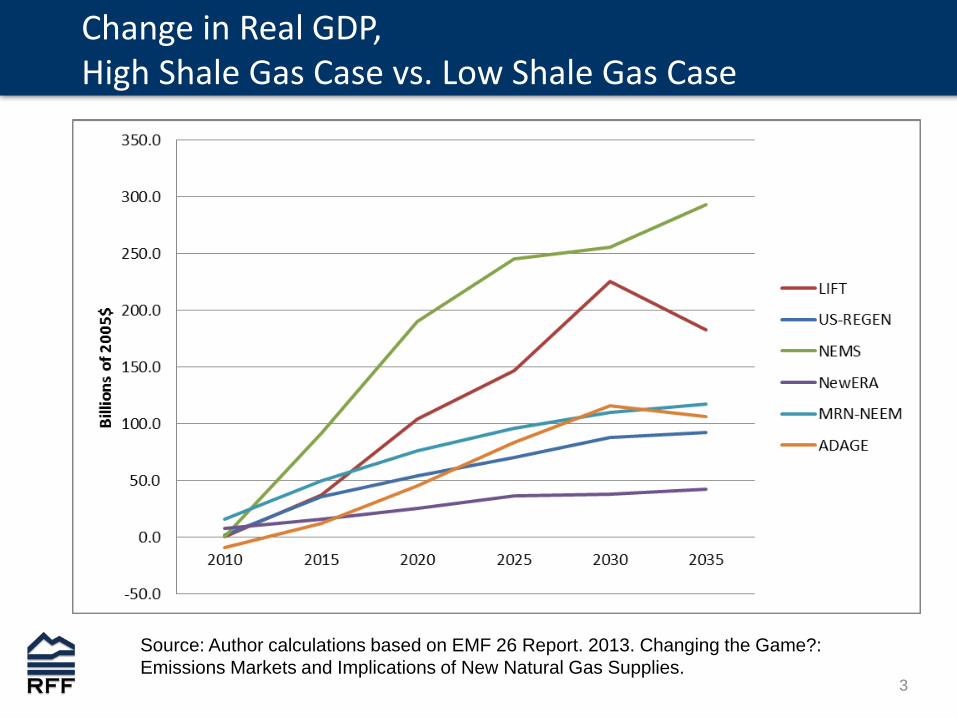
Change in Real GDP, High Shale Gas Case vs. Low Shale Gas Case
Source: Author calculations based on EMF 26 Report. 2013. Changing the Game?:
Emissions Markets and Implications of New Natural Gas Supplies.
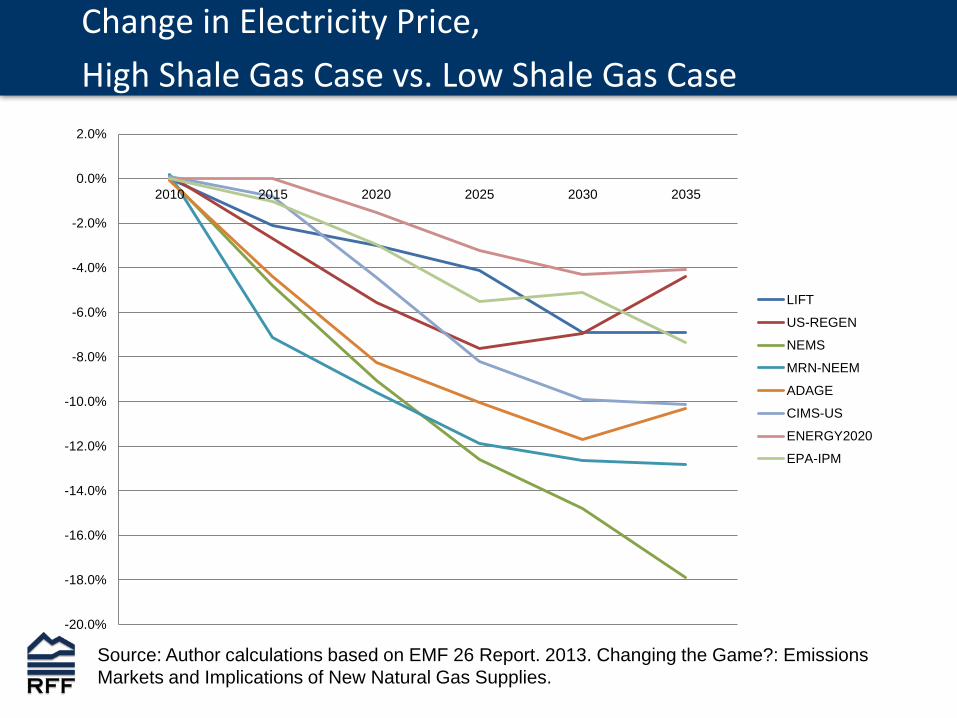
Change in Electricity Price,
High Shale Gas Case vs. Low Shale Gas Case
Source: Author calculations based on EMF 26 Report. 2013. Changing the Game?: Emissions
Markets and Implications of New Natural Gas Supplies.
-20.0%
-18.0%
-16.0%
-14.0%
-12.0%
-10.0%
-8.0%
-6.0%
-4.0%
-2.0%
0.0%
2.0%
2010 2015 2020 2025 2030 2035
LIFT
US-REGEN
NEMS
MRN-NEEM
ADAGE
CIMS-US
ENERGY2020
EPA-IPM


Employment Multipliers
Study Employment
Multiplier
Methodology Focus
Scott & Associates
(2009)
76 Input-Output Estimates 2008 Haynesville shale impacts,
Louisiana.
IHS (2012) 5 Input-Output Predicts US employment from oil and gas, 2012-
35.
Munasib & Rickman
(2014)
3.37 in ND;
1.77 in AR
Statistical Estimates impact of shale in North Dakota,
Arkansas, and Pennsylvania, 2000-11.
Deck et al. (2008) 2.5-2.64 Input-Output Predicts Arkansas shale employment, 2008-12.
Considine et al.
(2011)
2.07 Input-Output Estimates 2010 Marcellus impacts for
Pennsylvania.
Considine et al.
(2010)
2.02 Input-Output Estimates 2009 Marcellus impacts for
Pennsylvania.
Brown (2014) 1.7 Statistical Analyzes county-level natural gas boom in 9
central US states, 2001-11.
Weinstein et al.
(2017)
1.5 Statistical Analyzes county-level income and employment in
US, 2001-2013
Weber (2014) 1.4 Statistical Analyzes non-metropolitan counties in AR, LA, OK,
TX from 1995-2010.
Weinstein (2014) 1.3 Statistical County-level analysis of shale boom in lower 28
states from 2001-11.
Tsvetkova &
Partridge (2015)
1.26 Statistical Examines oil and gas specialization in 6 Western
states, 1980-2011.
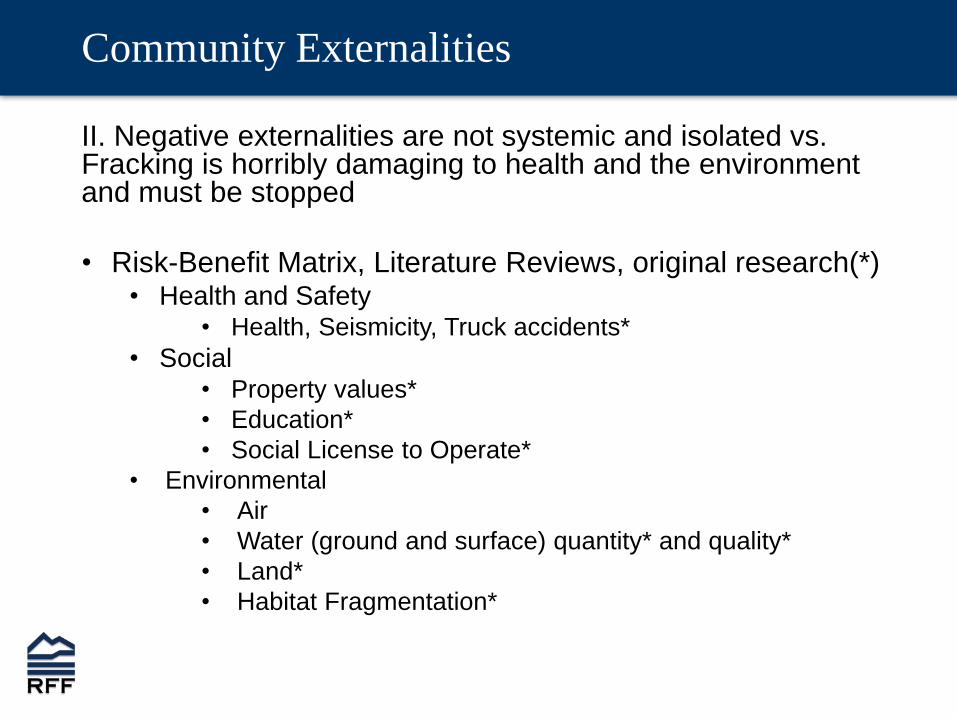
Community Externalities
II. Negative externalities are not systemic and isolated vs. Fracking is horribly damaging to health and the environment and must be stopped
• Risk-Benefit Matrix, Literature Reviews, original research(*) • Health and Safety
• Health, Seismicity, Truck accidents*
• Social • Property values*
• Education*
• Social License to Operate*
• Environmental
• Air
• Water (ground and surface) quantity* and quality*
• Land*
• Habitat Fragmentation*
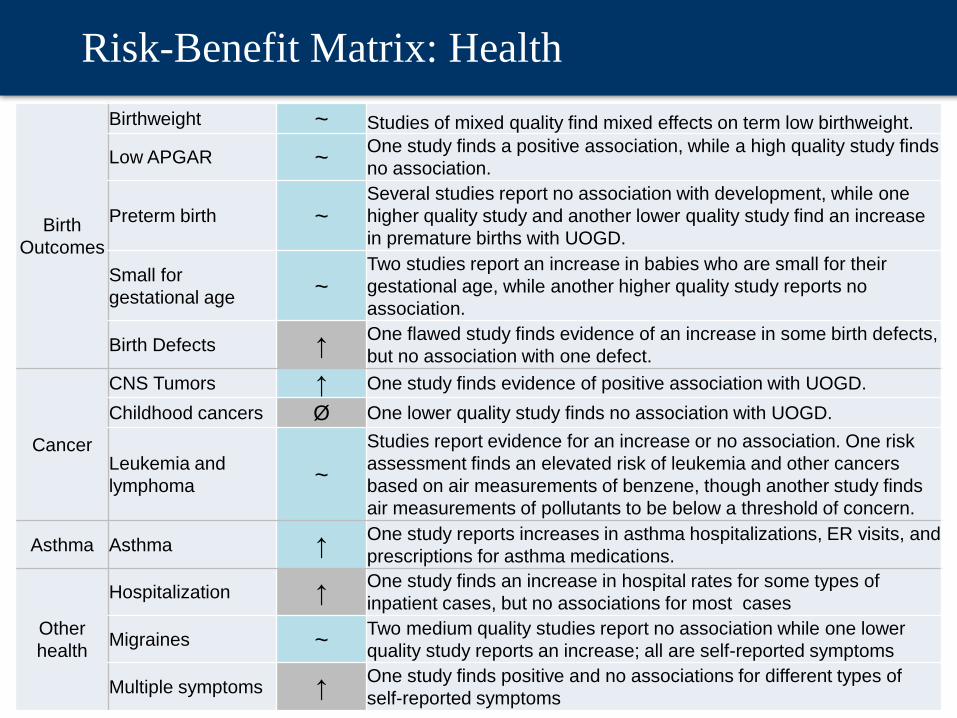
Risk-Benefit Matrix: Health
Birth
Outcomes
Birthweight ~ Studies of mixed quality find mixed effects on term low birthweight.
Low APGAR ~ One study finds a positive association, while a high quality study finds
no association.
Preterm birth ~ Several studies report no association with development, while one
higher quality study and another lower quality study find an increase
in premature births with UOGD.
Small for
gestational age ~ Two studies report an increase in babies who are small for their
gestational age, while another higher quality study reports no
association.
Birth Defects ↑ One flawed study finds evidence of an increase in some birth defects,
but no association with one defect.
Cancer
CNS Tumors ↑ One study finds evidence of positive association with UOGD.
Childhood cancers Ø One lower quality study finds no association with UOGD.
Leukemia and
lymphoma ~
Studies report evidence for an increase or no association. One risk
assessment finds an elevated risk of leukemia and other cancers
based on air measurements of benzene, though another study finds
air measurements of pollutants to be below a threshold of concern.
Asthma Asthma ↑ One study reports increases in asthma hospitalizations, ER visits, and
prescriptions for asthma medications.
Other
health
Hospitalization ↑ One study finds an increase in hospital rates for some types of
inpatient cases, but no associations for most cases
Migraines ~ Two medium quality studies report no association while one lower
quality study reports an increase; all are self-reported symptoms
Multiple symptoms ↑ One study finds positive and no associations for different types of
self-reported symptoms

Low Birth Weight Incidence Near Shale Gas Wells
Source: Elaine Hill. “Shale Gas Development and Infant Health: Evidence from Pennsylvania.” Charles H. Dyson
School of Applied Economics and Management, Cornell University, 2012. Working Paper 2012-12.
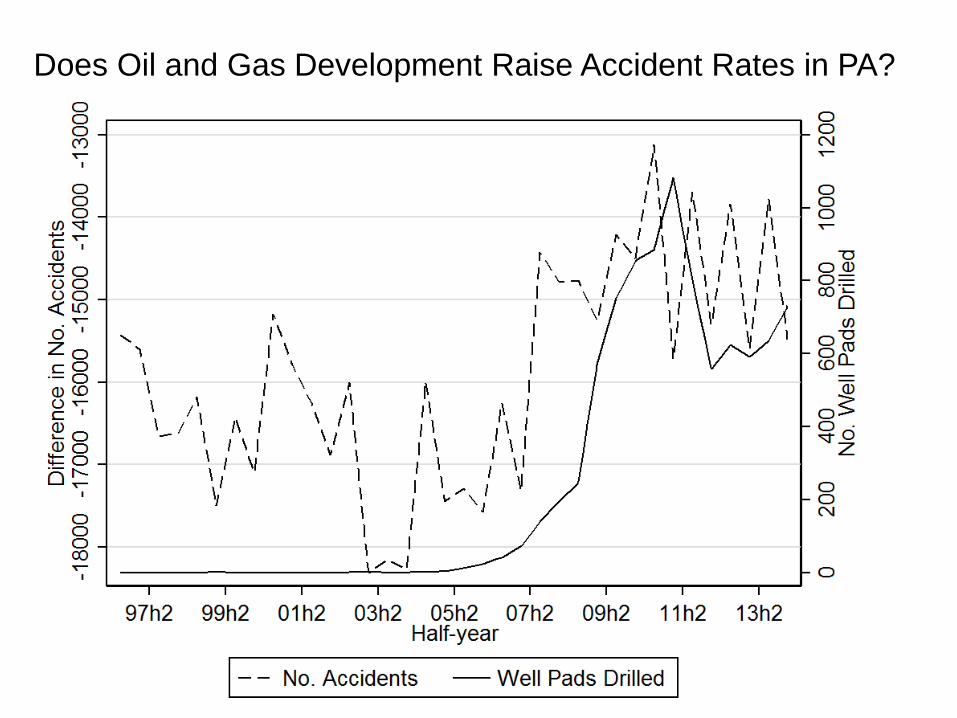
Does Oil and Gas Development Raise Accident Rates in PA?


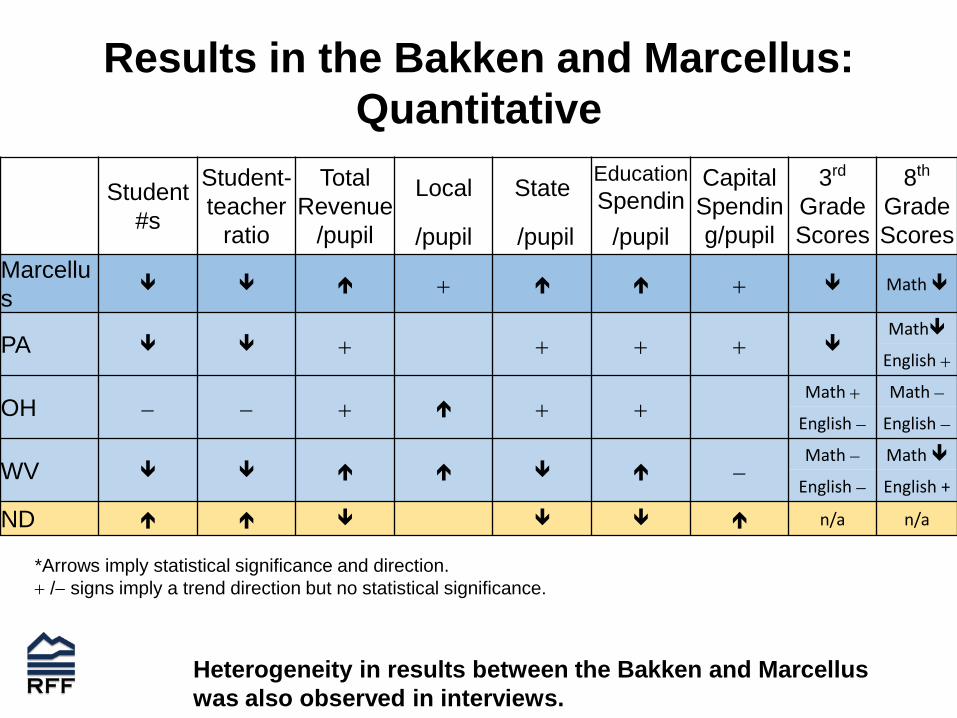
Results in the Bakken and Marcellus:
Quantitative
Student
#s
Student-
teacher
ratio
Total
Revenue
/pupil
Local State Education
SpendinCapital
Spendin
g/pupil
3rd
Grade
Scores
8th
Grade
Scores /pupil /pupil /pupil
Marcellu
s Math
PA
Math
English
OH Math Math
English English
WV Math Math
English English +
ND n/a n/a
*Arrows imply statistical significance and direction.
/ signs imply a trend direction but no statistical significance.
Heterogeneity in results between the Bakken and Marcellus
was also observed in interviews.
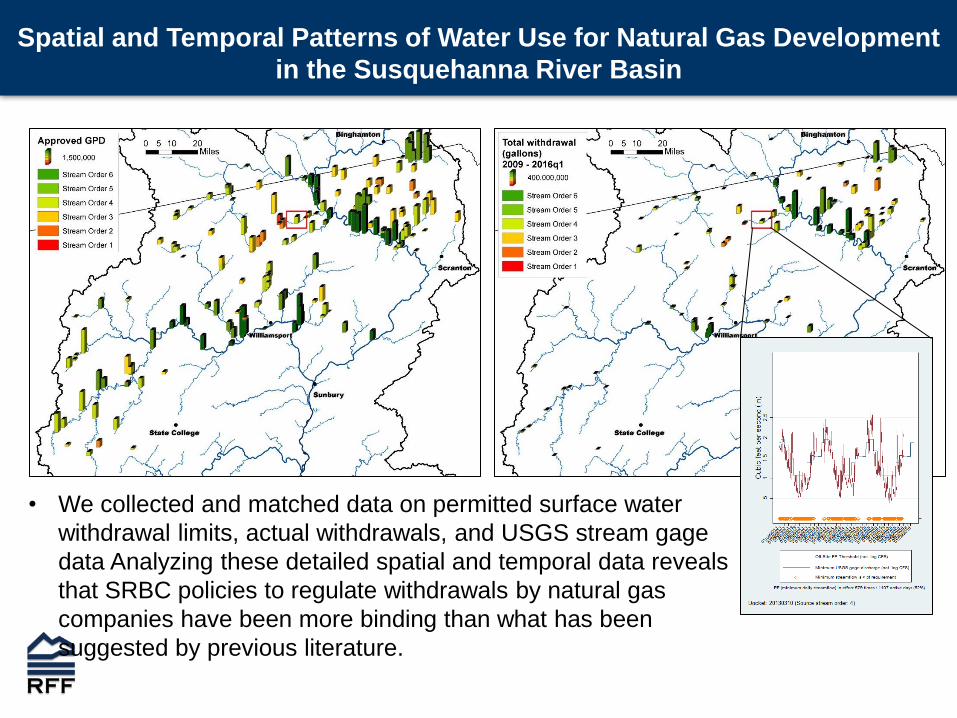
Spatial and Temporal Patterns of Water Use for Natural Gas Development
in the Susquehanna River Basin
• We collected and matched data on permitted surface water
withdrawal limits, actual withdrawals, and USGS stream gage
data Analyzing these detailed spatial and temporal data reveals
that SRBC policies to regulate withdrawals by natural gas
companies have been more binding than what has been
suggested by previous literature.

15
RFF project focuses on environmental risks
from shale gas development Comparison of General Chemicals
in Produced Water and Fracking Fluid Waste
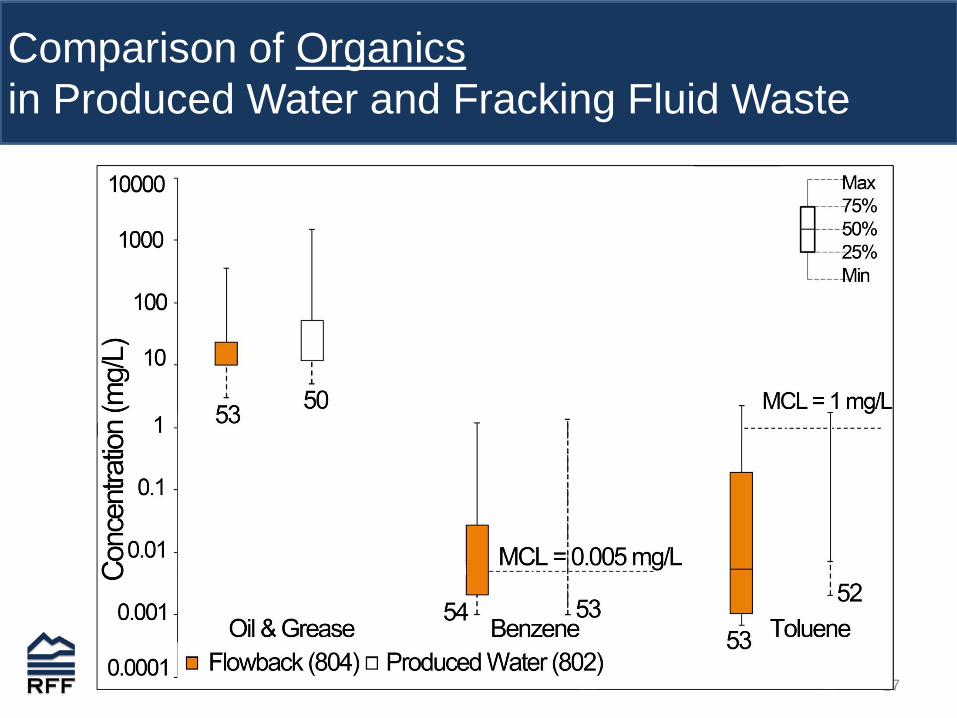
* Number at the bottom of the boxplot is the sample size

16
RFF project focuses on environmental risks
from shale gas development Comparison of Metals in
Produced Water and Fracking Fluid Waste
17
RFF project focuses on environmental risks
from shale gas development Comparison of Organics
in Produced Water and Fracking Fluid Waste

18
RFF project focuses on environmental risks
from shale gas development
Comparison of Naturally Occurring Radioactive
Materials in Produced Water and Fracking Fluid
Waste

Social License and Engagement
Low Level of Engagement High
Education/PR ------------------------------------------------------------------------Joint Planning/ADR
Strategic Engagement ---------------------------------------------- Operational Engagement
Transactional ------------------------------- Transitional ----------------------- Transformational
Social License to Operate
Harder to Obtain Easier to Obtain


Conclusions
Economics: Benefit to the nation and state (during boom)
Externalities: There are no smoking guns and a lot of uncertainty
But perceptions affect housing markets strongly
Definitely some reasons for real concern
Best practice clearly not enough – need comprehensive
regulations and real (and costly) community engagement

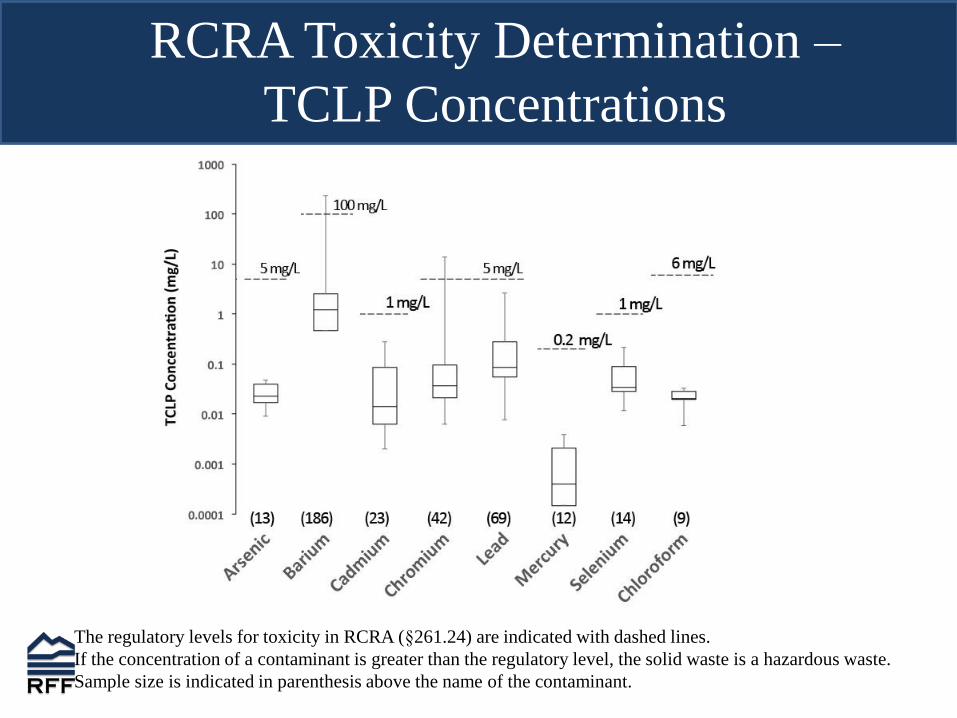
The regulatory levels for toxicity in RCRA (§261.24) are indicated with dashed lines.
If the concentration of a contaminant is greater than the regulatory level, the solid waste is a hazardous waste.
Sample size is indicated in parenthesis above the name of the contaminant.
RCRA Toxicity Determination –
TCLP Concentrations

Employment and Wages Estimates
Study Location Time
Period
Treatment for spatial unit Wages/Earnings Employment
Feyrer et al.
(2017)
US 2004-
2014
Counties with $1 million of oil and gas
production
$42,000- $80,000 0.85 jobs
$1 million of oil and gas production within 100
miles
$130,000- $257,000 2.13 jobs
Weber (2012) CO, TX,
WY
1999-
2007
Counties with $1 million of gas production $91,000‡ 2.35 jobs
Counties in the top 20% of production 2.6%‡ 1.5% annually
Allcott and
Keniston
(2014)
US 1969-
2014
Counties with one standard deviation greater oil
and gas endowments than other counties during
a boom that increases national oil and gas
employment by 100 log points
1.79% 2.82%
Bartik et al.
(2016)
US 1992-
2013
Top Quartile Fracking Potential Counties 4.4% - 6.9% ‡ 3.6% - 5.4%
DeLeire et al.
(2014)
PA 2000-
2010
New wells installed in PA counties Minimal effects‡ 2% for average
county, over 10% for
some
Jacobsen
(2015)
US 2001-
2014
Non-Metropolitan Areas with increase of $500
million or greater of oil and gas extraction
16.7% 13.6%
Komarek
(2016)
OH, WV,
PA
2001-
2013
Counties with at least 50 wells Temporary increase in
some sectors
~7% temporary
increase
Maniloff and
Mastromonaco
(2014)
US 2000-
2010
Top 25% of counties with increased shale well
count
10% 24%
Paredes et al.
(2015)
PA and
NY
2004-
2011
Counties with shale development Minimal effects‡ 0.16% to 0.4% for the
average county†
Wrenn et al.
(2015)
PA 2005-
2011
Shale development impact for local residents N/A 1.53%
Weinstein
(2014)
Lower 48
States
2001-
2011
Counties that experience ≥ 10% increase in oil
and gas employment and ≥ 20 additional oil and
gas workers during boom period
7.2% initially, returns
to original growth rate
in ~5 years‡
3.3% initially, returns
to original growth rate
in ~5 years
25
Shale Gas and Habitat
• Infrastructure development for shale gas extraction
(well pads, roads, gas and water pipelines) can cause
considerable environmental impacts including:
• Species loss through habitat loss and
fragmentation,
• Water quality from sedimentation
• Tradeoff between negative externalities (e.g. habitat
quality and fragmentation) and infrastructure
construction costs is an empirical question
• Constructing spatial optimization models to estimate
tradeoff curve using infrastructure data from
Washington County, PA
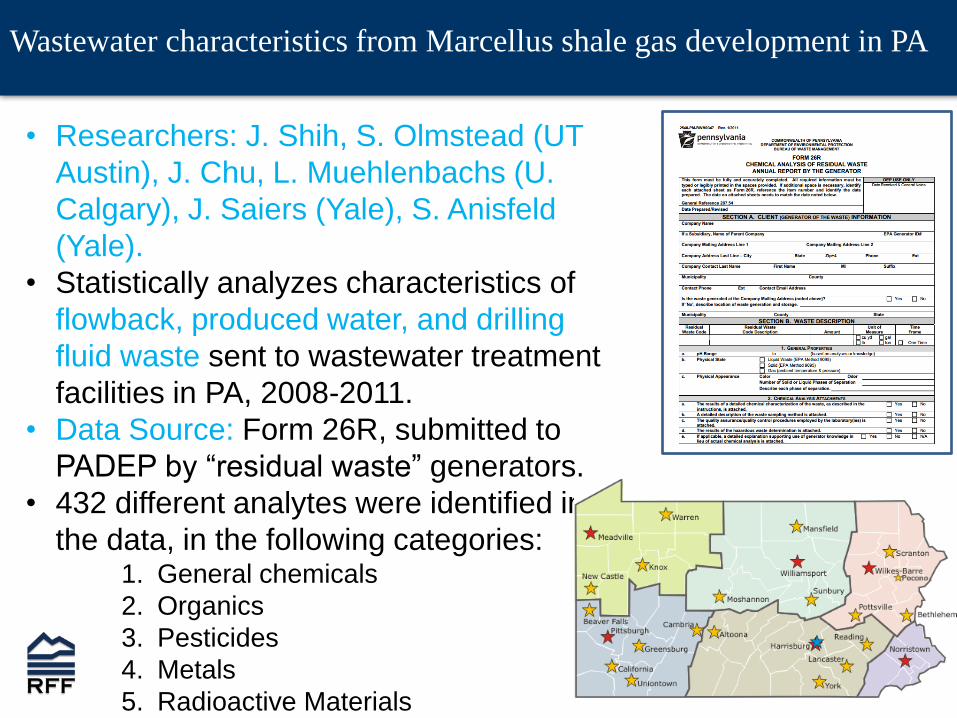
Wastewater characteristics from Marcellus shale gas development in PA
• Researchers: J. Shih, S. Olmstead (UT
Austin), J. Chu, L. Muehlenbachs (U.
Calgary), J. Saiers (Yale), S. Anisfeld
(Yale).
• Statistically analyzes characteristics of
flowback, produced water, and drilling
fluid waste sent to wastewater treatment
facilities in PA, 2008-2011.
• Data Source: Form 26R, submitted to
PADEP by “residual waste” generators.
• 432 different analytes were identified in
the data, in the following categories: 1. General chemicals
2. Organics
3. Pesticides
4. Metals
5. Radioactive Materials
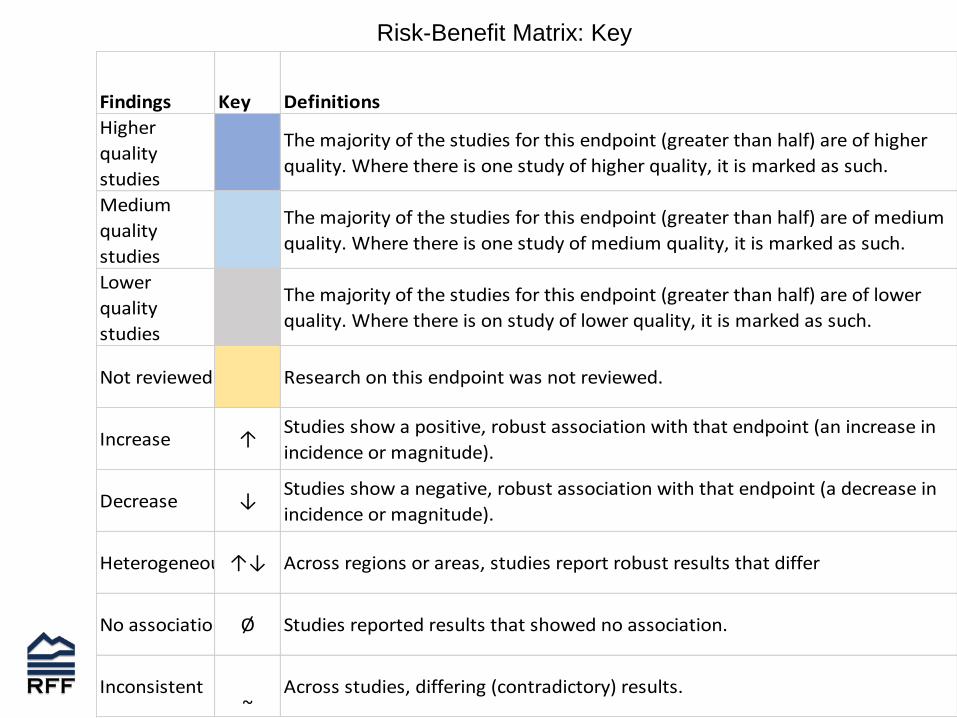
Findings Key Definitions
Higher
quality
studies
The majority of the studies for this endpoint (greater than half) are of higher
quality. Where there is one study of higher quality, it is marked as such.
Medium
quality
studies
The majority of the studies for this endpoint (greater than half) are of medium
quality. Where there is one study of medium quality, it is marked as such.
Lower
quality
studies
The majority of the studies for this endpoint (greater than half) are of lower
quality. Where there is on study of lower quality, it is marked as such.
Not reviewed Research on this endpoint was not reviewed.
Increase ↑Studies show a positive, robust association with that endpoint (an increase in
incidence or magnitude).
Decrease ↓Studies show a negative, robust association with that endpoint (a decrease in
incidence or magnitude).
Heterogeneous↑↓ Across regions or areas, studies report robust results that differ
No association Ø Studies reported results that showed no association.
Inconsistent~
Across studies, differing (contradictory) results.
Risk-Benefit Matrix: Key
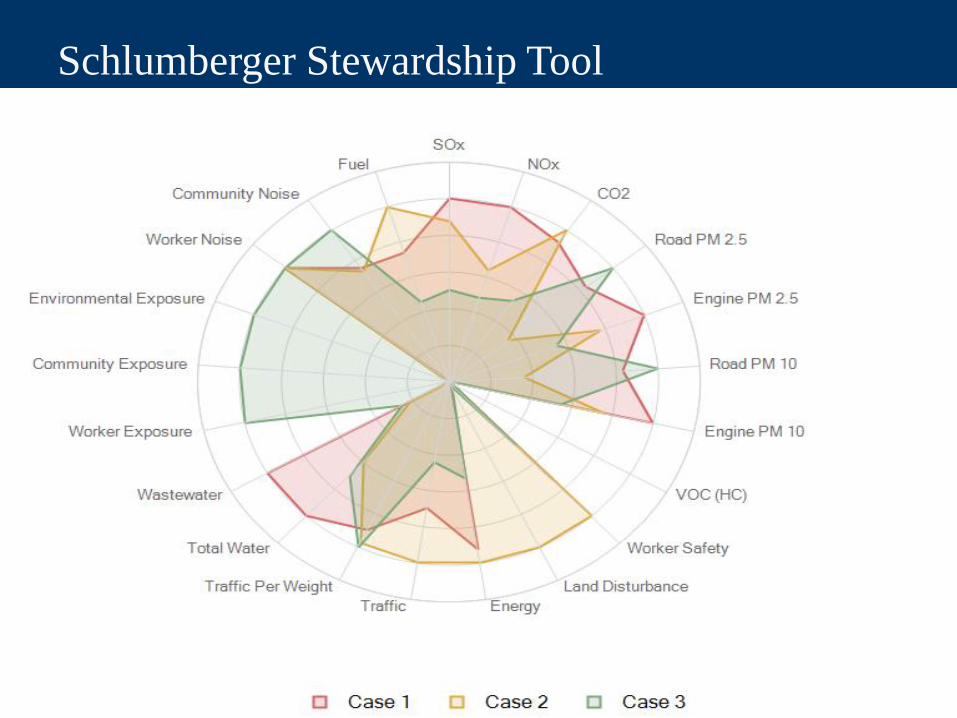
Schlumberger Stewardship Tool