impacts of intensive - semantic scholar · impacts of intensive agriculture and plantation forestry...
TRANSCRIPT

1
Scientific Report Impacts of intensive agriculture and plantation forestry on water quality in the Latrobe catchment, Victoria Publication number 1528 April 2013 Authorised and published by EPA Victoria, 200 Victoria Street, Carlton
EPA Victoria, Monitoring and Assessment Unit
Centre for Aquatic Pollution Investigation and Management
2012 David Mossop1, Claudette Kellar2, Katherine Jeppe2, Jackie Myers2, Gavin Rose3, Kyle Weatherman1, Vincent Pettigrove2 and Paul Leahy1.
1 Environment Protection Authority Victoria, Monitoring and Assessment Unit, Macleod VIC, 3085
2 Centre for Aquatic Pollution Identification and Management, Department of Zoology, The University of Melbourne, Parkville VIC, 3010
3 Agrifood Production Systems, Future Farming Systems Research Division, Department of Primary Industries, DPI Centre, Macleod VIC, 3085

2
Impacts of intensive agriculture and plantation forestry on water quality in the Latrobe catchment, Victoria
Contents Glossary and list of abbreviations ............................................................................................................................................... 4 Acknowledgements ........................................................................................................................................................................ 5 Executive summary ........................................................................................................................................................................ 6 Introduction ...................................................................................................................................................................................... 9
Background ........................................................................................................................................................................................................ 9 Potato farming in the Narracan Creek catchment .................................................................................................................................... 9 Plantation forestry in the Middle Creek catchment .................................................................................................................................. 9 Multiple lines of evidence to detect pollution impacts ............................................................................................................................ 10 Project aims ...................................................................................................................................................................................................... 10
Methods............................................................................................................................................................................................. 11 Study areas ........................................................................................................................................................................................................ 11 Site selection and limitations ......................................................................................................................................................................... 11 Rainfall and stream flow data ........................................................................................................................................................................ 11 Water chemistry .............................................................................................................................................................................................. 14
Long term turbidity data for Narracan Creek ....................................................................................................................................... 14 In situ nutrients and other water quality parameters ......................................................................................................................... 14 Pesticides ..................................................................................................................................................................................................... 14 Passive sampling ......................................................................................................................................................................................... 14
Sediment chemistry ........................................................................................................................................................................................ 14 Pesticides and heavy metals .................................................................................................................................................................... 14
Toxicology ......................................................................................................................................................................................................... 14 Phytotoxicity tests ..................................................................................................................................................................................... 14 Chironomus tepperi toxicity tests ........................................................................................................................................................... 15 In situ cage tests – Potato farming ......................................................................................................................................................... 15 Data analysis for ecotoxicology components ....................................................................................................................................... 16
Rapid bioassessment using macroinvertebrates ...................................................................................................................................... 17 General pollution rankings ............................................................................................................................................................................. 18
Results ............................................................................................................................................................................................. 19 Rainfall and stream flow data ....................................................................................................................................................................... 19 Water quality .................................................................................................................................................................................................. 20
Long term turbidity data for Narracan Creek ..................................................................................................................................... 20 In situ nutrients and other water quality parameters ......................................................................................................................... 21 Pesticides - Water ...................................................................................................................................................................................... 23 Passive sampling ........................................................................................................................................................................................ 26
Sediment chemistry ....................................................................................................................................................................................... 26 Nutrients and hydrocarbons .................................................................................................................................................................... 26 Sediments – Heavy metals ...................................................................................................................................................................... 28 Sediments – Pesticides .............................................................................................................................................................................. 31
Toxicology ........................................................................................................................................................................................................34 Phytotoxicity ...............................................................................................................................................................................................34 Chironomus tepperi toxicity tests .......................................................................................................................................................... 39 In situ cage tests – Potato farming ........................................................................................................................................................ 39

3
Impacts of intensive agriculture and plantation forestry on water quality in the Latrobe catchment, Victoria
Rapid bioassessment .................................................................................................................................................................................... 42 General pollution rankings ........................................................................................................................................................................... 45 Summary of results ....................................................................................................................................................................................... 46
Discussion ...................................................................................................................................................................................... 48 Rainfall and stream flow data ..................................................................................................................................................................... 48 Long term turbidity data for Narracan Creek ......................................................................................................................................... 48 Water quality .................................................................................................................................................................................................. 48
In situ nutrients and other water quality parameters ....................................................................................................................... 48 Pesticides ........................................................................................................................................................................................................ 48
Potato farming study area ...................................................................................................................................................................... 48 Forestry study area .................................................................................................................................................................................. 49
Sediment chemistry ...................................................................................................................................................................................... 50 Nutrients and hydrocarbons ................................................................................................................................................................... 50 Sediments – Heavy metals ...................................................................................................................................................................... 50
Toxicology ....................................................................................................................................................................................................... 50 Phytotoxicity .............................................................................................................................................................................................. 50 Chironomus tepperi toxicity tests ........................................................................................................................................................... 51 In situ cage tests – Potato farming ......................................................................................................................................................... 51
Rapid bioassessment ...................................................................................................................................................................................... 51 Overall results ................................................................................................................................................................................................. 52 Beyond run-off: aerial and groundwater transport of pesticides ......................................................................................................... 52 Management actions ...................................................................................................................................................................................... 53
Narracan Creek potato farming study area .......................................................................................................................................... 53 Middle Creek forestry study area ........................................................................................................................................................... 53 Recommendations for management of mercury in the Latrobe catchment ................................................................................. 53
References .................................................................................................................................................................................... 54 Appendices .................................................................................................................................................................................... 58
Appendix 1: ALS Ltd labortories brief method summaries for water and sediment screens ........................................................ 58 Appendix 2: DPI analytical methods for water and sediment pesticide screens .............................................................................. 59
Water - Multiresidue screen ..................................................................................................................................................................... 59 Water - Sulfonylurea herbicides .............................................................................................................................................................. 59 Water - Phenoxy acid herbicides ............................................................................................................................................................ 59 Sediments - Multiresidue screen ............................................................................................................................................................ 59 Analytical methods: Sediments - Sulfonylurea herbicides ............................................................................................................... 60 Analytical methods: Sediments - Phenoxy acid herbicides .............................................................................................................. 60
Appendix 3: Agrochemical residues - Limits of reporting ...................................................................................................................... 61 Appendix 4: Equipment and methodology for passive sampling ......................................................................................................... 64

4
Impacts of intensive agriculture and plantation forestry on water quality in the Latrobe catchment, Victoria
Glossary and list of abbreviations Acronym / Term Definition
ANZECC Australian and New Zealand Environment Conservation Council
APVMA Australian Pesticides and Veterinary Medicines Authority
ARMCANZ Agriculture and Resources Management Council of Australia and New Zealand
CAPIM Centre for Aquatic Pollution Investigation and Management
DCMU 3-(3,4-dichlorophenyl)-1,1-dimethylurea, a herbicide that inhibits photosynthesis that can be used in algal toxicology testing
DDD Dichlorodiphenyldichloroethane, a breakdown product of DDT
DDE Dichlorodiphenyldichloroethylene, a breakdown product of DDT
DDT Dichlorodiphenyltrichloroethane, an organochlorine pesticide
DPI Department of Primary Industries Victoria
DSE Department of Sustainability and Environment Victoria
EDC Endocrine disrupting chemical, known to impact endocrine system function of certain organisms
EDTA Ethylenediaminetetraacetic acid
EPA Environment Protection Authority Victoria
FFSR Future Farming Systems Research
Forestry (see 'Plantation forestry')
Forestry control sites Sites where data was collected specifically for the current project which do not contain plantation forestry as a land use in the catchment adjacent or upstream of the site
Forestry impact sites Sites where data was collected specifically for the current project which do contain plantation forestry as a land use in the catchment adjacent or upstream of the site
Forestry study area Middle Creek sub-catchment upstream of Yinnar South, West Gippsland, Victoria. Also includes an additional site on an unnamed tributary of Billy Creek, located in the Morwell National Park
GPx Glutathione peroxidase, an enzyme created by a wide range of organisms whose main biological role is to protect an organism from oxidative damage
GR Glutathione reductase, an enzyme created by a wide range of organisms whose main biological role is to protect an organism from oxidative damage
ISQG Interim Sediment Quality Guidelines as referred to in ANZECC/ARMCANZ (2000)
NHMRC National Health and Medical Research Council
NOx Oxidised nitrogen
OECD Organization for Economic Co-operation and Development
Pesticide A substance or mixture of substances intended for preventing, destroying, repelling or mitigating any pest, typically acting as a herbicide, fungicide or insecticide
Plantation forestry The practice of planting and managing native or introduced trees for the purpose of harvesting
Potato farming control sites
Sites where data was collected specifically for the current project which do not contain potato farming as a land use in the catchment adjacent or upstream of the site
Potato farming impact sites
Sites where data was collected specifically for the current project which do contain potato farming as a land use in the catchment adjacent or upstream of the site
Potato farming study area Narracan Creek sub-catchment upstream of Coalville, West Gippsland, Victoria. Also includes an additional site on an unnamed tributary of Sunny Creek, located in Trafalgar South
TDS Total dissolved solids
TKN Total Kjeldahl nitrogen
TOC Total organic carbon
TP Total phosphorus
TPH Total petroleum hydrocarbon
TSS Total suspended solids

5
Impacts of intensive agriculture and plantation forestry on water quality in the Latrobe catchment, Victoria
Acknowledgements We appreciate field and laboratory assistance from David Collins, John Dean, Chris Garland, Matthew Johnson, Andrew Kramer, Amanda Schaarschmidt and Ros St Clair (EPA Victoria). We also appreciate field assistance from Cameron Amos and Kimberly Huynh and laboratory assistance from Rebecca Brown, Mayumi Allinson and Daniel MacMahon (CAPIM). Our thanks to Pei Zhang and AnhDuyen Bui (Department of Primary Industries) for sediment pesticide analysis and Graeme Allinson (Department of Primary Industries) and Mayumi Allinson (CAPIM) for passive sampling preparation and analysis. Thank you also to Shayne Haywood (West Gippsland Catchment Management Authority) and Fiona Pfeil (Gippsland Water) for sharing data and information. Finally, thank you to David Robinson, Leon Metzeling (EPA Victoria) and David Tiller (Karoo Consulting) for comments on previous drafts of this report.
6
Impacts of intensive agriculture and plantation forestry on water quality in the Latrobe catchment, Victoria
Executive summary The Environment Protection Authority Victoria (EPA) identified a significant knowledge gap concerning the impacts of poor water quality and toxicants in the Latrobe River catchment. In collaboration with the Centre for Aquatic Pollution Investigation and Management (CAPIM), EPA aimed to investigate water quality and assess toxicants entering waterways from two land uses in the Latrobe River catchment; potato farming and plantation forestry. The study areas chosen in West Gippsland were a potato farming region in the Narracan Creek catchment near Thorpdale and a forestry area in the Middle Creek catchment, south of Yinnar South. A multiple lines of evidence approach was adopted incorporating sediment and water chemistry analysis (pesticides, metals, nutrients and hydrocarbons), a range of laboratory-based and in situ bioassay toxicity tests using macroinvertebrates and algae, and rapid bioassessment utilising a variety of established biological indices.
Findings from the Narracan Creek potato farming study area
A wide range of pesticides associated with potato farming were detected in waterways within the Narracan Creek catchment, generally in low concentrations. These included historically used organochlorine pesticides (e.g. DDT) and a range of currently used herbicides, fungicides and insecticides. Reduced emergence of Chironomus tepperi was observed for a number of potato farming sites, suggesting that contaminated sediments were affecting the health of this species. Reduced emergence was also observed for some control sites and may be linked to pesticide drift into these areas. Rapid bioassessment indices revealed proportionally fewer sensitive macroinvertebrates were found in impacted, potato farming areas.
In-stream, farm dams in the Narracan Creek catchment could be playing an important role in the movement of sediment and contaminants within the catchment. They may restrict downstream pesticide movement by acting as sinks where suspended solids and the chemicals bound to them settle out. Appropriate management of these dams is required to prevent or reduce re-suspension of sediments in order to minimise transport of sediment-bound contaminants further down into the catchment.
The origin of pesticides detected at the control sites situated within sub-catchments containing land uses not likely to use certain pesticides is unknown. The movement of pesticides is not limited to downstream, as aerial or groundwater drift can potentially transport pesticides upstream or across sub-catchments.
The sampling period for this project was during a wet summer, resulting in potential dilution and greater dispersal of pesticides. Conversely, summer periods and droughts may present a ‘worst case scenario’ during which pesticides entering waterways during low flow periods may be more concentrated and pose a greater risk to aquatic health. Pesticides may be more likely to reach waterways under certain conditions, with transport behaviour being largely dependent on a range of environmental variables and the chemical properties of the pesticide itself (e.g. degree of solubility).
Periods of high turbidity have been recorded in Narracan Creek in January (and February/March in some cases) over a series of years, which was not associated with rainfall in the catchment. The repeated pattern of this high turbidity suggests it relates to agricultural activities in the catchment. On the basis of this study it was not possible to say conclusively whether the source of this elevated turbidity was from sediment run-off during irrigation and harvesting of potatoes. However, this is the most likely source. The timing of the high turbidity would suggest the cause is run-off during peak irrigation periods in summer. However, the limited spatial information collected suggests that elevated turbidity occurs in mixed forest and grazing catchments as well. Increased turbidity is associated with an increase in suspended solids, and may represent a transport pathway for insoluble pesticides which are able to bind to these suspended solids.

7
Impacts of intensive agriculture and plantation forestry on water quality in the Latrobe catchment, Victoria
Narracan Creek at Cookes Road, Thorpdale
Findings from the Middle Creek forestry study area
Overall the findings from the assessment of the Middle Creek forestry area were positive and suggested that for the range of forestry stages within the catchment, water quality issues were not substantial. Relatively few pesticides were detected in the Middle Creek catchment. It should be noted however that no young plantation plots (<2 years old) were found within the study area. Young plots present the highest risk to water quality as they receive the most intensive pesticide application.
Although the number of types of pesticides detected in the Middle Creek area was relativity low, on occasion they exceeded guideline levels. Of particular interest is the presence of simazine and diazinon. Simazine was found at impact sites, although forestry managers Hancock Victorian Plantations (HVP) have not used it in the catchment since 2003. There is potential for simazine to be transported via groundwater, which also greatly slows its rate of degradation. Simazine and diazinon were also detected at the control site for the forestry area (tributary of Billy Creek in the Morwell National Park). Simazine in particular is unlikely to have been used in the control site catchment and is likely to enter the waterway through aerial deposition or groundwater movement. The unique water chemistry at the control site (higher salinity) suggests groundwater may be a significant component of the flow at the site, resulting in a possibility of low level pesticide contamination of the groundwater in the area.
8
Impacts of intensive agriculture and plantation forestry on water quality in the Latrobe catchment, Victoria
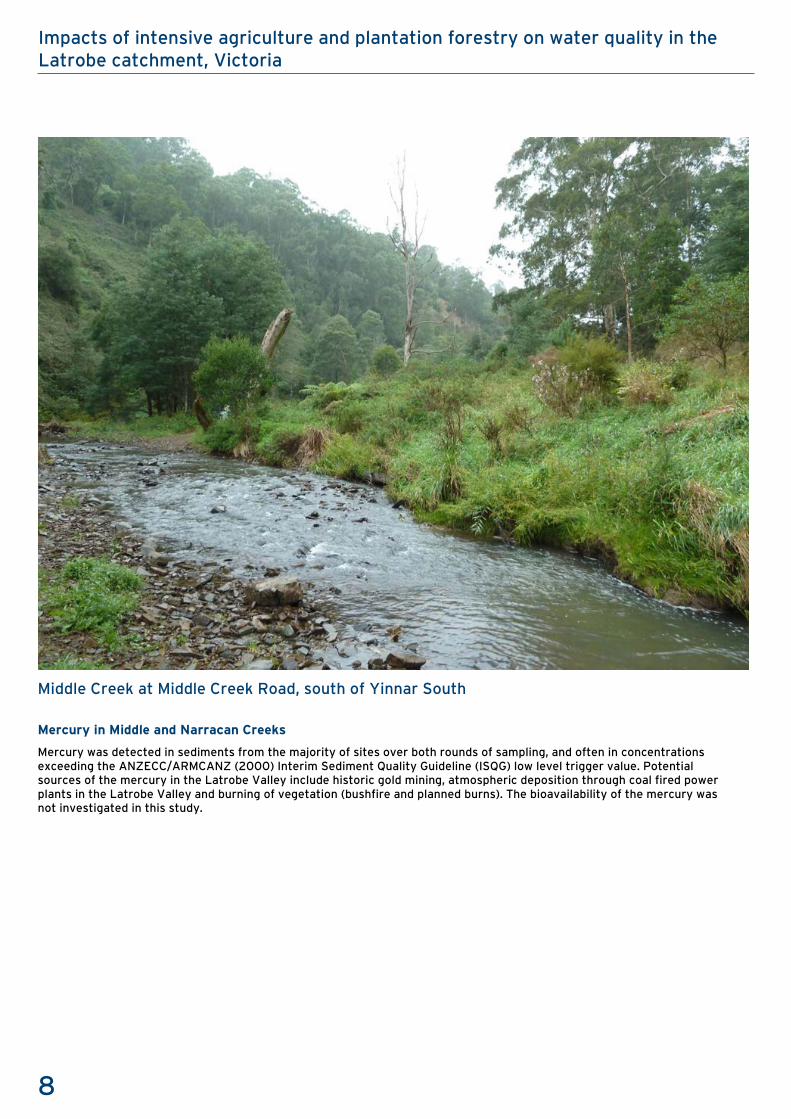
Middle Creek at Middle Creek Road, south of Yinnar South
Mercury in Middle and Narracan Creeks
Mercury was detected in sediments from the majority of sites over both rounds of sampling, and often in concentrations exceeding the ANZECC/ARMCANZ (2000) Interim Sediment Quality Guideline (ISQG) low level trigger value. Potential sources of the mercury in the Latrobe Valley include historic gold mining, atmospheric deposition through coal fired power plants in the Latrobe Valley and burning of vegetation (bushfire and planned burns). The bioavailability of the mercury was not investigated in this study.

9
Impacts of intensive agriculture and plantation forestry on water quality in the Latrobe catchment, Victoria
Introduction Background
The Latrobe River catchment is located in West Gippsland and includes a diverse range of aquatic ecosystems set amongst a variety of land uses. The upper reaches drain from areas on the southern side of the Great Dividing Range and the northern side of the Strzelecki Ranges, which are dominated by native forest, forestry and grazing. The middle and lower reaches flow through a predominately modified, floodplain landscape dominated by grazing, with some forestry, agriculture, industry and urban areas present.
Regular water quality monitoring in the Latrobe catchment has been conducted by various government agencies, including the Environment Protection Authority Victoria (EPA), since the 1970s. Water quality in the upper reaches, particularly to the north, is generally good to very good, however the middle and lower reaches of the catchment are generally in poor to very poor condition. There are many potential pollution sources that detrimentally affect the aquatic health of the mainstem Latrobe River and its tributaries, such as urban run-off from three major towns and wastewater from industrial sources (e.g. power stations and a paper mill). Additionally, intensive and broad scale primary industries, such as dairy, potato farming and a rapidly expanding plantation forestry industry, are likely to cause impacts on aquatic health.
Major discharges to water from industries in the Latrobe Valley (e.g. the Maryvale paper mill) are licensed. Licenced companies are required to collect and provide EPA with comprehensive environmental data, which details the quality of water released by these companies back into the environment. As a result, EPA has a good understanding of the environmental impacts of major industry on waterways. However, there is much less known about the nature and scale of the environmental impacts of unlicensed activities on waterways.
Two unlicensed land uses with the potential to impact the water quality and aquatic organisms of waterways in the Latrobe catchment are potato farming and plantation forestry. In particular, the limited information available on pesticide use and soil management for both land uses suggests that these could be a source of water quality issues in the catchment. This project uses two study areas within the Latrobe catchment to investigate these potential impacts; Narracan Creek, to focus on potato farming and Middle Creek to focus on plantation forestry. Additional sites on the mainstem Latrobe River provide a wider catchment perspective to the study.
Potato farming in the Narracan Creek catchment
Potato farming in the Latrobe catchment occurs in the vicinity of Thorpdale and is the third largest agricultural commodity in the region, after dairy and beef cattle. The industry uses a range of pesticides intensively, including insecticides, herbicides and fungicides, to control pathogens and weeds. The Australian Pesticides and Veterinary Medicines Authority (APVMA) currently lists 86 active ingredients used in pesticides registered for use in potato farming, with these being administered through ground pellets, ground injection, spot spraying, boom spraying or aerial spraying. Pesticides are capable of entering waterways predominately through surface run-off, aerial drift and groundwater movement. The effects of pesticides on the aquatic biota can be both lethal (mortality) and sub-lethal (delayed development, reduced growth and inhibition of adult insect emergence) (Harmon 2010). Many pesticides are also endocrine disrupting chemicals (EDCs) that can affect the reproductive capacity of aquatic fauna, including fish and invertebrate species (Gust et al. 2010; Jobling and Tyler 2003). Macroinvertebrate communities are particularly sensitive to pollution, and multiple studies have attributed the reduction of macroinvertebrate diversity and abundance to pesticides (Friberg et al. 2003; Liess and von der Ohe 2005; Schafer et al. 2011). Herbicides also pose a significant threat to microalgal communities by disrupting photosynthetic pathways and inhibiting growth (Debenest et al. 2010).
The Thorpdale area has deep, fertile topsoil dominated by ferrosols (Sargeant and Imhof 2012), which are generally loosely packed and easily eroded. The Narracan Creek catchment around Thorpdale is characterised by steep slopes and high rainfall (>1000 mm average annual rainfall). High erosion rates and sediment generation has been identified as a problem in the Latrobe catchment, including the Thorpdale area (Wilkinson et al. 2005). Land use practices such as ploughing to within metres of the stream bank, ploughing down steep slopes and clearance of riparian vegetation, are likely to exacerbate the erosion potential of these soils. Increased sedimentation of aquatic waterways can alter water quality (increased turbidity, decreased oxygen, reduction of light) and habitat (altering substratum structure and benthic habitat), affecting the structural and functional composition of aquatic fauna (Larsen et al. 2011). Furthermore, sediment entering the waterway may be contaminated with a number of pollutants, including pesticides, which can directly or indirectly affect benthic macroinvertebrates (Carew et al. 2007; Pettigrove and Hoffmann 2003; Pitt 1995).
Water usage for irrigated agriculture in Narracan Creek is intensive and aerial photographs show a high number of farm dams, many of them positioned on water courses (i.e. in-stream dams). In addition, Narracan Creek around Thorpdale is a ‘declared water supply catchment’ and supplies water to towns in the Moe area.
Plantation forestry in the Middle Creek catchment
Plantation forestry is a rapidly expanding industry in the Latrobe catchment with the Maryvale paper mill, the largest paper mill in Australia, moving from using native forest timber to plantation timber. Similar to potato farming, forestry operations have the potential to impact the water quality and aquatic biota through fine sediment deposition and pesticide contamination. In Australia and internationally, studies on the effects of logging activities on macroinvertebrates have had mixed results, with some having found adverse effects of sedimentation to benthic macroinvertebrates (Binkley and Brown 1993; Campbell and Doeg 1989), while others detected little or no response from macroinvertebrate assemblages (Fairchild

10
Impacts of intensive agriculture and plantation forestry on water quality in the Latrobe catchment, Victoria
et al. 1987; Kreutzweiser et al. 2005). Therefore it is important to understand if increased sedimentation and pesticide contamination is affecting the aquatic fauna in the Latrobe River catchment.
The Middle Creek sub-catchment on the northern side of the Strzelecki Ranges is dominated by a dermosol soil type (Sargeant and Imhof 2012), which can be susceptible to erosion. Current management practices such as ’cable logging’ and road maintenance specifically for logging trucks are likely to cause erosion issues. Thirteen pesticide active ingredients are currently registered by the APVMA for use in plantation forestry in the region and are generally administered through ground pellets or aerial spraying.
Multiple lines of evidence to detect pollution impacts
A major challenge for environmental management agencies is to identify the major factors influencing aquatic ecosystems. This involves isolating the effects of pollutants from other factors that may impact the physical condition of the water body, and then identifying the primary pollutants causing ecosystem stress (Townsend et al. 2008). A powerful way of approaching this problem is to use a multidisciplinary approach, which provides multiple lines of evidence to determine an association between ecosystem health and pollution (Burton et al. 2002; Suter and Cormier 2011).
Rapid bioassessment of macroinvertebrates and physico-chemical data gathering are the most common methods for stream assessments of pollution overseas and in Australia (Bonada et al. 2006; Chessman 1995; EPA Victoria 2003; Reynoldson et al. 1997). However, traditional monitoring methods cannot effectively isolate pollution effects, especially in field studies alone. This can be combated by incorporating an ecotoxicological component to studies, which expands on the results from traditional data collection, and provides greater resolution to identifying contaminants and the ecological risk they pose.
Over the past decade there has been considerable effort to quantify the impacts of contaminated sediments and surface waters on aquatic fauna through laboratory and field ecotoxicological studies (Burton et al. 2000; Lee et al. 2000). For example, laboratory studies have measured acute and chronic toxicity using bioassays of cultured invertebrates (Choung et al. 2010; Phipps et al. 1993) and microalgae (Paixão et al. 2008). Microalgae are at particular risk from herbicide pollution in aquatic systems and are a useful laboratory test group for toxicity testing. Disruption at this primary production level would be likely to cause effects at higher trophic levels (Paixao et al. 2008). In situ bioassays that expose caged aquatic organisms to in-stream conditions, measure the biological response over time and incorporate impacts from pulse events such as pesticide applications, which are often difficult to assess in traditional laboratory-based bioassays (Crane et al. 2007). Chironomid (midge) larvae are a useful laboratory test group in toxicity testing, particularly for sediment pollution. Chironomids reside in the sediment where they settle as larvae after hatching and remain until they emerge as adults, spending a significant proportion of their lifecycle exposed to sediment-bound pollutants. In Australia the chironomid Chironomus tepperi has been used as a laboratory test species in acute (survival) and chronic (delayed emergence) toxicity testing in numerous studies (Choung et al. 2010; Kellar et al. 2011; Stevens et al. 2005). Emergence can be delayed by toxicants in the sediment, including pesticides, that prevent moulting or metamorphosis (Brock et al. 2009). However, low concentrations of essential metals and nutrients (e.g. iron) can accelerate emergence as Chironomus produce haemoglobin (Kamimura et al. 2003). Freshwater snails and amphipods have been routinely used as in situ cage test organisms because of their robustness to cage conditions, ease of collection or culture, routine use in standardised laboratory protocols and wide range of sensitivity to toxicants (Schmitt et al. 2010; Schulz 2003). Biochemical biomarkers (such as the enzymes glutathione peroxidise and glutathione reductase) that measure general stress in aquatic fauna after exposure to chemicals, provide a rapid, early warning marker of biological impairment. They also provide direct evidence that the chemical has been taken up by the organism and is having a biological effect (Crane et al. 2002; Kelly et al. 1998).
In the current study we applied a novel study design that incorporates multidisciplinary techniques to understand the sources of pollution and impacts of agricultural practices. Specifically, the lines of evidence used included investigating water and sediment chemistry (total dissolved solids, total suspended solids, nutrients, petroleum hydrocarbons, metals and pesticides in water and sediment), ecotoxicology (using the microalgae Scenedesmus sp. and the insect C. tepperi), general environmental stress (in situ toxicity tests of aquatic snails, chironomids and caddisflies, including survival and biomarker response) and rapid bioassessment (RBA) (using macroinvertebrate communities).
Project aims
This study aimed to fill in knowledge gaps related to the impact of potato farming and forestry on water quality and aquatic macroinvertebrates using multiple lines of evidence. Study areas on Narracan Creek and Middle Creek were used to assess sources and levels of impact through:
• collating and analysing previous flow, rainfall and water quality data
• identifying and quantifying water quality parameters, nutrients, metals and pesticides
• determining the impact of contaminants on macroinvertebrates and algae using a range of ecotoxicology tests
• assessing the biological health of waterways using rapid bioassessment techniques.

11
Impacts of intensive agriculture and plantation forestry on water quality in the Latrobe catchment, Victoria
Methods Study areas
This study was conducted in the Latrobe catchment, Victoria (Figure 1). Land use is dominated by livestock grazing, forestry, irrigated improved pasture, residential areas and brown coal mining (WGCMA 2011). The two main study areas were located within the Narracan Creek and Middle Creek sub-catchments, on the northern side of the Strzelecki Ranges. Two additional sites on the Latrobe River mainstem were also surveyed to provide a catchment perspective.
Narracan Creek is located in the south-eastern region of the Latrobe catchment (Figure 1). It is approximately 40 km in length and drains a catchment of approximately 132 km2. From its headwaters in Yarragon South, Narracan Creek meanders in an easterly direction, running north of Thorpdale, after which it heads in a north-easterly direction through the localities of Narracan and Coalville. After passing through Coalville the creek heads north through the eastern regions of Moe before discharging into the Latrobe River. Land use for the upper reaches includes a mixture of native forest, plantation forest and agriculture (primarily livestock grazing). Land use for the middle and lower reaches is dominated by livestock grazing and potato farming. Narracan Creek and its tributaries are scattered with in-stream, farm dams. These dams are built in the stream channel and are used to hold water for agricultural watering purposes, while maintaining a minimum passing flow.
Middle Creek is located in the southern region of the Latrobe catchment (Figure 1). It is approximately 33 km in length and drains a catchment of approximately 150 km2. Middle Creek begins in the hilly regions of Jumbuk and meanders in a north-westerly direction through Budgeree, Yinnar South and Yinnar. Shortly after flowing through Yinnar the creek discharges into the Morwell River. Land use for the upper reaches includes a mixture of native forest and plantation forestry, while the middle and lower reaches are dominated by livestock grazing.
The Narracan Creek sub-catchment provides habitat for several threatened, aquatic species: the nationally significant Growling Grass Frog (Litoria raniformis), and the state significant Narracan Burrowing Cray (Engaeus phyllocercus) and Gippsland Burrowing Cray (Engaeus hemicirratulus) (DSE 2010). Within the Middle Creek catchment, the Strzelecki Burrowing Cray (Engaeus rostrogaleatus) has been recorded (DSE 2010). Two nationally significant fish species have also been recorded downstream of Narracan Creek and Middle Creek: Australian Grayling (Prototroctes maraena) and Dwarf Galaxias (Galaxiella pusilla) (DSE 2010).
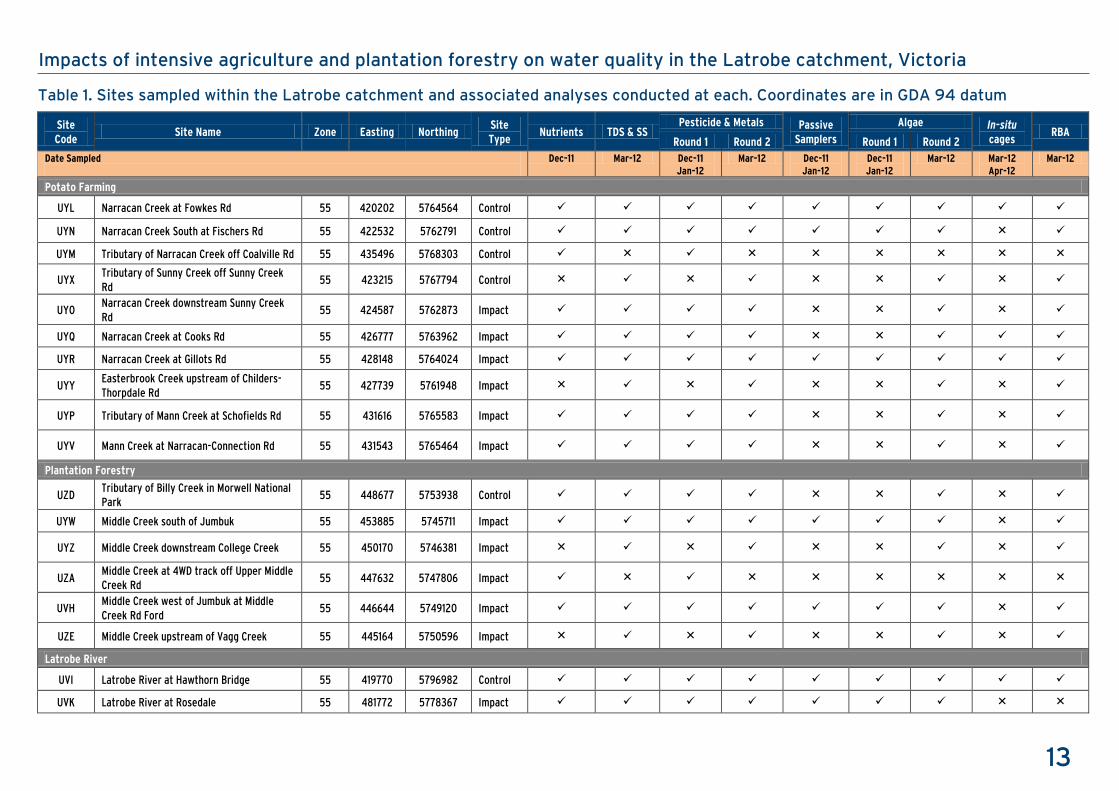
Site selection and limitations
Data was collected from a total of 18 sites in the Latrobe catchment, including control and impact sites (table 1). Ten sites focused on potato farming in the Narracan Creek sub-catchment, six sites focused on forestry in the Middle Creek sub-catchment and two sites were selected on the Latrobe River to provide context of the wider Latrobe catchment. The main sampling periods were 12-15 December 2011 (Round 1) and 19-22 March 2012 (Round 2). Due to high water levels, additional data was collected from the two Latrobe River sites slightly outside these periods. Most sites sampled in Round 1 were re-sampled in Round 2. However, several sites were replaced with new sites in Round 2 to either provide a more effective control or allow further investigation of areas following the Round 1 results.
Site selection for the current study was conducted following three scoping visits. The following factors were taken into consideration when selecting sites:
• Sites were selected to provide spatial coverage of the study areas over a range of land use intensities. Sites were categorised as ‘control’ or ‘impact’ based on adjacent and upstream land use (Table 1). Sites were assigned to the control group if they lacked the land use being tested, but are not necessarily in pristine condition due to the absence of intact, remnant native forest within the study areas. For example control sites for the Narracan Creek lacked potato farming adjacent or upstream, however they could include a mixture of native forest and grazing.
• Due to the potentially confounding impacts of extensive bushfires in 2009, the majority of sub-catchments found in the northern Strzelecki Ranges were excluded as potential study areas. Middle Creek was not affected by these fires and was chosen as a representative sub-catchment for plantation forestry, however effective control areas were limited. The Middle Creek study area included a mixture of native forest, established native plantation plots (>5 years old) and freshly harvested plots. However, it did not include any newly established plantation plots. Newly established plots are likely to result in more easily detectable impacts as they receive the most intensive pesticide applications and have high erosion potential prior to tree root systems becoming well established.
• The assortment of land uses contributing to the catchment of any one site causes difficulties in attributing observed impacts to specific land uses. Impact sites ranged in land use coverage (intensity), topography, proximity to waterways, width of riparian buffer and time periods since soil disturbance and pesticide application. Hence, these factors must be considered when interpreting results.
Rainfall and stream flow data
Rainfall and stream flow data was sourced to provide context for variations in pesticide presence and concentration between the sampling periods, and to examine longer term trends. Rainfall data for the study areas was sourced from the Mirboo North Water Board Station, from the Bureau of Meteorology website (www.bom.gov.au). Flow data for Narracan Creek was sourced from the Thorpdale Gauging Station site, from the Victoria Water Resource Data Warehouse website (www.vicwaterdata.net/vicwaterdata/home.aspx). The Mirboo North Water Board Station is approximately 6 km away from the Thorpdale Gauging Station. Insufficient rainfall and flow data was available for the Middle Creek study area during the sampling periods, so no data is presented. However, rainfall patterns are expected to be broadly similar between the two sites, which are approximately 25 km apart and both on the northern side of the Strzelecki Ranges.

12
Impacts of intensive agriculture and plantation forestry on water quality in the Latrobe catchment, Victoria
Figure 1. Location of sample sites in (a) Victoria, (b) the Latrobe catchment, (c) Narracan Creek sub-catchment and (d) Middle Creek sub-catchment
(a) (b)
(c) (d)
13
Impacts of intensive agriculture and plantation forestry on water quality in the Latrobe catchment, Victoria
Table 1. Sites sampled within the Latrobe catchment and associated analyses conducted at each. Coordinates are in GDA 94 datum
Site Code
Site Name Zone Easting Northing Site Type
Nutrients TDS & SS Pesticide & Metals Passive
Samplers
Algae In-situ cages
RBA Round 1 Round 2 Round 1 Round 2
Date Sampled
Dec-11 Mar-12 Dec-11 Jan-12
Mar-12 Dec-11 Jan-12
Dec-11 Jan-12
Mar-12 Mar-12 Apr-12
Mar-12
Potato Farming
UYL Narracan Creek at Fowkes Rd 55 420202 5764564 Control
UYN Narracan Creek South at Fischers Rd 55 422532 5762791 Control
UYM Tributary of Narracan Creek off Coalville Rd 55 435496 5768303 Control
UYX Tributary of Sunny Creek off Sunny Creek Rd
55 423215 5767794 Control
UYO Narracan Creek downstream Sunny Creek Rd
55 424587 5762873 Impact
UYQ Narracan Creek at Cooks Rd 55 426777 5763962 Impact
UYR Narracan Creek at Gillots Rd 55 428148 5764024 Impact
UYY Easterbrook Creek upstream of Childers-Thorpdale Rd
55 427739 5761948 Impact
UYP Tributary of Mann Creek at Schofields Rd 55 431616 5765583 Impact
UYV Mann Creek at Narracan-Connection Rd 55 431543 5765464 Impact
Plantation Forestry
UZD Tributary of Billy Creek in Morwell National Park
55 448677 5753938 Control
UYW Middle Creek south of Jumbuk 55 453885 5745711 Impact
UYZ Middle Creek downstream College Creek 55 450170 5746381 Impact
UZA Middle Creek at 4WD track off Upper Middle Creek Rd
55 447632 5747806 Impact
UVH Middle Creek west of Jumbuk at Middle Creek Rd Ford
55 446644 5749120 Impact
UZE Middle Creek upstream of Vagg Creek 55 445164 5750596 Impact
Latrobe River
UVI Latrobe River at Hawthorn Bridge 55 419770 5796982 Control
UVK Latrobe River at Rosedale 55 481772 5778367 Impact

14
Impacts of intensive agriculture and plantation forestry on water quality in the Latrobe catchment, Victoria
Water chemistry
Long term turbidity data for Narracan Creek
Gippsland Water extracts water from Narracan Creek to provide drinking water for Moe and nearby towns. Water is extracted downstream of the potato farming area at White’s Weir, immediately upstream of Falls Road, Narracan. Water is piped to the Gippsland Water plant in Moe, where turbidity is measured approximately hourly and is accurate up to 100 NTU. The lag time from Narracan Creek to the plant is less than 24 hours, meaning data collected remains relevant to conditions occurring in the creek. Gippsland Water provided turbidity data from April 2008 to September 2011. In order to examine the relationship of turbidity and rainfall, rainfall data was sourced from the Mirboo North Water Board Station via the Bureau of Meteorology website. This was the closest station with data available for that time period. Two years were examined more closely to assess the differences between drought and wet years. 2009 was representative of drought conditions, and 2011 provided data for the most recent wet year after extended drought broke in Victoria in 2010. (Note: no turbidity values were available for 27 August 2009 to 14 October 2009).
In situ nutrients and other water quality parameters
In situ water quality parameters were measured at sites during Round 2 sampling in March 2012. Electrical conductivity, dissolved oxygen, pH and water temperature were measured using a YSI Professional Plus water quality meter. Turbidity was measured using a HACH 2100P Portable Turbidimeter and alkalinity was measured by titration using a HACH Alkalinity Test Kit.
Water samples were collected from the water column in Round 1 and 2 following the methodology detailed in the Guideline for Environmental Management (EPA Victoria 2003b). Samples were stored appropriately (frozen or refrigerated) and later analysed by ALS Laboratory Group for total Kjeldahl nitrogen (TKN), nitrate plus nitrite (NOx), total phosphorus (TP), total dissolved solids (TDS), total suspended solids (TSS) and total petrol hydrocarbons (TPH). A brief description of the methods used is provided in appendix 1.
Pesticides
Spot samples of surface water were collected in 1 L acetone washed, amber glass bottles during both rounds of sampling. Department of Primary Industries (DPI) analysed samples for 115 possible pesticides, including organochlorines, synthetic pyrethroids, organophosphates, triazine and phenoxy herbicides, fipronil, sulfonylureas and fungicides. A brief description of the methods used and limits of reporting is provided in appendices 2 and 3.
Passive sampling
Passive sampling of pesticides was conducted at a number of sites to enable longer term monitoring of triazine herbicides, which may be missed in the two rounds of spot sampling. Chemcatcher passive samplers were used at seven sites; three sites on Narracan Creek (potato farming: UYL, UYN, UYR), two sites on Middle Creek (forestry: UYW, UVH) and two sites on the Latrobe River (UVI, UVK). Chemcatchers were deployed in December 2011 and retrieved in January 2012 (28 day deployment, Table 1). Field deployment and retrieval of passive samplers followed procedures and protocols used by DPI Future Farming Systems Research (FFSR). Analysis was limited to triazine herbicide compounds. In the Chemcatcher units, an Empore C18 disk was used as the receiving phase and a polyethersulfone (PES) membrane used as the diffusion-limiting membrane. A brief description of the equipment and method used for passive sampling is provided in appendix 4.
Sediment chemistry
Pesticides and heavy metals
Fine (<63 μm) depositional sediment samples were collected from Narracan Creek, Middle Creek and the Latrobe River in December 2011 and March 2012. Depositional sediment was collected with a shovel and filtered through a 63 µm nylon mesh net (Marshall et al. 2010). Sediments were allowed to settle in 20 L buckets and stored at 4 °C. The homogenised sediment was used for chemical anaylsis and laboratory toxicity testing. Sediment samples were analysed for nutrients, hydrocarbons, heavy metals and pesticides. Department of Primary Industries (DPI) analysed the sediment for 115 pesticides, including organochlorines, synthetic pyrethroids, organophosphates, triazine and phenoxy herbicides, fipronil, sulfonylureas and selected fungicides. A brief description of the methods used and limits of reporting is provided in appendices 2 and 3. ALS Laboratory Group analysed the sediment for 24 metals (aluminium – Al, antimony – Sb, arsenic – As, beryllium – Be, barium – Ba, boron – B, cadmium – Cd, chromium – Cr, cobalt – Co, copper – Cu, iron – Fe, lead – Pb, manganese – Mn, molybdenum – Mo, nickel – Ni, selenium – Se, silver – Ag, strontium – Sr, tin – Sn, vanadium – V, zinc – Zn, titanium – Ti, thallium – Tl, mercury – Hg) and hydrocarbons (C6-C36). A brief description of the methods used is provided in appendix 1.
Concentrations of pesticides (normalised to 1 per cent organic carbon where required) and metals in sediment samples were compared against the interim sediment quality guideline (ISQG) values as outlined in the Australian and New Zealand Guidelines for Fresh and Marine Water Quality (ANZECC/ARMCANZ 2000).
Toxicology
Phytotoxicity tests
Laboratory-based algal phytotoxicity tests were used to isolate the effect of contaminants in surface waters on a standard test species. This test involves assessment of toxicity by investigating the response of two endpoints, namely algal growth and algal photosynthesis, after exposure of algae to surface water samples. A range of the potato farming, forestry and Latrobe River sites were tested over three rounds; December 2011, January 2012 and March 2012.
15
Impacts of intensive agriculture and plantation forestry on water quality in the Latrobe catchment, Victoria
For algal bioassays, spot water samples (1 L) were collected from sites in pre-cleaned, glass amber bottles. Samples were transported back to the laboratory on ice where they were vacuum filtered (GF/C) to remove indigenous microalgae and stored in the dark at 4 oC. Sites with samples assessed for phytotoxicity are shown in Table 1.
A non-axenic culture of Scenedesmus sp. (provided by the Algal Phycology Laboratory, Monash University, Victoria) was used for all tests. Stock cultures were maintained in standard culture medium, known as MLA medium (Bolch and Blackburn 1996), at 25 °C on a 12 h light/12 h dark cycle, under an irradiance of 70 μmol photons m-1s-1 (cool white fluorescents). Generally a three day old culture was used for the inoculation in experiments.
Phytotoxicity tests were performed in 250 mL ERL flasks containing 70 mL of site water or 70 mL of MLA medium for controls. As nutrients are known to cause toxic effects to growth and photosynthesis in algae (Environment Canada 1992; USEPA 1994), the phytotoxicity tests were designed so we could distinguish any observed toxicity at a particular site between that caused by nutrients (a lack of) and that caused by other contaminants. Therefore, tests were performed simultaneously using 100 per cent site waters and 100 per cent site waters enriched with nutrients at the same concentration as in the MLA control medium. The temperature of test solutions was maintained at 25±1 oC during the test period. The pH and electrical conductivity (EC) of solutions was determined at the beginning of experiments and upon termination.
Toxicity tests were initiated by the addition of stock culture to test flasks to yield an initial cell density of 5x10⁴ cells/ml. Test flasks and controls, in triplicate, were incubated at 25 oC under a 12:12 h light dark cycle (cool white fluorescents) for 72 h. Each treatment and control was shaken by hand and re-randomised daily. Growth rates were determined from in vivo fluorescence measurements, taken daily. A 3.5 mL aliquot from each experimental flask was sampled to a spectrophotometer cell which was placed into a fluorescence spectrophotometer (Hitachi, model F2000) and steady state fluorescence measured. The relative growth rate was calculated as the slope of the linear regression of in-transformed fluorescence as a function of time (days). Photosynthetic activity was determined using the DCMU-induced fluorescence method involving measurement of in vivo chlorophyll fluorescence before and after the addition of a non-cyclic electron transport inhibitor – DCMU. After 72 h following the measurement of steady state fluorescence (Fo), 200 mL of DCMU (10 mM) was added to the spectrophotometer cell containing the sample, it was mixed and the maximal fluorescence measured (Fm). The photosynthetic activity was determined using the equation:
Fv/Fm = (Fo-Fm)/Fm
Blank measurements of site water were undertaken and values subtracted from Fo and Fm to account for sample background fluorescence.
Chironomus tepperi toxicity tests
Laboratory-based C. tepperi emergence tests were used to isolate the effect of sediment on a standard test species. Acute (survival) and chronic (total emergence and average emergence time) endpoints were measured.
The C. tepperi stock used in this study originated from temporary ponds at Yanco Agricultural Institute in New South Wales. The culture was maintained in aquaria containing ethanol-sterilised tissue paper as substrate in artificial water made from a modified version of Martins solution (Martin et al. 1980) (reverse osmosis water with 0.12 mM NaHCO3, 0.068 mM CaCl2, 0.083 mM MgSO4, 0.86 mM NaCl, 0.015 mM KH2PO4, 0.089 mM MgCl2 and 0.1 per cent (w/v) iron) at 21 ⁰C ± 1 ⁰C and a 16:8 h light:dark photoperiod. The culture was fed a slurry of ground fish food (Tetramin®) on alternate days after hatching. This mixture was also used in subsequent experiments. The methods used to determine survival, sub-lethal acute and chronic effects were modified from the OECD guidelines (2004) and Stevens et al. (1993). Emergence tests were carried out between February and May 2012.
For the emergence assay, 10 five day-old larvae were added to beakers containing 140 g (wet weight) of sieved sediment and 200 mL of artificial water, with four replicate beakers per test sediment and eight replicates of a laboratory control. Beakers were incubated for 15 days, during which laboratory controlled adult emergence must reach at least 80 per cent for the test to be valid and comparable to other tests at 21 ⁰C (16:8 h light:dark cycle, OECD 2004). The number of emerging adult C. tepperi was counted daily. Artificial water was renewed every second day and larvae were given food at each water change. Electrical conductivity, pH, dissolved oxygen and ammonia concentrations were measured at each water renewal during and at the end of the test. Copper (Cu) reference toxicity tests were also run for C. tepperi larvae from the same cultures used in the whole sediment toxicity testing, to assess whether the cultures were of appropriate sensitivity. Copper was used in this case as the survival response to this chemical had previously been characterised in the CAPIM laboratory for second instar C. tepperi larvae and is also used as a reference toxicant in routine sediment toxicity tests (Hai Doan, CSIRO Land & Water, personal communication).
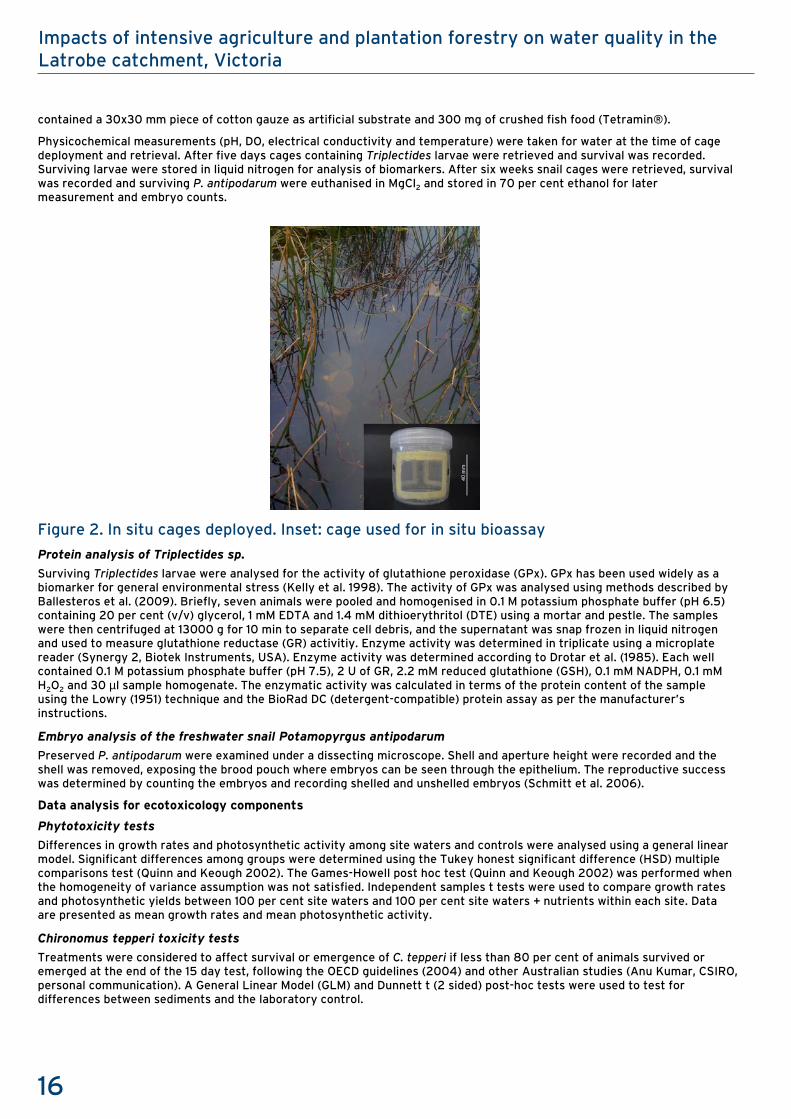
In situ cage tests – Potato farming
Cages containing caddis larvae (Triplectides sp.) collected from the Latrobe River, Hawthorn Bridge (UVI) or freshwater snails (Potamopyrgus antipodarum) from Cardinia Creek, Cardinia, were deployed at three Narracan Creek (potato farming) sites (UYL – control, UYQ – impact and UYR – impact) as well as at the Triplectides collection site (UVI). Triplectides larvae were exposed for five days and P. antipodarum were exposed for six weeks from 19 May 2012.
Cages were constructed from clear polypropylene screw top containers (500 ml) with 500 μm nylon mesh covering three side windows (40×50 mm) to allow water and oxygen flow (figure 3). Test organisms were sorted and randomly assigned to cages at the collection sites and transported in 20 L PVC buckets filled to the brim with site water to minimise translocation stress. Five replicate cages were deployed at each site containing 10 Triplectides larvae or 40 P. antipodarum. Each cage also
16
Impacts of intensive agriculture and plantation forestry on water quality in the Latrobe catchment, Victoria
contained a 30x30 mm piece of cotton gauze as artificial substrate and 300 mg of crushed fish food (Tetramin®).
Physicochemical measurements (pH, DO, electrical conductivity and temperature) were taken for water at the time of cage deployment and retrieval. After five days cages containing Triplectides larvae were retrieved and survival was recorded. Surviving larvae were stored in liquid nitrogen for analysis of biomarkers. After six weeks snail cages were retrieved, survival was recorded and surviving P. antipodarum were euthanised in MgCl2 and stored in 70 per cent ethanol for later measurement and embryo counts.
Figure 2. In situ cages deployed. Inset: cage used for in situ bioassay
Protein analysis of Triplectides sp.
Surviving Triplectides larvae were analysed for the activity of glutathione peroxidase (GPx). GPx has been used widely as a biomarker for general environmental stress (Kelly et al. 1998). The activity of GPx was analysed using methods described by Ballesteros et al. (2009). Briefly, seven animals were pooled and homogenised in 0.1 M potassium phosphate buffer (pH 6.5) containing 20 per cent (v/v) glycerol, 1 mM EDTA and 1.4 mM dithioerythritol (DTE) using a mortar and pestle. The samples were then centrifuged at 13000 g for 10 min to separate cell debris, and the supernatant was snap frozen in liquid nitrogen and used to measure glutathione reductase (GR) activitiy. Enzyme activity was determined in triplicate using a microplate reader (Synergy 2, Biotek Instruments, USA). Enzyme activity was determined according to Drotar et al. (1985). Each well contained 0.1 M potassium phosphate buffer (pH 7.5), 2 U of GR, 2.2 mM reduced glutathione (GSH), 0.1 mM NADPH, 0.1 mM H2O2 and 30 µl sample homogenate. The enzymatic activity was calculated in terms of the protein content of the sample using the Lowry (1951) technique and the BioRad DC (detergent-compatible) protein assay as per the manufacturer’s instructions.
Embryo analysis of the freshwater snail Potamopyrgus antipodarum
Preserved P. antipodarum were examined under a dissecting microscope. Shell and aperture height were recorded and the shell was removed, exposing the brood pouch where embryos can be seen through the epithelium. The reproductive success was determined by counting the embryos and recording shelled and unshelled embryos (Schmitt et al. 2006).
Data analysis for ecotoxicology components
Phytotoxicity tests
Differences in growth rates and photosynthetic activity among site waters and controls were analysed using a general linear model. Significant differences among groups were determined using the Tukey honest significant difference (HSD) multiple comparisons test (Quinn and Keough 2002). The Games-Howell post hoc test (Quinn and Keough 2002) was performed when the homogeneity of variance assumption was not satisfied. Independent samples t tests were used to compare growth rates and photosynthetic yields between 100 per cent site waters and 100 per cent site waters + nutrients within each site. Data are presented as mean growth rates and mean photosynthetic activity.
Chironomus tepperi toxicity tests
Treatments were considered to affect survival or emergence of C. tepperi if less than 80 per cent of animals survived or emerged at the end of the 15 day test, following the OECD guidelines (2004) and other Australian studies (Anu Kumar, CSIRO, personal communication). A General Linear Model (GLM) and Dunnett t (2 sided) post-hoc tests were used to test for differences between sediments and the laboratory control.

17
Impacts of intensive agriculture and plantation forestry on water quality in the Latrobe catchment, Victoria
In situ cage tests
Survival data from in situ cages were arc-sine square root transformed prior to statistical analysis. A General Linear Model (GLM) and Dunnett t (2 sided) post-hoc tests were used to test for differences in survival between sites and UVI as a control.
Enzyme activity of Triplectides sp. was considered affected if an over two-fold increase or decrease occurred compared to UVI.
Snail embryos were compared using a General Linear Model (GLM) and Dunnett t (2 sided) post-hoc tests to test for differences in survival between sites and UVI as the control.
In all tests, differences between sites in the post-hoc tests were considered significantly different if p<0.05. All data were checked to ensure that they conformed to the assumption of homogeneity of variance between groups and a normal distribution of residuals.
All analyses were conducted using SPSS 20.0 (Pearson Education).
Rapid bioassessment using macroinvertebrates
Aquatic macroinvertebrate communities can be used to investigate the health of waterways in a variety of ways using several different indices. In the current study, macroinvertebrate data was used to calculate six biological indices: AUSRIVAS, EPT, key families, SIGNAL1 (WoV), SIGNAL2 and taxa richness (table 2). The SIGNAL1 (Chessman 1995) system was revised by Chessman (2003) to produce the more refined SIGNAL2 system. SIGNAL1 calculations were performed in the current study for the purpose of comparison to the SEPP (WoV) environmental objectives which use SIGNAL1.
Macroinvertebrates were sampled in accordance with rapid bioassessment (RBA) methods for stream monitoring as described in the Guideline for Environmental Management (EPA Victoria 2003). A total of 14 sites were sampled during March 2012 (Table 1), providing single season (autumn) data. While assessment against the SEPP (WoV) biological objectives for rivers and streams (Table 3) requires the average of two seasons of RBA sampling (spring and autumn), the single season data collected in this study provides some insight into how the performance of these sites was tracking with respect to the relevant objectives.
Nine sites in the Narracan Creek study area (potato farming) were sampled, comprising of three control sites and six impact sites (Table 1). Five sites were sampled in the Middle Creek study area (forestry) (Table 1), and included four impact sites and one control site. To provide a wider catchment perspective, an additional control site was located on the upper Latrobe River. The impact Latrobe River site could not be sampled due to high flow conditions
Table 2. Description of biological indices assessed which incorporate macroinvertebrate community data.
Biological Indices Description
AUSRIVAS
Australian River Assessment Scheme; a rapid prediction system to assess the biological health of Australian rivers. The system compares the macroinvertebrates found at a site with the assemblage predicted to occur at that site in the absence of anthropogenic impacts (i.e. reference condition). Developed by Simpson and Norris (2000).
EPT The sum of families from the ephemeroptera, plecoptera and trichoptera orders of macroinvertebrates recorded at a site.
Key Families
The sum of families recorded at a site which is regarded as important in particular geographic regions of Victoria, as specified in the State Environment Protection Policy – Waters of Victoria (SEPP WoV).
SIGNAL1 (WoV)
Scoring system developed by Chessman (1995) for rating the tolerance of macroinvertebrates to disturbance, on a scale of 1 to 10. The SIGNAL1 score of an individual site is the average SIGNAL score of all taxa recorded at that site. The State Environment Protection Policy – Waters of Victoria (SEPP WoV) describes environment objectives using the SIGNAL1 system.
SIGNAL2 The revised version of SIGNAL1, developed by Chessman (2003).
Taxa richness The sum of individual taxa (family level) recorded at a site.

18
Impacts of intensive agriculture and plantation forestry on water quality in the Latrobe catchment, Victoria
Table 3. State Environment Protection Policy – Waters of Victoria (SEPP WoV) environmental quality objectives (biological) for rivers and streams.
REGION
INDICATOR
Number of families
SIGNAL index score
EPT index score
AUSRIVAS Key families combined habitat score
O/E score
Band
Forests A: includes all forestry sites and the Latrobe River control site
Riffle 21 6.0 9 0.87 A
22
Edge 22 5.7 7 0.86 A
Cleared Hills and Coastal Plains: includes all potato farming sites
Riffle 23 5.5 N/A 0.82 A
22
Edge 26 5.5 N/A 0.85 A
General pollution rankings
All sites were ranked in order of pollution disturbance utilising a range of chemistry and biota response variables. For each site four variables were utilised: proportion of pesticides present (water and sediment) of the total analysed for (115), the proportion of heavy metals exceeding the ISQG-low trigger level that was analysed for (24), SIGNAL2 score (converted to a percentage from a 1-10 scale) and chironomid emergence rates (%). Results for each site were averaged across the two sampling rounds. Where sites were only sampled in one round, these results were used. For any sites lacking data for either round in a given category, the average of all sites across that category was assigned to the site.
To enable all four variables to consistently follow the relationship of a higher ranking being inversely correlated with disturbance, the inverse proportions for the pesticides and heavy metals were used (i.e. the percentage of pesticides tested for that were not recorded at each site). For example, if a site on average recorded five of a possible 115 pesticides and did not record the remaining 110 pesticides, then the proportion used for ranking would be 110 out of 115 (95.7%). SIGNAL2 score and chironomid emergence inherently follow the correlation required. In order to standardise the scale of all four variables, data from each variable was normalised using the ‘normalise variables’ function in PRIMER version 6.1.15 (PRIMER-E Ltd 2012). This approach gives each variable equal weighting and removes differences in scale between variables by placing them on an equal scale of approximately -2 to +2. The overall ranking score is an average of these normalised values across the four variables, calculated for each site.

19
Impacts of intensive agriculture and plantation forestry on water quality in the Latrobe catchment, Victoria
Results Rainfall and stream flow data
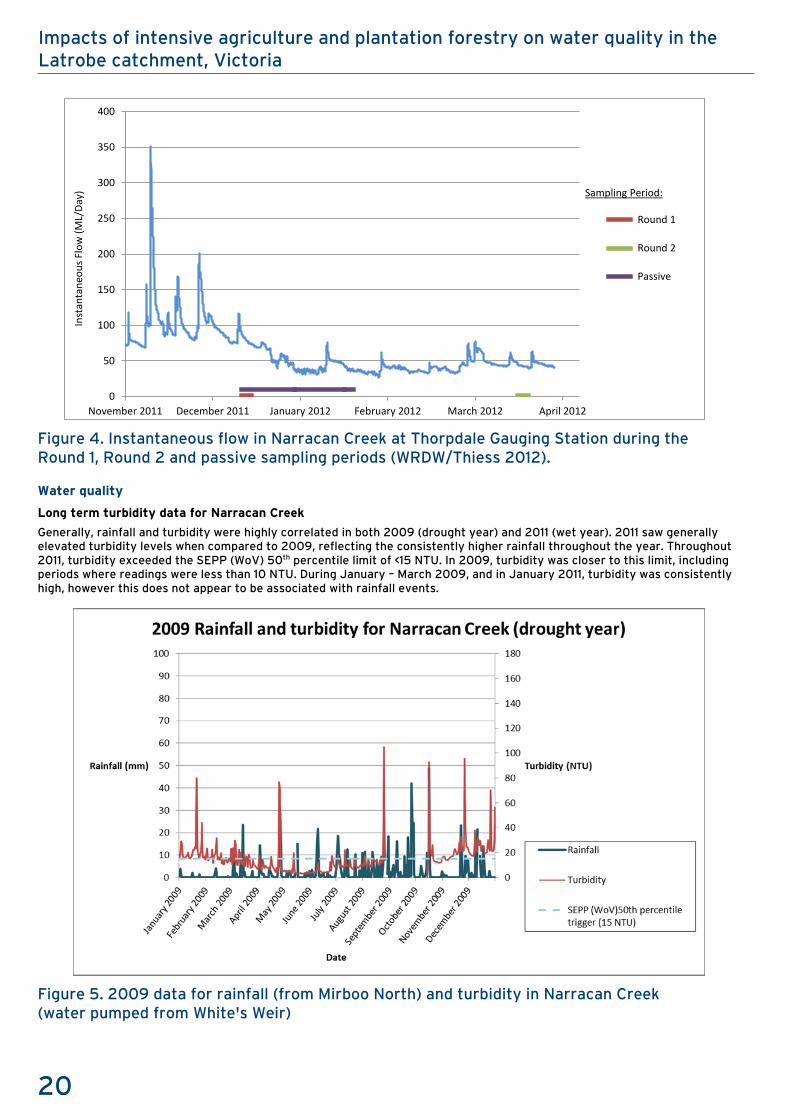
Daily rainfall within the study areas fluctuated considerably between the months of November 2011 and March 2012 (
Figure 3). November, the month prior to the Round 1 sampling period, experienced the highest monthly rainfall total (176 mm) during the study period. The lowest monthly rainfall total occurred in December (60 mm). During the Round 1 sampling period in December, 0.4 mm of rainfall was recorded, and 7.2 mm of rainfall was recorded during the Round 2 sampling in March. During the passive sampling period 88.2 mm of rainfall was recorded. No sampling was undertaken during February which recorded a monthly rainfall total of 81.4 mm.
Instantaneous flow in Narracan Creek also fluctuated considerably between the months of November 2011 and March 2012 (Figure 4). Flows were particularly high during the months of November (mean = 129 ML/Day, min = 69, max = 351) and December (mean = 69 ML/Day, min = 34, max = 116), which reflects the heavy rainfalls in November. Flows were much lower and less variable during the months of January (mean = 41 ML/Day, min = 27, max = 76), February (mean = 39 ML/Day, min = 32, max = 48) and March (mean = 48 ML/Day, min = 39, max = 77). Flows during the Round 1 sampling period were much higher than the flows during the Round 2 sampling period (Round 1: mean = 81 ML/Day, min = 73, max = 92; Round 2: mean ML/Day = 43, min = 41, max = 46).
Figure 3. Daily rainfall totals at Mirboo North during the Round 1, Round 2 and passive sampling periods (Mirboo North Water Board Station, BOM 2012).
0
5
10
15
20
25
30
35
40
45
50
November 2011 December 2011 January 2012 February 2012 March 2012 April 2012
Rain
fall
(mm
)
Round 1
Round 2
Passive
Sampling Period:
20
Impacts of intensive agriculture and plantation forestry on water quality in the Latrobe catchment, Victoria
Figure 4. Instantaneous flow in Narracan Creek at Thorpdale Gauging Station during the Round 1, Round 2 and passive sampling periods (WRDW/Thiess 2012).
Water quality
Long term turbidity data for Narracan Creek
Generally, rainfall and turbidity were highly correlated in both 2009 (drought year) and 2011 (wet year). 2011 saw generally elevated turbidity levels when compared to 2009, reflecting the consistently higher rainfall throughout the year. Throughout 2011, turbidity exceeded the SEPP (WoV) 50th percentile limit of <15 NTU. In 2009, turbidity was closer to this limit, including periods where readings were less than 10 NTU. During January – March 2009, and in January 2011, turbidity was consistently high, however this does not appear to be associated with rainfall events.
Figure 5. 2009 data for rainfall (from Mirboo North) and turbidity in Narracan Creek (water pumped from White's Weir)
0
50
100
150
200
250
300
350
400
November 2011 December 2011 January 2012 February 2012 March 2012 April 2012
Inst
anta
neou
s Flo
w (M
L/Da
y)
Round 1
Round 2
Passive
Sampling Period:

21
Impacts of intensive agriculture and plantation forestry on water quality in the Latrobe catchment, Victoria
Figure 6. 2011 data for rainfall (from Mirboo North) and turbidity in Narracan Creek (water pumped from White's Weir) In situ nutrients and other water quality parameters
In-situ water quality measurements were taken at sites during Round 2 sampling (Table 4). For most parameters, results were generally within typical environmental ranges. Turbidity was higher in the Narracan Creek catchment than the Middle Creek catchment. Interestingly, turbidity at the potato control sites (mean = 98 NTU) was elevated in comparison with the potato impact sites (mean = 16 NTU), however this was only based on a single sampling event.
Table 4. In situ water quality measurements (measured during Round 2 only). Site Code Site Type Alkalinity EC25 (µScm-1) DO (mgL-1) DO (%) pH Temperature (ᵒC) Turbidity (NTU)
Potato Farming
UYL Control 15 106 10.2 101.2 6.1 13.1 160
UYN Control 75 96 7.7 88.0 6.7 20.2 45
UYX Control 20 117 9.7 95.7 7 13.9 89
UYO Impact 25 739 9.1 97.6 6.9 17.1 14
UYQ Impact 20 114 8.6 96.0 6.7 19.3 21
UYR Impact 25 120 8.4 89.7 6.4 17.2 22
UYY Impact 35 167 6.5 68.5 6.5 16.5 6
UYP Impact 25 157 9.1 94.0 6.7 15.7 11
UYV Impact 150 174 8.9 93.7 6.7 16.6 22
Plantation Forestry
UZD Control 280 1055 9.4 88.4 7.9 11.6 1
UYW Impact 40 170 9.5 91.4 7.1 12.2 6
UYZ Impact 40 182 10.8 100.3 7.4 11 12
UVH Impact 80 212 9.6 95.7 7.5 14.5 9
UZE Impact 50 229 9.9 97.7 7.3 14.1 6
Latrobe River
UVI Control 15 61 9.3 95.9 6.8 16 13

22
Impacts of intensive agriculture and plantation forestry on water quality in the Latrobe catchment, Victoria
Concentrations of total oxidised nitrogen (NOx), total Kjeldahl nitrogen (TKN), total phosphorus (TP) measured in Round 1 only and total suspended solids (TSS) and total dissolved solids (TDS) were measured in Round 2 only and are shown in Table 5.
Across the potato farming sites in the Narracan Creek study area, concentrations of NOx for the impact sites ranged between 740–1200 µgL-1 compared to the control sites which ranged between 980–1000 µgL-1. Concentrations of TKN were similar across all sites ranging between 340–560 µgL-1, except for control site UYM which recorded the highest value, 770 µgL-1. TP concentrations were also similar across most sites ranging between 25–52 µgL-1, except for control site UYL and impact site UYV which recorded the highest values, 78 and 84 µgL-1 respectively. Concentrations of TSS were similar across most sites ranging between 12–39 mgL-1, except for control sites UYL and UYM which recorded the highest values, 140 and 120 mgL-1 respectively. TDS concentrations where somewhat similar across all sites, ranging between 50–120 mgL-1.
Across the plantation forestry sites in the Middle Creek study area, concentrations of NOx were much higher across impact sites, ranging from 650–1200 µgL-1, compared to the single control site which recorded a value of 330 µgL-1. TKN concentrations were similar across all sites ranging between 170–300 µgL-1. TP concentrations were similar across all sites ranging between 13–39 µgL-1. TSS concentrations were similar across all sites ranging between 120–140 µgL-1, except for control site UZD which had a recorded value of 490 µgL-1.
Nutrients (NOx, TKN, TP) at the downstream Latrobe site (impact) were higher than those recorded at the control site which is high up in the catchment. Concentrations of TKN and TP were highest at the Latrobe River impact site compared to any other site in Narracan and Middle Creeks. TSS and TDS were both higher at the Latrobe impact site than the control site.
Table 5. Concentration of nutrients, total suspended solids and total dissolved solids in stream surface waters sampled in Round 1 and 2 (NS - no sample was taken).
Site Code
Site Type NOx
(µgL-1)
TKN
(µgL-1)
TP
(µgL-1)
TSS
(mgL-1)
TDS
(mgL-1)
Date Sampled Dec-11 Mar-12
Potato Farming
UYL Control 980 560 78 140 72
UYN Control 1000 400 25 39 50
UYM Control 1000 770 45 NS NS
UYX Control NS NS NS 120 97
UYO Impact 1200 480 32 14 70
UYQ Impact 1200 420 38 29 72
UYR Impact 1200 470 49 30 68
UYY Impact NS NS NS 12 120
UYP Impact 740 340 52 20 88
UYV Impact 1100 470 84 20 100
Forestry
UZD Control 330 300 13 63 490
UYW Impact 650 170 35 7 120
UYZ Impact NS NS NS 24 120
UZA Impact 1000 200 21 NS NS
UVH Impact 1200 300 39 9 140
UZE Impact NS NS NS 10 130
Latrobe River
UVI Control 270 340 18 34 40
UVK Impact 330 1900 110 66 130
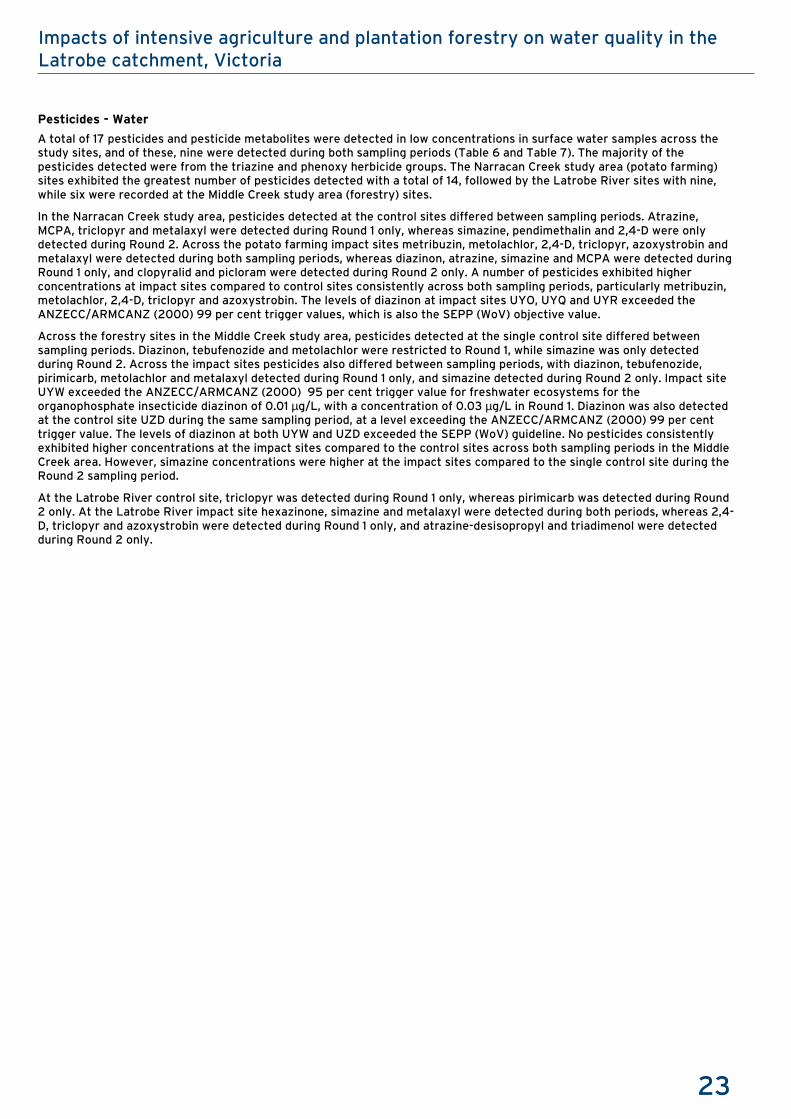
23
Impacts of intensive agriculture and plantation forestry on water quality in the Latrobe catchment, Victoria
Pesticides - Water
A total of 17 pesticides and pesticide metabolites were detected in low concentrations in surface water samples across the study sites, and of these, nine were detected during both sampling periods (Table 6 and Table 7). The majority of the pesticides detected were from the triazine and phenoxy herbicide groups. The Narracan Creek study area (potato farming) sites exhibited the greatest number of pesticides detected with a total of 14, followed by the Latrobe River sites with nine, while six were recorded at the Middle Creek study area (forestry) sites.
In the Narracan Creek study area, pesticides detected at the control sites differed between sampling periods. Atrazine, MCPA, triclopyr and metalaxyl were detected during Round 1 only, whereas simazine, pendimethalin and 2,4-D were only detected during Round 2. Across the potato farming impact sites metribuzin, metolachlor, 2,4-D, triclopyr, azoxystrobin and metalaxyl were detected during both sampling periods, whereas diazinon, atrazine, simazine and MCPA were detected during Round 1 only, and clopyralid and picloram were detected during Round 2 only. A number of pesticides exhibited higher concentrations at impact sites compared to control sites consistently across both sampling periods, particularly metribuzin, metolachlor, 2,4-D, triclopyr and azoxystrobin. The levels of diazinon at impact sites UYO, UYQ and UYR exceeded the ANZECC/ARMCANZ (2000) 99 per cent trigger values, which is also the SEPP (WoV) objective value.
Across the forestry sites in the Middle Creek study area, pesticides detected at the single control site differed between sampling periods. Diazinon, tebufenozide and metolachlor were restricted to Round 1, while simazine was only detected during Round 2. Across the impact sites pesticides also differed between sampling periods, with diazinon, tebufenozide, pirimicarb, metolachlor and metalaxyl detected during Round 1 only, and simazine detected during Round 2 only. Impact site UYW exceeded the ANZECC/ARMCANZ (2000) 95 per cent trigger value for freshwater ecosystems for the organophosphate insecticide diazinon of 0.01 µg/L, with a concentration of 0.03 µg/L in Round 1. Diazinon was also detected at the control site UZD during the same sampling period, at a level exceeding the ANZECC/ARMCANZ (2000) 99 per cent trigger value. The levels of diazinon at both UYW and UZD exceeded the SEPP (WoV) guideline. No pesticides consistently exhibited higher concentrations at the impact sites compared to the control sites across both sampling periods in the Middle Creek area. However, simazine concentrations were higher at the impact sites compared to the single control site during the Round 2 sampling period.
At the Latrobe River control site, triclopyr was detected during Round 1 only, whereas pirimicarb was detected during Round 2 only. At the Latrobe River impact site hexazinone, simazine and metalaxyl were detected during both periods, whereas 2,4-D, triclopyr and azoxystrobin were detected during Round 1 only, and atrazine-desisopropyl and triadimenol were detected during Round 2 only.

24
Impacts of intensive agriculture and plantation forestry on water quality in the Latrobe catchment, Victoria
Table 6. Round 1 concentrations of pesticides found in surface waters (µg/L). Red text signifies a pesticide was detected, cells highlighted in yellow signify a level at or exceeding the ANZECC/ARMCANZ (2000) 95 per cent trigger value, cells highlighted in orange signify a level exceeding the NHMRC human health value (drinking water standard), LR - ‘low reliability’ trigger value is used when a ANZECC/ARMCANZ trigger value is not available, ID – insufficient data to develop a trigger value, HC5 – level suggested by Maltby et al. (2009) for fungicides which is comparable to the ANZECC/ARMCANZ 95 per cent trigger values (no listings for fungicides).
Site Code
Site Type Organo-
phosphate Insecticide Insecticide
Carbamate Insecticide
Triazine Herbicide Phenoxy Herbicide Fungicide
Diazinon Tebufenozide Pirimicarb Atrazine Hexazinone Metribuzin Simazine Metolachlor 2,4-D MCPA Triclopyr Azoxystrobin Metalaxyl
Potato Farming
UYL Control <0.002 <0.002 <0.002 0.003 <0.005 <0.005 <0.005 <0.005 <0.005 <0.01 <0.02 <0.002 <0.002
UYN Control <0.002 <0.002 <0.002 <0.003 <0.005 <0.005 <0.005 <0.005 <0.005 <0.01 <0.02 <0.002 0.002
UYM Control <0.002 <0.002 <0.002 0.003 <0.005 <0.005 <0.005 <0.005 <0.005 0.019 TRACE <0.002 0.002
UYO Impact 0.008 <0.002 <0.002 <0.003 <0.005 <0.005 0.012 0.005 0.005 <0.01 <0.02 0.002 <0.002
UYQ Impact 0.002 <0.002 <0.002 <0.003 <0.005 0.072 <0.005 <0.005 0.023 0.076 0.217 0.002 <0.002
UYR Impact 0.002 <0.002 <0.002 0.003 <0.005 0.069 <0.005 <0.005 0.028 0.072 0.261 <0.002 <0.002
UYP Impact <0.002 <0.002 <0.002 <0.003 <0.005 <0.005 <0.005 <0.005 0.237 <0.01 0.051 0.016 0.002
UYV Impact <0.002 <0.002 <0.002 <0.003 <0.005 0.162 <0.005 <0.005 <0.005 <0.01 <0.02 0.006 0.002
Forestry
UZD Control 0.004 0.002 <0.002 <0.003 <0.005 <0.005 <0.005 0.006 <0.005 <0.01 <0.02 <0.002 <0.002
UYW Impact 0.03 <0.002 <0.002 <0.003 <0.005 <0.005 <0.005 TRACE <0.005 <0.01 <0.02 <0.002 <0.002
UZA Impact <0.002 <0.002 0.002 <0.003 <0.005 <0.005 <0.005 <0.005 <0.005 <0.01 <0.02 <0.002 0.004
UVH Impact <0.002 <0.002 <0.002 <0.003 <0.005 <0.005 <0.005 <0.005 <0.005 <0.01 <0.02 <0.002 <0.002
Latrobe River
UVI Control <0.002 <0.002 <0.002 <0.003 <0.005 <0.005 <0.005 <0.005 <0.005 <0.01 0.046 <0.002 <0.002
UVK Impact <0.002 <0.002 <0.002 <0.003 0.027 <0.005 0.01 <0.005 0.006 <0.01 0.026 0.002 0.002 ANZECC/ARMCANZ 99% trigger value 0.00003 0.7 75 (LR) 0.2 0.02 (LR) 140 1.4(LR) 1.4 (LR)
ANZECC/ARMCANZ 95% trigger value 0.01 13 3.2 280 42 (HC5)
NHMRC human health value 4 7 20 400 70 20 300 30 40 20
Currently registered for potato crops by APVMA Yes Yes Yes Yes Yes Yes Yes Yes
Currently registered for forestry by APVMA Yes Yes

25
Impacts of intensive agriculture and plantation forestry on water quality in the Latrobe catchment, Victoria
Table 7. Round 2 concentrations of pesticides found in surface waters (µg/L). Red text signifies a pesticide was detected, cells highlighted in yellow signify a level at or exceeding the ANZECC/ARMCANZ (2000) 95 per cent trigger value, cells highlighted in orange signify a level exceeding the NHMRC human health value (drinking water standard), LR - ‘low reliability’ trigger value is used when a ANZECC/ARMCANZ trigger value is not available, ID – insufficient data to develop a trigger value, HC5 – level suggested by Maltby et al. (2009) for fungicides which is hazardous to five per cent of species, comparable to the ANZECC/ARMCANZ 95 per cent trigger values (no listings for fungicides).
Site Code
Site Type Insecticide Triazine Herbicide Herbicide Phenoxy Herbicide Fungicide
Pirimicarb Atrazine-
desisopropyl Hexazin-one Metribuzin Simazine Metolachlor Pendime-thalin 2,4-D Clopyralid Picloram Triclopyr
Azoxystr-obin
Metal-axyl
Triadim-enol
Potato Farming - Narracan Creek Sub-Catchment
UYL Control <0.002 <0.005 <0.005 <0.005 <0.005 <0.005 TRACE <0.005 <0.4 <0.8 <0.02 <0.002 <0.002 <0.002
UYN Control <0.002 <0.005 <0.005 <0.005 <0.005 <0.005 TRACE 0.018 <0.4 <0.8 <0.02 <0.002 <0.002 <0.002
UYX Control <0.002 <0.005 <0.005 <0.005 TRACE <0.005 <0.05 <0.005 <0.4 <0.8 <0.02 <0.002 <0.002 <0.002
UYO Impact <0.002 <0.005 <0.005 <0.005 <0.005 <0.005 <0.05 <0.005 <0.4 <0.8 0.022 0.002 <0.002 <0.002
UYQ Impact <0.002 <0.005 <0.005 <0.005 <0.005 TRACE <0.05 <0.005 <0.4 <0.8 TRACE <0.002 <0.002 <0.002
UYR Impact <0.002 <0.005 <0.005 <0.005 <0.005 0.011 <0.05 <0.005 <0.4 <0.8 <0.02 TRACE TRACE <0.002
UYP Impact <0.002 <0.005 <0.005 <0.005 <0.005 <0.005 <0.05 0.037 TRACE 1.02 2.03 0.002 <0.002 <0.002
UYV Impact <0.002 <0.005 <0.005 0.056 <0.005 <0.005 <0.05 <0.005 <0.4 <0.8 <0.02 TRACE TRACE <0.002
UYY Impact <0.002 <0.005 <0.005 <0.005 <0.005 <0.005 <0.05 <0.005 <0.4 <0.8 0.026 0.021 0.021 <0.002
Forestry - Middle Creek Sub-Catchment
UZD Control <0.002 <0.005 <0.005 <0.005 0.007 <0.005 <0.05 <0.005 <0.4 <0.8 <0.02 <0.002 <0.002 <0.002
UVH Impact <0.002 <0.005 <0.005 <0.005 <0.005 <0.005 <0.05 <0.005 <0.4 <0.8 <0.02 <0.002 <0.002 <0.002
UYW Impact <0.002 <0.005 <0.005 <0.005 0.042 <0.005 <0.05 <0.005 <0.4 <0.8 <0.02 <0.002 <0.002 <0.002
UYZ Impact <0.002 <0.005 <0.005 <0.005 0.062 <0.005 <0.05 <0.005 <0.4 <0.8 <0.02 <0.002 <0.002 <0.002
UZE Impact <0.002 <0.005 <0.005 <0.005 <0.005 <0.005 <0.05 <0.005 <0.4 <0.8 <0.02 <0.002 <0.002 <0.002
Latrobe River
UVI Control 0.005 <0.005 <0.005 <0.005 <0.005 <0.005 <0.05 <0.005 <0.4 <0.8 <0.02 <0.002 <0.002 <0.002
UVK Impact <0.002 TRACE 0.025 <0.005 0.032 <0.005 <0.05 <0.005 <0.4 <0.8 <0.02 <0.002 TRACE TRACE ANZECC/ARMCANZ 99% trigger value 75 (LR) 0.2 0.02 (LR) 140
ANZECC/ARMCANZ 95% trigger value 3.2 280 42 (HC5)
NHMRC human health value 7 400 20 300 400 30 2000 300 20 Currently registered for potato crops by APVMA Yes Yes Yes Yes Yes
Currently registered for forestry by APVMA Yes Yes Yes Yes

26
Impacts of intensive agriculture and plantation forestry on water quality in the Latrobe catchment, Victoria
Passive sampling
A total of four triazine herbicides and two metabolites were detected in the Chemcatcher sampler extracts (table 8). Atrazine-desisopropyl and atrazine-2-hydroxy were observed in the Chemcatcher extracts but not in the spot water samples. Atrazine, simazine and metolachlor were detected in the potato farming area in Narracan Creek, while no herbicides were detected in the Chemcatcher extracts in the forestry study area in Middle Creek. Most of the triazine herbicides were detected at the bottom of the catchment in the Latrobe River impact site (UVK), with high concentrations of simazine and hexazinone (table 8). As the concentrations detected are cumulative over the 28 day period, they cannot be assessed against any guidelines.
Table 8. Amount of triazine herbicides in surface waters (total ng) detected in passive samplers (Chemcatchers) over a 28 day period (December 2011 - January 2012). Red text signifies a pesticide was detected.
Site Code Site Type Triazine Herbicide
Atrazine-desisopropyl
Atrazine-2-hydroxy
Atrazine Simazine Hexazinone Metolachlor
Potato Farming
UYL Control <0.5 <0.5 <0.5 0.5 <0.5 <0.3
UYN Control <0.5 <0.5 0.8 <0.3 <0.5 <0.3
UYR Impact <0.5 1.2 <0.5 <0.3 <0.5 0.3
Forestry
UYW Impact <0.5 <0.5 <0.5 <0.3 <0.5 <0.3
UVH Impact <0.5 <0.5 <0.5 <0.3 <0.5 <0.3
Latrobe River
UVI Control <0.5 <0.5 <0.5 <0.3 <0.5 <0.3
UVK Impact 0.5 0.8 <0.5 36.1 20.6 0.4
Currently registered for potato crops by APVMA Yes Yes
Currently registered for forestry by APVMA Yes
Sediment chemistry
Nutrients and hydrocarbons
The sediment concentrations of nutrients, carbon and hydrocarbons were analysed for Round 1 and 2 (table 9 and table 10).
During Round 1, oxidised nitrogen (NOx) was only detected at a single site (UYO, potato farming impact). However, in Round 2 oxidised nitrogen was recorded at the majority of sites. Total Kjeldahl nitrogen (TKN) was detected across all sites over both rounds. TKN levels ranged between 3170 mg/kg at UYM (potato farming control) and 5790 mg/kg at UYQ (potato farming impact) during Round 1. A wider range of TKN figures were recorded in Round 2 from 1600 mg/kg at UVK (Latrobe River, impact) to 10900 mg/kg at UVH (forestry - impact). Total phosphorus (TP) was also detected across all of the sites over both rounds. During Round 1 TP ranged from 265 mg/kg at UYN (potato farming control) to 672 mg/kg at UYV (potato farming impact). In Round 2 TP ranged from 366 mg/kg at UYX (potato farming control) to 1040 mg/kg at UVH (forestry - impact). TP results across all sites were on average higher in Round 2 (mean = 645) than Round 1 (mean = 533).
No detectable concentrations of total petrol hydrocarbons (TPH) were found at the potato farming control sites, while the impact sites ranged between 110–340 mg/kg during Round 1. Of the forestry and Latrobe River sites, the forestry control site (UZD) recorded the highest TPH value over both rounds. In Round 2, only three sites, one from each study area, recorded a TPH value.

27
Impacts of intensive agriculture and plantation forestry on water quality in the Latrobe catchment, Victoria
Table 9. Round 1 concentrations of nutrients, carbon and hydrocarbons found in stream sediment (mg/kg dry weight).
Site Code Site Type NOx TKN TP TOC (%) TPH
Potato Farming
UYL Control <0.1 3850 503 3.4 <50
UYN Control <0.1 5540 265 5.15 <50
UYM Control <0.1 3170 468 2.38 <50
UYO Impact 0.6 4580 557 3.76 120
UYQ Impact <0.1 5790 606 4.44 130
UYR Impact <0.1 4820 583 4.5 140
UYP Impact <0.1 4490 574 3.05 340
UYV Impact <0.1 4690 672 4.18 110
Forestry
UZD Control <0.1 3220 538 2.76 440
UYW Impact <0.1 4840 565 4.52 <50
UZA Impact <0.1 4540 582 4.38 110
UVH Impact <0.1 4510 592 3.8 110
Latrobe River
UVI Control <0.1 5340 461 7.32 400
UVK Impact <0.1 2040 496 2 250
Table 10. Round 2 concentrations of nutrients, carbon and hydrocarbons found in stream sediment (mg/kg dry weight unless specified).
Site Code Site Type NOx TKN TP TOC (%) TPH
Potato Farming
UYL Control < 0.1 2860 444 3.02 < 50
UYN Control 0.4 2870 389 4.59 < 50
UYX Control 0.5 2320 366 2.34 < 50
UYO Impact 0.4 6030 987 3.58 < 50
UYQ Impact 0.4 4510 638 3.58 < 50
UYR Impact 0.2 3430 709 3.04 < 50
UYY Impact 1.6 5180 885 4.86 290
UYP Impact 0.9 4160 740 2.56 < 50
UYV Impact 0.4 3860 696 4.4 < 50
Forestry
UZD Control 0.9 6160 748 5.12 440
UYW Impact 1.5 3230 561 3.16 < 50
UYZ Impact 0.6 2750 402 3.28 < 50
UVH Impact 1 10900 1040 3.17 < 50
UZE Impact 0.2 2680 464 3.02 < 50
Latrobe River
UVI Control 1.5 8210 717 7.06 340
UVK Impact 0.4 1600 527 1.54 < 50

28
Impacts of intensive agriculture and plantation forestry on water quality in the Latrobe catchment, Victoria
Sediments – Heavy metals
A total of 18 heavy metals were detected in the sediments during both sampling rounds (table 11 and table 12). Across all sites arsenic, copper, lead and zinc were in low concentrations, below the ANZECC/ARMCANZ (2000) Interim Sediment Quality guidelines (ISQG), suggesting these metal concentrations are unlikely to be having a detrimental effect on the aquatic fauna at these sites. Furthermore, concentrations of molybdenum, selenium, silver, tin and thallium were below the detectable limits.
Mercury was present at all sites, except at the potato farming control site UYL and was highest at the potato farming impact site UYP (above the ISQG-low guidelines) during both sampling rounds (table 11 and table 12).
Antimony concentrations exceeded the ISQG-low trigger value at potato farming sites UYL (control) in December 2011 and UYY (impact) in Round 2. Antimony can occur naturally in rocks and soils (ANZECC/ARMCANZ 2000) and its detection at a largely unimpacted control site suggests it is not of concern. In both rounds chromium concentrations were above the ISQG-low trigger value at the potato farming impact sites UYP and UYV. Across all potato farming impact sites nickel concentrations were above the ISQG-low trigger value (except site UYO in March 2012), with site UYP above the ISQG-high trigger value.
Metals were in low concentration (i.e. below ISQG-low trigger values) throughout the forestry study area, with the exception of antimony at site UZE (impact) in Round 1 and mercury at sites UZA (impact) and UZD (control) in December 2011, which exceeded the ISQG-low trigger values. In the Latrobe River, mercury concentrations were above the ISQG-low guideline at the impact site UVK

29
Impacts of intensive agriculture and plantation forestry on water quality in the Latrobe catchment, Victoria
Table 11. Round 1 concentrations of heavy metals found in stream sediment (mg/kg). (Molybdenum, selenium, silver, tin and thallium were below the detectable limits. Note: SEPP (WoV) objective for all sites is <ISQG-low).
Site Code Site Type Al As Ba Be Cd Co Cr Cu Fe Hg Mn Ni Pb Sb Sr Ti V Zn
Potato Farming
UYL Control 18600 5 120 <1 <1 8 11 17 27900 <0.1 446 8 13 6 49 40 40 47
UYN Control 24300 6 70 <1 <1 15 42 17 45400 0.2 305 15 13 <5 30 80 73 46
UYM Control 15100 <5 140 <1 <1 21 24 21 32100 0.1 1190 13 11 <5 56 50 51 56
UYO Impact 32800 7 70 <1 <1 11 66 25 51000 0.2 506 24 11 <5 30 330 100 38
UYQ Impact 26600 7 100 <1 <1 18 60 25 54600 0.2 758 28 11 <5 35 400 88 56
UYR Impact 22400 5 110 <1 <1 18 54 23 52400 0.2 808 24 10 <5 41 430 78 60
UYP Impact 39100 8 150 2 1 48 96 46 66800 0.4 962 61 7 <5 34 1370 133 68
UYV Impact 38900 8 90 1 <1 22 101 38 60100 0.2 900 39 10 <5 28 900 142 51
Forestry
UZD Control 12200 <5 120 <1 <1 11 17 12 22100 0.2 456 11 11 <5 39 200 31 53
UYW Impact 19300 6 170 <1 <1 12 12 23 29700 0.1 649 13 15 <5 65 80 37 69
UZA Impact 18400 6 150 <1 <1 12 10 19 30100 0.2 977 10 13 <5 71 180 42 60
UVH Impact 17500 6 150 <1 <1 12 10 21 29300 0.1 820 10 15 <5 65 130 40 61
Latrobe River
UVI Control 20200 <5 330 3 <1 10 34 16 21300 0.1 334 17 17 <5 27 850 38 73
UVK Impact 11200 <5 150 1 <1 14 24 13 27200 0.2 492 15 12 <5 26 220 33 66
ISQG-low trigger value 20 1.5 80 65 0.15 21 50 2 200
ISQG-high trigger value 70 10 370 270 1 52 220 25 410

30
Impacts of intensive agriculture and plantation forestry on water quality in the Latrobe catchment, Victoria
Table 12. Round 2 concentrations of heavy metals found in stream sediment (mg/kg dry weight). (Molybdenum, selenium, silver, tin and thallium were below the detectable limits. Note: SEPP (WoV) objective for all sites is <ISQG-low).
Site Code Site Type Al As Ba Be Cd Co Cr Cu Fe Hg Mn Ni Pb Sb Sr Ti V Zn
Potato Farming
UYL Control 15600 < 5 130 < 1 < 1 8 10 16 25900 < 0.1 440 9 12 < 5 48 70 35 54
UYN Control 19800 < 5 70 < 1 < 1 13 35 16 41800 0.1 299 14 13 < 5 30 100 65 52
UYX Control 9970 < 5 120 < 1 < 1 14 11 15 20200 0.2 406 9 9 < 5 46 60 25 48
UYO Impact 26700 < 5 80 < 1 < 1 10 60 24 55400 0.1 467 19 11 < 5 27 310 90 39
UYQ Impact 20400 < 5 110 < 1 < 1 22 52 22 51800 0.2 1330 25 11 < 5 28 540 77 64
UYR Impact 18500 < 5 110 < 1 < 1 19 48 20 47700 0.2 970 24 10 < 5 36 460 69 59
UYY Impact 22600 < 5 140 1 2 32 70 30 17600 0.1 2270 36 8 9 40 480 115 63
UYP Impact 35800 < 5 140 2 < 1 44 98 53 9430 0.3 786 62 7 < 5 34 1600 142 80
UYV Impact 32700 < 5 120 1 < 1 27 100 41 7040 0.1 987 43 9 < 5 38 1060 139 65
Forestry
UZD Control 12700 < 5 100 < 1 < 1 8 7 16 19900 < 0.1 425 6 11 < 5 120 260 33 50
UYW Impact 20200 5 180 1 < 1 14 14 26 36200 0.1 581 15 18 < 5 62 140 43 84
UYZ Impact 18400 < 5 160 < 1 < 1 14 12 21 34600 < 0.1 878 12 15 < 5 59 150 43 74
UVH Impact 18300 6 180 < 1 < 1 14 11 23 36000 0.1 960 11 16 < 5 74 180 44 74
UZE Impact 15900 < 5 150 < 1 < 1 12 10 22 30500 < 0.1 517 10 15 19 56 150 39 70
Latrobe River
UVI Control 22000 5 380 3 < 1 13 36 18 26600 0.1 556 18 19 < 5 36 870 43 82
UVK Impact 11400 < 5 150 1 < 1 14 22 13 25000 0.2 549 14 13 < 5 24 220 32 68
ISQG-low trigger value 20 1.5 80 65 0.15 21 50 2 200
ISQG-high trigger value 70 10 370 270 1 52 220 25 410

31
Impacts of intensive agriculture and plantation forestry on water quality in the Latrobe catchment, Victoria
Sediments – Pesticides
A total of 14 pesticides were detected in sediment samples across the study sites, and of these, three were present during both sampling rounds (table 13 and table 14). The potato farming sites exhibited the greatest number of different pesticides detected with a total of 10, followed by the forestry sites with five, and none were detected from the Latrobe River sites.
A number of historically used organochlorine pesticides in various forms were detected across the potato farming sites, namely DDT and its metabolite forms of DDD and DDE. Levels of DDE, and consequently total DDT, at three potato farming impact sites (UYO, UYQ and UYY) exceeded the ISQG-low trigger values. Of the forestry sites organochlorines were only recorded at the impact site UZD, where DDE and dieldrin were recorded in Round 1 only. The level of dieldrin and total DDT exceeded the ISQG-low trigger values.
Traces and small amounts of a variety of other pesticides were found throughout the potato farming study area and a few were found in the forestry study area. Pesticides that are registered for use in potato farming were more prevalent across the impact sites in December 2011 compared to March 2012. In the forestry study area, results of particular note were the presence of simazine at two forestry impact sites (UYW and UYZ) and a trace of the fungicide tebuconazole also at a forestry impact site (UVH).

32
Impacts of intensive agriculture and plantation forestry on water quality in the Latrobe catchment, Victoria
Table 13. Round 1 concentrations of pesticides found in stream sediment (µg/kg dry weight). * Indicates historical pesticides that are now prohibited in Australia under the Stockholm Convention (United Nations 2012). Note: SEPP (WoV) objective for all sites is <ISQG-low.
Site Code Site Type
Organochlorine Pesticide* Organophosphate
Insecticide Insecticide
Triazine Herbicide
Phenoxy Herbicide Fungicide
p,p'-DDE
p,p'-DDE (1% carbon)
Dieldrin Dieldrin
(1% carbon) Oxychl-ordane
Total DDT (1%
carbon)
Diazinon Imidacloprid Simazine 2,4-D MCPA Azoxystrobin
Potato Farming
UYL Control <3 - <4 - <4 - <1 <5 <5 <0.01 <0.01 <1
UYN Control <3 - <4 - <4 - <1 <5 <5 <0.01 <0.01 <1
UYM Control TRACE TRACE <4 - <4 TRACE <1 <5 <5 <0.01 <0.01 <1
UYO Impact 10 3 <4 - <4 3 <1 <5 <5 TRACE TRACE <1
UYQ Impact 9 2 <4 - <4 2 TRACE <5 <5 <0.01 <0.01 <1
UYR Impact 6 1 <4 - <4 1 <1 <5 <5 TRACE <0.01 <1
UYP Impact 3 1 <4 - <4 1 <1 <5 <5 0.011 <0.01 <1
UYV Impact TRACE TRACE <4 - <4 TRACE <1 5 <5 <0.01 <0.01 5
Forestry
UZD Control 6 2 8 3 <4 2 <1 <5 TRACE <0.01 <0.01 <1
UYW Impact <3 - <4 - 4 - <1 <5 <5 <0.01 <0.01 <1
UZA Impact <3 - <4 - 6 - <1 <5 <5 <0.01 <0.01 <1
UVH Impact <3 - <4 - <4 - <1 <5 <5 <0.01 <0.01 <1
Latrobe River
UVI Control NA - NA NA NA - NA NA NA NA NA NA
UVK Impact <3 - <4 - <4 - <1 <5 <5 <0.01 <0.01 <1
ISQG-low trigger value 2.2 0.02 1.6
ISQG-high trigger value 27 8 46 Currently registered for potato crops by APVMA Yes Yes Yes Yes
Currently registered for forestry by APVMA Yes

33
Impacts of intensive agriculture and plantation forestry on water quality in the Latrobe catchment, Victoria
Table 14. Round 2 concentrations of pesticides found in stream sediment (µg/kg dry weight). * Indicates historical pesticides that are now prohibited in Australia under the Stockholm Convention (United Nations 2012). Note: SEPP (WoV) objective for all sites is <ISQG-low.
Site Code
Site Type
Organochlorine Pesticide* Triazine Herbicide Phenoxy Herbicide
Fungicide
p,p'-DDE
p,p'-DDE (1%
carbon)
p,p'-DDD
p,p'- DDT
Total DDT (1% carbon)
Simazine Metolachlor 2,4-D Azoxystrobin Myclobutanil Tebuconazole
Potato Farming - Narracan Creek Sub-Catchment
UYL Control <3 - <5 <5 - <5 <10 <2 <1 <2 <4
UYN Control 3 1 TRACE TRACE 1 <5 <10 <2 <1 <2 <4
UYX Control <3 - <5 <5 - <5 <10 <2 <1 <2 <4
UYO Impact 16 4 TRACE <5 4 <5 <10 <2 <1 <2 <4
UYQ Impact 8 2 <5 <5 2 <5 TRACE <2 <1 <2 <4
UYR Impact 4 1 <5 <5 1 <5 <10 <2 <1 <2 <4
UYP Impact <3 - <5 <5 - <5 <10 <2 <1 <2 <4
UYV Impact <3 - <5 <5 - <5 <10 <2 1 <2 <4
UYY Impact 16 3 <5 <5 3 <5 <10 TRACE 2 TRACE <4
Forestry - Middle Creek Sub-Catchment
UZD Control <3 - <5 <5 - <5 <10 <2 <1 <2 <4
UVH Impact <3 - <5 <5 - <5 <10 <2 <1 <2 TRACE
UYW Impact <3 - <5 <5 - 50 <10 <2 <1 <2 <4
UYZ Impact <3 - <5 <5 - 30 <10 <2 <1 <2 <4
UZE Impact <3 - <5 <5 - <5 <10 <2 <1 <2 <4
Latrobe River
UVI Control <3 - <5 <5 - <5 <10 <2 <1 <2 <4
UVK Impact <3 - <5 <5 - <5 <10 <2 <1 <2 <4
ISQG-low trigger value 2.2 1.6
ISQG-high trigger value 27 46 Currently registered for potato crops by APVMA Yes Yes Yes
Currently registered for forestry by APVMA Yes

34
Impacts of intensive agriculture and plantation forestry on water quality in the Latrobe catchment, Victoria
Toxicology
Phytotoxicity
The pH of test chambers ranged from 7.89 to 9.12 during December tests, 7.47 to 8.64 in the January tests and 7.9 to 8.92 during March tests. The pH in any one test replicate did not vary by more than one pH unit during the test. The conductivity ranged from 27 to 162 µS/cm for site waters during December testing, 30 to 162 µS/cm for January and 67 to 833 µS/cm during March testing.
Growth and photosynthesis responses for Scenedesmus sp. exposed to site waters sampled during December 2011 are shown in figure 7. Growth at all sites in both study areas and in the Latrobe River was reduced compared to the laboratory control for 100 per cent site waters, however this was not significant (ANOVA, P>0.05). The addition of nutrients to 100 per cent site waters resulted in increased growth compared to 100 per cent site waters, however this was only significant in the potato farming study area at sites UYN (control) and UYR (impact) (t test, P<0.05). The addition of nutrients to 100 per cent site waters did not result in any significant differences in growth compared to the laboratory control (ANOVA, P>0.05). The photosynthetic activity of Scenedesmus sp. did not significantly differ between site waters (100 per cent or 100 per cent + nutrients) and the laboratory control (ANOVA, P>0.05). Similarly the addition of nutrients to site waters did not cause any changes in photosynthetic activity compared to 100 per cent site waters at any site in the potato farming and forestry study areas, or in the Latrobe River.
Figure 8 presents the growth rates and photosynthetic activity of Scenedesmus sp. exposed to site waters sampled during January 2012. There were no significant differences in growth between laboratory control and site waters during January testing. The addition of nutrients to 100 per cent site waters significantly increased growth (t test, P<0.05) at the Latrobe River impact site (UVK), however this was not observed for any of the other sites. No significant differences between the laboratory control and site waters were observed in photosynthetic activity (ANOVA, P>0.05). The addition of nutrients to 100 per cent site waters caused a significant reduction in photosynthetic activity (t test, P<0.05) in Middle Creek at site UVH (forestry impact) and in the Latrobe River at site UVK (impact).
Growth rates for Scenedesmus sp. exposed to site waters sampled in March 2012 are shown in figure 9. Significant differences in growth were found between site waters and the laboratory control (ANOVA, P<0.05) in the potato farming region and in the Latrobe River. Growth was significantly stimulated relative to the laboratory control for 100 per cent site waters in the potato farming region at site UYP (impact) and at the Latrobe River control site (UVI) in 100 per cent site waters + nutrients. The addition of nutrients to 100 per cent site waters caused significant increases in growth at the potato impact site UYX and the Latrobe River impact site UVK (t test, P<0.05). Photosynthetic activity for Scenedesmus sp. exposed to waters collected during March 2012 is shown in figure 10. No significant differences in photosynthetic activity were found between site waters and the laboratory control (ANOVA, P>0.05). The addition of nutrients to 100 per cent site waters did cause a significant decrease in photosynthetic activity at the potato farming control site UYL (t test, P<0.05).

35
Impacts of intensive agriculture and plantation forestry on water quality in the Latrobe catchment, Victoria
Figure 7. Mean growth rates (a) and photosynthetic activity (b) of Scenedesmus sp. cultures exposed to 100 per cent site waters (white columns) or 100 per cent site waters + nutrients (black columns), for site waters sampled during December 2011. Sites highlighted green are control sites and those highlighted red are impact sites. Error bars indicate ± SE. N = 3. * denotes significant differences when tested within each site water status.

36
Impacts of intensive agriculture and plantation forestry on water quality in the Latrobe catchment, Victoria
Figure 8. Mean growth rates (a) and photosynthetic activity (b) of Scenedesmus sp. cultures exposed to 100 per cent site waters (white columns) or 100 per cent site waters + nutrients (black columns), for site waters sampled during January 2012. Sites highlighted green are control sites and those highlighted red are impact sites. Error bars indicate ± SE. N = 3. * denotes significant differences when tested within each site water status.
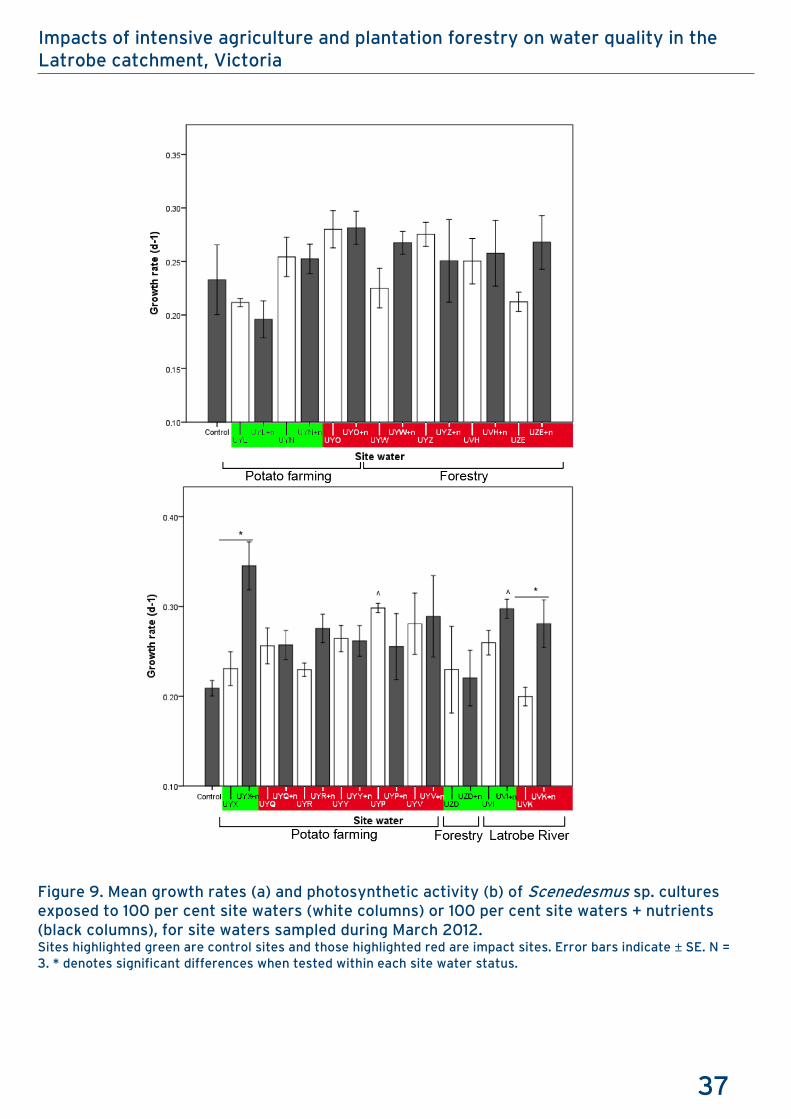
37
Impacts of intensive agriculture and plantation forestry on water quality in the Latrobe catchment, Victoria
Figure 9. Mean growth rates (a) and photosynthetic activity (b) of Scenedesmus sp. cultures exposed to 100 per cent site waters (white columns) or 100 per cent site waters + nutrients (black columns), for site waters sampled during March 2012. Sites highlighted green are control sites and those highlighted red are impact sites. Error bars indicate ± SE. N = 3. * denotes significant differences when tested within each site water status.

38
Impacts of intensive agriculture and plantation forestry on water quality in the Latrobe catchment, Victoria
Figure 10. Mean photosynthetic activity of Scenedesmus sp. cultures exposed to 100 per cent site waters (white columns) or 100 per cent site waters + nutrients (black columns), for site waters sampled during March 2012. Sites highlighted green are control sites and those highlighted red are impact sites. Error bars indicate ± SE. N = 3. * denotes significant differences when tested within each site water status.
39
Impacts of intensive agriculture and plantation forestry on water quality in the Latrobe catchment, Victoria
Chironomus tepperi toxicity tests
The survival of C. tepperi was not affected by sediment from forestry at Latrobe River sites (figure 11). The survival of C. tepperi was reduced in the potato farming control sites, UYL in Round 1 and 2 and UYN in Round 2 (figure 11a and figure 11b).
Adult emergence was also only affected by sediment from potato farming study area sites, with widespread reduced emergence in Round 1 (figure 12a). Only UYM (control), UYO (impact) and UYP (impact) sediment did not cause decreased emergence of C. tepperi individuals (figure 12a). Round 2 showed further reduced emergence in sediments from the most upstream potato control site (UYL) and some improvement in sediments from the impact sites (figure 12b). No significant sexual skewing was observed. For sites where emergence and survival were both over 80 per cent, average emergence time was analysed within each land use.
It was found that C. tepperi emerged faster in sediments from UYP (potato impact) compared to UYM (potato control) and in the laboratory control in Round 1 (F3, 23 = 5.43, P < 0.05), and faster than all potato sites in Round 2. The fast development observed in UYP sediment is interesting as this sediment contained several metals above ISQG trigger values (table 11 and table 12), and displayed similar chemistry to UYV (potato farming impact) where emergence was delayed in Round 1 sampling. In the forestry study area, adults emerged significantly faster in sediment from UZD (forestry control) compared to other sediments from forestry and potato farming land uses (F7,37 = 6.5, P < 0.05) (figure 13).
In situ cage tests – Potato farming
There was no significant difference in survival of Triplectides sp. or P. antipodarum from in situ cages between sites. However, sub-lethal impacts were observed in the protein analysis of Triplectides sp. and the embryo analysis of P. antipodarum.
Protein analysis of Triplectides sp.
Activity of the environmental stress biomarker GPx in Triplectides sp. from in situ cages at the Narracan Creek sites is shown in figure 14. Activity of GPx was significantly inhibited in cages at UYQ (potato impact) (F3,15 = 3.5, P < 0.05) and marginally inhibited at UYR (potato farming impact) (P = 0.09) compared to the experimental control (UVI) (figure 14). Activity was also inhibited at UYL (potato farming control) but this was not significant (P = 0.13).
Embryo analysis of the freshwater snail Potamopyrgus antipodarum
The mean counts of shelled and unshelled embryos of P. antipodarum from in situ cages, which can be used to assess the presence of EDCs, are displayed in figure 15. Although there was a slight decrease in the number of embryos at UYL (potato farming control) compared to the experimental control (UVI), this result was not significant.

40
Impacts of intensive agriculture and plantation forestry on water quality in the Latrobe catchment, Victoria
Figure 11. Survival of Chironomus tepperi exposed to Latrobe Valley sediments from a) Round 1 and b) Round 2. Sites highlighted green are control sites and those highlighted red are impact sites. Error bars represent the standard error of the mean. Sites lacking columns were not sampled in that particular round.
Figure 12. Emergence of Chironomus tepperi exposed to Latrobe Valley sediments from a) Round 1 and b) Round 2. Sites highlighted green are control sites and those highlighted red are impact sites. Error bars represent the standard error of the mean. Sites lacking columns were not sampled in that particular round.

41
Impacts of intensive agriculture and plantation forestry on water quality in the Latrobe catchment, Victoria
Figure 13. Average time to emerge of Chironomus tepperi exposed to Latrobe Valley sediments from a) Round 1 and b) Round 2. * denotes a significant difference from the laboratory control (P < 0.05). Sites highlighted green are control sites and those highlighted red are impact sites. Error bars represent the standard error of the mean.
Figure 14. Glutathione peroxidase (GPx) activity in Triplectides from in situ cages at Latrobe Valley sites. * denotes a significant difference from control (UVI) (P < 0.05). Sites highlighted green are control sites and those highlighted red are impact sites. Error bars represent the standard error of the mean.
Figure 15. Number of embryos in P. antipodarum from in situ cages at Latrobe Valley sites. Sites highlighted green are control sites and those highlighted red are impact sites. Error bars represent the standard error of the mean.
42
Impacts of intensive agriculture and plantation forestry on water quality in the Latrobe catchment, Victoria
Rapid bioassessment
On average, SIGNAL2 scores for the potato farming control sites (mean = 5.5) were notably higher than at the potato farming impact sites (mean = 4.6) (Table 15 and Figure 16). This indicates that a greater proportion of the macroinvertebrates found at the control sites were from families considered sensitive to pollution or habitat degradation. Conversely, the impact sites consisted of a higher proportion of families capable of tolerating polluted or degraded habitats. SIGNAL2 scores for forestry control (mean = 5.2) and impact (mean = 5.6) sites were similar, however this is based on only one control site. These trends observed for SIGNAL2 across both study areas also held true for SIGNAL1.
The average of two seasons (spring and autumn) of RBA sample data is required to assess a site’s performance against the relevant SEPP (WoV) objectives for SIGNAL1, taxa richness, key families, EPT and AUSRIVAS. Using single season data (autumn) is likely to underestimate the two season averaged results, however it does provide an insight into how a site is tracking towards these objectives. Based on the autumn data collected, the majority of sites were on track to achieve the SEPP (WoV) objectives for SIGNAL1 scores. The only exceptions to this were two potato farming impact sites: UYO (edge only) and UYY (both edge samples).
Taxa richness was found to be highest at the forestry control site (UZD) (mean = 36), followed by the forestry impact sites (mean = 27). Diversity at the Latrobe River control site (mean = 24) and the potato farming impact sites (mean = 21) was moderate, and the lowest diversity was recorded at the potato control sites (mean = 15). All sites were on track for passing the SEPP (WoV) objectives for taxa richness, except the potato farming control sites: UYL, riffle and edge; UYN, riffle only; and UYX, edge only.
Similar patterns were revealed in the key families (combined habitat) results. The number of key families at forestry control sites (mean = 36), forestry impact sites (mean = 32) and the Latrobe River control site (mean = 33) were all very high, clearly on track for passing the SEPP (WoV) objective of 22. The potato farming impact sites (mean = 21) were lower, with three of five sites on track for failing the objective. The lowest numbers of key families were recorded at the potato farming control sites (mean = 15), which were all on track to fail the objective (22).
EPT (sum of ephemeroptera, plecoptera and trichoptera families) values were also found to be higher at the forestry control (mean = 12) and impact (mean = 11) sites, and the Latrobe River control site (mean = 10.5). All of these sites were on track to pass the SEPP (WoV) EPT objectives. Lower EPT values were recorded at the potato impact (mean = 5) and control (mean = 3.5) sites. SEPP (WoV) EPT objectives are not available for this bioregion.
AUSRIVAS was unable to provide ‘observed/expected’ (O/E) scores for several sites as input data for these particular sites was considered to be ‘outside the experience of the models’ by AUSRIVAS software, a common issue for headwater streams. This affected two potato farming control sites, two potato farming impact sites and the only forestry control site. Of the sites able to be assessed, all forestry impact sites and the Latrobe River control site fell within category ‘A’, which was considered to be the ‘reference condition’. This suggests all or most of the expected families were recorded from these sites and water and/or habitat condition was similar to the reference sites. All potato farming sites achieved O/E scores, which fall into AUSRIVAS band ‘B’. Sites in this category were regarded as ‘significantly impaired’, having fewer families than expected, potentially as the result of impacts on water and/or habitat quality. All forestry sites (riffle and edge) were on track to pass the SEPP (WoV) objectives for O/E score and band, while all potato farming sites were on track to fail these objectives. The Latrobe River control site was on track to pass the objectives, with the exception of the O/E score for the edge sample.
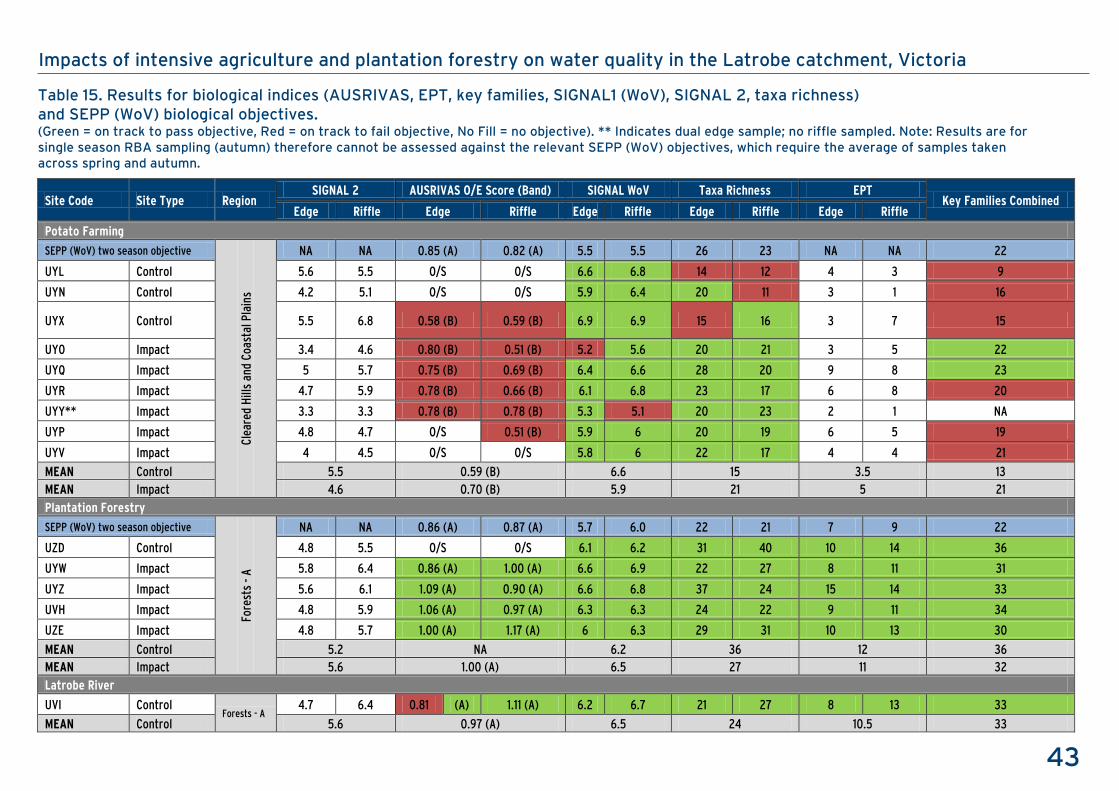
43
Impacts of intensive agriculture and plantation forestry on water quality in the Latrobe catchment, Victoria
Table 15. Results for biological indices (AUSRIVAS, EPT, key families, SIGNAL1 (WoV), SIGNAL 2, taxa richness) and SEPP (WoV) biological objectives. (Green = on track to pass objective, Red = on track to fail objective, No Fill = no objective). ** Indicates dual edge sample; no riffle sampled. Note: Results are for single season RBA sampling (autumn) therefore cannot be assessed against the relevant SEPP (WoV) objectives, which require the average of samples taken across spring and autumn.
Site Code Site Type Region SIGNAL 2 AUSRIVAS O/E Score (Band) SIGNAL WoV Taxa Richness EPT
Key Families Combined Edge Riffle Edge Riffle Edge Riffle Edge Riffle Edge Riffle
Potato Farming
SEPP (WoV) two season objective Cl
eare
d Hi
lls a
nd C
oast
al P
lain
s NA NA 0.85 (A) 0.82 (A) 5.5 5.5 26 23 NA NA 22
UYL Control 5.6 5.5 O/S O/S 6.6 6.8 14 12 4 3 9
UYN Control 4.2 5.1 O/S O/S 5.9 6.4 20 11 3 1 16
UYX Control 5.5 6.8 0.58 (B) 0.59 (B) 6.9 6.9 15 16 3 7 15
UYO Impact 3.4 4.6 0.80 (B) 0.51 (B) 5.2 5.6 20 21 3 5 22
UYQ Impact 5 5.7 0.75 (B) 0.69 (B) 6.4 6.6 28 20 9 8 23
UYR Impact 4.7 5.9 0.78 (B) 0.66 (B) 6.1 6.8 23 17 6 8 20
UYY** Impact 3.3 3.3 0.78 (B) 0.78 (B) 5.3 5.1 20 23 2 1 NA
UYP Impact 4.8 4.7 O/S 0.51 (B) 5.9 6 20 19 6 5 19
UYV Impact 4 4.5 O/S O/S 5.8 6 22 17 4 4 21
MEAN Control 5.5 0.59 (B) 6.6 15 3.5 13 MEAN Impact 4.6 0.70 (B) 5.9 21 5 21 Plantation Forestry
SEPP (WoV) two season objective
Fore
sts
- A
NA NA 0.86 (A) 0.87 (A) 5.7 6.0 22 21 7 9 22
UZD Control 4.8 5.5 O/S O/S 6.1 6.2 31 40 10 14 36
UYW Impact 5.8 6.4 0.86 (A) 1.00 (A) 6.6 6.9 22 27 8 11 31
UYZ Impact 5.6 6.1 1.09 (A) 0.90 (A) 6.6 6.8 37 24 15 14 33
UVH Impact 4.8 5.9 1.06 (A) 0.97 (A) 6.3 6.3 24 22 9 11 34
UZE Impact 4.8 5.7 1.00 (A) 1.17 (A) 6 6.3 29 31 10 13 30
MEAN Control 5.2 NA 6.2 36 12 36 MEAN Impact 5.6 1.00 (A) 6.5 27 11 32 Latrobe River
UVI Control Forests - A
4.7 6.4 0.81 (A) 1.11 (A) 6.2 6.7 21 27 8 13 33
MEAN Control 5.6 0.97 (A) 6.5 24 10.5 33

44
Impacts of intensive agriculture and plantation forestry on water quality in the Latrobe catchment, Victoria
Figure 16. Single season habitat objective attainment (pass/fail) for sites in the (a) the Latrobe catchment, (b) upper-Latrobe River sub-catchment, (c) Narracan Creek sub-catchment and (d) Middle Creek sub-catchment. (b), (c) and (d) show SIGNAL 2 edge (E) and riffle (R) scores for each site.
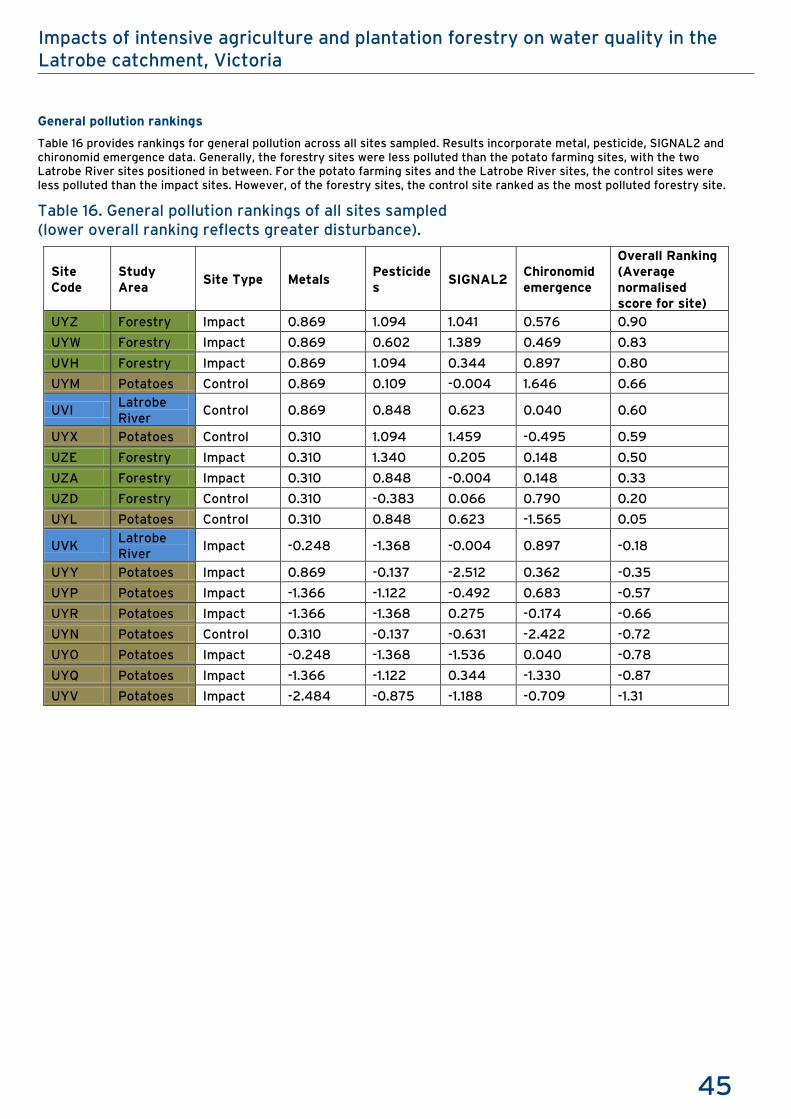
45
Impacts of intensive agriculture and plantation forestry on water quality in the Latrobe catchment, Victoria
General pollution rankings
Table 16 provides rankings for general pollution across all sites sampled. Results incorporate metal, pesticide, SIGNAL2 and chironomid emergence data. Generally, the forestry sites were less polluted than the potato farming sites, with the two Latrobe River sites positioned in between. For the potato farming sites and the Latrobe River sites, the control sites were less polluted than the impact sites. However, of the forestry sites, the control site ranked as the most polluted forestry site.
Table 16. General pollution rankings of all sites sampled (lower overall ranking reflects greater disturbance).
Site Code
Study Area
Site Type Metals Pesticides
SIGNAL2 Chironomid emergence
Overall Ranking (Average normalised score for site)
UYZ Forestry Impact 0.869 1.094 1.041 0.576 0.90
UYW Forestry Impact 0.869 0.602 1.389 0.469 0.83
UVH Forestry Impact 0.869 1.094 0.344 0.897 0.80
UYM Potatoes Control 0.869 0.109 -0.004 1.646 0.66
UVI Latrobe River
Control 0.869 0.848 0.623 0.040 0.60
UYX Potatoes Control 0.310 1.094 1.459 -0.495 0.59
UZE Forestry Impact 0.310 1.340 0.205 0.148 0.50
UZA Forestry Impact 0.310 0.848 -0.004 0.148 0.33
UZD Forestry Control 0.310 -0.383 0.066 0.790 0.20
UYL Potatoes Control 0.310 0.848 0.623 -1.565 0.05
UVK Latrobe River
Impact -0.248 -1.368 -0.004 0.897 -0.18
UYY Potatoes Impact 0.869 -0.137 -2.512 0.362 -0.35
UYP Potatoes Impact -1.366 -1.122 -0.492 0.683 -0.57
UYR Potatoes Impact -1.366 -1.368 0.275 -0.174 -0.66
UYN Potatoes Control 0.310 -0.137 -0.631 -2.422 -0.72
UYO Potatoes Impact -0.248 -1.368 -1.536 0.040 -0.78
UYQ Potatoes Impact -1.366 -1.122 0.344 -1.330 -0.87
UYV Potatoes Impact -2.484 -0.875 -1.188 -0.709 -1.31

46
Impacts of intensive agriculture and plantation forestry on water quality in the Latrobe catchment, Victoria
Summary of results
A summary of results, incorporating an analysis of contaminants, toxicity and species alterations, is shown in table 17. Conclusions on degradation to aquatic health have been provided, based on the results across the major indices investigated.
Table 17. Summary of results across the major indices tested (+ indicates chemical present or an impact was detected, - indicates not present or no impact detected, ± indicates some impacts were detected in some indices).
Site Site Type
Contaminants Present Toxicity Species Alterations
Possible Conclusions Water Sediment In situ Cages RBA
TSS Pesticides PS Pesticides
Metals Pesticides Hydroc-arbons
Scenedesmus sp.
C. tepperi Triplectides sp.
P. antipodarum
Potato Farming - Narracan Creek Sub-Catchment
UYL Control + + + + - - - + + - - Low levels of contamination present. Potential pollution-induced degradation
UYN Control - + + + + - - + - Low levels of contamination present. Potential pollution-induced degradation
UYM Control - + - - - - - Low levels of contamination present. Contamination does not appear to affect biota
UYX Control + + + - - - ± - Moderate evidence for pollution-induced degradation
UYO Impact - + + + - - ± ± Moderate evidence for pollution-induced degradation
UYQ Impact - + + + - - ± + - - Moderate evidence for pollution-induced degradation
UYR Impact - + + + + - - ± + - - Moderate evidence for pollution-induced degradation
UYY Impact - + + + - - - + Contamination does not appear to affect biota
UYP Impact - + + + - ± ± - Moderate evidence for pollution-induced degradation
UYV Impact - + + + - - ± - Moderate evidence for pollution-induced degradation
Forestry - Middle Creek Sub-Catchment
UZD Control ± + + + - - ± - Moderate evidence for pollution-induced degradation
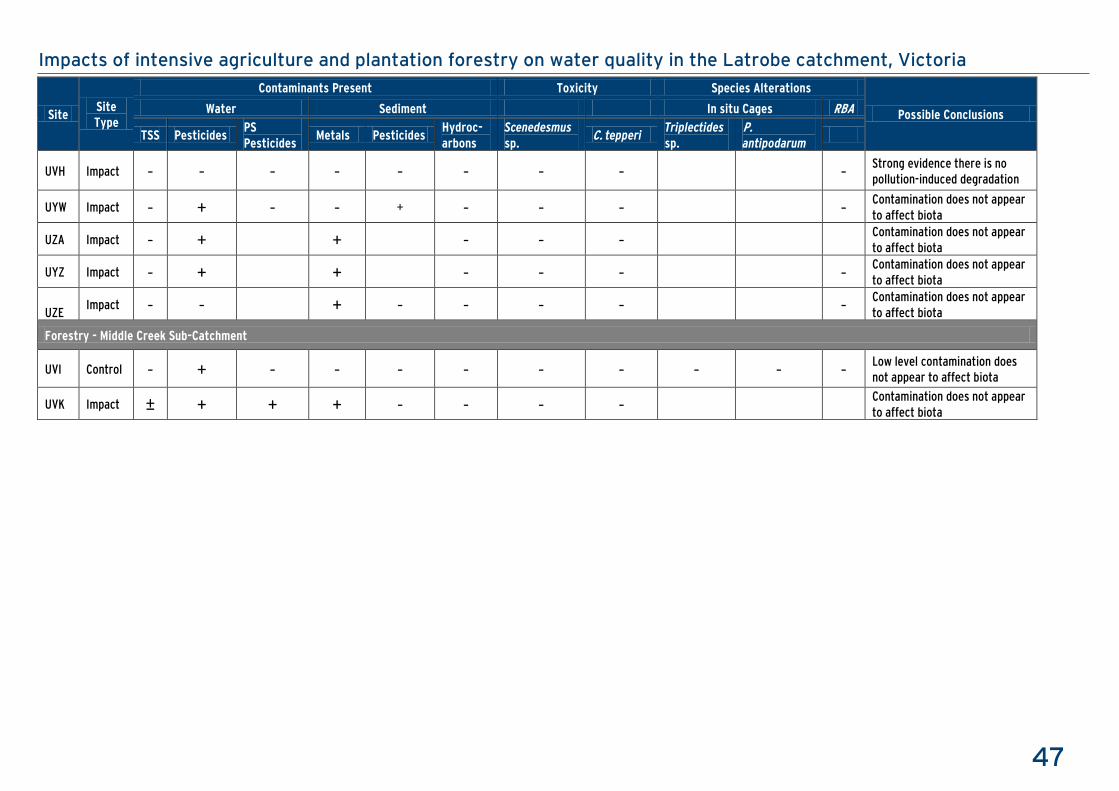
47
Impacts of intensive agriculture and plantation forestry on water quality in the Latrobe catchment, Victoria
Site Site Type
Contaminants Present Toxicity Species Alterations
Possible Conclusions Water Sediment In situ Cages RBA
TSS Pesticides PS Pesticides
Metals Pesticides Hydroc-arbons
Scenedesmus sp.
C. tepperi Triplectides sp.
P. antipodarum
UVH Impact - - - - - - - - - Strong evidence there is no pollution-induced degradation
UYW Impact - + - - + - - - - Contamination does not appear to affect biota
UZA Impact - + + - - - Contamination does not appear to affect biota
UYZ Impact - + + - - - - Contamination does not appear to affect biota
UZE Impact - - + - - - - - Contamination does not appear
to affect biota
Forestry - Middle Creek Sub-Catchment
UVI Control - + - - - - - - - - - Low level contamination does not appear to affect biota
UVK Impact ± + + + - - - - Contamination does not appear to affect biota
48
Impacts of intensive agriculture and plantation forestry on water quality in the Latrobe catchment, Victoria
Discussion Rainfall and stream flow data
The high rainfall (figure 3) and resulting high flows (figure 4) experienced in the month prior to Round 1 sampling of the Narracan Creek study area may have had several contradictory effects on movement and the concentration of pesticides. Increased run off is likely to increase the mobility of material (e.g. soil, pesticides, metals) from the land, where it is ultimately washed into waterways. This may result in a wider range of contaminants, both soluble and sediment-bound, being detected during sampling. However a dilution effect is expected due to the increased volume of water, particularly for water samples. Increased flows are also likely to affect results by widely dispersing contaminants and transporting them downstream away from the source, meaning contaminants observed at a site may have originated a considerable distance upstream. Lower rainfall prior to Round 2 led to a relatively stable period for flows in Narracan Creek. For the majority of the pesticide results, the types of pesticides and their concentrations varied between the two sampling periods. In order to understand the fluctuations in contaminant concentrations in a waterway throughout the year, knowledge of pesticide application loads and timing coupled with a regular sampling regime incorporating different climatic regimes is required. The current project involved sampling during a La Niña climate pattern, resulting in high summer rainfall. Summer drought periods during an El Niño climate pattern may present a ‘worst case’ scenario for pesticide concentrations in waterways. At such times, irrigation could mobilise pesticides and allow them to enter waterways, where they are likely to be in a higher concentration due to low water volumes and low flow. Trends in turbidity levels possibly linked to summer irrigation (discussed below) suggest the level of irrigation is causing run-off to occur, which creates a transport pathway for both soluble and insoluble, sediment-bound pesticides during dry periods.
Long term turbidity data for Narracan Creek
The correlation of rainfall events with spikes in turbidity is a result of sediment loads being transferred into waterways via surface run-off. Interestingly, the January to March 2009 and January 2011 turbidity spikes are not related to rainfall events (figure 5 and figure 6). The repeated pattern of this high turbidity suggests it relates to agricultural activities in the catchment. On the basis of this study it was not possible to say conclusively whether the source of this elevated turbidity was from sediment run-off during irrigation and harvesting of potatoes. The timing of the high turbidity would suggest run-off during a peak in irrigation during summer. Excess run-off of irrigation water during summer is of concern because the practice may result in contaminants, such as pesticides, running off the land into waterways experiencing low water levels and flows, resulting in high contaminant concentrations in water and sediments.
Water quality
In situ nutrients and other water quality parameters
In general, water quality was poorer in the Narracan Creek study area compared with the Middle Creek study area (Table 5). This was particularly the case for turbidity and total phosphorus. Elevated turbidity and TSS at the potato farming control sites compared to the potato farming impact sites may be related to the absence of in-stream dams. The two control sites with the highest readings (UYL and UYX) were generally surrounded by forest, however they lacked any upstream dams. All other potato farming sites had at least one in-stream dam upstream, with most having many more. In-stream dams create a place of low flow where solids suspended in the water column can settle to the dam bed, thereby lowering the turbidity of out-flowing water. A contributing factor for the elevated turbidity and TSS at sites UYL and UYX may have been the steep gradient of their catchments, which included non-pristine areas (light grazing and plantation). The soil in these areas was noted to be loosely packed and highly erodible, leading to easy transport of sediment to the stream via run-off. Furthermore, the ploughing around Thorpdale was generally noted to be in the direction of up-and-down hills rather than along contours (‘contour ploughing’), which may increase erosion potential, as this leads to furrows being created that drain straight down the face of hills towards waterways.
Pesticides
Potato farming study area
A wide range of pesticides was detected in samples from the Narracan Creek study area, in water, sediments and passive samplers (table 6, table 7, table 13 and table 14).
Azoxystrobin and metalaxyl are active ingredients of fungicides currently registered for use in potato farming. Either or both of these chemicals were detected in at least one round at all potato farming impact sites. Fungicides for potatoes are generally applied from December to April, which covers both sampling rounds, so detection of these chemicals was not surprising. Metalaxyl was also detected in low concentrations at the two least pristine potato farming control sites. Potential sources for this are aerial drift or application within the catchment for a non-potato use. While metalaxyl is registered for use on potato crops, it is also an active ingredient that can be used to control Phytophthora sp., which is not a potato-specific pathogen, however the prevalence of its use in the area is unknown. Knowledge of the effects of fungicides on aquatic systems is limited (Wightwick et al. 2012). A study using freshwater microcosms in the Netherlands found azoxystrobin was capable of causing ecologically adverse effects, predominately via altering the community structure of zooplankton, while macroinvertebrates, phytoplankton and macrophyte assemblages were only slightly affected (Zafar et al. 2012). In this instance, effects were only observed using a concentration of >10 μg/L, which is considerably higher than the concentrations observed during the current study. However, little is known about the combined effects of low-level fungicides occurring simultaneously, and further research into the effects of fungicides is required (Wightwick et al. 2012).
49
Impacts of intensive agriculture and plantation forestry on water quality in the Latrobe catchment, Victoria
Similar to fungicides, phenoxy herbicides were found to be widespread amongst the potato farming impact sites, with 2,4-D, triclopyr and MCPA the most commonly detected. These pesticides were also detected at the two less pristine control sites, which included a significant amount of grazed area. Phenoxy herbicides are generally used to control broad-leaf weeds and are not specific to potato farming. For example, 2,4-D is widely used for thistle control. 2,4-D and MCPA are generally used in broad-acre applications, being applied through spraying. The APVMA has acknowledged the potential risks of phenoxy herbicide spray drift and is currently reviewing the labelling for these pesticides to minimise effects to non-target organisms. Triclopyr is more commonly applied manually to woody weeds, such as blackberry, which often occur in close proximity to waterways. The source of phenoxy herbicides at control sites is unclear but may be due to their use in non-potato farming applications and/or through aerial drift.
Triazine herbicides were detected at a number of potato farming sites, particularly in Round 2. Small amounts of atrazine and simazine were also detected at control sites. Triazine herbicides are generally used to control broad-leaf and grassy weeds, with atrazine being currently registered for use in potato farming, however simazine is not. Research suggests they are readily detected as a groundwater contaminant. A study in Italy listed atrazine and metolachlor as two of the most frequently detected herbicides found in groundwater (Guzella et al. 2006), while in Great Britain simazine and atrazine are the most common pesticides found in groundwater (Beitz et al. 1994). The mobility of triazine herbicides through aerial drift and via groundwater may increase the risk of these pesticides entering waterways.
Diazinon is an insecticide registered for a range of uses, including potato farming. The presence of diazinon at three potato farming impact sites was either due to use on potato crops or alternatively as a result of other land uses within the catchments of these sites. Diazinon is also often used to control ectoparasites on livestock.
Despite not being used for many years, persistent organochlorine pesticides remained throughout the potato farming sites in various forms (e.g. dieldrin, DDT, DDD, DDE), particularly at the impact sites. Organochlorine use in Australia was widespread in the 1960s and 1970s, peaking in the mid-1970s, before being deregistered for agricultural use in 1985 (APVMA 2012). Despite being banned for over two decades, organochlorines remained present in Narracan Creek. Organochlorine residues are generally bound to sediment, which is consistent with detecting these substances in the sediment analysis rather than the water analysis. Being sediment-bound is likely to slow dispersal rates and coupled with long half-life times, organochlorines persist for long periods without being flushed from the system. This may be exacerbated in Narracan Creek by the large number of in-stream, farm dams. In-stream dams have the potential to act as sinks for a range of pesticides, including organochlorines, as suspended sediment particles carrying pesticides are likely to drop out of the water column due to the slow flow of the dams.
In aquatic environments organochlorine pesticides have been shown to bioaccumulate in fauna, biomagnify in the food web and are highly toxic to aquatic invertebrates and fish (Chopra et al. 2011). As these products are no longer used, management of organochlorines should be focused on minimising their re-dispersal. Appropriate management of in-stream dam sediment is likely to be an important part of this process, utilising the role of dams in accumulating pollutants. In systems with fewer dams, such as the location of the forestry control site where dieldrin, oxychlordane and DDE were detected, the organochlorines may disperse widely downstream.
Forestry study area
Information provided by the forestry manager responsible for operations in the Middle Creek study area (HVP Plantations) lists four pesticides used in the area for weed control: hexazinone, clopyralid, glyphosate and metsulfuron methyl. None of these were detected in any of the analyses at the impact sites. However, diazinon, metalaxyl, metolachlor, oxychlordane, pirimicarb and simazine were detected. The forestry control site included some grazing pasture, which could be the source of additional pesticides detected, such as diazinon. Diazinon was also found at the most upstream forestry impact site at a level exceeding the ANZECC/ARMCANZ (2000) 95 per cent trigger value, an area which only includes native forest and plantation forestry. The potential for diazinon to be transported via groundwater is unclear, although it has previously been detected in groundwater in the Netherlands (Health Council of the Netherlands 1996). The source of diazinon in Middle Creek requires further investigation. Sources for aphicide pirimicarb, the herbicide metolachlor and the fungicide metalaxyl are also unclear. There is potential for aerial drift or transport via groundwater. The presence of oxychlordane, a metabolite of the banned organochlorine chlordane, is likely to be a legacy of past use in the catchment.
The presence of the fungicide tebuconazole at the most upstream forestry impact site is unexpected as fungicides are generally not used in forestry. Tebuconazole is a foliar fungicide generally used on food crops, however it is also registered by the APVMA for use as a wood preservative. The forestry manager of the Middle Creek catchment (HVP Plantations) does not use this product in the catchment. The source of tebuconazole in Middle Creek is unknown, though given it can be administered via spraying, there is some potential for aerial drift into the catchment.
The presence of high levels of simazine in Round 2 within the forestry study area was an unusual result. While simazine is used in forestry operations, the forestry manager’s (HVP Plantations) records show it has not used this product since 2003. Given the half-life of simazine is generally several months, a more recent application may have occurred. The product can be applied through boom or aerial spraying, which could have resulted in aerial drift from a neighbouring catchment into Middle Creek. Alternatively, there is potential for simazine to be transported via groundwater. The process of groundwater movement is generally quite slow, often resulting in long lag times of movement following application. When in groundwater, the half-life of simazine is increased and can be in the order of years (Comber 1999). The source of simazine in Middle Creek requires further investigation.

50
Impacts of intensive agriculture and plantation forestry on water quality in the Latrobe catchment, Victoria
Sediment chemistry
Nutrients and hydrocarbons
No substantial differences emerged between study areas or control and impact sites for any parameters (table 9 and table 10). Variation was observed between sampling events, particularly in NOx which was detected in higher concentrations in Round 2, and TPH which was detected at more sites in Round 1. Throughout the study, no sites were found to have TPH concentrations above the guidelines suggested by Pettigrove and Hoffman (2005) for total petroleum hydrocarbon concentrations (860 mg/kg), suggesting that hydrocarbons are unlikely to detrimentally affect faunal assemblages in the regions tested. However, the presence of hydrocarbons indicates a source of contamination. The high TPH levels recorded at the forestry control site (UZD) and the Latrobe River control site (UVI) may indicate point source contamination, such as spilt diesel fuel. Nearby construction of a new bridge and road using heavy machinery at UVI was observed during Round 1 sampling, while farm machinery and fuel storage are likely to occur within the catchment of UZD, and may point to possible point sources of hydrocarbons.
Sediments – Heavy metals
Mercury was detected in the majority of sites over both rounds of sampling, and often in concentrations exceeding the ANZECC/ARMCANZ (2000) Interim Sediment Quality Guideline (ISQG) low level trigger value, which suggests a potential for toxic impacts (table 11 and table 12). Although elevated mercury levels in waterways are a concern due to the toxicity of this heavy metal to a range of organisms (Ullrich et al. 2001), the values in this study do not exceed the ISQG high level trigger value. Mercury can occur in the environment in many forms. Methyl-mercury is the bioavailable and toxic form and can be converted from inorganic mercury in the environment under certain conditions (for example in anaerobic sediments) (Ullrich et al. 2001). The present study did not investigate the bioavailability of the mercury detected.
The existence of elevated mercury in the Gippsland area has previously been associated with historic gold mining and coal fired power stations (Glover et al. 1980; Fabris et al. 1999). Glover et al. (1980) concluded that there were no natural sources of mercury in the Latrobe catchment, although the potential emission from bushfires and controlled burning was not considered.
Narracan Creek has a basaltic geology and Middle Creek has a sedimentary geology. The geology of these catchments means that historic gold mining activity is not a likely source of mercury in this study. Glover et al. (1980) listed Narracan Creek as having had historical gold mining, however maps suggest there was no major gold mining activities in the area (Office of the Commissioner for the Environment 1988). Potential other sources of the detected mercury in this study are from atmospheric deposition through coal fired power plants in the Latrobe Valley and burning of vegetation (bushfire and planned burns). Coal fired power plants are well known sources of mercury deposition, comprising 50-70 per cent of anthropogenic mercury emissions worldwide (USEPA 2006).
Fabris et al. (1999) investigated mercury levels in Black Bream Acanthopagrus butcheri in the Gippsland Lakes and concluded that mercury was below the levels for safe human consumption. However the concentrations in fish appeared to be increasing compared with a previous study in the late 1970s (Glover et al. 1980). The last study of fish in the Gippsland Lakes was in 1997, so there is a need to repeat this work.
Nickel was also found to be elevated at several sites in the potato farming study area, particularly at the impact sites, however it is not considered to have a high toxicity. The exact source for nickel is unknown, however it may be a natural occurrence. The ISQG guideline for nickel is considered conservative, with samples across the state often exceeding the trigger values (CAPIM, unpublished data). Similarly, the source for isolated exceedences of cadmium, chromium and antimony is unknown, however these are considered to be of low concern.
Toxicology
Phytotoxicity
Overall there appeared to be little to no toxic effects from site waters to microalgae during the study period and low concentrations of pesticides did not appear to have caused significant effects during the study period (figure 7, figure 8, figure 9 and figure 10). However, during December 2011 testing, growth was generally reduced at all sites compared to laboratory controls and photosynthetic activity was slightly stimulated in 100 per cent site waters. Apart from the forestry impact site UVH, low levels of herbicides were found across all of these sites. This effect was not observed at the same sites in January 2011, despite a number of herbicides being detected at these sites in the passive samplers.
In January and March 2012 growth was reduced and photosynthetic activity was slightly stimulated at the Latrobe River impact site (UVK). A number of triazine herbicides in low concentrations were detected at this site both in the passive samplers and in March 2012 spot samples, which suggests that these pesticides may be negatively affecting the growth of Scenedesmus. Triazine herbicides are known to be toxic to various algae species with reduced growth reported in numerous studies (see review by De Lorenzo et al. 2001).
A significant increase in Scenedesmus sp. growth was observed at the potato farming impact site UYP compared to the laboratory control in March 2012. A number of phenoxy herbicides were detected at this site. The phenoxy herbicides have not been found to be particularly harmful to green algae (Faust et al. 1994). However, studies have shown that growth of green algae, such as Scenedesmus sp., is stimulated by low concentrations of phenoxy herbicides (below 2 mg/L) (Wong 2000; Wong and Chang 1988).

51
Impacts of intensive agriculture and plantation forestry on water quality in the Latrobe catchment, Victoria
Low levels of pesticides were present in the site waters, however attenuation of negative effects observed when nutrients were added could be due to nutrient addition improving the tolerance of algae to pesticides present in the water. Performing the assay using 100 per cent site waters and 100 per cent site waters + nutrients allows us to gain better understanding of the observed effects on growth and photosynthetic activity in 100 per cent site waters. Addition of nutrients to 100 per cent site waters generally alleviated effects observed in 100 per cent site waters. Nutrient status can significantly influence toxicity of pollutants to algae. Exposure to high nutrient concentrations has been shown to both increase and decrease toxicity, as well as to have no influence, depending on species, strain, pollutants present and the modes of action (Moreira-Santos et al. 2004). It is unlikely that these sites experience a lack of nutrients given their land use.
Chironomus tepperi toxicity tests
Acute toxicity is a common measure of contaminated sediments, but short term exposure which measures survival of species is often only useful to identify high levels of contaminants within the sediments (Burton and Scott 1992). Sub-lethal endpoints (e.g. growth, reproduction and emergence) are useful as they are early warning indicators of contamination, suggesting benthic organisms are stressed before the species are lost from the area. Emergence tests are useful in sediment toxicity tests as they can incorporate long term effects that may be exerted at later stages of development (Marinkovic et al. 2011), or more subtle effects on life cycle responses (Paumen et al. 2008). Studies have shown that exposure to contaminated sediment can have no effect on C. tepperi survival but still affect growth and emergence (Kellar et al. 2011).
The survival of C. tepperi was not affected by the sediments collected at the forestry sites or in the Latrobe River, in comparison to the laboratory control sediment (figure 11). In the potato farming catchment C. tepperi survival was reduced at the potato farming control sites UYL (both rounds) and UYN (Round 2). Emergence of C. tepperi was also reduced at these control sites in both rounds (figure 12). Low concentrations of mercury were detected in both rounds and low concentrations of organochlorine pesticides were detected in Round 2 at site UYN. Similar concentrations of DDT and its metabolites have been shown to affect the growth and reproduction of C. riparius and Tubifex tubifex, suggesting that these historical use pesticides may still be a problem to aquatic life (Bettinetti et al. 2003). The antimony detected in Round 1 at site UYL could have caused the observed biological response at the concentration measured, as the ISQG-low value for this contaminant was exceeded. However this level was only detected during one sampling round. The low levels of herbicides (atrazine, simazine and pendimethalin) detected in the water at this site were less likely to cause the responses observed in the toxicity tests. The exact cause of the reduced emergence and survival in the potato farming control sites is not clear but is likely to be due to the combined effect of a number of contaminants.
Overall there was reduced emergence of C. tepperi across a number of the potato farming impact sites which contain low levels of pesticides, although this reduction was variable between sampling rounds. This is difficult to interpret given the control sites also had toxicants detected along with reduced emergence and survival of C. tepperi. The wide spread presence of pesticides in this study area has made the interpretation of control and impact sites difficult.
In situ cage tests – Potato farming
Triplectides sp.
There was no significant difference in the survival of the caddisfly Triplectides sp. between the control (UVI, Latrobe River) and the potato farming sites. However there was a reduction in glutathione peroxidise (GPx) at the potato farming sites. GPx is an antioxidant enzyme involved in reducing damage to biomolecules (lipid, protein and DNA) caused by reactive oxygen species (ROS) (Di Giulio et al. 1989). As toxicants in the environment create ROS, this antioxidant enzyme acts as a biomarker of general environmental stress, with lower GPx levels indicating higher stress (Kelly et al. 1998). The activity of GPx can also be inhibited by exposure to specific groups of pesticides (Liu et al. 2012).
Activity of GPx in Triplectides sp. was reduced across all of the potato farming sites and significantly reduced at site UYQ (impact) compared to the control (UVI). Historical organochlorines may be affecting the health of Triplectides sp. with p.p’-DDE, the metabolite of DDT, detected at potato farming impact sites UYQ and UYR at concentrations of 8 and 4 µg/kg respectively. Liu et al. (2012) found p.p’-DDE inhibited GPx and other glutathione-dependent detoxifying enzymes at concentrations of 20 µg/kg and above. It is unknown why there was a reduction in GPx in Triplectides sp. at site UYL (control), given that no pesticides in the sediment were detected. There is potential for some other unknown contaminant or natural compound to be the cause.
While Triplectides sp. survival was unaffected, the reduced GPx enzyme activity suggests low level effects. The effects of chronic exposure, which may be experienced by natural populations of macroinvertebrates in the study area, particularly longer lived species, are unknown, however cumulative effects are considered possible.
Potamopyrgus antipodarum
Potamopyrgus antipodarum is a robust snail species that is tolerant to physicochemical stressors (Alonso and Castro-Diez 2008) but quite sensitive to endocrine disrupting chemicals, which include a range of pesticides (Schmitt et al. 2011). Studies have shown that reproduction is affected by estrogenic compounds (Gust et al. 2010; Schmitt et al. 2010). The results from this study revealed no differences in survival or embryo development between the control site and the potato farming sites. This suggests that these snails were not affected by the low level of contaminants present at the potato farming sites.
Rapid bioassessment
SIGNAL2 scores (figure 16) generally correlated with the condition of the vegetation in the catchment of each site. The forestry study area sites, the two potato farming control sites nearest to the headwaters (UYL, UYX) and the Latrobe River

52
Impacts of intensive agriculture and plantation forestry on water quality in the Latrobe catchment, Victoria
control site were surrounded by large areas of intact, native vegetation, with continuous, high quality riparian cover. Riparian vegetation is very important to aquatic ecosystem function, playing vital roles in nutrient cycling, regulating water temperatures and providing habitat. Forestry sites also had a greater variety of substrate types, with high percentages of cobble, boulder and pebble. Substrate variety and intact riparian zones can often provide habitat for more sensitive macroinvertebrates, resulting in a higher SIGNAL2 score for sites. Conversely, the potato farming impact sites and remaining potato control site (UYN) further down the Narracan Creek catchment had lower quality riparian vegetation, substrate dominated by clay/silt, sand and gravel, and flow regimes altered by in-stream dams. Narracan Creek was subject to fine silt covering substrate and submerged habitat, with Easterbrook Creek (UYY) being the worst affected and accordingly having the lowest SIGNAL2 score of all sites. Catchments of these sites were generally dominated by cleared land uses, such as grazing (control site) or a mixture of grazing and potato farming (impact sites). The poor quality habitat at potato farming impact sites UYY and UYO (edge only) was reflected in the failure of these sites to be on track to pass the SIGNAL1 SEPP (WoV) objective.
Taxa richness, key families, EPT and AUSRIVAS values all held a similar pattern of being highest in the forestry study area and the Latrobe River control site compared to the potato study area. Similarly to SIGNAL2, results for these indices are likely to be a reflection of the differences in quality of available habitat as well differences in water quality. Habitat features, such as riparian vegetation and substrate, are likely to be reasonably permanent features of the sites and significant drivers of the macroinvertebrate assemblages observed. A wider range and higher concentrations of pesticides were found within the potato study area compared to the forestry study area, however the likelihood of pesticides shaping these assemblages is not clear from this investigation. Pesticides appear to pulse through flowing creeks and rivers following application and/or rainfall. Such pulses may have short and/or long term effects on macroinvertebrate assemblages, particularly on more sensitive species. However, this is likely to be dependent on the type, frequency, duration and concentration of pesticides.
Overall results
The general pollution rankings (table 16) and summary of results (table 17) follow the trend of the forestry sites being less polluted than the potato farming sites, which reflects the more naturally intact and less contaminated Middle Creek catchment. A wide range of pesticides and several heavy metals in elevated concentrations were detected in the potato farming region. Pesticides included herbicides, fungicides and insecticides from several chemical classes. Results of the C. tepperi emergence tests suggest these contaminants were potentially having some low-level effect on the biota in the potato farming study area. Reductions in SIGNAL2 here may not specifically be related to contaminants as this index can be influenced by other sources of environmental degradation.
The lower number of pesticides detected in the forestry study area is likely to have improved results for C. tepperi emergence and potentially SIGNAL2 score. Pesticides detected were generally restricted to herbicides, which reflects the low reliance on fungicides and insecticides in the forestry industry. The SIGNAL2 score was also likely to be positively affected by the higher quality, in-stream habitat in Middle Creek (forestry), compared to Narracan Creek (potatoes).
The potato farming and Latrobe River sites not surprisingly followed the trend of the impact sites, in being more polluted than control sites. Interestingly, the forestry control site (UZD) was the lowest ranked forestry site. This site may be affected by upstream farming, with the pesticides recorded at this site, in addition to its water chemistry (e.g. high salinity), being very different to all other sites, and suggesting a groundwater influence. The variety of contaminants detected at this site is of concern, as the site is located within the Morwell National Park and may affect the aquatic biodiversity values there.
Beyond run-off: aerial and groundwater transport of pesticides
Results from the current study included several instances of pesticides being detected in areas were they were not expected to be found (i.e. a given pesticide is unlikely to be applied within the catchment of a site) and the source was unclear. If these pesticides were not applied within the catchment, it demonstrates that the movement of pesticides into waterways is not limited to run-off followed by a downstream migration. A range of factors can influence the distribution of pesticides within the environment, including weather at and shortly after application, method of application (equipment, amount, timing, frequency and placement), chemical formulation, edaphic factors (topography, vegetation type and density, soil conditions, temperature, soil type, organic matter moisture, pH, aeration, and microbial activity) and the properties of the chemical itself (Wightwick and Allinson 2007). Pesticides can be transported off-site through a range of modes, including movement or partitioning of soils, groundwater, surface water, the atmosphere, plants and animals (Wightwick and Allinson 2007). Two of the more likely modes of off-site pesticide transport in the study areas are aerial drift and groundwater movement.
Aerial or spray drift relates to the movement of pesticides in the atmosphere away from their target area. Most commonly this involves application using boom or aerial spraying followed by the pesticide drifting in the air through wind movement. A number of factors determine the amount of drift that occurs, including wind speed and direction, droplet size, humidity, temperature, height of spray release and timing of spraying (APVMA 2008). The APVMA is responsible for the registration and limitations of the use of agricultural chemicals, including pesticides. The APVMA Operating Principles in Relation to Spray Drift Risk (2008) assesses the risks associated with spray drift and offers mitigation measures for potential impacts. This document also highlights ‘mandatory no-spray zones’, which can include areas of surface water if they are downwind at the time of the intended application. Buffer zones around waterways are specified for individual chemicals, as determined by the APVMA and vary with wind speed. While the ‘operating principles’ offer scientifically-based instructions for use to reduce spray drift, the onus is ultimately on landholders to adhere to these, and as such the potential for spray drift remains.
When certain pesticides come in contact with the soil, there is potential for leaching into the groundwater system. The most commonly detected pesticides found to contaminate groundwater in Victoria have been triazine herbicides such as atrazine
53
Impacts of intensive agriculture and plantation forestry on water quality in the Latrobe catchment, Victoria
and simazine, chlorpyrifos and DDT, which have generally been found at levels below water quality guidelines (Wightwick and Allinson 2007). Groundwater is most at risk from contamination in high intensity agricultural production involving irrigation and heavy agrochemical application, particularly on highly permeable soils (Budd et al. 2002). Once pesticides are in groundwater, degradation rates can be much slower (Comber 1999) and due to the slow flow rates of groundwater, a resource may remain contaminated for long periods (Budd et al. 2002). Given the difficulties in identifying paths of movement of groundwater and remediating contaminated groundwater, it is important to limit the potential for the pesticides to reach this important resource. The Guidelines for Groundwater Protection in Australia (ARMCANZ/ANZECC 1995) provides a national framework for groundwater protection in Australia. A recent review of these guidelines (Sundaram et al. 2010) highlighted the need for updated data on a range of groundwater threats, including pesticides. An update of these guidelines may allow greater protection of groundwater resources from the risk of pesticide contamination.
Management actions
Narracan Creek potato farming study area
A range of pesticides registered for use in potato farming were detected in the Narracan Creek area. These pesticides were predominantly detected in the potato growing areas, but were also detected in control sites. The transport of these pesticides over relatively large areas is of concern. There was evidence of a localised, low level biological impact from pesticides in the potato farming study area, with potential non-lethal effects occurring as a result of low level chronic exposure. Potential for impact may also increase during lower rainfall climate cycles, should pesticides be more concentrated in waterways. The turbidity levels in Narracan Creek are high and this is likely to be due to the nature of the soil in the catchment, but also land management. Suspended solids causing this elevated turbidity have the potential to provide a transport pathway for insoluble contaminants. In-stream, farm dams may be acting as sources, sinks of sedimentation and toxicants in the catchment.
Recommendations for the potato growing area:
• the regulators of pesticide application, DPI/APVMA, consider whether current operating controls for pesticide application are sufficient for preventing pesticides reaching waterways
• creating more effective buffer strips between crops and waterways (e.g. increased width, riparian planting, sediment fencing) to reduce the likelihood of pesticides entering waterways via surface run-off or aerial movement
• conducting contour ploughing where gradients allow it, particularly at the bottom of valleys adjacent to waterways, to reduce the erosion potential of cropped potato fields
• waterway managers (West Gippsland CMA) giving consideration to the role of in-stream, farm dams, including:
o contaminant levels of in-stream, farm dams
o management practices regarding in-stream, farm dam management, especially de-silting activities.
Middle Creek forestry study area
Overall the assessment of the evidence for Middle Creek showed relatively few water quality issues of concern. Pesticide levels were relatively low. Because of the constraints adopted with site selection a caveat applies to the forestry study. This study was a snapshot of a single catchment without recently cleared or early stage plantation plots, which may increase the potential for pesticides to reach aquatic environments. The risk of sediment run-off and pesticide contamination would be higher during these phases of forest management.
Recommendations for the forestry study area:
• extending the study to incorporate recently cleared and early stage plantation plots to investigate ‘worst case scenarios’
• investigating the source of simazine in the Middle Creek catchment and potential groundwater contamination in the Middle Creek and Billy Creek catchments.
Recommendations for management of mercury in the Latrobe catchment
Future investigations into mercury in the Gippsland region should consider all sources of mercury, its bioavailability and bioaccumulation in aquatic organisms, and whether it is having an impact on ecological or human health.

54
Impacts of intensive agriculture and plantation forestry on water quality in the Latrobe catchment, Victoria
References Alonso A & Castro-Diez P 2008. ‘What explains the invading success of the aquatic mud snail Potamopyrgus antipodarum (Hydrobiidae, Mollusca)?’, Hydrobiologia, vol. 614, pp. 107-116.
ANZECC/ARMCANZ 2000. Australian and New Zealand Guidelines for Fresh and Marine Water Quality 2000. Australian and New Zealand Environment and Conservation Council and Agriculture and Resource Management Council of Australia and New Zealand, Canberra.
ARMCANZ/ANZECC 1995. Guidelines for Groundwater Protection in Australia. Agriculture and Resource Management Council of Australia and New Zealand and Australian and New Zealand Environment and Conservation Council, Canberra.
APVMA 2012. http://www.apvma.gov.au/products/review/completed/organochlorines_history.php. Australian Pesticides and Veterinary Medicines Authority. Accessed 05/09/2012.
Ballesteros ML, Wunderlin DA & Bistoni MA 2009. ‘Oxidative stress responses in different organs of Jenynsia multidentata exposed to endosulfan’. Ecotoxicology and Environmental Safety, vol. 72, pp. 199-205.
Beitz J, Schmidt H & Herzell F 1994. ‘Occurrence, toxicological and ecotoxicological significance of pesticides in groundwater and surface water’. In: Borner H (Ed.). Pesticides in ground and surface water. vol. 9. Chemistry of Plant Protection. Springer-Verlag, Germany, pp. 1-56.
Bettinetti R, Giarei C & Provini A 2003. ‘Chemical analysis and sediment toxicity bioassays to assess the contamination of the River Lambro (Northern Italy).’ Archives of Environmental Contamination and Toxicology. vol. 45, pp. 72-78.
Binkley D & Brown TC 1993. ‘Forest practices as non-point sources of pollution in North America’. Water Research Bulletin 29, pp. 729–740.
Bolch CJS & Blackburn SI 1996. ‘Isolation and purification of Australian isolates of the toxic cyanobacterium Microcystis aeruginosa Kütz’. Journal of Applied Phycology, vol. 8, pp. 5-13.
Bonada N, Prat N, Resh VH & Statzner B 2006. ‘Developments in aquatic insect biomonitoring: A comparative analysis of recent approaches’. Annual Review of Entomology, vol. 51, pp. 495-523.
Brock TCM, Roessink I, Belgers JDM, Bransen F & Maund SJ 2009. ‘Impact of benzoyl urea insecticide on aquatic macroinvertebrates in ditch mesocosms with and without non-sprayed sections’. Environmental Toxicology and Chemistry, vol. 28, pp. 2191-2205.
Budd KL, Chartres CJ, Ivkovic KM & Bauld J 2002. ‘Idenitifying and managing natural and anthropogenic contaminants in Australian groundwaters in non-urban environments’. Australasian Journal of Ecotoxicology, vol. 8, pp. 35-40.
Burton GA, Batley GE, Chapman PM, Forbes VE, Smith EP, Reynoldson T, Schlekat CE, den Besten PJ, Bailer AJ, Green AS & Dwyer RL 2002. ‘A weight-of-evidence framework for assessing sediment (or other) contamination: Improving certainty in the decision-making process’. Human and Ecological Risk Assessment, vol. 8, pp. 1675-1696.
Burton GA, Pitt R & Clark S 2000. ‘The role of traditional and novel toxicity test methods in assessing stormwater and sediment contamination’. Critical Reviews in Environmental Science and Technology, vol. 30, pp. 413-447.
Burton GA & Scott KJ 1992. ‘Sediment toxicity evaluations’. Environmental Science & Technology, vol. 26, pp. 2068-2075.
Campbell IC & Doeg TJ 1989. ‘Impact of timber harvesting and production on streams: A review’. Australian Journal of Marine and Freshwater Research, vol. 40, pp. 519–539.
Carew ME, Pettigrove V, Cox RL & Hoffmann AA 2007. ‘The response of Chironomidae to sediment pollution and other environmental characteristics in urban wetlands’. Freshwater Biology, vol. 52, pp. 2444-2462.
Chessman BC 1995. ‘Rapid assessment of rivers using macroinvertebrates - a procedure based on habitat-specific sampling, family level identification and a biotic index’. Australian Journal of Ecology, vol. 20, pp. 122-129.
Chessman BC 2003. ‘New sensitivity grades for Australian river macroinvertebrates’. Marine and Freshwater Research, vol. 54, pp. 95–103.
Chopra AK, Sharma MK & Chamoli S 2011. ‘Bioaccumulation of organochlorine pesticides in aquatic systems - an overview’. Environmental Monitoring and Assessment, vol. 173, pp. 905-916.
Choung CB, Hyne RV, Stevens MM & Hose GC 2010. ‘A low concentration of atrazine does not influence the acute toxicity of the insecticide terbufos or its breakdown products to Chironomus tepperi’. Ecotoxicology, vol. 19, pp. 1536-1544.
Comber S 1999. ‘Abiotic persistence of atrazine and simazine in water’. Pesticide Science, vol. 55, pp. 696–702.
Crane M, Burton GA, Culp JM, Greenberg MS, Munkittrick KR, Ribeiro R, Salazar MH & St-Jean SD 2007. ‘Review of aquatic in situ approaches for stressor and effect diagnosis’. Integrated Environmental Assessment and Management, vol. 3, pp. 234-245.

55
Impacts of intensive agriculture and plantation forestry on water quality in the Latrobe catchment, Victoria
Crane M, Sildanchandra W, Kheir R & Callaghan A 2002. ‘Relationship between biomarker activity and developmental endpoints in Chironomus riparius Meigen exposed to an organophosphate insecticide’. Ecotoxicology and Environmental Safety, vol. 53, pp. 361-369.
Debenest T, Silvestre J, Coste M & Pinelli E 2010. ‘Effects of pesticides on freshwater diatoms’. Reviews of Environmental Contamination and Toxicology, vol. 203, pp. 87-103.
DeLorenzo ME, Scott GI & Ross PE 2001. ‘Toxicity of pesticides to aquatic microorganisms: A review’. Environmental Toxicology and Chemistry, vol. 20, pp. 84-98.
Di Giulio RT, Washburn PC, Wenning RJ, Winston GW & Jewell CS 1989. ‘Biochemical responses in aquatic animals - A review of determinants of oxidative stress’. Environmental Toxicology and Chemistry, vol. 8, pp. 1103-1123.
Drotar A, Phelps P & Fall R 1985. ‘Evidence for glutathione-peroxidase activities in cultured plant cells’. Plant Science, vol. 42, pp. 35-40.
DSE 2010. Biodiversity Interactive Map 3.1. Department of Sustainability and Environment Victoria.
Environment Canada 1992. Biological Test Method: Growth inhibition test using the freshwater alga Selenastrum capricornutum. Report EPS 1/RM/25. Environment Canada, Ottawa, ON, Canada.
EPA Victoria 2003. State Environment Protection Policy (Waters of Victoria). EPA Victoria, Melbourne.
EPA Victoria 2003a. Biological Objectives for Rivers and Streams - Ecosystem Protection. EPA Victoria, Melbourne.
EPA Victoria 2003b. Guideline for Environmental Management: Rapid Bioassessment Methodology for Rivers and Streams. EPA Victoria, Melbourne.
Fabris G, Theodoropoulos T, Sheehan A & Abbott B 1999. ‘Mercury and organochlorines in Black Bream, Acanthopagrus butcheri, from the Gippsland Lakes, Victoria, Australia: Evidence for temporal increases in mercury levels’. Marine Pollution Bulletin 38, pp. 970-976.
Fairchild JF, Boyle T, English WR & Rabeni C 1987. ‘Effects of sediment and contaminated sediment on structural and functional components of experimental stream ecosystems’. Water Air and Soil Pollution, vol. 36, pp. 271-293.
Faust M, Altenburger R, Boedeker W & Grimme LH 1994. ‘Algal toxicity of binary combinations of pesticides’. Bulletin of Environmental Contamination and Toxicology, vol. 53, pp. 134-141.
Friberg N, Lindstrøm M, Kronvang B & E. Larsen SE 2003. ‘Macroinvertebrate/sediment relationships along a pesticide gradient in Danish streams’. Hydrobiologia, vol. 494, pp. 103–110.
Glover JW, Bacher GJ & Pearce TS 1980. ‘Heavy metals in biota and sediments of the Gippsland Lakes’. Environmental Studies Series, Report No. 279, Ministry for Conservation, Victoria.
Gust M, Buronfosse T, Geffard O, Mons R, Queau H, Mouthon J & Garric J 2010. ‘In situ biomonitoring of freshwater quality using the New Zealand mud snail Potamopyrgus antipodarum (Gray) exposed to waste water treatment plant (WWTP) effluent discharges’. Water Research, vol. 44, pp. 4517-4528.
Guzzellaa L, Pozzonia F & Giulianob G 2006. ‘Herbicide contamination of surficial groundwater in Northern Italy’. Environmental Pollution, vol. 142, pp. 344-353.
Harmon SM 2010. ‘Effects of pollution on freshwater organisms’. Water Environment Research, vol. 80, pp. 1892-1916.
Health Council of the Netherlands 1996. Risks of pesticides to groundwater ecosystems. Committee on Pesticides and Groundwater. Rijswik: Health Council of the Netherlands, Publication no. 1996/11E.
Jobling S & Tyler CR 2003. ‘Endocrine disruption in wild freshwater fish’. Pure Applied Chemistry, vol. 75, pp. 2219-2234.
Kamimura S, Matsuoka A, Imai K & Shikama K 2003. ‘The swinging movement of the distal histidine residue and the autoxidation reaction for midge larval haemoglobins’. European Journal of Biochemistry, vol. 270, pp. 1424-1433.
Kellar C, Hassell K, Long S, Myers J, Golding L, Kumar A & Pettigrove V 2011. Identifying the primary factors influencing aquatic ecosystem health in the Upper Dandenong Creek Catchment. Centre for Aquatic Pollution Identification and Management, Technical Report 6 Melbourne, Melbourne Water Corporation.
Kelly SA, Havrilla CM, Brady TC, Abramo KH & Levin ED 1998. ‘Oxidative stress in toxicology: Established mammalian and emerging piscine model systems’. Environmental Health Perspectives, vol. 106, pp. 375-384.
Kingston JK, Greenwood R, Mills GA, Morrison GM & Björklund Persson L 2000. ‘Development of a novel passive sampling system for the time averaged measurement of a range of organic pollutants in aquatic environments’. Journal of Environmental Monitoring, vol. 2, pp. 487-495.
Kreutzweiser DP, Capell SS & Good KP 2005. ‘Effects of fine sediment inputs from a logging road on stream insect communities: A large-scale experimental approach in a Canadian headwater stream’. Aquatic Ecology, vol. 39, pp. 55-66.
Larsen S, Pace G & Ormerod SJ 2011. ‘Experimental effects of sediment deposition on the structure and function of macroinvertebrate assemblages in temperate streams’. River Research and Applications, vol. 27, pp. 257-267.

56
Impacts of intensive agriculture and plantation forestry on water quality in the Latrobe catchment, Victoria
Lee BG, Griscom SB, Lee JS, Choi HJ, Koh CH & Luoma SN 2000. ‘Influences of dietary uptake and reactive sulfides on metal bioavailability from aquatic sediments’. Science, vol. 287, pp. 282-284.
Liess M & von der Ohe PC 2005. ‘Analyzing effects of pesticides on invertebrate communities in streams’. Environmental Toxicology and Chemistry, vol. 24, pp. 954-965.
Liu CJ, Wang YP, Quan C, Yan MS, Zhou J, Wang C & Yang KD 2012. ‘Raf-1 is dually down regulated by p,p'-DDE via reduced thyroid hormone and activated ERK’. Pesticide Biochemistry and Physiology, vol. 103, pp. 68-73.
Lowry OH, Rosebrough NJ, Farr AL & Randall RJ 1951. ‘Protein measurement with the folin phenol reagent’. Journal of Biological Chemistry, vol. 193, pp. 265-275.
Maltby L, Brock T, van den Brink P 2009. ‘Fungicide risk assessment for aquatic ecosystems: Importance of interspecific variation, toxic mode of action and exposure regime. Environmental Science and Technology, vol. 43, pp. 7556-7563.
Marshall S, Pettigrove V, Carew M & Hoffmann A 2010. ‘Isolating the impact of sediment toxicity in urban streams’. Environmental Pollution, vol. 158, pp. 1716–1725.
Marinkovic M, Verweij R, Nummerdor G, Jonker M, Kraak M & Admiraal W 2011. ‘Life cycle responses of the midge Chironomus riparius to compounds with different modes of action’. Environmental Science and Technology, vol. 45, pp. 1645-1651.
Martin J, Kuvangkadilok C, Peart DH & Lee BTO 1980. ‘Multiple sex determining regions in a group of related Chironomus species (Diptera: Chironomidae)’. Heredity, vol. 44, pp. 367 - 382.
Mirandaa AL, Rocheb H, Randia MAF, Menezesc ML & Oliveira Ribeiroa CA 2008. ‘Bioaccumulation of chlorinated pesticides and PCBs in the tropical freshwater fish Hoplias malabaricus: Histopathological, physiological and immunological findings’. Environment International, vol. 34, pp. 939-949.
Moreira-Santos M, Soares AMVM & Ribeiro R 2004. ‘An in situ bioassay for freshwater environments with the microalga Pseudokirchneriella subcapitata’. Ecotoxicology and Environmental Safety, vol. 59, pp. 164-173.
OECD 2004. Sediment-water chironomid toxicity test using spiked sediment 218, OECD Guideline for testing chemicals. Organization for Economic Co-operation and Development, Washington DC, USA, pp. 1-21.
Office of the Commissioner for the Environment 1988. State of the Environment Report 1988: Victoria’s Inland Waters. Government of Victoria, Melbourne. pp. 82-91.
Paixão SM, Silva L, Fernandes A, O’Rourke K, Mendonça E & Picado A 2008. ‘Performance of a miniturised algal bioassay in phytotoxicity screening’. Ecotoxicology, vol. 17, pp. 165-171.
Pettigrove V & Hoffmann A 2003. ‘Impact of urbanisation on heavy metal contamination in urban stream sediments: influence of catchment geology’. Australasian Journal of Ecotoxicology, vol. 9, pp. 119-128.
Pettigrove V & Hoffmann A 2005. ‘Effects of long-chain hydrocarbon-polluted sediment on freshwater macroinvertebrates’. Environmental Toxicology and Chemistry, vol. 24, pp. 2500-2508.
Phipps GL, Ankley GT, Benoit DA & Mattson VR 1993. ‘Use of the aquatic oligochaete Lumbriculus variegarus for assessing the toxicity and bioaccumlation of sediment-associated contaminants’. Environmental Toxicology and Chemistry, vol. 12, pp. 269-279.
Pitt RE 1995. ‘Biological effects of urban run-off discharge’. In: Herrick EE (Ed.), Stormwater Run-off and Receiving Systems: Impact, Monitoring and Assessment. CRC, Boca Raton FL, pp. 127-162.
Quinn GP & Keough MJ 2002. Experimental design and data analysis for biologists. Cambridge University Press, Cambridge, UK.
Reddy PS, Tuberty SR & Fingerman M 1997. ‘Effects of cadmium and mercury on ovarian maturation in the red swamp crayfish, Procambarus clarkii’. Ecotoxicology and Environmental Safety, vol. 37, pp. 62-65.
Relyea A, Schoeppner NM, Hoverman JT 2005. ‘Pesticides and amphibians: the importance of community context’. Ecological Applications, vol. 15, pp. 1125–1134.
Reynoldson TB, Noris RH, Resh VH, Day KE & Rosenberg DM 1997. ‘The reference condition: a comparison of multimetric and multivariate approaches to assess water-quality impairment using benthic macroinvertebrates’. Journal of the North American Benthological Society, vol. 16, pp. 833-852.
Sargeant IJ & Imhof MP 2012. Major Agricultural Soils of the West Gippsland Region. Department of Primary Industries, Victoria. http://vro.dpi.vic.gov.au/dpi/vro/wgregn.nsf/pages/wg_soil_detailed_moe_mapsheet. Accessed: 09/09/2012.
Schafer RB, Kefford B, Metzeling L, Liess M, Burgert S, Marchant R, Pettigrove V, Goonan P & Nugegoda D 2011. ‘A trait database of stream invertebrates for the ecological risk assessment of single and combined effects of salinity and pesticides in south-east Australia’. Science of the Total Environment, vol. 409, pp. 2055-2063.

57
Impacts of intensive agriculture and plantation forestry on water quality in the Latrobe catchment, Victoria
Schmitt C, Duft M, Brandelik C, Schulte-Oehlmann U & Oehlmann J 2006. ‘SOP for testing chemicals. Also: proposal for new guideline reproduction test with the prosobranch snail Potamopyrgus antipodarum for testing endocrine active chemicals’, version 2006-02-08. Johann Wolfgang Goethe University Frankfurt am Main, Frankfurt, Germany.
Schmitt C, Streck G, Lamoree M, Leonards P, Brack W & de Deckere E 2011. ‘Effect directed analysis of riverine sediments - The usefulness of Potamopyrgus antipodarum for in vivo effect confirmation of endocrine disruption’. Aquatic Toxicology, vol. 101, pp. 237-243.
Schmitt C, Vogt C, Van Ballaer B, Brix R, Suetens A, Schmitt-Jansen M & de Deckere E 2010. ‘In situ cage experiments with Potamopyrgus antipodarum - A novel tool for real life exposure assessment in freshwater ecosystems’. Ecotoxicology and Environmental Safety, vol. 73, pp. 1574-1579.
Schulz R 2003. ‘Using a freshwater amphipod in situ bioassay as a sensitive tool to detect pesticide effects in the field’. Environmental Toxicology and Chemistry, vol. 22, pp. 1172-1176.
Simpson JC & Norris RH 2000. ‘Biological assessment of water quality: development of AUSRIVAS models and outputs’. In: Assessing the biological quality of freshwaters: RIVPACS and similar techniques. Wright JF, Sutcliffe DW & Furse MT (Eds.). Freshwater Biological Association, Ambleside. pp 125-142.
Stevens MM 1993. ‘Larval development in Chironomus tepperi (Diptera, Chironomidae) under laboratory conditions’. Environmental Entomology, vol. 22, pp. 776-780.
Stevens MM, Helliwell S & Hughes PA 2005. ‘Toxicity of Bacillus thuringiensis var. Israelensis formulations, Spinosad and selected synthetic insecticides to Chironomus tepperi larvae’. Journal of the American Mosquito Control Association, vol. 21, pp. 446-450.
Sundaram B, Nelson R & Coram J 2010. ‘Assessing the need to revise the guidelines for groundwater protection in Australia - A review report’. Geoscience Australia, Canberra.
Suter GW & Cormier SM 2011. ‘Why and how to combine evidence in environmental assessments: Weighing evidence and building cases’. Science of the Total Environment, vol. 409, pp. 1406-1417.
Townsend CR, Uhlmann SS & Matthaei CD 2008. ‘Individual and combined responses of stream ecosystems to multiple stressors’. Journal of Applied Ecology, vol. 45, pp. 1810-1819.
Ullrich S, Tanton T & Abdrashitova S 2001. ‘Mercury in the aquatic environment: A review of factors affecting methylation’. Critical Reviews in Environmental Science and Technology, vol. 31, pp. 241-293.
United Nations 2012. Listing of POPs in the Stockholm Convention. http://chm.pops.int/Convention/ThePOPs/ListingofPOPs/tabid/2509/Default.aspx. Accessed 05/09/2012.
USEPA 1994. Short-term methods for estimating the chronic toxicity of effluents and receiving waters to freshwater organisms. United States Environmental Protection Agency, Washington, DC. EPA 600/7-91-002.
USEPA 2006. EPA’s Roadmap for Mercury. United States Environmental Protection Agency, Washington, DC. http://www.epa.gov/hg/roadmap.htm. Accessed: 09/09/2012.
WGCMA 2011. Catchment condition report: 2010. West Gippsland Catchment Management Authority, Traralgon, Victoria.
Wightwick AM & Allinson G 2007. ‘Pesticide residues in Victorian waterways: A review. Australasian Journal of Ecotoxicology, vol. 13, pp. 91-112.
Wightwick AM, Bui A, Zhang P, Rose G, Allinson M, Myers JH, Reichman SM, Menzies NW, Pettigrove VJ & Allinson G 2012. ‘Investigation of 25 fungicides in surface waters of a horticultural production catchment in south-eastern Australia’. Archives of Environmental Contamination and Toxicology, vol. 62, pp. 380-390.
Wilkinson S, Hancock G, Read A & Davey B 2005. Sources of sediment and nutrients to the Gippsland Lakes: Preliminary modelling results. Report to the Victorian Department of Sustainability and Environment. CSIRO.
Wong PK 2000. ‘Effects of 2,4-D, glyphosate and paraquat on growth, photosynthesis and chlorophyll a synthesis of Scenedesmus quadricauda Berb 614’. Chemosphere, vol. 41, pp. 177-182.
Wong PK & Chang L 1988. ‘The effects of 2,4-D herbicide and organophosphorus insecticides on growth, photosynthesis and chlorophyll a synthesis of Chlamydomonas reinhardtii (mt +)’. Environmental Pollution, vol. 55, pp. 179-189.
Zafar MI, Belgers JD, Van Wijngaarden RP, Matser A & van den Brink PJ 2012. ‘Ecological impacts of time-variable exposure regimes to the fungicide azoxystrobin on freshwater communities in outdoor microcosms’. Ecotoxicology, vol. 21, pp. 1024-1038.

58
Impacts of intensive agriculture and plantation forestry on water quality in the Latrobe catchment, Victoria
Appendices Appendix 1: ALS Ltd labortories brief method summaries for water and sediment screens
Analytical Methods Method Matrix Method Descriptions Moisture content EA055-
103 SOIL A gravimetric procedure based on weight loss over a 12 hour
drying period at 103-105 degrees C. This method is compliant with NEPM (2010 draft) schedule B(3) section 7.1 and table 1 (14 day holding time).
Total metals by ICP-AES EG005T SOIL (APHA 21st ed., 3120; USEPA SW 846 - 6010) (ICPAES). Metals are determined following an appropriate acid digestion of the soil. The ICPAES technique ionises samples in a plasma, emitting a characteristic spectrum based on metals present. Intensities at selected wavelengths are compared against those of matrix-matched standards. This method is compliant with NEPM (1999) schedule B(3).
Total mercury by FIMS EG035T SOIL AS 3550, APHA 21st ed., 3112 Hg - B (Flow-injection (SnCl2) (Cold vapour generation) AAS). FIM-AAS is an automated, flameless atomic absorption technique. Mercury in solids is determined following an appropriate acid digestion. Ionic mercury is reduced online to atomic mercury vapour by SnCl2, which is then purged into a heated quartz cell. Quantification is by comparing absorbance against a calibration curve. This method is compliant with NEPM (1999) schedule B(3)
Nitrite and nitrate as N (NOx) - soluble by Discrete Analyser
EK059G SOIL APHA 21st ed., 4500 NO3- F. Combined oxidised nitrogen (NO2+NO3) in a water extract is determined by cadmium reduction, and direct colourimetry by Discrete Analyser.
TKN as N by Discrete Analyser EK061G SOIL APHA 21st ed., 4500-Norg-D. Soil samples are digested using Kjeldahl digestion followed by determination by Discrete Analyser.
Total phosphorus by Discrete Analyser
EK067G SOIL APHA 21st ed., 4500 P-B&F. This procedure involves sulfuric acid digestion and quantification using Discrete Analyser.
Total organic carbon EP003 SOIL In-house C-IR17. Dried and pulverised sample is reacted with acid to remove inorganic carbonates, then combusted in a LECO furnace in the presence of strong oxidants/catalysts. The evolved (organic) carbon (as CO2) is automatically measured by infra-red detector.
TPH - semivolatile fraction EP071 SOIL (USEPA SW 846 - 8015A). Sample extracts are analysed by Capillary GC/FID and quantified against alkane standards over the range C10 - C36. This method is compliant with NEPM (1999) schedule B(3) (method 506.1).
TPH volatiles/BTEX EP080 SOIL (USEPA SW 846 - 8260B). Extracts are analysed by Purge and Trap, Capillary GC/MS. Quantification is by comparison against an established 5 point calibration curve. This method is compliant with NEPM (1999) schedule B(3) (method 501).

59
Impacts of intensive agriculture and plantation forestry on water quality in the Latrobe catchment, Victoria
Appendix 2: DPI analytical methods for water and sediment pesticide screens
Water - Multiresidue screen
Water samples were extracted (500 mL; pH adjusted to <2) with a UCT Enviro Clean®Universal Extraction Cartridge 525. The Enviro Clean® 525 cartridge was conditioned with 10 mL each of ethyl acetate: DCM (1:1, v/v) and MeOH before loading the aqueous extract. Compounds of interest were eluted from the cartridge with first 10 mL ethyl acetate, then 2x10 mL ethyl acetate: DCM (1:1 v/v). The combined eluates were concentrated using a rotary evaporator at 30 ˚C under 95 kPa vacuum to about 5 mL. The extract was dried with anhydrous sodium sulphate, then transferred into a test tube and evaporated to near dryness under N2. The residue was reconstituted in 0.2 mL acetone and 1.8 mL hexane. Sulphur was removed using copper granules. The extract was split and directly injected onto GC-PFPD and GC-NPD, or further purified then injected onto GC-ECD. An aliquot (1 mL) of the final extract solution was injected on GC-PFPD and GC-NPD for organophosphates (OP) and fungicides. The other half of the extract was subjected to further clean up using a florisil cartridge to separate organochlorine (OC) and synthetic pyrethroid (SP) compounds. The OC and SP analytes were eluted from the florisil cartridge with 3 mL of DCM: hexane: acetonitrile (50:48:2%). The eluate was evaporated to dryness under N2 and reconstituted in 1 mL hexane. This hexane solution was directly injected into a GC-ECD for SP analysis. A further one to ten dilution of the extract was performed before injection into GC-ECD for OC analysis.
One aliquot (160 mL) was passed through a UCT Enviro Clean®Universal Extraction Cartridge 525 to remove interferences before gas chromatography determination. The Enviro Clean® 525 cartridge was conditioned with 10 mL each of ethyl acetate: DCM (1:1, v/v) and MeOH before loading the aqueous extract. Compounds of interest were eluted from the cartridge with first 10 mL ethyl acetate, then 2x10 mL ethyl acetate: DCM (1:1 v/v). The combined eluates were concentrated using a rotary evaporator at 30 ˚C under 95 kPa vacuum to about 5 mL. The extract was dried with anhydrous sodium sulphate, then transferred into a test tube and evaporated to near dryness under N2. The residue was reconstituted in 0.2 mL acetone and 1.8 mL hexane. Sulphur was removed using copper granules.
All water samples for all sub-projects were analysed for triazine herbicides and LC-MS/MS screen agrochemicals by application of 100 mL of water to a Bond Elute® PPL (500 mg) SPE cartridge, followed by elution with 5 mL of acetonitrile, with the acetonitrile solution in turn inverted into 1 mL of 50 per cent water/methanol. The final solution was injected onto LC-MS/MS for the triazine herbicides and LC-MS/MS screen.
Water - Sulfonylurea herbicides
250 mL of sample was passed through a pre-conditioned C18 1 g SPE column (conditioning is achieved by passing through first 5 mL methanol, followed by 5 mL Milli Q water). The column was rinsed with 10 mL Milli Q water, then eluted with 10 mL methanol. The eluate was evaporated to dryness on a RotaVap at 40 oC, then resuspended in a 1.0 mL methanol vortex. 1.0 mL Milli Q water was then added and vortexed again. Finally it was filtered through a PTFE 0.45 µm filter into a 2 mL screw cap vial for analysis by LC-MS/MS.
Water - Phenoxy acid herbicides
The water samples were analysed for acid herbicides by adjustment of a 250 mL water sample to pH 12 with 1 M NaOH. After being left for 30 minutes, the sample was re-adjusted to pH 7 with 1 M HCl, before being loaded onto an SPE cartridge, (Oasis Max™ SPE is 500 mg, 6 mL; Waters Australia, Mt Waverly, Victoria), which had previously been conditioned with 10 mL MeOH followed by 10 mL water. Thereafter, the cartridge was washed with 12 mL 5 mM sodium acetate (wash discarded) before chemicals of interest were eluted with 12 mL MeOH, (E1; this fraction may contain triazines and other herbicides), washed with 12 mL DCM (wash discarded), and eluted a second time with 5 mL 1 per cent acetic acid in MeOH (E2; this fraction contains MCPB), and then with 8 mL 2 per cent trifluoroacetic acid (TFA) in MeOH. (E3; contains all the target acid herbicides except MCPB). The solutions obtained at steps E2 and E3 were evaporated to dryness under nitrogen, before being reconstituted in 0.5 mL MeOH/H2O (1:1). The E2 and E3 solutions were injected directly onto LC-MS/MS for analysis.
Sediments - Multiresidue screen
Sediment samples were dried and ground, then shaken (5 g) for 30 min with 30 mL of 35 per cent water/acetone (adjusted to pH <3) on a mechanical shaker. After shaking, the mixture was sonicated for 15 min, then centrifuged at 2800 rpm for 5 min. Thereafter, the supernatant liquid was passed through a glass fibre filter and collected in a 250 mL flask. The extraction was repeated with 30 mL and the combined filtered extract was concentrated to around 20 mL on a rotary evaporator at 30 ˚C under 95 kPa vacuum. The concentrated extract was transferred into a 250 mL measuring cylinder. The rotary evaporator flask was rinsed with 1 mL MeOH and added to the concentrated extract along with sufficient Mill-Q water to make the final volume 240 mL. The aqueous extract was split into two parts which were subjected to different SPE clean up procedures.
One aliquot (160 mL) was passed through a UCT Enviro Clean®Universal Extraction Cartridge 525 to remove interferences before the gas chromatography determination. The Enviro Clean® 525 cartridge was conditioned with 10 mL each of ethyl acetate:DCM (1:1, v/v) and MeOH before loading the aqueous extract. Compounds of interest were eluted from the cartridge with first 10 mL ethyl acetate, then 2x10 mL ethyl acetate:DCM (1:1 v/v). The combined eluates were concentrated using a rotary evaporator at 30 ˚C under 95 kPa vacuum to about 5 mL. The extract was dried with anhydrous sodium sulphate, then transferred into a test tube and evaporated to near dryness under N2. The residue was reconstituted in 0.2 mL acetone and 1.8 mL hexane. Sulphur was removed using copper granules.
An aliquot (1 mL) of the final extract solution was injected on GC-PFPD and GC-NPD for organophosphates (OP) and fungicides. The other half of the extract was subjected to further clean up using a florisil cartridge to separate organochlorines (OC) and synthetic pyrethroid (SP) compounds. The OC and SP analytes were eluted from the florisil

60
Impacts of intensive agriculture and plantation forestry on water quality in the Latrobe catchment, Victoria
cartridge with 3 mL of DCM:hexane:acetonitrile (50:48:2%). The eluate was evaporated to dryness under N2 and reconstituted in 1 mL hexane. This hexane solution was directly injected into a GC-ECD for SP analysis. A further one to ten dilution of the extract was performed before injection into GC-ECD for OC analysis.
The second aliquot (80 mL) was transferred onto a Bond Elut® PPL 500 mg/3 mL SPE cartridge for LC-tandem mass spectrometry. The Bond Elut® PPL was pre-conditioned with 5 mL MeOH followed by 5 mL Mill-Q water. Then the 80 mL aqueous extract was loaded on the cartridge. Target compounds collected on the cartridge were eluted with 5 mL acetonitrile. The eluate was evaporated to dryness under a stream of N2. The residues were dissolved in 1 mL MeOH:H2O (1:1, v/v). The final extract was filtered through a 0.45 µm PTFE syringe filter before analysis by LC-tandem mass spectrometry. Sediment samples were analysed for levels of organic carbon using the method of Walkley and Black as listed in Rayment and Lyons (2010).
Analytical methods: Sediments - Sulfonylurea herbicides
5.0 ± 0.05 g of test sample was weighed into a 50 ml centrifuge tube. 25 mL of 2 per cent (v/v) NH4OH in methanol was added, capped tightly and shaken vigorously on the flask shaker for 1 hour, with the bottle in a horizontal position. It was centrifuged at 1500 rpm for 5 minutes and the supernatant decanted through a Whatman GF/A filter paper into a 250 mL round bottom flask. The extraction was repeated with a further 25 ml of 2 per cent (v/v) NH4OH in methanol, then the supernatant added to the extract already in the round bottom flask.
The methanol extract was then evaporated on the rotary evaporator with the water bath set at 60 oC until 10 mL of solvent remained. The residue was transferred to a 50 mL centrifuge tube using 2x10 ml of 0.5 per cent (v/v) NH4OH + 15 (w/v) NaCl in deionised H2O to wash the round bottom flask, then transferring the washings to the 50 mL centrifuge tube. 2x10 mL dichloromethane was sequentially added to the 50 mL centrifuge tube and the aqueous phase extracted by shaking vigorously for 1 minute. The phases where allowed to separate and each of the dichloromethane layers discarded. Stirring constantly, pH was checked with pH paper and the pH adjusted to 3.0 ± 0.5 with 5 M HCl. The aqueous phase was then extracted by adding 10 mL dichloromethane and shaking vigorously for 1 minute. The phases were allowed to separate. The lower organic layer was transferred into a 50 mL test tube before the extraction was repeated with a further 5 mL volume of dichloromethane.
Finally, the dichloromethane extract was evaporated under nitrogen until just dry, then resuspended in 1.0 mL 50 per cent v/v methanol/water. The extract was then filtered into 2 mL HPLC vial for determination by LC-MS/MS.
Analytical methods: Sediments - Phenoxy acid herbicides
5.0 g of dried sediment was weighed into a 50 mL centrifuge tube, 30 mL of 0.1 M NaOH in 10 per cent NaCl added and then shaken for 30 minutes followed by sonication for 30 minutes. It was then centrifuged at 1500 rpm for 5 minutes and the supernatant decanted into a second 50 mL centrifuge tube. The extraction was repeated with 20 mL of 0.1 M NaOH in 10 per cent NaCl. The extracts were combined in the second 50 mL centrifuge tube. 20 mL of the extract was acidified to pH≈2.5 with sulphuric acid. pH was checked with a Merck Universal pH indicator paper.
The acidified, aqueous solution was partitioned into two aliquots (2x5 mL) of DCM, then the DCM extracts collected in a 15 mL test tube. Each DCM extract was concentrated to a dryness on a nitrogen manifold, resuspended in 1.0 mL 50 per cent v/v methanol/water and filtered into a 2 mL HPLC vial for determination by LC-MS/MS.

61
Impacts of intensive agriculture and plantation forestry on water quality in the Latrobe catchment, Victoria
Appendix 3: Agrochemical residues - Limits of reporting
The sediment and water sample extracts were applied to GC and LC systems with specific detectors for the following screen tests, with the LORs (limits of reporting) for each compound, sample type and instrument system. More detailed descriptions of the instrumental configurations and quality assurance procedures can be found in Schäfer et al. (2011) and Rose et al. (2010).
LOR µg/L (water)
µg/kg (sediment)
µg/L (water)
µg/kg (sediment)
Organophosphates by GC-PFPD Synthetic Pyrethroids by GC ECD
Dichlorvos 0.05 5 Bifenthrin 0.02 5
Parathion ethyl 0.05 4 Cyfluthrin 0.02 4
Parathion methyl 0.05 3 Cyhalothrin 0.01 5
Chlorpyrifos 0.04 4 Cypermethrin 0.05 5
Chlorpyrifos methyl 0.05 4 Deltamethrin 0.02 4
Ethion 0.05 2 Esfenvalerate 0.05 4
Fenchlorphos 0.05 12 Fenvalerate 0.02 4
Fenitrothion 0.05 3 Permethrin 0.1 20
Fenthion 0.05 3 Fipronil and metabolites by LC-MS/MS
Malathion 0.05 4 Fipronil 0.005
Prothiofos 0.1 4 Fipronil sulfide 0.005
Buprofezin and fungicides by GC-NPD Fipronil sulfone 0.005
Bupirimate 0.1 50 Fipronil desulfinyl 0.005 2
Buprofezin 0.1 50 Phenoxy acid herbicides by LC-MS/MS 2
Chlorothalonil 0.2 500 Clopyralid 0.4 2
Iprodione 0.2 150 Picloram 0.8 2
Procymidone 0.5 150 Dicamba 0.4
Organochlorines by GC ECD Fluroxypyr 0.01
HCB 0.01 3 2,4-D 0.005 30
Lindane 0.01 3 MCPA 0.005 30
Aldrin 0.01 4 MCPB 0.01 30
Heptachlor epoxide 0.01 2 Triclopyr 0.02 20
p,p'-DDE 0.01 3 Sulfonylurea herbicides by LC-MS/MS
p,p'-DDD 0.01 5 Triasulfuron 0.01 10
p,p'-DDT 0.01 5 Metsulfuron methyl 0.01 10
Dieldrin 0.01 4 Sulfometuron methyl 0.05 10
BHC-alpha 0.01 3 Chlorsulfuron 0.01 10
BHC-beta 0.01 5 Tribenuron methyl 0.01 ND
BHC-delta 0.01 2 Bensulfuron methyl 0.01 10
Heptachlor 0.01 4
Oxychlordane 0.01 4

62
Impacts of intensive agriculture and plantation forestry on water quality in the Latrobe catchment, Victoria
LOR µg/L (water)
µg/kg (sediment)
µg/L (water)
µg/kg (sediment)
trans-Chlordane 0.01 4
cis-Chlordane 0.01 4
Endrin 0.01 4
Endosulfan-alpha 0.01 5
Endosulfan-beta 0.01 5
Endosulfan sulfate 0.01 7
Triazine and other herbicides by
LC-MS/MS
Triazine and other herbicides by
LC-MS/MS
Desisopropyl-atrazine 0.005 5 Tebufenozide 0.002 1
Desethyl-atrazine 0.005 5 Fenoxycarb 0.002 1
Metribuzin 0.005 5 Cyprodinil 0.005 5
Simazine 0.005 5 Penconazole 0.002 2
Hexazinone 0.005 5 Diazinon 0.002 2
Cyanazine 0.005 5 Tebuconazole 0.005 4
Propachlor 0.005 10 Propiconazole 0.002 4
Atrazine 0.003 5 Pyraclostrobin 0.002 1
Diuron 0.01 20 Prochloraz 0.005 ND
Propazine 0.005 10 Difenoconazole 0.005 2
Terbuthylazine 0.005 10 Trifloxystrobin 0.002 1
Metolachlor 0.005 10 Indoxacarb 0.005 2
Prometryn 0.005 5 Propargite 0.05 4
Terbutryn 0.005 5 Spinosad 0.05 ND
Linuron 0.005 2 Azinphos Ethyl 0.005 5
Pendimethalin 0.05 10 Triadimenol 0.002 2
Omethoate 0.005 5 Fenarimol 0.01 5
Methomyl 0.005 2 Tetraconazole 0.002 2
Pymetrozine 0.005 ND Fenamiphos 0.002 5
Imidacloprid 0.005 5
Trichlorfon 0.005 5
Dimethoate 0.002 2
Mevinphos 0.002 2
Oxadixyl 0.002 1
Carbaryl 0.005 2
Thiodicarb 0.005 ND
Pirimicarb 0.002 1
Metalaxyl 0.002 1
Methidathion 0.005 3

63
Impacts of intensive agriculture and plantation forestry on water quality in the Latrobe catchment, Victoria
LOR µg/L (water)
µg/kg (sediment)
µg/L (water)
µg/kg (sediment)
Azinphos Methyl 0.002 3
Azoxystrobin 0.002 1
Pyrimethanil 0.005 3
Methiocarb 0.005 2
Boscalid 0.005 3
Dimethomorph 0.002 4
Propyzamide 0.005 ND
Triadimefon 0.01 2
Cyproconazole 0.005 5
Myclobutanil 0.002 2

64 www.epa.vic.gov.au T: 1300 EPA VIC F: 03 9695 2610
Impacts of intensive agriculture and plantation forestry on water quality in the Latrobe catchment, Victoria
Appendix 4: Equipment and methodology for passive sampling
The design of the original Chemcatcher passive sampler is described in Kingston et al. (2000). Each sampler comprises of a PTFE body which supports a microporous diffusion-limiting membrane and a solid receiving phase (figure 17).
Figure 17. Components of a Chemcatcher passive sampler system (left) and completed unit (right).
In this study, an Empore C18 disk was used as the receiving phase and a polyethersulfone (PES) membrane used as the diffusion-limiting membrane. The Empore disks and membranes were conditioned by soaking for about 30 minutes in methanol and then deionised water. Once assembled the Chemcatcher holder was filled with deionised water to cover the disk and membrane, and the PTFE transport lid screwed on. The passive samplers were then randomly chosen for deployment at specific sites, with the samplers placed in labeled, zip-lock, plastic bags for transport.
Field deployment and retrieval of passive samplers followed procedures and protocols used by DPI (Department of Primary Industries) Future Farming Systems Research (FFSR) in the past. This involved placing the passive sampler in a plastic cage with one sampler per basket (two replicates for each design at each site). The plastic baskets were then submerged in the river/creek below the waterline, with the basket tied to a stable point to keep the basket hanging in the water column. The passive samplers were retrieved and transported at 4 ⁰C to the DPI Queenscliff laboratory for chemical analysis. Water samples (collected in 1 L acetone washed, amber glass bottles) were taken at both deployment and upon retrieval of the passive samplers for measurement of triazine herbicide concentrations. A field blank, which is used to monitor potential contamination of the Chemcatcher during transportation, was carried out at a randomly selected site. A laboratory blank was also used to monitor potential contamination during sampler elution in the laboratory.
Passive samplers were disassembled at DPI Queenscliff Centre, and the receiving disk and PES membrane dried at 35 °C on a hotplate for approximately 1.5 hours. Each disk was wrapped separately in aluminium foil, labeled, placed inside another labeled plastic bag and stored at 4 °C until analyte elution. Each disk was eluted with methanol (2x4 mL) into a glass tube and the resulting solution evaporated to dryness with N2. In this dry form, the sample was transported to DPI Macleod Centre, where the residue was redissolved in methanol (0.2 mL) and diluted with water (1 mL). Water samples and passive sampler extracts were analysed at DPI Macleod Centre. All water samples were analysed for triazine herbicides agrochemicals by application of 100 mL of water to a Bond Elute® PPL (500 mg) SPE cartridge, followed by elution with 5 mL of acetonitrile, with the acetonitrile solution in turn inverted into 1 mL of 50 per cent water/methanol. A concentrated aliquot of the extract (1 mL of 50 per cent methanol/water) was injected directly into LC-MS/MS (Varian 1200L Quadrupole LC-MS/MS; Varian, Mulgrave, Australia) for the analysis of seven triazine herbicides.