impacts of depleting forage species in the california current for sardines (sardinops sagax) and...
TRANSCRIPT

Environmental Conservation: page 1 of 14 C© Foundation for Environmental Conservation 2013 doi:10.1017/S0376892913000052
THEMATIC SECTIONPolitics, science and
policy of reference pointsfor resource management
Impacts of depleting forage species in the CaliforniaCurrent
ISAAC C. KAPLAN 1 ∗, CHRISTOPHER J . B R O W N 2 ,ELIZABETH A. F ULTON 3 , I RIS A. G RAY 1 , JO H N C. F I E L D 4
A N D AN T H O N Y D . M . S M I T H 3
1Conservation Biology Division, Northwest Fisheries Science Center, National Marine Fisheries Service, NationalOceanic and Atmospheric Administration, 2725 Montlake Boulevard E, Seattle WA 98112, USA, 2ClimateAdaptation Flagship, CSIRO Marine and Atmospheric Research, Ecosciences Precinct, GPO Box 2583, Brisbane,Queensland 4102, Australia (Current address: The Global Change Institute, The University of Queensland, StLucia QLD 4072, Australia), 3CSIRO Wealth from Oceans Flagship, Division of Marine and AtmosphericResearch, GPO Box 1538, Hobart, Tasmania 7001, Australia, and 4Fisheries Ecology Division, SouthwestFisheries Science Center, National Marine Fisheries Service, National Oceanic and Atmospheric Administration,110 Shaffer Road, Santa Cruz, CA 95060, USADate submitted: 2 May 2012; Date accepted: 17 December 2012
SUMMARY
Human demands for food and fish meal are oftenin direct competition with forage needs of marinemammals, birds and piscivorous harvested fish.Here, two well-developed ecosystem models for theCalifornia Current on the West Coast of the USAwere used to test the impacts on other parts ofthe ecosystem of harvesting euphausiids, forage fish,mackerel and mesopelagic fish such as myctophids.Depleting individual forage groups to levels that led tomaximum sustainable yield of those groups may haveboth positive and negative effects on other species in theCalifornia Current. The most common impacts wereon predators of forage groups, some of which showeddeclines of >20% under the scenarios that involveddepletion of forage groups to 40% of unfished levels.Depletion of euphausiids and forage fish, which eachcomprise >10% of system biomass, had the largestimpact on other species. Depleting euphausiids to 40%of unfished levels altered the abundance of 13–30% ofthe other functional groups by >20%; while depletingforage fish to 40% altered the abundance of 20–50% ofthe other functional groups by >20%. There are cleartrade-offs between the harvest of forage groups andthe ability of the California Current to sustain othertrophic levels. Though higher trophic level species,such as groundfish, are often managed on the basis ofreference points that can reduce biomass to below halfof unfished levels, this level of forage species removal islikely to impact the abundance of other target species,protected species and the structure of the ecosystem.
Keywords: ecosystem modelling, euphausiids, food web,forage fish, lower trophic level species, sardine
∗Correspondence: Dr Isaac Kaplan, Tel: +1 206 302 2446 Fax: +1206 860 3394 e-mail: [email protected]
INTRODUCTION
Human demands for food and fish meal are in manycases in direct competition with forage needs of marinemammals, birds and piscivorous harvested fish. Globally,harvest of forage species such as sardines, anchovy, herringand euphausiids (or krill) total approximately 30 milliontonnes and account for >30% of global fisheries landings.These forage species are generally plankton feeders, are highlyabundant, form dense aggregations, and are the principalmeans of transferring production from phytoplankton andzooplankton to predators such as larger fish, birds andmammals (Smith et al. 2011). Harvest of Peruvian anchoveta(Engraulis ringens) alone exceeded 7 million tonnes in 2006(Alder et al. 2008; Tacon & Metian 2009). Conversely, smallpelagic fish such as sardines and anchovies may account for upto 12.5% of seabird diets and up to 20% of the diets of certainmarine mammals worldwide (Karpouzi et al. 2007; Kaschneret al. 2006). In ‘wasp-waist’ systems, such as the BenguelaCurrent off Namibia and South Africa, a limited numberof forage species play critical roles in transferring primaryand plankton production to higher trophic levels (Shannon2000). In pelagic food webs, myctophids (lanternfish) can linkplankton to harvested species such as squids, tunas, mackereland salmonids (Nagasawa et al. 1997), and increasinglymyctophids may become the targets of commercial fisheriesoperations (Valinassab et al. 2007).
Fluctuations in dominant forage species such as Peruviananchoveta have long been shown to have substantial impactson seabirds and other predators (Murphy 1925) such asHumboldt penguins Spheniscus humboldti (Taylor et al. 2002).In fact, the combination of fishery removals and climatevariability led to the collapse of the Peruvian anchovetafishery in the 1970s, contributing to one of the most massivedeclines in seabirds and other top predators ever observed(Muck 1989). In the North Sea, Norwegian Sea and BarentsSea, industrial fisheries target forage fish such as sand lance,capelin and herring, despite evidence that forage fish support

2 I. C. Kaplan et al.
mammals and birds in these regions (Anker-Nilssen et al.1997; Gjosoeter 1997; Frederiksen et al. 2004). Effects offorage species abundance on seabirds have been demonstratedempirically for a wide range of both species types (Cury et al.2011).
In a recent ecosystem modelling study, Smith et al. (2011)found that across five regions, harvest of forage groups hadlarge impacts on many other species. This was particularlytrue for forage groups that comprised large portions of anecosystem’s biomass, or that were highly connected in thefood web (for example, possessing many predator/prey links).Impacts of more than ± 40% were observed throughout thefood webs, for mammals, birds and fishery target species, andfor a wide variety of other groups. Depleting forage groups to75% of unfished abundance, rather than the 40% target thatis typically applied to non-forage groups, reduced long termfishery yields by 20%, but also reduced impacts throughoutthe food web.
Smith et al. (2011) provided synthesis and summaries ofthe results, in particular the patterns consistent across the fiveecosystems. However, they focused on only the most severeeffects (responses of >40%), did not provide specific guidancefor regions such as the California Current on the west coastof North America, and did not place depletion levels (forexample 40% or 75%) in the context of productivity estimatesand reference points for individual species. In the USAand in other countries, reference points based on maximumsustainable yield (MSY) are central to management decisionsand goals (US Department of Commerce 2007; EuropeanCommission 2010).
Fishery managers in the USA’s portion of the CaliforniaCurrent have limited the harvests of forage species, forinstance with a ban prohibiting development of euphausiid(krill) fisheries in USA waters (Pacific Fishery ManagementCouncil 2006). Over three decades ago, the Pacific FisheryManagement Council established ‘set-asides’ for anchovy(Engraulis mordax), minimum biomass thresholds belowwhich catch is not removed (Pacific Fishery ManagementCouncil 1978). Currently such minimum thresholds are inplace for sardines (Sardinops sagax) and Pacific mackerel(Scomber japonicus) (Hill et al. 2008; Crone et al. 2009),buffering for temporal variability in the environment andrecruitment, as well as allowing a minimum prey base forother species. These management guidelines were establishedas a precaution on the evidence that forage species play keyroles in the ecosystem, based on observations suggestinga relationship between fish abundance and the breedingsuccess of predators (Anderson et al. 1982). However, explicitsystematic consideration of ecosystem impacts, such as thatby Smith et al. (2011), was not undertaken at the time, as thenecessary ecosystem models were not yet available.
In the intervening years there has been much attention onthe development of trophic and ‘whole of system’ ecosystemmodels. Here we use two well-developed ecosystem modelsof the California Current to test the impacts on other parts ofthe ecosystem of harvesting four forage groups. These multi-
species models allow us to capture how the harvest of foragegroups affects other species through the food web. The twomodels make different, but realistic, assumptions about howchanges in prey base affect predator diets. We use both modeltypes to test whether results are consistent across differingstructural assumptions. Smith et al. (2011) found that generalconclusions regarding forage fish were consistent across threemodel types and five ecosystems, but that strong differencesin the magnitude of impacts across food webs may occuramong models and regions. Our work here presents detailedresults specifically for the California Current. The modellingapproach allows us to evaluate the food web impacts of harveststrategies, including no fishing, and alternatively depletingforage groups to 40% of unharvested levels, a commonfishery management target for non-forage stocks (Clark 2002).We also test higher levels of fishing (depletion to 20% ofunharvested levels), and reduced levels of fishing (depletionto 75% of unharvested levels), and make explicit comparisonsto management reference points derived directly from theseecosystem models and from single species approaches. Weidentify protected species and commercially harvested speciesvulnerable to reductions in the forage base. Given the globaleconomic demand for forage species, and the current status of24 of 28 major worldwide forage fish stocks as fully exploited oroverfished (Alder et al. 2008), the results are highly relevantfor setting harvest guidelines and management policies forlower trophic level species.
METHODS
System description
The California Current is a productive upwelling systemwhere the abundance of forage groups influences thepopulation dynamics, growth and behaviour of other groupsin the food web. Coupled with wind-driven upwelling, thiseastern boundary current drives delivery of nutrients to thesurface waters. The oceanography and biological productivityof the system are also highly influenced by multi-annualcycles of El Nino-Southern Oscillation and the patterns of thePacific Decadal Oscillation (Barber & Chavez 1983; Checkley& Barth 2009). Both of these climate drivers influence nutrientavailability, primary productivity, and the recruitment andgrowth of fish, bird and mammal species. Though most lowertrophic level or forage species show high variability, sardinesand anchovies in particular show strong out-of-phase cyclingof population abundance, synchronous with other Pacificstocks (MacCall 1996: Schwartzlose et al. 1999; Chavez et al.2003). Koslow et al. (2011) have demonstrated decadal scalevariability in the abundance of mesopelagic fish such asmyctophids, driven by the response of midwater oxygenconcentrations to climate trends and variation.
Lower trophic level groups differ in their importance asprey for other species in the food web. Euphausiids and foragefish such as sardines and anchovies have high biomasses andproduction rates and are also key prey species (Pacific Fishery

Forage species in the California Current 3
Management Council 2008). In a recent summary of existingpredator diet information, Dufault et al. (2009) identified afeeding guild of 17 fish species that have euphausiids (largezooplankton) as their primary diet item. This guild includedPacific hake (Merluccius productus), the target of the largestfinfish fishery on the USA’s West Coast. Barlow et al. (2008)estimated that euphausiids comprise 40% of the prey biomassconsumed by cetaceans in the California Current, totallingc. 800 000 t. Forage fish (small planktivores) are the mostcommon diet item for at least four fish species as well as surfacefeeding birds (such as glaucous-winged gulls Larus glaucescens)and migrating seabirds (for example sooty shearwaters Puffinusgriseus) (Dufault et al. 2009). Forage fish comprise >5% ofthe diets of 13 of the 52 species of groundfish and pelagicfish (Dufault et al. 2009). Both euphausiids and forage fishare important diet items of Pacific salmon, Oncorhynchus spp.(Daly et al. 2009), which play a central cultural and economicrole in local recreational and commercial fisheries. Interannualvariability in abundance of forage species such as euphausiidsand anchovies, driven by oceanographic patterns of El Niño-La Niña, has been shown to drive the abundance, conditionand behaviour of upper trophic levels, including sea birds(Thayer & Sydeman 2007; Ainley et al. 2009; Hipfner 2009)and whales (Benson et al. 2002). Other forage species suchas mackerel and mesopelagic fish are important prey species,particularly for pelagic predators, but are a smaller portionof diets for groundfish. Fisheries currently target mackerel,sardine and to a lesser extent anchovy, but do not harvestmesopelagic fish or euphausiids.
Model descriptions
Northern California Current Ecosim model (Ecosim-NCC)The Ecosim-NCC (Northern California Current) model wasdeveloped by Field et al. (2006) to investigate the impactsof environmental variability, predation and fishing on theNorthern California Current ecosystem. The Ecosim-NCCmodel covers the area from the USA–Canada border (48◦
23′ N) to Cape Mendocino (40◦ 26′ N) and out to 1200 mdepth. The model region covers approximately 70 000 km2
(Fig. 1), has 63 functional groups (groups of functionallysimilar species that are aggregated and modelled as a singlevariable) and is initialized at 1960. The Ecosim code basesimulates predator-prey relationships between functionalgroups, implicit refuges from predation, and time-varyingdiets, but it is not spatially disaggregated (Walters 2000;Christensen & Walters 2004). At its core, Ecosim solves aset of differential equations on a monthly time step, basedon initial conditions (biomasses) and rate parameters thatrepresent predation and growth rates of biomass pools. TheField et al. (2006) implementation of Ecosim did not includeage structure of populations, nor did it track size-at-age orgape relationships (namely prey size relative to predator mouthsize).
The Ecosim model is driven by two indices related toenvironmental conditions. The first is an index of ocean
Figure 1 Spatial extent of the Central California Atlantis model(CCAM) and the Northern California Current Ecosim model(Ecosim-NCC). The Atlantis-CCAM model domain is displayedhere as irregular polygons. The Ecosim-NCC model is not spatiallyexplicit, but represents the area shoreward of the 1200 m isobath(bold rectangle).
production (Logerwell et al. 2003) that represents local oceanconditions and lower trophic level productivity, and that hereis used to force phytoplankton production for the period1960 to 2003. The other, the Pacific Decadal Oscillation(Mantua et al. 1997), is a broad-scale index of the ocean’sphysical environment, including temperature. The PacificDecadal Oscillation index is used to force consumption bykey predators for the period 1960 to 2003, by increasingvulnerability of prey to predators as temperatures increase.This forcing represents changes in the physical environmentthat affect the species composition of the California Current,leading to higher abundances of predators such as hake,sardine and mackerel during warm (positive) phases of thePacific Decadal Oscillation. Field et al. (2006) demonstratedthat both forcing indices improve the ability of the modelto represent changes in the biomass of key species over theperiod 1960 to 2003. A complete description of the Ecosim-

4 I. C. Kaplan et al.
NCC model, including climate forcing, can be found in Fieldet al. (2006).
In Ecosim-NCC, we ran five sets of simulations thateach tested the impact of depleting one of the followingfive functional groups (note that each functional group iscomposed of several species, with the exception of Californiasardine, which is modelled as a single-species functionalgroup):
� Euphausiids: principally Euphasia pacifica, Thysanoessaspinifera and Nyctiphanes simplex,
� Forage fish: northern anchovy (Engraulis mordax), Pacificherring (Clupea pallasi), sand lance (Ammodytes hexapterus),eulachon (Thaleichthys pacificus), American shad (Alosasapidissima), surf smelt (Hypomesus pretiosus), whitebaitsmelt (Allosmerus elongates) and other clupeids,
� California sardine: Sardinops sagax,� Mesopelagic fish: deep vertically-migrating fish species
including myctophids,� Mackerel: jack and Pacific mackerel (Trachurus symetricus
and Scomber japonicus).
Central California Atlantis Model (Atlantis-CCAM)The California Current Atlantis model (Atlantis-CCAM)extends along the USA’s West Coast from the Canadianborder to Point Conception (34◦ 27′ N), and out to 1200m depth (Fig. 1). The model domain is divided into 82 spatialcells and up to five vertical depth layers per cell. The full modelis detailed in Horne et al. (2010). An earlier implementationof the model has been applied to test the effects of oceanacidification (Kaplan et al. 2010), and the latest version hasbeen used to test harvest strategies (Kaplan & Leonard 2012;Kaplan et al. 2012). This new version contains updatedestimates of abundance from stock assessments and surveys,as well as added spatial resolution in Central California. Themodel covers 94 000 km2, and includes 60 functional groups,ranging from phytoplankton to marine mammals, birds andharvested fish groups. The model has particular emphasis ongroundfish species, modelling some species such as Dover sole(Microstomus pacificus) and canary rockfish (Sebastes pinniger)as single species with multiple life history stages, rather thanaggregated functional groups. Water temperature and the fluxof nutrients and plankton are forced with a repeating loop ofoutput for years 1958–2005 from a ROMS (Regional OceanModelling System) hydrodynamic model. The Atlantis modelhas been calibrated against historical estimates of abundancefor 1950–2007, from stock assessments and survey data, asdetailed in Horne et al. (2010). One of the key inputs, thediet matrix that initializes the predator-prey relationship, hasbeen published by Dufault et al. (2009). Minor modificationsto Atlantis-CCAM and minor changes in model behavioursince Smith et al. (2011) are detailed in Appendix 1 (seesupplementary material at Journals.cambridge.org/ENC).
Like Ecosim, Atlantis is a code base that solves a setof differential equations to simulate food web and fisherydynamics. Atlantis operates on a 12-hour time step, and
includes migrations and foraging movement, age structureand dynamic size-at-age for vertebrates, and simpler biomasspools for invertebrates and primary producers (Fulton 2004;Fulton et al. 2005). Predator-prey models explicitly calculatespatial overlap between species, and predator gape. Fultonet al. (2011) compared the California Current model to otherAtlantis models, and summarized lessons learned from thisand other applications of Atlantis. Plagányi (2007) offereda comprehensive comparison of Atlantis, Ecosim, and otherecosystem models and their applications.
For this analysis of lower trophic level species, we testedfour sets of fishing simulations, each of which simulateddepletion of one of the following four functional groups inthe Atlantis-CCAM (here and throughout, we use functionalgroup names consistent with Ecosim-NCC where possible;where the functional group names differ in Atlantis-CCAM,we list them in parentheses):
� Euphausiids (large zooplankton): primarily euphausiids,but also chaetognaths, pelagic polychaetes and pelagicshrimp,
� Forage fish (small planktivores): Pacific sardine Sardinopssagax, northern anchovy Engraulis mordax, Pacific herringClupea pallasii and smelt (Osmeridae),
� Mesopelagic fish (deep vertically- migrating fish):Myctophidae, longfin dragonfish Tacostoma macropus andPacific viperfish Chauliodus macouni,
� Mackerel (large planktivores): jack mackerel Trachurussymmetricus and Pacific mackerel Scomber japonicus.
Harvest scenarios: depletion of individual foragegroups
Following the methods in Smith et al. (2011), we projected themodels from current biomass levels (2007–2008 abundances)forward for 50 years with specified constant levels of fishingmortality (% yr−1) (for example, Appendix 1, Fig. S1.1,see supplementary material at Journals.cambridge.org/ENC).For Atlantis-CCAM, this is straightforward since thebase model’s initial conditions and fishing mortality ratesrepresent 2007–2008 abundances; oceanographic conditionswere repeated into the future by repeating the available 47year loop of ROMS output. Ecosim-NCC’s initial conditionsrepresent 1960, and we therefore simulated 1960 through2006, and then continued the simulations for 50 additionalyears. In this case, from 1960–2006 we applied historicalenvironmental forcing, fishing effort and fishing mortalitytime-series in order to bring the biomasses to 2007 levels,and we then kept fishing mortality rates and climate forcingat constant (2006) levels for the remaining years of thesimulations (2007–2056). For both models, the status quoscenario imposed fishing mortality from existing fleets andgears onto all relevant functional groups. Atlantis-CCAMincludes spatial closures to certain fishing gears; Ecosim-NCCis not spatially explicit.

Forage species in the California Current 5
For each simulation other than status quo, we chose oneforage group of interest and applied a range of experimentalfishing mortality rates (F) varying from 0 to an upper limitthat resulted in extirpation of the group. Within a singlesimulation, fishing mortality rates (% yr−1) were kept constantover 50 years. We report these fishing mortality rates asrealized fishing mortality rates, equivalent to catch/biomassfor a reference year. All other forage groups and otherharvested species were fished with status quo harvest rates.
Since the groups of interest had reached quasi-equilibriumby the end of the simulation, we assumed that the averagebiomass and catch in the final years were a proxy forequilibrium biomass and yield. In Atlantis-CCAM, for allgroups except euphausiids, biomass and yield were averagedover the final five years (years 46–50) to smooth over seasonaland interannual variations driven by the oceanographic model(ROMS). The euphausiid group exhibited highly variablebiomass dynamics due to its high productivity and rapidturnover rate. Therefore, biomass and yield for euphausiidswere averaged over the last 20 years of the simulation (years31–50). In Ecosim-NCC, which has no seasonal variation,the biomass and yield were taken from the final year ofthe simulations; neither euphausiids nor other forage groupsdemonstrate strong seasonality or interannual variability inEcosim-NCC.
We took the biomass from the final year(s) of the F = 0simulation as our estimate of unfished biomass (B100). Weplotted equilibrium biomass versus F and equilibrium yieldversus F from all simulations (Appendix 2, Figs S2.1–S2.18,see supplementary material at Journals.cambridge.org/ENC).From these plots we estimated reference points including Fat MSY (FMSY), F0 (which drives the stock to extinction), F20
(which drives the stock to B20, 20% of B100), F40 (which drivesthe stock to B40, 40% of B100) and F75 (which drives the stockto B75, 75% of B100).
Harvest scenarios: simultaneous depletion of fourforage groups
The final set of simulations involved simultaneous depletionof four forage groups in each model. Using a set of fishingmortality rates (either F0, F20, F40 or F75) determinedabove, we simulated 50 years of joint harvest of foragefish, euphausiids, mesopelagic fish and mackerel. Note thatinteractions between species imply that a fishing mortalityrate (such as F20) that caused a specific level of depletion(for example 20% of unfished abundance) in the single-species tests might lead to different depletion levels underjoint exploitation of all forage species.
Quantifying proportion of groups with >20% response
Impacts on groups other than the focal forage groupwere identified by calculating a response ratio, equal tothe equilibrium biomass of each group, relative to itsequilibrium biomass in the scenario with no fishing on
the focal group and status quo fishing on all others (forexample Appendix 3, Fig. S3.7, see supplementary materialat Journals.cambridge.org/ENC). For instance, we ran onefifty-year simulation with heavy fishing on forage fish, and asecond with no fishing on forage fish, and found that in theformer simulation a rockfish group (yelloweye and cowcod)had 45% lower final abundance than in the latter. We thereforerecorded a –0.45 response ratio of this rockfish group to foragefish depletion. We also calculated the percentage of groupsthat changed in biomass (positive or negative) by more than20% over the 50-year simulation. We chose 20% as the cut-off, rather than the 40% threshold used in the global analysisof Smith et al. (2011), since for this region specifically weobserved many groups with responses of between 20–40%.Note that this portion of the analysis retains the originaltaxonomic resolution of the individual models (namely speciesor functional groups).
Comparing standardized output between models
Since Atlantis-CCAM and Ecosim-NCC have slightlydifferent taxonomic resolution of functional groups, weaggregated output into standardized functional groups thatwere consistent between models (Appendix 4, Table S4.1,see supplementary material at Journals.cambridge.org/ENC).This allows direct comparison of the two models’ predictions.We plotted the response ratios of each standardized functionalgroup, averaging responses of component groups (for examplethe standardized group ‘slope rockfish’ had an Atlantisresponse ratio that was the average of the response ratios ofAtlantis groups ‘deep small rockfish’ and ‘deep large rockfish’).In order to quantify differences in the diet compositionsof the two models, we also used this aggregated approach,calculating average diet compositions for each model afteraggregating predators and prey into standardized groups(Appendix 4, Table S4.2, see supplementary material atJournals.cambridge.org/ENC).
To provide context for our results, we summarize previousstudies estimating optimal fishing rates for forage groupsfrom a single species perspective, and previous multi-species modelling focused on sardines in Appendix 1 (seesupplementary material at Journals.cambridge.org/ENC).
RESULTS
Mackerel
In Ecosim-NCC, mackerel have a low relative biomassand production (Table 1), as this model was initialized torepresent a period when mackerel biomass was at recordlow levels. Hence, fishing this group had very little effecton the ecosystem (Fig. 2; Appendix 2, Figs S2.1 and S2.2;Appendix 3, Figs S3.1 and S3.2, see supplementary materialat Journals.cambridge.org/ENC). Simulated harvests werevery low, for instance 0.06 t km−2 in the F40 case for 2008 andall subsequent years (Table 1). Several prey species showed

6 I. C. Kaplan et al.
Table 1 Biomass as a percentage of the total ecosystem biomass in the Ecosim-NCC and Atlantis-CCAM models, and productionrate per year of forage species in the Ecosim-NCC model. The Atlantis model does not have a production rate input. Depletionexperiments were run for all groups listed here. Trophic level is estimated within the Ecosim model. ‘Initial harvest for F40’ allowscomparison of the scale of biomass removal for each species, representing the catch during the first year of a simulation in whichfishing mortality is set such that equilibirum biomass reaches 40% of unfished levels.
Per cent biomass Production/biomass Initial harvest, for F40 (t km−2)
Species Ecosim-NCC Atlantis-CCAM Trophic level (per year) Ecosim-NCC Atlantis-CCAMEuphausiids 9.7 22.6 2.1 8 145 13Forage fish 10.1 10.1 3.2 1.5 45 8Mesopelagics 2.5 0.7 3.2 0.6 3.1 0.3Sardine 0.1 NA 2.8 0.5 0.06 NAMackerel 0.1 0.5 3.5 0.35 0.06 0.2
Figure 2 Per cent of species or functional groups in Ecosim-NCC(solid lines) and Atlantis-CCAM (dashed lines) that exhibit changesin biomass of >±20% when forage groups are depleted belowunfished levels. A value of 1.0 on the x-axis represents abundance ofthe forage group when it is not fished, while a value of 0.4represents depletion of a focal forage group to 40% of unfishedabundance. Focal forage groups are as follows: euphausiids =triangles; forage fish = diamonds; mesopelagic fish = crosses;mackerel = squares; sardines in Ecosim-NCC = circles. Crossesrepresent simultaneous depletion of forage fish, euphausiids,mesopelagic fish, and mackerel. Vertical lines of the same coloursrepresent abundance of each forage group that leads to maximumsustainable yield in the two models (only position on the x-axis isrelevant, y-position is for graphical clarity only).
slight increases and one predator (albacore Thunnus alalunga)showed a slight decrease in response to mackerel fishing.However, these responses were all <10%. Biomass yieldingMSY was equal to 41% of unfished biomass, and harvestingthe stock to this level similarly did not lead to responses in thefood web of >10%.
In Atlantis-CCAM, depletion of mackerel (largeplanktivores) also had minor impacts on the food web (Fig 2;Appendix 2, Figs 2.3 and 2.4; Appendix 3, Figs S3.1 and S3.3.see supplementary material at Journals.cambridge.org/ENC).Compared to total system biomass, mackerel harvests werelow, for instance less than 0.2 t km−2 in the F40 case (Table 1).Two prey items of mackerel, shrimp and euphausiids (large
zooplankton), increased by >20% as mackerel were depleted.The model also predicted subsequent reciprocal decreasesin copepods (mesozooplankton). Coastal sharks were theonly predator that declined substantially (>20%) due todepletion of mackerel. Mackerel maximum yield could beachieved at 25% of unfished levels, and harvesting the stockto this level impacted only euphausiids and coastal sharksby >20%. Differences in species compositions and dietsbetween the models explain the strong shark decline inAtlantis-CCAM and the absence of this decline in Ecosim-NCC. The pelagic shark group in Atlantis (one of twofunctional groups in the standardized ‘coastal shark group’)has a diet composition initialized to be 9% mackerel, anddeclines strongly, for instance falling 56% in the case withmackerel fished down to B40. The loss of the mackerel causeda decline in pelagic shark adult condition (weight-at-age) of>50%, with a consequent drop in fecundity and recruitment.In Ecosim-NCC, this shark group has initial diets of only3% mackerel (Appendix 4, Table 4.2, see supplementarymaterial at Journals.cambridge.org/ENC), reflecting heavierweighting of diet information for species such as soupfin shark(Galeorhinus galeus).
Forage fish
Fishing the forage fish group (which excludes sardine)in Ecosim-NCC affected nearly every other group in theecosystem (Figs 2 and 3; Appendix 2, Figs S2.5 andS2.6; Appendix 3, Fig. S3.4, see supplementary materialat Journals.cambridge.org/ENC). The simulations suggestedthat MSY was achieved at c. B40, but depletion to B40 orlower resulted in changes of >±20% for nearly half ofall functional groups (Fig. 2). Protected groups declined,including pinnipeds, sooty shearwaters and other seabirds(Fig. 3). Commercial fishery targets such as piscivorousflatfish (halibut Hippoglossus stenolepis and arrowtooth flounderAtheresthes stomias) also declined, while rockfish (Sebastesspp.) showed strong responses in both positive and negativedirections. Forage fish depletion to B40 or lower involvedvery high initial (2008) harvests, for instance 45 t km−2
in the F40 case (Table 1). Depletion of forage fish releasedeuphausiids and copepods from predation pressure, resultingin increased abundance of those groups. This in turn provided

Forage species in the California Current 7
Figure 3 Impact of alternativefishing mortality levels for foragefish (small planktivores) on othercomponents of the ecosystem. Avalue of 0 on the x-axis representsno difference from a base caseequilibrium biomass (no fishing onthis forage group); +0.2 indicatesvalues 20% higher than the basecase, and –0.2 indicates values20% lower than the base case. Foreach group or species, the top barin the stack of eight horizontal barsrepresents predictions fromAtlantis-CCAM at a fishingmortality rate of F0 (extirpation offorage group), followed bypredictions from Ecosim-NCC atF0, then a similar pair for F20, F40,and F75. (In the online version,purple bars are predictions fromAtlantis-CCAM, and grey bars arepredictions from Ecosim-NCC).Increases of >1.0 for the F40 caseare noted to the right of the figure.Model results are presented interms of standardized functionalgroups that are consistent acrossmodels; carnivorous zooplanktonand sardine are reported only forEcosim-NCC because these wereaggregated with other foragespecies in Atlantis-CCAM(Appendix 3 includes similarfigures at the original taxonomicresolution of each model, seesupplementary material atJournals.cambridge.org/ENC).
more prey for higher trophic levels, many of which (includingmesopelagics) increased in abundance. The groups thatincreased in biomass included some predators of foragefish such as midwater and canary rockfish. This redirectionof available biomass through the euphausiid pathway didnot benefit all the predators of forage fish, however. Somepredators, including large piscivores (salmon, sharks, sablefishAnoplopoma fimbria), seabirds and marine mammals declinedin response to the depletion of their main prey items.
Sardines in Ecosim-NCC have a low relative biomass andproduction, as the model was initialized during a period oflow abundance (Table 1) and was not able to adequatelyreplicate the observed recovery in the 1980s and 1990s(Field et al. 2006). Understanding drivers of such regimeshifts for small pelagic fish, and representing these driversin models, is critical but challenging (Checkley et al. 2009).Models of other systems that do qualitatively represent suchregime shifts include time-varying availability of plankton toindividual fish species, for instance mimicking specific feedingrequirements of sardine versus anchovy (Shannon et al. 2004);
however, no model is currently available for the CaliforniaCurrent that captures these dynamics. Hence, due to thelow biomass of sardine in 2007 in Ecosim-NCC, fishing thisspecies affected no other group by >20% even when sardineswere depleted well below 41% of unfished abundance,the level predicted to achieve maximum yields (Fig. 2;Appendix 2, Figs S2.7 and S2.8; Appendix 3, Figs S3.5 andS3.6, see supplementary material at Journals.cambridge.org/ENC).
Atlantis-CCAM simulations suggested that the sustainableyield of forage fish (including sardines) was at a maximumwhen the population was at 53% of unfished abundance.However, depletion below B75 led to strong impacts on therest of the food web. Harvest to B40 or lower abundancesled to changes of >±20% on one-fifth of all functionalgroups (Figs 2 and 3; Appendix 2, Figs S2.9 and S2.10;Appendix 3, Fig. S3.7, see supplementary material atJournals.cambridge.org/ENC). Depleting abundant foragefish to these levels involved high initial harvests, for instance8 t km−2 for F40 (Table 1). Considering the original

8 I. C. Kaplan et al.
Atlantis-CCAM taxonomy, rather than the standardizedfunctional groups, reveals declines of >20% for thepiscivorous group yelloweye rockfish (Sebastes ruberrimus) andcowcod (S. levis), which was initialized to have a diet of 33%forage fish. Both yelloweye rockfish and cowcod are species ofconservation concern and are currently classified as overfished.However, standardized groups (Fig. 3) did not decline by>10%. Harvest of forage fish in the model had positive effectson several prey and competitors of forage fish (Fig. 3). Theseincluded euphausiids (large zooplankton), microzooplanktonand cephalopods. A euphausiid predator, mackerel, more thandoubled, as did mackerel’s predator, coastal sharks. Copepods(mesozooplankton) declined as predation by euphausiidsincreased. Atlantis-CCAM did not predict strong declinesin marine mammals or birds due to forage fish depletion.
Though Atlantis-CCAM responded strongly to forage fishdepletion, compared to Ecosim-NCC the impacts were lesssevere and there were fewer cascading effects. The higherlevels of productivity, and therefore catch, simulated inEcosim-NCC rather than in Atlantis-CCAM (for exampleMSY of 23 t km−2 versus 3.1 t km−2) partially account forthe stronger food web response in the former model. Severalof the groups that responded strongly in Atlantis-CCAMalso did so in Ecosim-NCC (and in the same direction).These included other forage groups such as euphausiids (largezooplankton), mackerel and cephalopods. Differences in dietcompositions (Appendix 4, Table S4.2, see supplementarymaterial at Journal.cambridge.org/ENC) between modelsexplain contrasting responses of coastal sharks, copepodsand salmon. Both sharks and salmon are assumed 50–100%more dependent on forage fish in Ecosim-NCC than Atlantis-CCAM; the former model therefore predicts declines in thesepredators as forage fish are depleted. Additionally, forage fishin Ecosim-NCC have diets initialized to be twice as dependentas Atlantis-NCC on copepods, and Ecosim therefore predictsincreases in copepods as forage fish are depleted.
Mesopelagic fish
In Ecosim-NCC, the simulated fishery for mesopelagic fishhad an effect on many groups, but most changes weresmall. Less than 5% of functional groups were affected by>20%, even when mesopelagics were completely depleted(Fig. 2). Harvests of mesopelagics were relatively low, forinstance <3.1 t km−2 for F40 (Table 1). As mesopelagicswere depleted, several fish predators of mesopelagics declined,including commercially targeted groups such as longspinethornyhead (Sebastolobus altivelis), shelf rockfish and albacore(Appendix 3, Figs S3.8 and S3.9, see supplementary materialat Journals.cambridge.org/ENC), although only albacoredeclined by more than 20%. Carnivorous zooplankton andlarge jellyfish showed moderate increases under high levels offishing on mesopelagics (depletion to B20 or lower). This,combined with the decline in some of the predatory fish,supported the small increases seen in some of the fish groups,such as mackerel and hake. MSY was achieved at 37% of
unfished abundance (Appendix 2, Figs S2.11 and S2.12,see supplementary material at Journals.cambridge.org/ENC);fishing the population down to this level did not cause changesof >20% in any other group.
The trophic impacts of a harvest of mesopelagic fish (deepvertical migrators) in Atlantis-CCAM were minor, with mostimpacts <20% (Fig. 2; Appendix 2, Figs. S2.13 and S2.14;Appendix 3, Figs 3.8 and 3.10, see supplementary materialat Journals.cambridge.org/ENC). This was true at biomasslevels leading to maximum yield (58% of unfished levels)as well as more severe depletion. Simulated harvests ofmesopelagics were relatively low in terms of total tonnes,<0.3 t km−2 for F40 (Table 1). Salmon declined 33%when mesopelagic fish were extirpated, but no other groupresponded to this simulation by >20%. Slight increasesin coastal sharks were due to minor increases in mackerelabundance, consistent with the strong linkage in Atlantis-CCAM between these groups described above. The declinein albacore predicted by Ecosim-NCC was not predicted byAtlantis-CCAM: in contrast to Ecosim-NCC, in Atlantis-CCAM albacore have broader diets, are less reliant onmesopelagic fish (Appendix 4, Table S4.2, see supplementarymaterial at Journals.cambridge.org/ENC), and switch toalternative prey without declining in abundance. Overall, therelatively low biomass of mesopelagics in the models, and thefocus of both models on groundfish species, contributed tothe minor impacts seen here.
Euphausiids
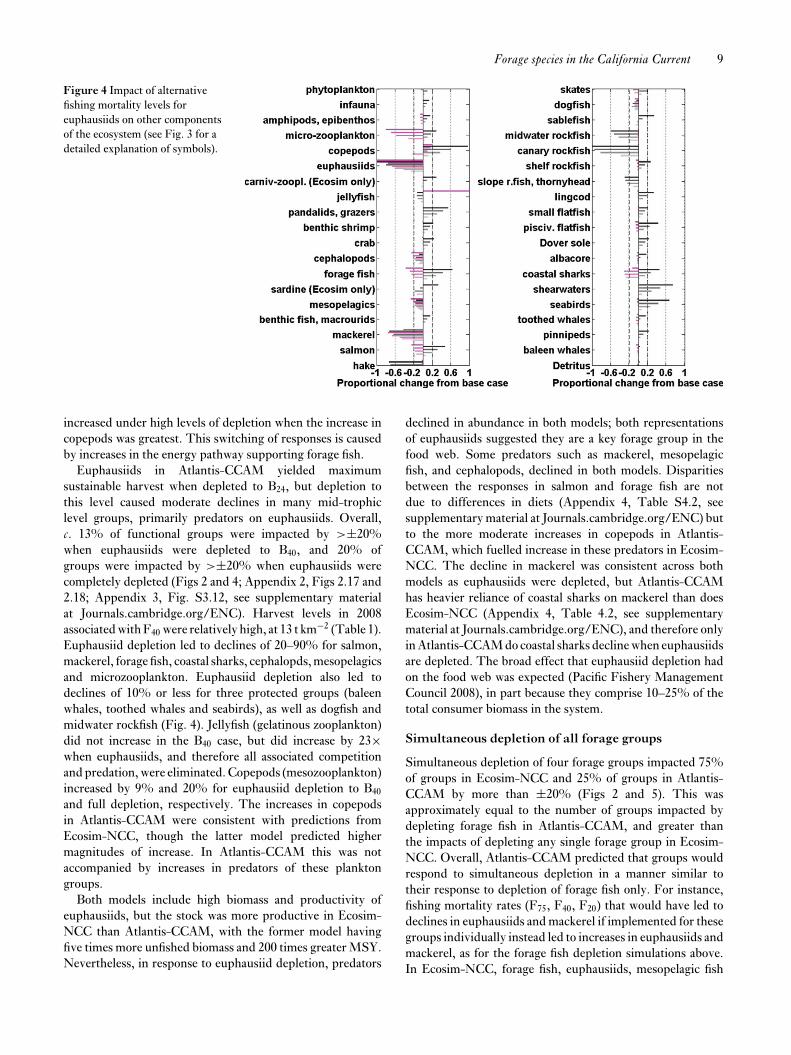
Ecosim-NCC predicted that MSYs of euphausiids couldbe achieved at B40, but with the consequence that 30%of other groups were impacted by >±20% (Figs 2 and 4;Appendix 2, Figs S2.15 and S2.16; Appendix 3, Fig. S3.11,see supplementary material at Journals.cambridge.org/ENC).Associated levels of euphausiid harvest were very high, forinstance 145 t km−2 in 2008 in the F40 case (Table 1). Manypredators of euphausiids declined by >20% when euphausiidswere depleted to the B40 level, including target species forother fisheries such as midwater rockfish, mackerel and hake.Other harvested species such as dogfish also declined, but by<20%, as did baleen whales and mesopelagic fish.
As euphausiids were depleted in Ecosim-NCC, their prey,copepods and microzooplankton, increased in abundance(Fig. 4; Appendix 3, Fig. S3.11, see supplementary materialat Journals.cambridge.org/ENC). More than twice as muchproduction goes from copepods to the third trophic level thanfrom euphausiids. Therefore increases in copepods providemore food for the key mid-trophic level groups (such asforage fish). The increase in forage fish in turn provides foodeither directly or indirectly for many other species, includingthose that prey upon euphausiids. Thus some predators ofeuphausiids increased in abundance, including several flatfishand bird groups, salmon and shelf rockfish. Other groups,including sablefish, carnivorous zooplankton and sardine,decreased under moderate depletion of euphausiids, but
Forage species in the California Current 9
Figure 4 Impact of alternativefishing mortality levels foreuphausiids on other componentsof the ecosystem (see Fig. 3 for adetailed explanation of symbols).
increased under high levels of depletion when the increase incopepods was greatest. This switching of responses is causedby increases in the energy pathway supporting forage fish.
Euphausiids in Atlantis-CCAM yielded maximumsustainable harvest when depleted to B24, but depletion tothis level caused moderate declines in many mid-trophiclevel groups, primarily predators on euphausiids. Overall,c. 13% of functional groups were impacted by >±20%when euphausiids were depleted to B40, and 20% ofgroups were impacted by >±20% when euphausiids werecompletely depleted (Figs 2 and 4; Appendix 2, Figs 2.17 and2.18; Appendix 3, Fig. S3.12, see supplementary materialat Journals.cambridge.org/ENC). Harvest levels in 2008associated with F40 were relatively high, at 13 t km−2 (Table 1).Euphausiid depletion led to declines of 20–90% for salmon,mackerel, forage fish, coastal sharks, cephalopds, mesopelagicsand microzooplankton. Euphausiid depletion also led todeclines of 10% or less for three protected groups (baleenwhales, toothed whales and seabirds), as well as dogfish andmidwater rockfish (Fig. 4). Jellyfish (gelatinous zooplankton)did not increase in the B40 case, but did increase by 23×when euphausiids, and therefore all associated competitionand predation, were eliminated. Copepods (mesozooplankton)increased by 9% and 20% for euphausiid depletion to B40
and full depletion, respectively. The increases in copepodsin Atlantis-CCAM were consistent with predictions fromEcosim-NCC, though the latter model predicted highermagnitudes of increase. In Atlantis-CCAM this was notaccompanied by increases in predators of these planktongroups.
Both models include high biomass and productivity ofeuphausiids, but the stock was more productive in Ecosim-NCC than Atlantis-CCAM, with the former model havingfive times more unfished biomass and 200 times greater MSY.Nevertheless, in response to euphausiid depletion, predators
declined in abundance in both models; both representationsof euphausiids suggested they are a key forage group in thefood web. Some predators such as mackerel, mesopelagicfish, and cephalopods, declined in both models. Disparitiesbetween the responses in salmon and forage fish are notdue to differences in diets (Appendix 4, Table S4.2, seesupplementary material at Journals.cambridge.org/ENC) butto the more moderate increases in copepods in Atlantis-CCAM, which fuelled increase in these predators in Ecosim-NCC. The decline in mackerel was consistent across bothmodels as euphausiids were depleted, but Atlantis-CCAMhas heavier reliance of coastal sharks on mackerel than doesEcosim-NCC (Appendix 4, Table 4.2, see supplementarymaterial at Journals.cambridge.org/ENC), and therefore onlyin Atlantis-CCAM do coastal sharks decline when euphausiidsare depleted. The broad effect that euphausiid depletion hadon the food web was expected (Pacific Fishery ManagementCouncil 2008), in part because they comprise 10–25% of thetotal consumer biomass in the system.
Simultaneous depletion of all forage groups
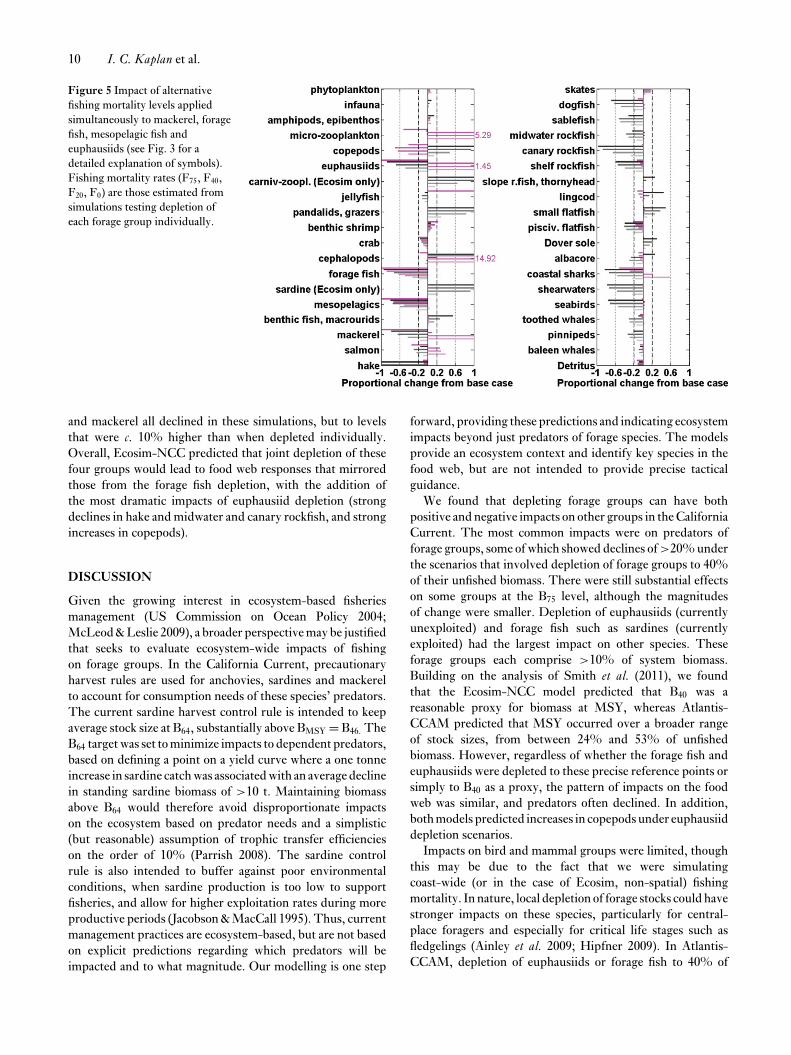
Simultaneous depletion of four forage groups impacted 75%of groups in Ecosim-NCC and 25% of groups in Atlantis-CCAM by more than ±20% (Figs 2 and 5). This wasapproximately equal to the number of groups impacted bydepleting forage fish in Atlantis-CCAM, and greater thanthe impacts of depleting any single forage group in Ecosim-NCC. Overall, Atlantis-CCAM predicted that groups wouldrespond to simultaneous depletion in a manner similar totheir response to depletion of forage fish only. For instance,fishing mortality rates (F75, F40, F20) that would have led todeclines in euphausiids and mackerel if implemented for thesegroups individually instead led to increases in euphausiids andmackerel, as for the forage fish depletion simulations above.In Ecosim-NCC, forage fish, euphausiids, mesopelagic fish
10 I. C. Kaplan et al.
Figure 5 Impact of alternativefishing mortality levels appliedsimultaneously to mackerel, foragefish, mesopelagic fish andeuphausiids (see Fig. 3 for adetailed explanation of symbols).Fishing mortality rates (F75, F40,F20, F0) are those estimated fromsimulations testing depletion ofeach forage group individually.
and mackerel all declined in these simulations, but to levelsthat were c. 10% higher than when depleted individually.Overall, Ecosim-NCC predicted that joint depletion of thesefour groups would lead to food web responses that mirroredthose from the forage fish depletion, with the addition ofthe most dramatic impacts of euphausiid depletion (strongdeclines in hake and midwater and canary rockfish, and strongincreases in copepods).
DISCUSSION
Given the growing interest in ecosystem-based fisheriesmanagement (US Commission on Ocean Policy 2004;McLeod & Leslie 2009), a broader perspective may be justifiedthat seeks to evaluate ecosystem-wide impacts of fishingon forage groups. In the California Current, precautionaryharvest rules are used for anchovies, sardines and mackerelto account for consumption needs of these species’ predators.The current sardine harvest control rule is intended to keepaverage stock size at B64, substantially above BMSY = B46. TheB64 target was set to minimize impacts to dependent predators,based on defining a point on a yield curve where a one tonneincrease in sardine catch was associated with an average declinein standing sardine biomass of >10 t. Maintaining biomassabove B64 would therefore avoid disproportionate impactson the ecosystem based on predator needs and a simplistic(but reasonable) assumption of trophic transfer efficiencieson the order of 10% (Parrish 2008). The sardine controlrule is also intended to buffer against poor environmentalconditions, when sardine production is too low to supportfisheries, and allow for higher exploitation rates during moreproductive periods (Jacobson & MacCall 1995). Thus, currentmanagement practices are ecosystem-based, but are not basedon explicit predictions regarding which predators will beimpacted and to what magnitude. Our modelling is one step
forward, providing these predictions and indicating ecosystemimpacts beyond just predators of forage species. The modelsprovide an ecosystem context and identify key species in thefood web, but are not intended to provide precise tacticalguidance.
We found that depleting forage groups can have bothpositive and negative impacts on other groups in the CaliforniaCurrent. The most common impacts were on predators offorage groups, some of which showed declines of >20% underthe scenarios that involved depletion of forage groups to 40%of their unfished biomass. There were still substantial effectson some groups at the B75 level, although the magnitudesof change were smaller. Depletion of euphausiids (currentlyunexploited) and forage fish such as sardines (currentlyexploited) had the largest impact on other species. Theseforage groups each comprise >10% of system biomass.Building on the analysis of Smith et al. (2011), we foundthat the Ecosim-NCC model predicted that B40 was areasonable proxy for biomass at MSY, whereas Atlantis-CCAM predicted that MSY occurred over a broader rangeof stock sizes, from between 24% and 53% of unfishedbiomass. However, regardless of whether the forage fish andeuphausiids were depleted to these precise reference points orsimply to B40 as a proxy, the pattern of impacts on the foodweb was similar, and predators often declined. In addition,both models predicted increases in copepods under euphausiiddepletion scenarios.
Impacts on bird and mammal groups were limited, thoughthis may be due to the fact that we were simulatingcoast-wide (or in the case of Ecosim, non-spatial) fishingmortality. In nature, local depletion of forage stocks could havestronger impacts on these species, particularly for central-place foragers and especially for critical life stages such asfledgelings (Ainley et al. 2009; Hipfner 2009). In Atlantis-CCAM, depletion of euphausiids or forage fish to 40% of

Forage species in the California Current 11
unfished levels did not reduce any bird or mammal groups by>20%. In Ecosim, depleting forage fish to 40% of unfishedlevels led to >60% declines in seabirds and pinnipeds.
Contrasts between models: geography, data andfunctional forms
The two models both cover the northern extent of theCalifornia Current, though Atlantis-CCAM extends muchfurther south (Fig. 1). Ecosim-NCC has slightly moretrophic resolution at a species level, but the models arequite similar in detail and level of system definition. Thegreatest difference is the use of age structure in Atlantis-CCAM for all vertebrates, whereas Ecosim-NCC has no agestructured groups. Moreover the Atlantis-CCAM focuses ondemersal species, while Ecosim-NCC has been used moreextensively for modelling pelagic species. Nevertheless, thetwo models provide comparable representations for muchof the ecosystem. Though there are differences betweenmodels in terms of forage fish and euphausiid biomass andproductivity, our results related to the importance of foragefish and euphausiids are generally robust to model differences,and are valuable in evaluating the trade-offs that could comefrom substantive fisheries for forage groups. The differencesbetween the two models with respect to forage groups’abundance, productivity and potential catches underscore trueuncertainty about these quantities in the California Current(for example Pacific Fishery Management Council 2008,section 3.1.3.4).
As noted above, forage group depletion generally impactedmore groups in Ecosim-NCC than in Atlantis-CCAM, andthese impacts were larger. Third-order responses (for examplewhere depletion of a group led to increased abundance of itsprey and thus increased abundance of the prey’s predators)were moderately common in Ecosim-NCC, but were lesscommon in Atlantis-CCAM. Predators directly impacted inAtlantis-CCAM by the loss of euphausiids or forage fishwere generally similarly impacted in Ecosim-NCC, thoughthere were additional predators impacted in the latter model.Atlantis-CCAM differs from Ecosim-NCC in at least threekey aspects that might reduce the magnitude of response tofishing: (1) full age structure delays the reproductive responseof the population, since individuals younger than age-at-maturity cannot breed, and no individual can breed priorto the annual spawning season; (2) predator access to prey islimited by gape restrictions and the need for spatial overlapbetween predator and prey; and (3) a different predator-prey functional response formulation increases diet switching.Better understanding of predator-prey interactions and thescales of predator-prey overlap will improve ecosytem modelsin the future, but these issues also illustrate the choices andassumptions inherent to ecosystem modelling, and the needfor exploration involving multiple models. Here we began toaddress model uncertainty by applying two different modelstructures, Atlantis and Ecosim; future work is needed toexplore model representations of climate variability and theimportance of full size and age structure (for example Atlantis-
CCAM) versus biomass pools (for example Ecosim-NCC),particularly for mammals and birds.
CONCLUSION
Our work emphasizes trade-offs between harvest of foragespecies and the ability of the California Current ecosystemto sustain populations at other trophic levels. The resultsare consistent with recent global research on forage species,and with the needs of local fishery managers. As mentionedabove, Smith et al. (2011) found that our results from theCalifornia Current are consistent with predictions from threedifferent types of ecosystem models applied to the HumboldtCurrent, Benguela Current, North Sea and south-eastAustralia continental shelf. Multi-species (Ecosim) modellingby Walters et al. (2005) found that for 11 ecosystems,simultaneous harvest of all groups (including forage) at ratesestimated based on single-species MSY led to an erosion ofecosystem structure, and declines in top predator biomassand catch. Recently, Pikitch et al. (2013) analysed 72 food web(Ecopath) models and landings data and found that the globaleconomic value of forage fish as prey for higher-trophic levelspecies is approximately twice the landed value of forage fishthemselves; they also found that 75% of these food webs hadat least one predator that relied on forage fish for the majorityof its diet. Simulation tests by Pikitch et al. (2012) led totheir recommendations that fishery managers set aside 30%of the stock as unfished, limit fishing mortality rates to lessthan three-quarters of the single species optimum, and furtherreduce harvests when assessments and data are lacking. Theirmodelling suggests that typically this will necessitate harvestof forage fish to no lower than 80% of unfished abundance,comparable to the B75 reference point we have tested here forthe California Current.
On the USA’s West Coast, the Pacific Fishery ManagementCouncil (2011) has begun drafting a Fishery Ecosystem Planthat describes the local role of forage species and mechanismsinvolved in their management. Our results illustrate that,in particular, euphausiids and forage fish (such as sardines,anchovy and herring) play a key role in the California Current.Although higher trophic level species such as groundfish areoften managed on the basis of reference points that can reducebiomass to below half unfished levels (Clark 2002), this levelof removal of these two forage groups is likely to resultin significant changes in abundance of other target species,protected species and structure of the ecosystem. A referencepoint of B75 reduces these impacts on the California Currentfood web, but would also reduce fishery yields. In the contextof ongoing policy decisions and monitoring (Bjorkstedt 2010;Zwolinski et al. 2011), our results also identify a set ofpredators likely to respond strongly to depletion of foragefish and euphausiids (such as salmon, seabirds, pinnipeds,mackerel and hake). Monitoring of these species may revealimpacts of harvesting; importantly, such monitoring may alsoreveal abundance trends in the majority of forage species thatare unharvested and unassessed.
12 I. C. Kaplan et al.
ACKNOWLEDGEMENTS
Isaac Kaplan and Elizabeth Fulton acknowledge support fromNOAA, CSIRO, the Gordon and Betty Moore Foundation,and the David and Lucile Packard Foundation. CSIROco-authors were partly funded by the Marine StewardshipCouncil (MSC) to investigate ‘Developing best practicemanagement for low trophic level fisheries: evaluation ofharvest strategies’. Yvonne deReynier, Tessa Francis, MelissaHaltuch, Chris Harvey, Josh Lindsay and Phil Levin providedfeedback on early drafts.
References
Ainley, D., Dugger, K., Ford, R., Pierce, S., Reese, D., Brodeur, R.,Tynan, C. & Barth, J. (2009) Association of predators and prey atfrontal features in the California Current: competition, facilitation,and co-occurrence. Marine Ecology Progress Series 389: 271–294.
Alder, J., Campbell, B., Karpouzi, V., Kaschner, K. & Pauly, D.(2008) Forage fish: from ecosystems to markets. Annual Review ofEnvironment and Resources 33: 153–166.
Anderson, D.W., Gress, F. & Mais, K.F. (1982) Brown pelicans:influence of food supply on reproduction. Oikos 39: 23–31.
Anker-Nilssen, T., Barrett, R.T. & Krasnov, J.V. (1997) Long-andshort-term responses of seabirds in the Norwegian and BarentsSeas to changes in stocks of prey fish. Report. Forage Fishesin Marine Ecosystems, pp. 683–698. Alaska Sea Grant CollegeProgram Report, Fairbanks, Alaska, USA.
Barber, R.T. & Chavez, F.P. (1983) Biological consequences of ElNino. Science 222: 1203.
Barlow, J., Kahru, M. & Mitchell, B. (2008) Cetacean biomass,prey consumption, and primary production requirements in theCalifornia Current ecosystem. Marine Ecology Progress Series 371:285–295.
Benson, S.R., Croll, D.A., Marinovic, B.B., Chavez, F.P. & Harvey,J.T. (2002) Changes in the cetacean assemblage of a coastalupwelling ecosystem during El Nino 1997–98 and La Nina 1999.Progress in Oceanography 54: 279–291.
Bjorkstedt, E. (2010) State of the California Current 2009–2010:regional variation persists through transition from La Nina to ElNino (and back?). CalCOFI Reports 51: 1–69.
Chavez, F.P., Ryan, J., Lluch-Cota, S.E. & Niquen, C. (2003) Fromanchovies to sardines and back: multidecadal change in the PacificOcean. Science 299: 217.
Checkley, D., Alheit, J., Oozeki, Y. & Roy, C. (2009) Climate Changeand Small Pelagic Fish. Cambridge, UK: Cambridge UniversityPress.
Checkley, D.M. & Barth, J.A. (2009) Patterns and processes in theCalifornia Current System. Progress in Oceanography 83: 49–64.
Christensen, V. & Walters, C.J. (2004) Ecopath with Ecosim:methods, capabilities and limitations. Ecological Modelling 172:109–139.
Clark, W.G. (2002) F 35% revisited ten years later. North AmericanJournal of Fisheries Management 22: 251–257.
Crone, P.R., Hill, K.T., McDaniel, J.D., Lo, N.C.H. & Fisheries,N. (2009) Pacific mackerel (Scomber japonicus) stock assessmentfor USA management in the 2009–10 fishing year. Report.Pacific Fishery Management Council, Portland, Oregon USA[www document]. URL http://swfsc.noaa.gov/uploadedFiles/
Divisions/FRD/Small_Pelagics/Mackerel/PMackerel%20Assessment%20(Final)%20-%20Aug09.pdf
Cury, P.M., Boyd, I.L., Bonhommeau, S., Anker-Nilssen, T.,Crawford, R.J.M., Furness, R.W., Mills, J.A., Murphy, E.J.,Österblom, H., Paleczny, M., Piatt, J.F., Roux, J., Shannon, L.& Sydeman, W. (2011) Global seabird response to forage fishdepletion. One-third for the birds. Science 334: 1703–1706.
Daly, E., Brodeur, R. & Weitkamp, L. (2009) Ontogenetic shifts indiets of juvenile and subadult coho and chinook salmon in coastalmarine waters: important for marine survival? Transactions of theAmerican Fisheries Society 138: 1420–1438.
Dufault, A.M., Marshall, K. & Kaplan, I.C. (2009) A synthesisof diets and trophic overlap of marine species in the CaliforniaCurrent. NOAA Technical Memorandum NMFS-NWSC-103,NOAA, USA [www document]. URL http://www.nwfsc.noaa.gov/assets/25/7024_12212009_134730_DietsCalCurrentTM103WebFinal.pdf
European Commission (2010) Commission decision of 1 September2010 on criteria and methodological standards on goodenvironmental status of marine waters. Official Journal of theEuropean Union L 232: 14–24.
Field, J.C., Francis, R.C. & Aydin, K. (2006) Top-down modelingand bottom-up dynamics: linking a fisheries-based ecosystemmodel with climate hypotheses in the Northern CaliforniaCurrent. Progress in Oceanography 68: 238–270.
Frederiksen, M., Wanless, S., Harris, M.P., Rothery, P. & Wilson,L.J. (2004) The role of industrial fisheries and oceanographicchange in the decline of North Sea black-legged kittiwakes. Journalof Applied Ecology 41: 1129–1139.
Fulton, E. (2004) Biogeochemical marine ecosystem models II: theeffect of physiological detail on model performance. EcologicalModelling 173: 371–406.
Fulton, E.A., Link, J.S., Kaplan, I.C., Savina-Rolland, M., Johnson,P., Ainsworth, C., Horne, P., Gorton, R., Gamble, R.J., Smith,A.D.M. & Smith, D.C. (2011) Lessons in modelling andmanagement of marine ecosystems: the Atlantis experience. Fishand Fisheries 12: 171–188.
Fulton, E., Smith, A. & Punt, A. (2005) Which ecological indicatorscan robustly detect effects of fishing? ICES Journal of MarineScience 62: 540–551.
Gjosoeter, H. (1997) The Barents Sea capelin stock (Mallotusvillosus): a brief review. In: Forage Fishes in Marine Ecosystems,pp. 469–484. Alaska Sea Grant College Program Report,Fairbanks, Alaska, USA.
Hill, K., Dorval, E., Lo, N.C., Macewicz, B.J., Show, C.& Felix-Uraga, R. (2008) Assessment of the Pacific sardineresource in 2008 for US management in 2009. Report. PacificFishery Management Council, Portland, Oregon, USA [wwwdocument]. URL http://www.pcouncil.org/bb/2008/1108/G2b_SUP_ATT1_1108.pdf
Hipfner, J. (2009) Euphausiids in the diet of a North Pacific seabird:annual and seasonal variation and the role of ocean climate. MarineEcology Progress Series 390: 277–289.
Horne, P J., Kaplan, I.C., Marshall, K.N., Levin, P.S., Harvey, C.J.,Hermann, A.J. & Fulton, E.A. (2010) Design and parameterizationof a spatially explicit ecosystem model of the Central CaliforniaCurrent. NOAA Technical Memorandum NMFS-NWFSC-104,NOAA, USA: 140 pp.
Jacobson, L.D. & MacCall, A.D. (1995) Stock-recruitment modelsfor Pacific sardine (Sardinops sagax). Canadian Journal of Fisheriesand Aquatic Sciences 52: 566–577.

Forage species in the California Current 13
Kaplan, I.C. & Leonard, J. (2012) From krill to conveniencestores: forecasting the economic and ecological effects of fisheriesmanagement on the US West Coast. Marine Policy 36: 947–954.
Kaplan, I.C., Horne, P.J. & Levin, P.S. (2012) Screening CaliforniaCurrent fishery management scenarios using the Atlantis end-to-end ecosystem model. Progress In Oceanography 102: 5–18.
Kaplan, I.C., Levin, P.S., Burden, M. & Fulton, E.A. (2010)Fishing catch shares in the face of global change: a framework forintegrating cumulative impacts and single species management.Canadian Journal of Fisheries and Aquatic Sciences 67: 1968–1982.
Karpouzi, V., Watson, R. & Pauly, D. (2007) Modelling and mappingresource overlap between seabirds and fisheries on a global scale:a preliminary assessment. Marine Ecology Progress Series 343: 87–99.
Kaschner, K., Karpouzi, V.S., Watson, R. & Pauly, D. (2006) Foragefish consumption by marine mammals and seabirds. In: On theMultiple Uses of Forage Fish: from Ecosystem to Markets, FisheriesResearch Report Volume 14, no. 3, ed. J. Alder & D. Pauly, pp.33–46. Vancouver, BC, Canada: University of British ColumbiaFisheries Centre.
Koslow, J.A., Goericke, R., Lara-Lopez, A. & Watson, W. (2011)Impact of declining intermediate-water oxygen on deepwaterfishes in the California Current. Marine Ecology Progress Series436: 207–218.
Logerwell, E.A., Mantua, N., Lawson, P.W., Francis, R.C. &Agostini, V.N. (2003) Tracking environmental processes in thecoastal zone for understanding and predicting Oregon coho(Oncorhynchus kisutch) marine survival. Fisheries Oceanography 12:554–568.
MacCall, A.D. (1996) Patterns of low-frequency variability in fishpopulations of the California Current. CalCOFI Reports 37: 100–110.
Mantua, N.J., Hare, S.R., Zhang, Y., Wallace, J.M. & Francis, R.C.(1997) A Pacific interdecadal climate oscillation with impacts onsalmon production. Bulletin of the American Meteorological Society78: 1069–1079.
McLeod, K. & Leslie, H. (2009) Ecosystem-based Mmanagement forthe Oceans. Washington, DC, USA: Island Press.
Muck, P. (1989) Major trends in the pelagic ecosystem offPeru and their implications for management. In: The PeruvianUpwelling Ecosystem: Dynamics and Interactions, ed. D. Pauly, P.Muck, J. Mendo & I. Tsukayama, pp. 386–403. Instituto delMar del Peru (IMARPE), Callao, Peru: Deutsche Gesellschaftfur Technische Zusammenarbeit (GTZ), Eschborn, Germany:International Center for Living Aquatic Resources Management(ICLARM), Manila, Philippines.
Murphy, R.C. (1925) Bird Islands of Peru. New York, NY, USA: GPPutnams Sons.
Nagasawa, K., Nishimura, A., Asanuma, T. & Marubayashi, T.(1997) Myctophids in the Bering Sea: distribution, abundance,and significance as food for salmonids. In: Forage Fishes in MarineEcosystems, pp. 337–350. Alaska Sea Grant College ProgramReport, Fairbanks, Alaska, USA.
Pacific Fishery Management Council (1978) Fishery ManagementPlan for Northern Anchovy. Report. Pacific Fishery ManagementCouncil, Portland, Oregon USA.
Pacific Fishery Management Council (2006) Fishery manage-ment plan for coastal pelagic species [www document].URL http://www.pcouncil.org/coastal-pelagic-species/fishery-management-plan-and-amendments/
Pacific Fishery Management Council (2008) Management of krillas an essential component of the California Current ecosystem.Amendment 12 to the Coastal Pelagic Species Fishery MangementPlan [www document]. URL http://www.pcouncil.org/wp-content/uploads/CPS_Am12_Krill_DraftEA.pdf
Pacific Fishery Management Council (2011) Pacific Coast FisheryEcosystem Plan Draft. Portland, Oregon, USA [www document].URL http://www.pcouncil.org/wp-content/uploads/H2a_ATT1_DRAFT_ECO_PLAN_NOV2011BB.pdf
Parrish, R. (2008) RE: Oceana’s letter of May 6, 2008 ‘Ecosystemconsiderations in coastal pelagic species stock assessment andfishery evaluation (SAFE) reports and harvest guidelines’[www document]. URL http://www.pcouncil.org/bb/2008/0608/G1d_PC_0608.pdf
Pikitch, E.K., Boersma, P.D., Boyd, I.L., Conover, D.O., Cury,P., Essington, T.E., Heppell, S.S., Houde, E.D., Mangel, M.,Pauly, D., Plaganyi, E.E., Stanisbury, K. & Steneck, R. (2012)Little fish, big impact: managing a crucial link in ocean foodwebs. Report. Lenfest Ocean Program, Stony Brook, NY, USA[www document]. URL http://www.oceanconservationscience.org/foragefish/
Pikitch, E.K., Rountos, K.J., Essington, T.E., Santora, C., Pauly,D., Watson, R., Sumaila, U.R., Boersma, P.D., Boyd, I.L.,Conover, D.O., Cury, P., Heppell, S.S., Houde, E.D., Mangel,M., Plagányi, É., Sainsbury, K., Steneck, R.S., Geers, T.M.,Gownaris, N. & Munch, S.B. (2013) The global contribution offorage fish to marine fisheries and ecosystems. Fish and Fisheries(in press).
Plagányi, É.E. (2007) Models for an ecosystem approach tofisheries. Food and Agriculture Organization of the UnitedNations, Rome, Italy [www document]. URL http://www.fao.org/docrep/010/a1149e/a1149e00.htm
Schwartzlose, R.A., Alheit, J., Bakun, A., Baumgartner, T.R.,Cloete, R., Crawford, R.J.M., Fletcher, W.J., Green-Ruiz, Y.,Hagen, E., Kawasaki, T., Lluch-Belda, D., Lluch-Cota, S.E.,MacCall, A. D., Matsuura, Y., Nevarez-Martinez, M.O., Parrish,R.H., Roy, C., Serra, R., Shust, K.V., Ward, M.N. & Zuzunaga,J.Z. (1999) Worldwide large-scale fluctuations of sardine andanchovy populations. South African Journal of Marine Science 21:289–347.
Shannon, L. (2000) Modelling effects of fishing in the SouthernBenguela ecosystem. ICES Journal of Marine Science 57: 720–722.
Shannon, L.J., Field, J.G. & Moloney, C.L. (2004) Simulatinganchovy–sardine regime shifts in the southern Benguelaecosystem. Ecological Modelling 172: 269–281.
Smith, A.D.M., Brown, C.J., Bulman, C.M., Fulton, E.A., Johnson,P., Kaplan, I.C., Lozano-Montes, H., Mackinson, S., Marzloff,M., Shannon, L.J., Shin, Y.-J. & Tam, J. (2011) Impacts of fishinglow-trophic level species on marine ecosystems. Science 333: 1147–1150.
Tacon, A. & Metian, M. (2009) Fishing for feed or fishing for food:increasing global competition for small pelagic forage fish. AMBIO38: 294–302.
Taylor, S., Leonard, M., Boness, D. & Majluf, P. (2002)Foraging by Humboldt penguins (Spheniscus humboldti) duringthe chick-rearing period: general patterns, sex differences, andrecommendations to reduce incidental catches in fishing nets.Canadian Journal of Zoology 80: 700–707.
Thayer, J.A. & Sydeman, W.J. (2007) Spatio-temporal variability inprey harvest and reproductive ecology of a piscivorous seabird,

14 I. C. Kaplan et al.
Cerorhinca monocerata, in an upwelling system. Marine EcologyProgress Series 329: 253–265.
US Commission on Ocean Policy (2004) An ocean blueprint for the21st century. Final Report. US Commission on Ocean Policy,Washington, DC, USA [www document]. URL http://www.oceancommission.gov/documents/
US Department of Commerce (2007) Magnuson-StevensFishery Conservation and Management Reauthorization Actof 2006 [www document]. URL http://www.nmfs.noaa.gov/sfa/magact/MSA_Amended_2007%20.pdf
Valinassab, T., Pierce, G.J. & Johannesson, K. (2007) Lanternfish (Benthosema pterotum) resources as a target for commercialexploitation in the Oman Sea. Journal of Applied Ichthyology 23:573–577.
Walters, C., Pauly, D., Christensen, V. & Kitchell, J. F. (2000)Representing density dependent consequences of life historystrategies in aquatic ecosystems: EcoSim II. Ecosystems 3: 70–83.
Walters, C.J., Christensen, V., Martell, S.J. & Kitchell, J.F. (2005)Possible ecosystem impacts of applying MSY policies from single-species assessment. ICES Journal of Marine Science 62: 558– 568.
Zwolinski, J.P., Byers, K.A., Cutter, G.R., Renfree, J.S.,Sessions, T.S., Macewicz, B.J. & Demer, D.A. (2011)Acoustic-trawl surveys of Pacific sardine (Sardinops sagax)and other pelagic fishes in the California Current ecosystem.Pacific Fishery Management Council, Portland, Oregon,USA [www document]. URL http://www.pcouncil.org/wp-content/uploads/C3a_ATT3_PART2_ACOU_SURVEY_APR2011BBX.pdf