impacts of cross-contour skidroads on properties of a...
TRANSCRIPT
Canadian Forest ServiceEffects of Forestry Practices Network
Impacts of cross-contour skidroads on properties of a gravelly sandy loam soil
and on planted seedling performance
E. F. Wass and R.B. Smith – Canadian Forest Service
Information Report BC-X-369Pacific Forestry Centre, Victoria, B.C.
Natural ResourcesCanada
Ressources naturellesCanada
Canadian ForestService
Service canadiendes forêts

II
The Pacific Forestry Centre, Victoria, British Columbia
The Pacific Forestry Centre of the Canadian Forest Serviceundertakes research as part of a national network systemresponding to the needs of various forest resource managers. The results of this research are distributed in the form ofscientific and technical reports and other publications.
Additional information on Natural Resources Canada, the Canadian Forest Service and the Pacific Forestry Centre research and publications is also available on the World Wide Web athttp://www.pfc.cfs.nrcan.gc.ca/.
The Effects of Forestry Practices Network (EFPN)
The responsible stewardship and management of Canada’s forestheritage, for present and future generations, is a key element inthe future of our environment, our trade and our businessrelationships around the world. However, Canada’s forests do notadhere to the artificial boundaries between provinces andlandowners. Therefore, co-operation between governments andother forest managers is imperative. As Canada’s major nationalforest research organization the Canadian Forest Service (CFS)has a major role to play. By developing scientifically soundforest management techniques and methods of sharing thisinformation, Canada can assure its people and its customers thatthe best possible forest practices are being used. The Effectsof Forestry Practices Network (EFPN) has been established to leadthis effort.

i
Impacts of cross-contour skidroads on properties of agravelly sandy loam soil and on planted seedling
performance
Pacific Forestry Centre - Information Report BC-X-369
E.F. Wass and R.B. Smith
1997

ii
Canadian Forest ServicePacific Forestry Centre506 West Burnside RoadVictoria, British ColumbiaV8Z 1M5Phone (604) 363-0600
© Her Majesty the Queen in Right of Canada, 1997
Canadian Cataloguing in Publication Data
Wass, E.F.
Impacts of cross-contour skidroads on propertiesof a gravelly sandy loam soil and on seedling performance
(Information report, ISSN 0830-0453 : BC-X-369)Includes an abstract in French.Includes bibliographical references.ISBN: 0-662-25695-6Cat. No. Fo46-17/369E
1. Forest soils -- British Columbia.2. Forest site quality -- British Columbia.3. Forest productivity -- British Columbia.4. Douglas- fir -- British Columbia -- Seedlings.5. Lodgepole pine -- British Columbia -- Seedlings.I. Smith, R.B. (Richard Barrie), 1934 -II. Pacific Forestry CentreIII. Title.IV. Series: Information report (Pacific Forestry Centre); BC-X-369
SD390.3B74W37 1997 631.4'6'09711 C97-980171-0

iii
Table of Contentspage
(List of) Tables...................................................................................... iv
(List of) Figures ..................................................................................... v
Abstract ................................................................................................. vi
Acknowledgments................................................................................. vi
1.0 INTRODUCTION ........................................................................... 1
2.0 STUDY AREA ................................................................................ 22.1 Ecology and soils.................................................................... 22.2 Skidroads ................................................................................ 2
3.0 METHODS ...................................................................................... 33.1 Transect survey....................................................................... 33.2 Soil studies.............................................................................. 43.3 Plantations .............................................................................. 43.4 Data analyses .......................................................................... 7
4.0 RESULTS ........................................................................................ 84.1 Undisturbed soil profile characteristics .................................. 84.2 Ground surface conditions...................................................... 94.3 Soil bulk density ..................................................................... 94.4 Penetrability............................................................................ 94.5 Coarse fragment content ......................................................... 94.6 Soil chemical characteristics................................................. 104.7 Volumetric soil water content............................................... 104.8 Seedling survival .................................................................. 104.9 Seedling growth .................................................................... 114.10 Foliage nutrients ................................................................. 134.11 Vegetation .......................................................................... 134.12 Roots ................................................................................... 15
5.0 DISCUSSION AND CONCLUSION............................................ 16
6.0 References ...................................................................................... 19
Appendix 1 ........................................................................................... 32
Appendix 2 ........................................................................................... 33
Appendix 3 ........................................................................................... 36

iv
List of Tables1. Categories and depths of soil disturbance in the skidded site versus an unlogged stand bordering the cutblock.2. Mean bulk density (Mg/m3) of total and fine soil fractions for two disturbance categories plus the
undisturbed mineral soil at two depths3. Coarse fragment content of bulk density samples4. Chemical characteristics of bulk density samples5. Mean mid-summer volumetric soil water content (upper 20 cm) for six disturbance categories, upper section6. Mean mid-summer volumetric soil water content (upper 20 cm) for three disturbance categories, lower section7. Survival rates of Douglas-fir and lodgepole pine seedlings planted on skidroad soil disturbance categories
and undisturbed ground after five growing seasons8. Mean heights and ground-level diameters of lodgepole pine seedlings for disturbance categories and
undisturbed mineral soil (upper section)9. Mean heights and ground-level diameters of Douglas-fir seedlings for disturbance categories and
undisturbed mineral soil (upper section)10. Mean heights and ground-level diameters of lodgepole pine seedlings for disturbance categories and
undisturbed mineral soil (lower section)11. Mean heights and ground-level diameters of Douglas-fir seedlings for disturbance categories and
undisturbed mineral soil (lower section)12. Mean concentration of nutrients in foliage of Douglas-fir and lodgepole pine for the upper section for four
skidroad categories and the undisturbed soil (Basis: 24 trees for each disturbance category)13. Mean concentration of nutrients in foliage of Douglas-fir and lodgepole pine for the lower section for two
skidroad categories and the undisturbed soil (Basis: 24 trees for each disturbance category)14. Average dissimilarity indices (%) for the upper section based on average vegetation composition and cover
over 4 years (1985-1988) for disturbance category comparisons (Basis: 20 subplots for berm and sidecast,11 for inner track, 9 for outer track, and 5 for upper and lower undisturbed categories)
15. Average frequency (%) and cover (%) of plants (1985-1988) present in more than 40% of sampled plots,upper section
16. Average dissimilarity indices (%) for the lower section based on vegetation composition and cover over 4years (1985-1988) for disturbance category comparisons (Basis: 20 subplots for berm, 20 for skidroadsurface, and 5 for upper and lower undisturbed categories)
17. Average frequency (%) and cover (%) of plants (1985-1988) present in more than 40% of sampled plots,lower section
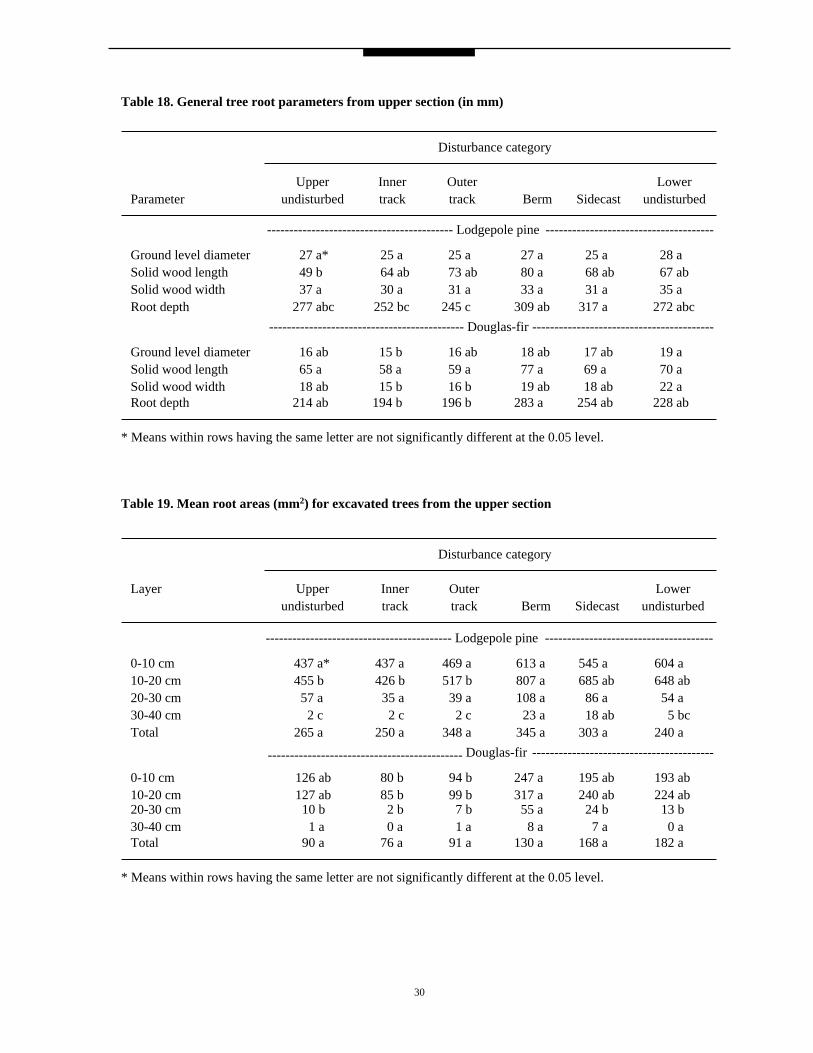
18. General tree root parameters from upper section (in mm)19. Mean root areas (mm2) for excavated trees from the upper section20. General tree root parameters from lower section (in mm)21. Mean root areas (mm2) for excavated trees from the lower section

v
List of FiguresFigure 1. Map of the Clearwater study areaFigure 2. Skidroad and adjacent undisturbed soil categories: (A) upper section; (B) lower sectionFigure 3. Staked skidroad and adjacent undisturbed soil being prepared for planting: (A) Plot 35 upper section;
(B) Plot 32 lower sectionFigure 4. Trends in some chemical characteristics with increasing depth of undisturbed mineral soil:
(A) Organic carbon; (B) Total nitrogen; (C) Carbon/nitrogen; (D) ph (Cacl2)Figure 5. Resistance to penetration (MPa) of skidroad surface (Skrd), berm, and undisturbed mineral soil to a
depth of 20 cm for the upper section. Means at the same depth with the same letter are notsignificantly different at the 0.05 level.
Figure 6. Resistance to penetration (MPa) of skidroad surface (Skrd), berm, and undisturbed mineral soil to a depthof 20 cm for the lower section. Means at the same depth with the same letter are not significantly differentat the 0.05 level.
Figure 7. Height of seedlings growing on disturbed soil as a percentage of height of seedlings grown in anundisturbed soil for the upper section: (A) lodgepole pine; (B) Douglas-fir
Figure 8. Height of seedlings growing on disturbed soil as a percentage of height of seedlings grown in anundisturbed soil for the lower section: (A) lodgepole pine, (B) Douglas-fir
Figure 9. Trends in total vegetative cover following clearcut logging for undisturbed soil and skidroaddisturbance categories: (A) upper section; (B) lower section. Initial cover comes from an adjacentunlogged stand.
Appendix 1. By-species ANOVA tableAppendix 2. Analysis of variance for parameters for the upper section by disturbance categoryAppendix 3. Analysis of variance for parameters for the lower section by disturbance category

vi
Abstract
Soil conditions, growth of 1200 planted seedlings each of lodgepole pine (Pinus contorta var. latifolia) andDouglas-fir (Pseudotsuga menziesii), and development of other vegetation were studied to gauge the effect ofskidroads on site productivity of a coarse-textured, cobbly, glacio-fluvial soil in south-central BritishColumbia. Soil density, penetrability, texture, and chemistry were assessed before planting seedlings.Seedling foliage nutrients and root development were analyzed five growing seasons after planting. To reducethe potential for erosion, the steep, cross-contour skidroads were operationally seeded with a mixture ofgrasses and legumes. Despite reduced soil quality on skidroad surfaces, including increased density andresistance to penetration and reduced organic matter content and water-holding capacity, tree growth ratesafter 10 years were generally not significantly different from those on adjacent undisturbed soil. Lowvegetative competition on the excavated skidroads relative to undisturbed soil and increased nitrogen from theseeded legumes are suggested as compensatory factors. The survival rate of seedlings was least on berms butthose that did survive had generally greater growth rates and root development than those growing inundisturbed soil and, especially, in skidroad surfaces.
Résumé
On a étudié les conditions du sol, la croissance de 1 200 semis de pin tordu latifolié (Pinus contorta var.latifolia) et de 1 200 semis de douglas vert (Pseudotsuga menziesii) et le développement d’autres espècesvégétales pour évaluer les effets des chemins de débardage sur la productivité de stations à sol pierreux et àtexture grossière, composé de dépôts fluvio-glaciaires, dans le centre-sud de la Colombie-Britannique. Avant laplantation des semis, on a évalué la densité du sol, sa pénétrabilité, sa texture et ses propriétés chimiques. On aanalysé la teneur en éléments nutritifs du feuillage des semis et le développement de leurs racines cinq saisonsde végétation après la plantation. Pour réduire les risque d’érosion, on a ensemencé les chemins de débardageabrupts établis transversalement aux courbes de niveaux avec un mélange de graminées et de légumineuses lorsdes opérations de plantation. Malgré une diminution de la qualité du sol des chemins de débardage, y comprisune augmentation de la densité et de la résistance à la pénétration et une réduction de la teneur en matièreorganique et de la capacité de rétention d’eau, les taux de croissance des arbres, après 10 ans, n’étaientgénéralement très différents de ceux établis dans le sol adjacent non perturbé. On pense que la faibleconcurrence végétale régnant dans les chemins de débardage perturbés par les travaux de terrassement et lesurcroît d’azote provenant des légumineuses auraient agi comme facteurs de compensation. Les semis plantéssur les accotements présentait le taux de survie le plus faible, mais ceux qui y ont prospéré avaientgénéralement un taux de croissance et un développement racinaire supérieurs à ceux établis dans le sol nonperturbé et, notamment à ceux poussant dans les anciens chemins de débardage.
Acknowledgments
We thank Bob Mitchell, soil scientist with the British Columbia Ministry of Forests (BCMOF), Kamloops,B.C., now retired, for advice in the field locating plots, the late Dr. Bill Bloomberg, Canadian Forest Service,for assistance in laying out the point-transect lines, Amanda Nemec, statistical consultant, for statisticalservices and staff of the BCMOF at Clearwater, B.C. for help in tree measurement and for obtaining seedlingsfor planting. Analyses of soil for organic carbon, total nitrogen, and pH were conducted by the staff of thePacific Forestry Centre (PFC) under the direction of Ann Van Niekerk. The latter group also conducted thefoliage nutrient analyses. Thanks also go to John Senyk (PFC), Jim Arnott (PFC), and Brad Sutherland (ForestEngineering Research Institute of Canada) for thorough reviews; to Steve Glover and Jennifer Adsett (PFC) foreditorial assistance; and to Soren Henrich for graphics and design.

1
1.0 Introduction
Effects of forestry operations on soils are a serious concern in British Columbia (B.C.), particularly inmountainous regions. Utzig and Walmsley (1988) estimated that soil degradation from forestry operationsreduced annual wood yield over a 10-year period (1976-1985/86) an estimated 400 000 m3, and that thisamount was increasing by about 50 000 m3 each year. Lousier (1990) concluded from the literature that“compaction-induced” volume reductions over the entire harvest area (cutblock) were in the range of 10-15%.The severity of impact depends on the type and degree of disturbance and on soil and site factors. Smith andWass (1979) found that in the Engelmann Spruce-Subalpine Fir Zone, tree growth was particularly reduced onskidroads constructed in medium-to-fine textured soil derived from alkaline parent material. On these soils,reductions in site productivity based on reduced height growth and as prorated over whole cutblocks wereestimated to be as much as 15% for subalpine fir (Abies lasiocarpa (Hook.) Nutt.) and 12% for Engelmannspruce (Picea engelmannii Parry). In another study on calcareous soils in the lower-elevation Interior CedarHemlock Zone, Smith and Wass (1994a) found overall reduced productivity resulting from skidroadconstruction and use of 4% for Douglas-fir (Pseudotsuga menziesii (Mirb.) Franco) and 5% for lodgepole pine(Pinus contorta var. latifolia Engelm.). Growth on skidroads was also reduced on strongly acid, coarse-texturedsoil developed under a wet climatic regime with prorated productivity reductions ranging from 2.1 to 14.5%(Smith and Wass 1980)1. In contrast, skidroad disturbance on moderately coarse, acid soils on cool aspects hadbeneficial effects on tree growth (Smith and Wass 1979)2.
An opportunity to study the changes in soil characteristics and in site productivity resulting from theconstruction and use of cross-contour (downhill) skidroads in a soil texture/climatic zone combination notpreviously studied arose in 1983 when a stand north of Clearwater, British Columbia, was harvested. TheBritish Columbia Ministry of Forests (BCMOF) recognized that severe soil disturbance had been caused by thedeep, steeply sloping skidroads and were concerned about post-logging soil erosion, future productivity loss,and public reaction to the clearcut, which was clearly visible from a major highway. To reduce the potential forsoil erosion, the BCMOF seeded the skidroads with grasses and legumes (creeping red fescue (Festuca rubraL.), Kentucky bluegrass (Poa pratensis L.), S.C. red clover (Trifolium pratense L.), Alsike clover (Trifoliumhybridum L.), annual ryegrass (Lolium temulentum L.), and white Dutch clover (Trifolium repens L.)). TheCanadian Forest Service was asked to determine effects of the skidroads on site productivity.
The main objectives of our study were to describe the effects of the constructed skidroads on soils, onvegetation composition and development of vegetation, and on the growth of planted trees. The hypothesis wasthat the effects of the construction and use of skidroads on soil properties, vegetation development, andseedling growth would vary with the type and degree of the soil disturbance. The seeding of grasses andlegumes introduced a complication to assessment of the results, but also an opportunity to determine its effecton vegetation cover and composition.
1 See Vunder Fire, p. 21.2 See Templeton Creek, p. 14-16.

2
2.0 Study Area
2.1 Ecology and soils
The cutblock (FL A18694, Blk. F, CP 38) is located in the Thompson Moist Warm variant of theInterior Douglas-fir Zone (IDFmw2) (Lloyd et al. 1990), approximately 40 km east of Clearwater, BritishColumbia. The average elevation of the site is 853 m, and the aspect is south. The original stand wascomposed of Douglas-fir (Pseudotsuga menziesii (Mirb.) Franco) (60%) and lodgepole pine (Pinus contortavar. latifolia Engelm.) (40%). Based on topography, the cutblock was divided into two sections (Figure 1).The lower section is gently to moderately sloping (10-47%) and dominated by plant association Pseudotsugamenziesii -Thuja plicata-Paxistima myrsinites-Chimaphila umbellata (Lloyd et al. 1990). The upper sectionis steeply sloping (30-70%) and is dominated by the plant association Pseudotsuga menziesii-Calamagrostisrubescens-Pleurozium schreberi (Lloyd et al. 1990). The soils are cobbly sandy loams to loamy sandsderived from glacio-fluvial deposits.
2.2 Skidroads
The skidroads were oriented across the contour; i.e., with a definite downhill bias. Those from the lowersection of the cutblock had cutbanks averaging 0.6 m in depth, with an average horizontal distance from the topof the cutbank to the bottom of the sidecast of 8.4 m. This was composed of a cutbank (1.1 m), running surface(4.4 m), and berm and sidecast (2.9 m). Skidroads in the upper section of the cutblock had cutbanks averaging0.6 m in depth, with an average horizontal distance from the top of the cutbank to the bottom of the sidecast of8.9 m. This was composed of a cutbank (1.4 m), running surface (4.5 m), and berm and sidecast (3.0 m).

3
3.0 Methods
3.1 Transect survey
The whole cutblock was surveyed to determine the extent, degree, and type of soil disturbance using a point-transect method. Points were spaced 3 m apart (Smith and Wass 1976) conducted along a system of transectslocated and oriented as recommended by Bloomberg et al. (1980). Soil disturbance was classified by cause asdeposits or gouges and by three depth classes (<5 cm, 5-25 cm, and >25 cm) or as undisturbed. A total of 389points were surveyed and described. Similarly, data were gathered from 101 points on transects in an adjacentunlogged stand (Figure 1).
Figure 1. Map of Clearwater study area
39 33 3233 Plantation plot
Soil pit
Skidroad
Transect0 150Meters
Uncut stand
Uncut stand
Uncut stand
Landing
38
373635
Uncut stand
34Upper section
Lower section
4
3.2 Soil studies
3.2.1 Bulk density. Soil bulk density was measured by soil displacement and the volume of excavated holeswas estimated with a sand-cone apparatus (Blake 1965). One sample was taken at each of two depths (0-10 cmand 10-20 cm) in each of three categories in each of eight plantation plots. The categories were the skidroadsurface, berm, and undisturbed mineral soil. Bulk densities were calculated for total soil and for the fractionmade up of particles less than 2 mm in diameter (the fine fraction).
3.2.2 Penetrability. Penetrability was measured with a U.S. Corps of Engineers Model CN-973 penetrometerequipped with a 1.3 cm2 cone. Four probes were made to a depth of 20 cm at each of the bulk density sitessituated in the skidroad surface and berm in each of the eight plots. After removing any humus, four probeswere made at each of the bulk density sites situated in the undisturbed mineral soil in each of the eight plots.
3.2.3 Particle size. Coarse fragment content of each bulk density sample was determined by sieving andweighing. Texture of the fine fraction of selected samples was determined by the Bouyoucos hydrometermethod (McKeague 1978).
3.2.4 Chemistry. The fine soil fraction of bulk density samples was analyzed for the following characteristics:
1. pH- potentiometrically in 0.01 M CaCl2 (McMullan 1971).2. organic carbon- LECO induction furnace (McKeague 1978).3. total nitrogen- automated semi-micro Kjeldahl (McKeague 1978).
3.2.5 Soil profiles. Two soil pits were described, sampled and classified (Walmsley et al. 1980; AgricultureCanada Expert Committee on Soil Survey 1987). Both pits were located in the unlogged stand adjacent to thestudy area: one in the lower section and another in the upper section (Figure 1). Samples taken from the centreof soil horizons were sieved, the coarse fragments weighed, textures of the fine fraction determined, and testsmade for total nitrogen, pH, and organic carbon.
3.3 Plantations
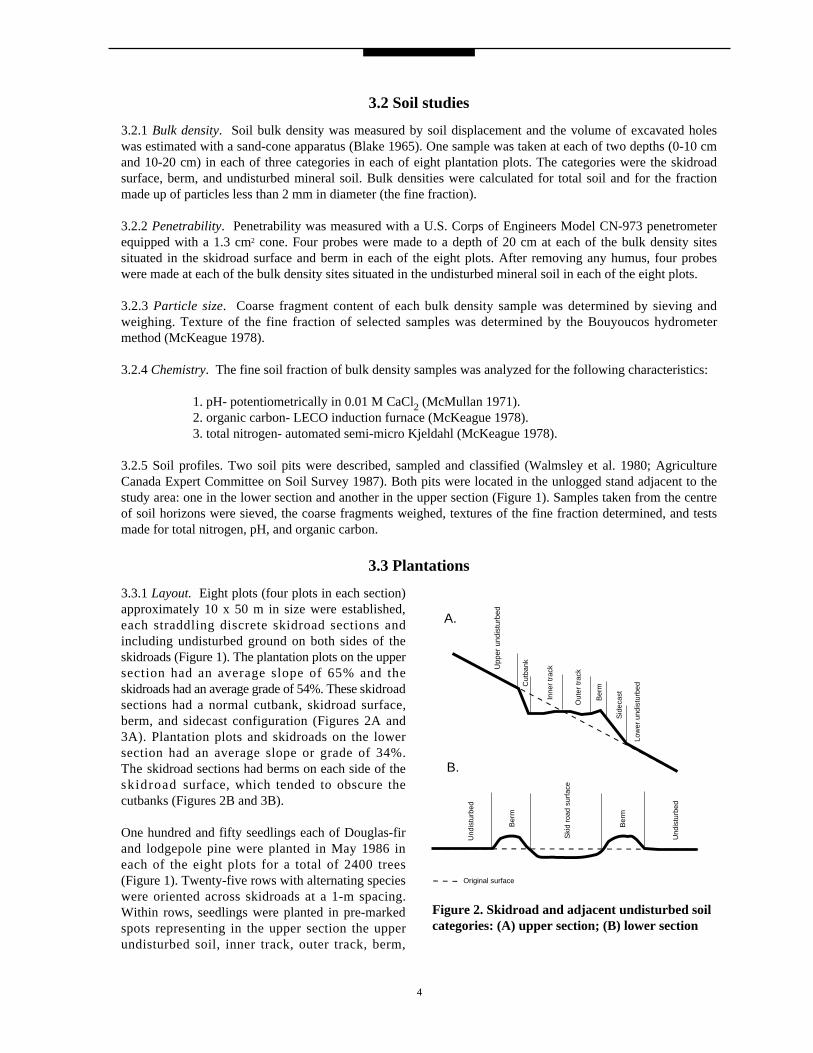
3.3.1 Layout. Eight plots (four plots in each section)approximately 10 x 50 m in size were established,each straddling discrete skidroad sections andincluding undisturbed ground on both sides of theskidroads (Figure 1). The plantation plots on the uppersection had an average slope of 65% and theskidroads had an average grade of 54%. These skidroadsections had a normal cutbank, skidroad surface,berm, and sidecast configuration (Figures 2A and3A). Plantation plots and skidroads on the lowersection had an average slope or grade of 34%.The skidroad sections had berms on each side of theskidroad surface, which tended to obscure thecutbanks (Figures 2B and 3B).
One hundred and fifty seedlings each of Douglas-firand lodgepole pine were planted in May 1986 ineach of the eight plots for a total of 2400 trees(Figure 1). Twenty-five rows with alternating specieswere oriented across skidroads at a 1-m spacing.Within rows, seedlings were planted in pre-markedspots representing in the upper section the upperundisturbed soil, inner track, outer track, berm,
Upp
er u
ndis
turb
ed
Cut
bank
Inne
r tr
ack
Out
er tr
ack
Ber
m
Sid
ecas
t
Low
er u
ndis
turb
ed
Und
istu
rbed
Ber
m
Ber
m
Ski
d ro
ad s
urfa
ce
Und
istu
rbed
Original surface
A.
B.
Figure 2. Skidroad and adjacent undisturbed soilcategories: (A) upper section; (B) lower section

5
Figure 3. Staked skidroads and adjacent undisturbed soil being prepared for planting: (A) Plot 35 upper section; (B) Plot 32 lower section

6
sidecast, and the lower undisturbed soil (one seedling per disturbance type), and in the lower section theundisturbed soil, berm and, skidroad surface (two seedlings per disturbance type) (Figures 2 and 3). Spacing ofseedlings within rows varied depending on the configuration of disturbance, but was not less than 1 m.
3.3.2 Stock type, size and planting method. The Douglas-fir and lodgepole pine seedlings were 2+0 barerootstock. Pre-planting measurements of a sample of seedlings of each species showed that Douglas-fir averaged 19cm and lodgepole pine 25 cm in height. Douglas-fir had a 2:1 and lodgepole pine a 3:1 stem:root weight ratio.The seedlings were planted with a planting shovel.
3.3.3 Monitoring and maintenance. Heights and ground-level diameters of all seedlings were measuredimmediately after planting and after each growing season for 5 years. Further tree measurements were madeafter the 8th and 10th year. Tree condition was assessed at the same time as measurements were made and deadseedlings were recorded and removed. After the third growing season, competing vegetation was cut downonce each year. After the fifth season, seedlings were thinned to a minimum spacing of 2 x 2 m.
3.3.4 Vegetation. Characteristics of vegetation by species and layers were measured using procedures outlinedby Walmsley et al. (1980). Pre-planting and unlogged stand vegetation was assessed in 1985 using mil-acre(4.05 m2) plots established at 15-m intervals along transects. In each of the years 1985, 1986, 1987, and 1988,117 mil-acre, tree-centered, sub-plots were surveyed within the established plots. All plants identified for eachdisturbance category were used to produce dissimilarity percentages (PD) (Pielou 1984). Additionally, thecomposition of plants found in over 40% of the plots within a disturbance category over the 4 years ofobservation were tabulated by soil disturbance categories.
3.3.5 Soil water. Volumetric soil water content (top 20 cm of mineral soil) was measured in early July 1988with an Instrument for Reflectometry Analysis of Moisture in Soils (IRAMS) (Topp et al. 1984). Moistureprobes were made close to three randomly selected seedlings in each disturbance category in each of the fourplots from the lower section, and in two plots from the upper section.
3.3.6 Foliage nutrients and needle weights. Samples from the second whorl current year’s foliage were takenin the fall of 1990 (after five growing seasons) from six trees of each species per plot for each of thedisturbance categories and undisturbed soil. A total of 432 trees were sampled. Analysis was done by theChemical Services Laboratory of the Pacific Forestry Centre. For chemical analyses, samples were dried andground and then dried again just before analyses. Total N was analyzed directly on the sample with a LECOFP228 organic nitrogen analyzer, and S with a LECO SC132 sulfur analyzer. Active Fe was analyzed from a 1N HCL extract using Atomic Absorption Spectrophotometry (Ballard 1981). The remaining elements wereanalyzed after digestion using a modified method of Parkinson and Allen (1975) (concentrated sulfuric acid andhydrogen peroxide). Phosphorus was analyzed from the original digest on a Technicon Auto Analyzer using thereduced phospho-molybdate complex, and total Ca, Mg, K, and Mn by Inductively Coupled PlasmaSpectrometry.
An internal laboratory standard (Shawnigan Lake Standard Foliage-Douglas-fir), as calibrated against a samplefrom the National Bureau of Standards (NBS 1575- Pine needles), was used to check the precision of results.
The nutrient status of Douglas-fir and lodgepole pine was evaluated using a computer program developed at theUniversity of British Columbia (Ballard and Carter 1986).
3.3.7 Roots. In May, 1991 (after five growing seasons) six trees of each species per plot for each ofundisturbed soil, inner track, outer track, berm, and sidecast were excavated in the upper section for a total of240 seedlings, and six trees of each species per plot for each of undisturbed soil, berm, and skidroad surfacewere excavated in the lower section for a total of 144 trees. Tree selection was based on the six trees withvolumes nearest the mean tree volume of all trees for each plot, species, and disturbance category combination.

7
Tree height and diameter at ground level were based on the 5th year growth measurements. The ground leveland the upper slope side of the stem were marked. The stem was cut 5 cm above ground level and the treesexcavated with mattocks and shovels to a depth required to collect the deepest roots with diameter of 2 mm ormore. Lateral roots were severed 15 cm out from the base of the tree.
Root systems were transported to the laboratory, washed, then stored just above freezing temperature. Storedroots were rehydrated before measuring by soaking in water for 48 hours. The roots were suspended from acylindrical frame 10 cm in diameter and 40 cm deep, divided into four 10-cm-deep sections or layers (Wass andSmith 1994). Each layer was divided into four equal quadrants. The cut stump was centered in the cylinder withthe groundline level, with the top of the frame and the upper slope mark aligned with quadrant number one. Thelongitudinal axis of the main stem and root system was oriented in their original positions by using the cutplane as a horizontal reference.
The size of the root system was measured using a modification of the method devised by Lindgren andOrlander (1978); i.e., “root-area”. The diameter of each root greater than 2 mm passing through the walls of thecylinder and bottom were measured and the cross-sectional area was calculated. The root area by 10-cm layerfor each tree was determined by summing these areas. The total root area for each tree is the sum of all rootareas of roots passing through the walls plus the root areas of roots passing through the bottom of the lastcylinder where roots occur.
The length of the taproot was measured from the top of the cylinder (frame) to where it exited the cylinder(Wass and Smith 1994). Taproots exiting the bottom of the cylinder were given a length of 40 cm. Solid-woodlength and width were measured for both tree species (Wass and Smith 1994).
3.4 Data analyses
Analysis of variance (ANOVA) was performed using a general linear model procedure for unbalanced designs.The ANOVA table for analysis of tree data is presented in Appendix 1. The data for each tree species wereanalyzed separately. The Least-square means (p=0.05) was used to separate differences in disturbance categorymeans. Chi-square tests were applied to test differences in survival of trees planted on the different disturbancecategories. Percentage data were transformed to the arcsine before ANOVA. Appendices 2 and 3 present themean square (MS), F values, and probabilities for parameters that were analyzed by disturbance category. Allstatistical analyses were performed with SAS computer programs (SAS Institute Inc. 1985).
8
4.0 Results
4.1 Undisturbed soil profile characteristics
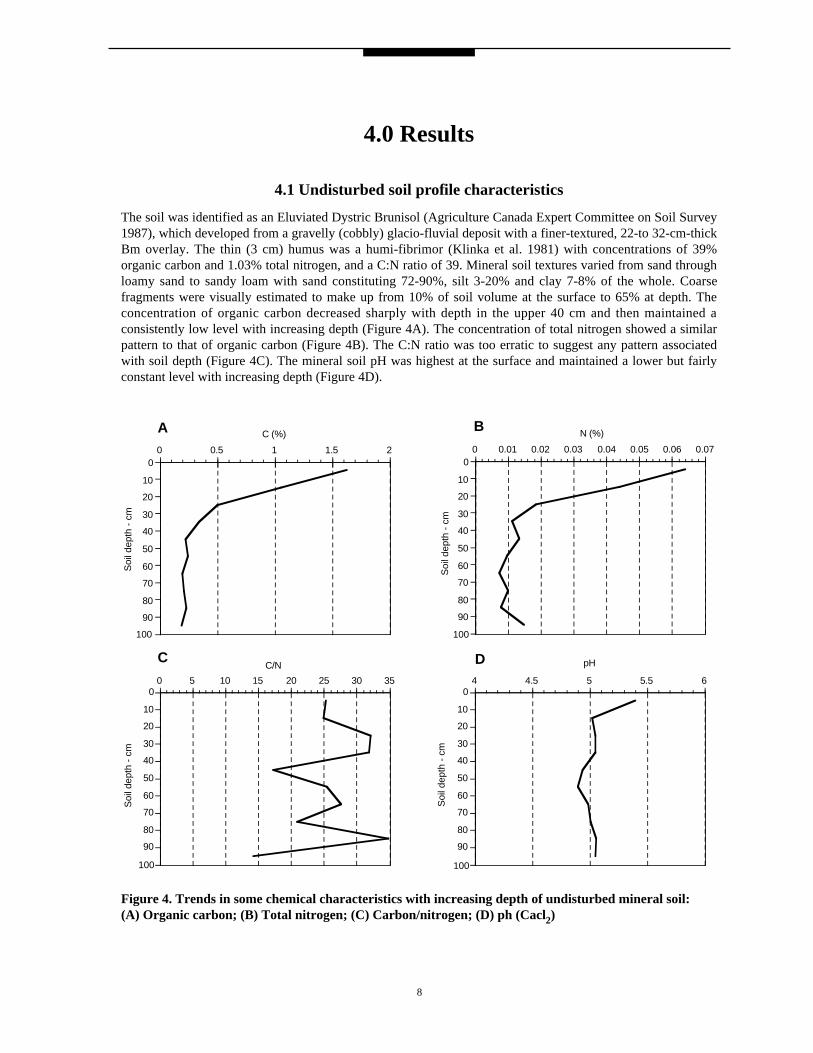
The soil was identified as an Eluviated Dystric Brunisol (Agriculture Canada Expert Committee on Soil Survey1987), which developed from a gravelly (cobbly) glacio-fluvial deposit with a finer-textured, 22-to 32-cm-thickBm overlay. The thin (3 cm) humus was a humi-fibrimor (Klinka et al. 1981) with concentrations of 39%organic carbon and 1.03% total nitrogen, and a C:N ratio of 39. Mineral soil textures varied from sand throughloamy sand to sandy loam with sand constituting 72-90%, silt 3-20% and clay 7-8% of the whole. Coarsefragments were visually estimated to make up from 10% of soil volume at the surface to 65% at depth. Theconcentration of organic carbon decreased sharply with depth in the upper 40 cm and then maintained aconsistently low level with increasing depth (Figure 4A). The concentration of total nitrogen showed a similarpattern to that of organic carbon (Figure 4B). The C:N ratio was too erratic to suggest any pattern associatedwith soil depth (Figure 4C). The mineral soil pH was highest at the surface and maintained a lower but fairlyconstant level with increasing depth (Figure 4D).
90
80
70
60
50
40
30
20
10
00 0.5 1 1.5 2
Soi
l dep
th -
cm
C (%)A
100
90
80
70
60
50
40
30
20
10
00 0.01 0.02 0.03 0.04 0.05 0.06 0.07
Soi
l dep
th -
cm
N (%)
100
B
90
80
70
60
50
40
30
20
10
00 5 10 15 20 25 30 35
Soi
l dep
th -
cm
C/N
100
C
90
80
70
60
50
40
30
20
10
04 4.5 5 5.5 6
Soi
l dep
th -
cm
pH
100
D
Figure 4. Trends in some chemical characteristics with increasing depth of undisturbed mineral soil: (A) Organic carbon; (B) Total nitrogen; (C) Carbon/nitrogen; (D) ph (Cacl2)

9
Using our description of the soils and keys developed for rating the sensitivity of forest sites to soil disturbance(British Columbia Ministry of Forests and B.C. Ministry of Environment, Lands and Parks 1995), the lowersection was rated low to moderately sensitive to soil compaction and puddling, moderate for displacement andmass wasting, and high for forest floor displacement and surface soil erosion. The upper section was rated lowto moderately sensitive to soil compaction and puddling, and high for displacement, forest floor displacement,surface soil erosion, and mass wasting (due to underlying non-cohesive material and potential for dry raveling).
4.2 Ground surface conditions
One hundred percent of the uncut stand was classified as undisturbed (Table 1). Average depth of humus was 3cm, 80% of which was classified as humified with no rotten wood, 6% as rotten wood, 13% as mixtures ofrotten wood and humified material, and 1% as not present. Sound woody debris covered 16% and natural,rotting logs covered 14% of the ground surface.
Forty-five percent of the cutblock was disturbed, most of this (39%) caused by skidroad construction (Table 1).Most of the remaining disturbance resulted from non-constructed skidtrails. Of the disturbance, 67% was verydeep (> 25 cm) and 33% was deep (5-25 cm).
4.3 Soil bulk density
Upper Section: Total bulk density of the soil at 0-10 cm was greatest in the skidroad surface, significantlygreater than the undisturbed soil (Table 2). The total bulk density at the 10-to 20-cm depth in the skidroadsurface was significantly greater than for the berm and undisturbed soil. The fine bulk density for skidroadsurface at the 10-to 20-cm depth was significantly greater than the berm and undisturbed soil.
Lower Section: Total bulk density of the soil at 0-10 cm and 10-20 cm was greatest in the skidroad surface,significantly greater than in the berm and undisturbed soil (Table 2). At the 0-to 10-cm soil depth, bulk densityof the fine soil was significantly greater on the skidroad surface than in the berm and undisturbed soil, butsignificantly greater at the 10-to 20-cm depth only for the berm.
4.4 Penetrability
Upper Section: Soils in the skidroad surface showed significantly greater resistance to penetration than soils inberms for depths 2.5 to 20 cm and undisturbed soils for depths 7.5 cm to 20 cm (Figure 5). Soil from the bermwas more easily penetrated than undisturbed soil, significantly so at the soil surface (0 cm) and at depths of 2.5,5, and 10 cm.
Lower Section: The skidroad surface showed significantly greater resistance to penetration than the undisturbedsoil at 5-to 20-cm depth and in berms for all depths tested to 20 cm (Figure 6). Additionally, undisturbed soilwas more easily penetrated than soil from the berm, but significantly so only at the soil surface.
4.5 Coarse fragment content
Upper Section: The coarse fragment content of the upper 10 cm of undisturbed soil was significantly less thanfor the top 10 cm of soil from the skidroad surface and berm (Table 3).
Lower Section: The coarse fragment content for the 10-to 20-cm depth was significantly greater for soil in theskidroad surface than for the berm and undisturbed soil. (Table 3).

10
4.6 Soil chemical characteristics
Upper Section: At a soil depth of 0-10 cm, the concentration of organic carbon and total nitrogen weresignificantly less for the skidroad surface than for the undisturbed soil (Table 4). At a soil depth of 10-20 cm,soil from the berm had a significantly greater concentration of organic carbon than the skidroad surface.
Lower Section: At a soil depth of 10-20 cm, the concentration of organic carbon and total nitrogen weresignificantly greater for the berm than for undisturbed soil and the skidroad surface (Table 4).
4.7 Volumetric soil water content
Upper Section: The lower undisturbed soil had a significantly greater volumetric soil water content at 0-to 20-cm depth than the soil from the inner track, outer track, berm and sidecast (Table 5). Soil water content wassignificantly greater in the upper undisturbed soil than in the outer track, berm and sidecast.
Lower Section: The berm had significantly less volumetric soil water content at 0-to 20-cm depth than theundisturbed soil and skidroad surface (Table 6).
4.8 Seedling survival
Upper Section: After 5 years, Douglas-fir and lodgepole pine seedlings exhibited significantly poorer survivalin the berm than in the other disturbance categories (Table 7). Highest survival for Douglas-fir occurred on theinner track, and was significantly greater there than on the outer track, sidecast or berm. Lodgepole pine hadalmost twice the percentage of surviving trees as Douglas-fir when both grew in the berm.
Lower Section: Survival of lodgepole pine was significantly less in the berm than in undisturbed soil or theskidroad surface (Table 7).
Average survival for Douglas-fir in the lower section was 14% higher than in the upper section. In comparison,the difference in percentage survival between the sections was only 1% for lodgepole pine.
Figure 5. Resistance to penetration (MPa) ofskidroad surface (Skrd), berm, and undisturbedmineral soil to a depth of 20 cm for the uppersection. Means at the same depth with the sameletter are not significantly different at the 0.05 level.
Figure 6. Resistance to penetration (MPa) ofskidroad surface (Skrd), berm, and undisturbedmineral soil to a depth of 20 cm for the lowersection. Means at the same depth with the sameletter are not significantly different at the 0.05 level.
B
BB
B BB
B BB
J
J
J
J
J
J
J
JJ
HH
HH
HH
H
H
H
0 2.5 5 7.5 10 12.5 15 17.5 200
0.5
1
1.5
2
2.5
3
3.5
4
4.5
5
5.5
Res
ista
nce
- (M
Pa)
Depth/(cm)
B Undisturbed
J Skrd
H Berm
a
ab b
a
aa
a
a
a
a
aab b
b
b
b
b
b
b
b
b
b
b
b
b
b
B
BB B
B B BB
B
J
J
J
J
J
J
J
J
J
HH
HH
HH
HH
H
0 2.5 5 7.5 10 12.5 15 17.5 200
0.5
1
1.5
2
2.5
3
3.5
4
4.5
5
Res
ista
nce
- (M
Pa)
Depth/(cm)
B Undisturbed
J Skrd
H Berm
a
a
a
a
a
a
aa
a
a
aabb b b
b
bb b
b
b
b
b
b
b
b
c

11
4.9 Seedling growth
Upper Section: Measurements made immediately after planting showed that there were no significantdifferences in the height of lodgepole pine and Douglas-fir among disturbance categories. Mean height anddiameter of lodgepole pine seedlings after five and ten growing seasons were not significantly different amongdisturbance categories (Table 8). Mean height of Douglas-fir seedlings after five growing seasons on the lowerundisturbed soil was significantly greater than mean height of seedlings on the inner track (Table 9). After tengrowing seasons, the mean height of Douglas-fir planted in the berm was significantly greater than forseedlings planted in the inner track and upper undisturbed soil, while trees on the upper undisturbed soil weresignificantly shorter than trees on all the other categories except the inner track (Table 9). Mean diameter ofDouglas-fir seedlings growing in the berm was significantly greater than for seedlings planted in the otherdisturbance categories (Table 9).
Heights of Douglas-fir and lodgepole pine seedlings growing in disturbed soil were compared with their growthin undisturbed soil (upper and lower undisturbed categories combined) for the period from 1986 to 1995(Figure 7). By the 2nd year, lodgepole pine seedlings on all disturbed soils were showing reduced height
Figure 7. Height of seedlings growing on disturbed soil as a percentage of height of seedlings grown in anundisturbed soil for the upper section: (A) lodgepole pine; (B) Douglas-fir
B
B BB
B
BB
J
J
JJ
J
J
J
H H
HH
H
H
H
F
F
FF
F
F
F
1986 1987 1988 1989 1990 1991 1992 1993 1994 199570
80
90
100
110
120
130
140
Per
cent
of u
ndis
turb
ed
Year
B Inner Track J Outer track H Berm F Sidecast
B
B
B
B
B B
B
B
J
J
J J
J
J
J
H
H
H
H
H
H
H
F
F
F
F
F
F
F
1986 1987 1988 1989 1990 1991 1992 1993 1994 199585
90
95
100
105
110
Per
cent
of u
ndis
turb
ed
Year
A

12
growth relative to those growing in undisturbed soils (Figure 7A). However, by the 10th year, lodgepole pineseedlings on inner and outer tracks had height growth greater than those growing in undisturbed soil.By the 1st year, Douglas-fir seedlings on all disturbed soils were showing reduced height relative to thosegrowing in undisturbed soil ( Figure 7B). By the 8th year, height growth for Douglas-fir seedlings from theberm, sidecast, and outer track ranged from 112 to 135% of that for Douglas-fir growing in undisturbed soil.The mean height of seedlings growing in the inner track remained slightly below that for the undisturbed soilby the 10th year.
Lower Section: Measurements made immediately after planting showed that there were no significantdifferences in the height of lodgepole pine and Douglas-fir among disturbance categories. Mean height anddiameter of lodgepole pine and Douglas-fir seedlings after five and ten growing seasons were not significantlydifferent among disturbance categories (Tables 10 and 11).
Heights of Douglas-fir and lodgepole pine seedlings growing in disturbed soil were compared with their growth inthe undisturbed soil for the period from 1986 to 1995. By the 8th year, lodgepole pine seedlings growing in the bermand skidroad surface had equalled or exceeded the height of seedlings growing in the undisturbed soil (Figure 8A)
Figure 8. Height of seedlings growing on disturbed soil as a percentage of height of seedlings grown in anundisturbed soil for the lower section: (A) lodgepole pine, (B) Douglas-fir
B
B
B
B B
BB
J
J J
J
J
J
J
1986 1987 1988 1989 1990 1991 1992 1993 1994 199580
85
90
95
100
105
110
Per
cent
of u
ndis
turb
ed
Year
A
B
B
B
B
B
B
B
J
JJ
J
J
J
J
1986 1987 1988 1989 1990 1991 1992 1993 1994 199580
90
100
110
120
Per
cent
of u
ndis
turb
ed
Year
B Berm J Skrd
B
Skidroadsurface
Skidroadsurface

13
By the 1st year, Douglas-fir seedlings in both berm and skidroad surface were showing reduced height growthrelative to those growing in undisturbed soil (Figure 8B). By the 8th year, Douglas-fir seedlings on disturbedsoils were showing heights exceeding those of seedlings growing in undisturbed soil.
4.10 Foliage nutrients
Upper Section: There were no significant differences by disturbance categories for the elements K, Ca, Mg, S,Mn, and total Fe for Douglas-fir foliage. The concentration of N was significantly greater for seedlings growingin the sidecast than in the upper undisturbed soil (Table 12). The concentration of P in Douglas-fir foliage wassignificantly greater for seedlings growing in the inner track than in other disturbance categories, except theouter track and sidecast.
Based on Ballard and Carter’s (1986) nutrient deficiency program, Douglas-fir foliage was, on average, severelydeficient in N for all disturbance categories. Magnesium may have been deficient for all disturbance categoriesexcept inner and outer track. Calcium may have been deficient for seedlings growing in the inner track.
For lodgepole pine, there were no significant differences by disturbance categories for the elements N, P, K,Ca, S, and Total Fe (Table 12). The concentrations of Mg and Mn were significantly greater for foliage fromseedlings growing in the inner track than in upper undisturbed soil (Table 12).For lodgepole pine, foliage nitrogen was severely deficient for all disturbance categories except sidecast, whichwas slightly to moderately deficient. Phosphorus was slightly to moderately deficient for trees in all disturbancecategories except in the lower undisturbed soil, where they were not deficient. Magnesium was slightly tomoderately deficient for trees in all disturbance categories except the inner track.
Lower Section: There were no significant differences by disturbance categories for all the elements N, K, Ca, S,Mg, and total Fe for Douglas-fir foliage (Table 13). The concentration of P was significantly greater for seedlingsgrowing in the skidroad surface than in the undisturbed soil (Table 13). The concentration of Mn was significantlyless for seedlings from the undisturbed soil than for the seedlings from the skidroad surface and berm.
Based on Ballard and Carter’s (1986) nutrient deficiency program, Douglas-fir foliage was, on average,severely deficient in N for all disturbance categories.
For lodgepole pine, there were no significant differences by disturbance categories for any of the elements(Table 13).
For lodgepole pine, nitrogen was severely deficient, P was slightly deficient, and Mg was slightly to moderatelydeficient for all disturbance categories.
4.11 Vegetation
For both sections, the average total vegetative cover in the adjacent unlogged stand (92%) was used as theunharvested starting point (Figure 9).
Upper Section : Vegetative cover reached its lowest point 3 years after harvesting for all soil categories, withthe inner track the lowest at 16% (Figure 9A). Five years after harvesting, vegetative cover for the inner trackhad recovered to 30%, with the other disturbance categories ranging from 47 to 62% (Figure 9A).
In comparisons among disturbance categories, vegetation composition and cover were found to be mostdissimilar between unlogged and the other disturbance categories, and least dissimilar between outer track, andberm (Table 14). Differences in vegetation were great between the logged undisturbed (upper and lower) andboth the inner and outer track with dissimilarly indices ranging from 93-95% (Table 14).

14
Amelanchier alnifolia Nutt., Linnaea borealis L., and Paxistima myrsinites (Pursh) Raf. were found frequentlyonly on undisturbed soil (Table 15). Trifolium pratense L., Trifolium hybridum L., Festuca occidentalis Hook.and Festuca rubra L. were found frequently only on disturbed soil..Lower Section: Vegetative cover reached its lowest point 3 years after harvesting for all three disturbancecategories, with the skidroad surface least at 19% (25% for berm and 36% for undisturbed soil) (Figure 9B).By 5 years after harvesting, vegetative cover had recovered to 56% for undisturbed soil, 55% for berm, and43% for the skidroad surface.
In comparisons among disturbance categories, vegetation composition and cover were found to be mostdissimilar between the unlogged stand and the skidroad surface, and least dissimilar between undisturbed soiland the berm (Table 16). Amelanchier alnifolia, Linnaea borealis, Paxistima myrsinites, Shepherdiacanadensis (L.) Nutt., Berberis aquifolium Pursh, and Oryzopsis asperifolia Michx. were found frequentlyonly on undisturbed soil (Table 17). Festuca rubra, F. occidentalis, Trifolium pratense and T. hybridum werefound frequently only on disturbed soil. Epilobium angustifolium L., and Calamagrostis rubescens Buckl. werefound frequently only on the skidroad berm. Spiraea betulifolia Pall. and Ceanothus sanguineus Pursh werefound frequently on all disturbance categories.
B
B
B
B
B
J
J
J
J
J
H
H
H
H
H
F
F
F
FF
2
2
2
2
2
✱
✱
✱
✱✱
1983 1984 1985 1986 1987 19880
10
20
30
40
50
60
70
80
90
100
Tot
al v
eget
ativ
e co
ver
- (%
)
Year
BUpperundisturbed
J Inner track
H Outer track
F Berm
2 Sidecast
✱Lowerundisturbed
B
B
B
B
B
J
J
J
JJ
H
H
H
H
H
1983 1984 1985 1986 1987 19880
10
20
30
40
50
60
70
80
90
100
Tot
al v
eget
ativ
e co
ver
- (%
)
Year
B Undisturbed
J Skrd
H Berm
B
Figure 9. Trends in total vegetative cover following clearcut logging for undisturbed soil and skidroaddisturbance categories: (A) upper section; (B) lower section. Initial cover comes from an adjacentunlogged stand.
Skidroadsurface

15
4.12 Roots
Upper Section: Lodgepole pine solid-wood width, and ground-level diameter were not significantly differentfor disturbance categories (Table 18). The solid-wood length was significantly less for trees growing in theupper undisturbed soil than for trees on the berm. Root depth for trees on the sidecast was significantly deeperthan for trees on the inner and outer tracks, and deeper in the berm than in the outer track. For root area at the0-10 cm and 20-30 cm layers and total root area, there were no significant differences between disturbancecategories (Table 19). For the 10-20 cm layer, trees on the berm had a significantly greater root area than treeson the upper undisturbed, inner track and, outer track. For the 30-40 cm layer, root area was significantly lessfor upper undisturbed, inner track, and outer track than for trees in the berm and sidecast.
For Douglas-fir growing on the lower undisturbed soil, ground-level diameter was significantly greater than fortrees growing on the inner track (Table 18). Solid-wood width was significantly greater for trees on the lowerundisturbed soil than for trees on the inner and outer tracks. Trees from the berm had significantly deeper rootsthan trees from the inner and outer tracks. For the 0-10 cm and 10-20 cm layers, root area was significantlygreater for trees on the berm than for trees growing on the inner and outer tracks (Table 19). At the 20-30 cmlayer, the root area was significantly greater for trees on the berm than for trees on all of the other disturbancecategories. For root area at the 30-40 cm layer and for total root area, there were no significant differencesbetween disturbance categories.
Lower Section: Lodgepole pine ground-level diameter and solid-wood length and width were not significantlydifferent by disturbance category (Table 20). Tree root depth was significantly deeper for trees growing in theberm than for those on the undisturbed soil and skidroad surface. There were no significant differences amongthe disturbance categories for root area by layers or total (Table 21).
For Douglas-fir, there were no significant differences in ground-level diameter, solid-wood length or width, orroot depth by disturbance category (Table 20). At the 20-30 cm layer, the root area for trees growing in theberm was significantly greater than for trees on the undisturbed soil or skidroad surface (Table 21). For the 0-10 cm, 10-20 cm and 30-40 cm layers, and total there were no significant differences in root area bydisturbance category.

16
5.0 Discussion and Conclusions
The 39% coverage of skidroads, their average width of 8.4 m, and the 67% of skidroad disturbance categorizedas very deep (>25 cm) compare closely with 32%, 7.9 m, and 66%, respectively, in a regional survey insoutheastern British Columbia (Smith and Wass 1976). However, being oriented largely downhill as opposed tothe more common contour pattern used on steep slopes, the depth of disturbance (i.e., cut and fill), and thus theoverall width of the skidroads should, in theory, have been substantially less ( Homoky, 1994). Downwardorientation did result in skidroad grades that had to conform closely to the natural slope. This resulted in gradesin the upper section that were more than 100% and in the lower section more than 35% greater than those foundfor comparable slopes in the regional study (Smith and Wass 1976). Considering these soil disturbancemeasures alone, the concern of forest managers about soil erosion and productivity loss was well justified.
Details of the changes in soil characteristics from the undisturbed state wrought by the skidroad constructionalso point to overall site deterioration. These include significantly greater soil density and reduced penetrabilityin the surface 20 cm at least of skidroad running surfaces compared with undisturbed soil in both the upper andlower sections. These densities exceed those found to restrict root growth of Douglas-fir and lodgepole pine(Heilman 1981; Minore et al. 1969). The content of coarse fragments was also greater on the skidroad surfaces,reaching as much as 71%. However, largely as a result of the high coarse fragment content, active compactionby skidders was not evident from comparisons of densities in the skidroads with equivalent depths in theundisturbed soil. Generally, the upper section had higher bulk densities and greater coarse fragment contentthan the lower section.
In the upper section, the concentration of soil nitrogen and organic carbon was significantly greater in the top10 cm of the undisturbed soil than in the skidroad running surface, but not in the lower section. In the lowersection at depth 10-20 cm, the berm had significantly greater concentrations of these elements than inundisturbed soil.
Soil moisture retention was adversely affected by the skidroad construction, with mid-summer volumetricmoisture significantly less in the outer track, berm and sidecast of the upper section, and in the berm of thelower section than in undisturbed soil. Some inferior soil characteristics were reflected in the significantlypoorer survival of both lodgepole pine and Douglas-fir planted on berms in the upper section and of lodgepolepine in the lower section. This is attributed to low water retention in these loose, moisture shedding substratesand to competition with the seeded grasses and legumes. Poor survival on deposits relative to more compactedsurfaces such as tracks have been reported for lodgepole pine and Douglas-fir on stump removal deposits(Smith and Wass 1994b), and for Douglas-fir on skidroad sidecast (Smith and Wass 1994a). In contrast, oncompacted tracks subject to seasonal water saturation, survival rates for Douglas-fir and lodgepole pine weresignificantly less than in more convex and less dense rakes and scalps (Smith and Wass 1991).
Despite the several indications of degraded soils on skidroads, the size of lodgepole pine was not significantlydifferent on undisturbed and disturbed soil categories for either the upper or lower sections. For Douglas-firgrowing on the berm, mean tree sizes after 10 years were significantly greater than those for undisturbed soil inthree of six comparisons.
In the upper section, height of Douglas-fir was significantly greater on undisturbed soil below the skidroadsthan above. This can be explained at least partially by lower soil water content in the upper position. The lowvigor of trees here corresponded to nutrient concentrations of Douglas-fir foliage, which ranked lowest for treesgrowing in both undisturbed categories and ranked especially low for lodgepole pine growing in the upperundisturbed position. The concentration of N in foliage of Douglas-fir from the upper undisturbed soil wassignificantly less than in foliage from trees on the sidecast, and P was significantly less in the upper undisturbedsoil than in the inner tracks.

17
The artificial seeding of grasses and legumes on the skidroads had a strong effect on vegetation cover andcomposition. Only seeded species were recorded in more than 40% of subplots on skidroad surfaces over the 4years of measurements. On the berm and sidecast in the upper section and the berm in the lower section, plantspecies other than those seeded were recorded frequently, but overall cover was still increased appreciably bythe seeding, especially on the berm of the upper section. The seeding obviously contributed to the highpercentage dissimilarity values calculated in comparisons of plant cover and composition between disturbedand undisturbed surfaces. The very high cover of seeded species on berms in the upper section also likelycontributed to the low seedling survival rates here. Whether the establishment of seeded legumes affected treenutrition and growth can not be determined. In work with Alsike clover, Trowbridge and Holl (1992) found thatlodgepole pine height growth 4 years after outplanting was slightly less on clover-seeded plots than these of thecontrol plots, and tree diameter was not significantly different. They also reported that lodgepole pineassociated with Alsike clover had significantly greater needle mass and foliar N levels. In our study, Nconcentrations were generally higher in the foliage of trees growing in disturbed than in undisturbed soil
In the most recent site sensitivity keys (British Columbia Ministry of Forests and B.C. Ministry ofEnvironment, Lands and Parks 1995), the study site would be assessed as low to moderate hazard for soilcompaction and puddling. This corresponds to a lack of adverse growth effects found in our study. However, ahigh forest floor displacement hazard rating coupled with the severity of soil displacement should have resultedin severe adverse growth effects. That it did not may be due to elimination of potentially competing residualvegetation on the disturbed soil on this sub-mesic site and, as noted earlier, some growth benefit resulting fromthe presence of seeded nitrogen-fixing plants almost solely on disturbed soil. Using a simpler rating systemgeared solely to effects on tree growth potential (Smith and Wass 1980), the study site would be assessed asposing no problems in terms of growth rates of trees established on skidroads and even some growthenhancement. Not measured, however, was the observed slumping and ravelling of cutbanks in the steep uppersection, with the probability of loss in overall site productivity.
Further measurements at 15 and 20 years would reveal whether the relatively small effects of skidroadconstruction and use on tree growth over the first 10 years will continue. It is possible that increased vegetativeand tree-to-tree competition and reduced cover of seeded nitrogen-fixing plants will result in relatively slowergrowth rates on disturbed soil. There is also an opportunity to re-measure soil chemical and physical properties,foliage nutrient contents, and plant species and cover to compare with initial values.

18

19
6.0 References
Agriculture Canada Expert Committee on Soil Survey. 1987. The Canadian system of soil classification. 2nd ed.Agric. Can. Publ. 1646. 164 p.
Ballard, T.M. 1981. Foliar analysis research. Faculty of Forestry, U.B.C. Vancouver, B.C.
Ballard, T.M.; Carter, R.E. 1986. Evaluating forest stand nutrient status. B.C. Min. For., Victoria, B.C. LandManage. Rep. 20. 60 p.
Blake, G. R. 1965. Bulk density. Pages 374-390 in C.A. Black, ed., Methods of soil analysis. Agronomy 9, Am.Soc. Agron., Madison, Wisc.
Bloomberg, W.J.; Cumberbirch, P.M.; Wallis, G.W. 1980. A ground survey method for estimating loss causedby Phellinus weirii root rot. II.: Survey procedures and data analysis. Can. For. Serv. Pac. For. Res. Cent.Victoria, B.C. Inf. Rep. BC-R-4, 44 p.
British Columbia Ministry of Forests and B.C. Ministry of Environment, Lands and Parks. 1995. Hazardassessment keys for evaluating site sensitivity to soil degrading processes. Forest Practices CodeGuidebook 29. 24 p.
Heilman, P. 1981. Root penetration of Douglas-fir seedlings into compacted soil. For. Sci. 27(4):660-666.
Homoky, S. 1994. The influence of slope geometry on skidroad design. B.C. Min. For. Victoria, B.C. Land.Manage. Rep. 87. 55 p.
Klinka, K.; Green, R.N.; Trowbridge, R.L.; Lowe, L.E. 1981. Taxonomic classification of humus forms inecosystems of British Columbia. First Approximation. B.C. Min. For. Victoria, B.C. Land Manage. Rep. 8. 54 p.
Lindgren, O.; Orlander, G. 1978. A study on root development and stability of 6 to 7 year-old container plants.Pages 142-144 in E. Van Eerden and J. M. Kinghorn, eds. Proc. of the Root Form of Planted Trees Symp.May 16-19, 1978, Victoria, B.C. B.C. Min. For./Can. For. Serv. Joint Rep. No. 8.
Lloyd, D.; Angove, K.; Hope, G; Thompson, C. 1990. A guide to site identification and interpretation for theKamloops Forest Region. B.C. Min. For. Victoria, B.C. Land Manage. Handbk. 23. 399 p.
Lousier, J.D. 1990. Impacts of forest harvesting and regeneration on forest sites. B.C. Min. For. Victoria, B.C.Land Manage. Rep. 67. 92 p.
McKeague, J.A., ed. 1978. Manual on soil sampling and methods of analysis. 2nd ed. Rep. prepared by CanadaSoil Survey Committee, Subcommittee on Methods of Analysis. Ottawa, Ont. 212 p.
McMullan, E.E. 1971. Methods of analyses. Soils-Biochemistry Laboratory Service. Can. Dep. Fish. and For.Inf. Rep. BC-X-50. 49 p.
Minore, D.; Smith, C.E.; Woollard, R.F. 1969. Effects of high soil density on seedling root growth of sevennorthwestern tree species. USDA For. Serv. Res. Note. PNW-112, 6 p.
Parkinson, J.A.; Allen, S.E. 1975. A wet oxidation procedure suitable for the determination of nitrogen andmineral nutrients in biological matter. Comm. Soil Sci. Plant Anal. 6:1-11.

20
Pielou, E.C. 1984. The interpretation of ecological data. A primer on classification and ordination. John Wileyand sons, Toronto. 263 p.
SAS Institute Inc. 1985. SAS user’s guide. Statistics, Version 5 Edition. SAS Institute Inc., Cary, N.C. 956 p.
Smith, R.B.; Wass, E.F. 1976. Soil disturbance, vegetative cover and regeneration on clearcuts in the Nelson ForestDistrict, British Columbia. Can. For. Serv. Pac. For. Res. Cent. Victoria, B.C. Inf. Rep. BC-X-151. 37 p.
Smith, R.B.; Wass, E.F. 1979. Tree growth on and adjacent to contour skidroads in the subalpine zone,southeastern British Columbia. Can. For. Serv. Pac. For. Res. Cent. Victoria, B.C. Inf. Rep. BC-R-2. 26 p.
Smith, R.B.; Wass, E.F. 1980. Tree growth on skidroads on steep slopes logged after wildfires in central andsoutheastern British Columbia. Can. For. Serv. Pac. For. Res. Cent. Victoria, B.C. Inf. Rep. BC-R-6. 28 p.
Smith, R.B.; Wass, E.F. 1991. Impacts of two stumping operations on site productivity in interior BritishColumbia. For. Can. Pac. For. Cent. Victoria, B.C. Inf. Rep. BC-X-327. 43 p.
Smith, R.B.; Wass, E.F. 1994a. Impacts of skidroads on properties of a calcareous, loamy soil and on plantedseedling performance. Can. For. Serv. Pac. For. Cent. Victoria, B.C. Inf. Rep. BC-X-346. 26 p.
Smith, R.B.; Wass, E.F. 1994b. Impacts of a stump uprooting operation on properties of a calcareous loamysoil and on planted seedling performance. Can. For. Serv. Pac. For. Cent. Victoria, B.C. Inf. Rep. BC-X-344. 19 p.
Topp, G.C.; Davis, J.L.; Bailey, W.G.; Zebchuk, W.D. 1984. The measurement of soil water content using aportable TDR handprobe. Can. J. Soil Sci. 64:313-321.
Trowbridge, R.; Holl, F.B. 1992. Early growth of lodgepole pine after establishment of alsike clover-Rhizobiumnitrogen-fixing symbiosis. Can. J. For. Res. 22: 1089-1093.
Utzig, G.F.; Walmsley, M.E. 1988. Evaluation of soil degradation as a factor affecting forest productivity inBritish Columbia. A problem analysis. Phase I. B.C. Min. For. And Can. For. Serv., FRDA Rep. 025. 111p + appendices.
Walmsley, M.; Utzig, G.; Vold, T.; Moon, D.; van Barneveld, J., eds. 1980. Describing ecosystems in the field.B.C. Min. Environ. and Min. For. Victoria, B.C. RAB Tech. Pap. 2, Land Manage. Rep. 7. 225 p.
Wass, E.F.; Smith, R.B. 1994. Impacts of soil disturbance on root systems of Douglas-fir and lodgepole pineseedlings. Natural Resources Canada, Can. For. Serv. Pac. For. Cent. Victoria, B.C. Inf. Rep. BC-X-348. 22 p.

21
Table 1. Categories and depths of soil disturbance in the skidded site versus an unlogged standbordering the cutblock
Depth of soil disturbance
Treatment Disturbance None Shallow Deep Very deepcategory <5 cm 5-25 cm > 25 cm Total
--------------------------------------------- % -----------------------------------------
Uncut Undist 86 0 0 0 86Undist (NL) 14 0 0 0 14Total 100 0 0 0 100
Logged Undist 55 0 0 0 55Skidroad 0 0 10 29 39Non-road dist. 0 0 2 0 2Skidtrails 0 0 3 1 4Total 55 0 15 30 100
Undist=undisturbed; dist=disturbance; NL=Natural log
Table 2. Mean bulk density (Mg/m3) of total and fine soil fractions for two disturbance categories plusthe undisturbed mineral soil at two depths
Depth
Number of Total bulk density Fine bulk densitySection Disturbance samples 0-10 cm 10-20 cm 0-10 cm 10-20 cm
Upper Undisturbed 8 1.41 b* 1.52 b 0.95 a 0.94 bBerm 8 1.68 a 1.64 b 0.96 a 0.91 bSkidroad surface 8 1.74 a 1.93 a 1.03 a 1.17 a
Lower Undisturbed 8 1.30 b 1.35 b 0.99 b 1.04 abBerm 8 1.28 b 1.23 b 0.89 b 0.86 bSkidroad surface 8 1.65 a 1.79 a 1.20 a 1.19 a
* Means within columns and sections followed by the same letter are not significantly different at the 0.05 level.

22
Table 3. Coarse fragment content of bulk density samples
Disturbance Number of Percent coarse fragment contentSection category samples 0-10 cm 10-20 cm
Upper Undisturbed 8 50 b* 58 aSkidroad surface 8 67 a 71 aBerm 8 67 a 67 a
Lower Undisturbed 8 37 a 35 bSkidroad surface 8 50 a 60 aBerm 8 46 a 46 b
* Means within columns and sections followed by the same letter are not significantly different at the 0.05 level.
Table 4. Chemical characteristics of bulk density samples
Organic TotalDepth Disturbance carbon nitrogen C:N
Section (cm) category (%) (%) ratio pH
Upper 0-10 Undisturbed 1.90 a* 0.08 a 25.5 a 5.50 aSkidroad surface 0.87 b 0.04 b 22.7 a 5.50 aBerm 1.56 ab 0.06 ab 24.8 a 5.54 a
10-20 Undisturbed 1.11 ab 0.04 a 26.2 a 4.71 aSkidroad surface 0.65 b 0.04 a 21.8 a 5.62 aBerm 1.42 a 0.06 a 27.2 a 5.53 a
Lower 0-10 Undisturbed 1.32 a 0.05 a 25.1 a 5.30 aSkidroad surface 1.14 a 0.05 a 20.3 a 5.33 aBerm 1.97 a 0.07 a 28.0 a 5.36 a
10-20 Undisturbed 1.01 b 0.05 b 23.9 a 5.33 aSkidroad surface 1.13 b 0.04 b 21.9 a 5.18 aBerm 2.11 a 0.07 a 29.1 a 5.37 a
* Means within columns, section and depth classes followed by the same letter are not significantly different atthe 0.05 level.

23
Table 5. Mean mid-summer volumetric soil water content (upper 20 cm) for six disturbance categories,upper section
Disturbance categories
Upper Inner Outer LowerSpecies undisturbed track track Berm Sidecast Undisturbed
---------------------------------------------------- % ------------------------------------------------
Lodgepole pine 5.3 b* 4.9 b 3.3 c 2.5 c 2.5 c 6.7 a
Douglas-fir 6.1 a 4.4 a 3.6 a 3.0 a 3.1 a 6.0 a
Average 5.7 ab 4.6 b 3.4 c 2.8 c 2.9 c 6.4 a
* Means within rows having the same letter are not significantly different at the 0.05 level.
Table 6. Mean mid-summer volumetric soil water content (upper 20 cm) for three disturbancecategories, lower section
Disturbance categories
Species Undisturbed Skidroad surface Berm
---------------------------------------------------- % ------------------------------------------------
Lodgepole pine 8.6 a* 9.1 a 6.2 a
Douglas-fir 9.6 a 8.0 ab 6.0 b
Average 9.1 a 8.6 a 6.1 b
* Means within rows having the same letter are not significantly different at the 0.05 level.

24
Table 7. Survival rates of Douglas-fir and lodgepole pine seedlings planted on skidroad soil disturbancecategories and undisturbed ground after five growing seasons
Douglas-fir Lodgepole pine
Section Disturbance No. of trees Survival-(%) No. of trees Survival-(%)
Upper Upper undisturbed 97 76 ab* 98 89 aInner track 95 86 a 96 95 aOuter track 95 73 b 94 88 aBerm 95 43 c 94 75 bSidecast 94 70 b 95 88 aLower undisturbed 93 81 ab 91 91 a
Lower Undisturbed 190 85 a 185 89 aBerm 190 82 a 190 80 bSkidroad surface 190 89 a 190 93 a
* Means within columns and sections followed by the same letter are not significantly different at the 0.05 level.
Table 8. Mean heights and ground-level diameters of lodgepole pine seedlings for disturbance categoriesand undisturbed mineral soil (upper section)
Years after Disturbance Number of Height Diameterplanting category trees (cm) (mm)
5 Upper undisturbed 87 109 a* 23.2 aInner track 91 103 a 22.3 aOuter track 83 103 a 22.1 aBerm 70 102 a 22.9 aSidecast 84 106 a 21.3 aLower undisturbed 83 114 a 22.2 a
10 Upper undisturbed 42 335 a 67 aInner track 28 365 a 71 aOuter track 29 359 a 74 aBerm 32 343 a 68 aSidecast 26 338 a 69 aLower undisturbed 38 363 a 67 a
*Means within columns and years followed by the same letter are not significantly different at the 0.05 level.

25
Table 9. Mean heights and ground-level diameters of Douglas-fir seedlings for disturbance categoriesand undisturbed mineral soil (upper section)
Years after Disturbance Number of Height Diameterplanting category trees (cm) (mm)
5 Upper undisturbed 74 58 ab* 15.0 aInner track 82 52 b 14.1 aOuter track 69 58 ab 15.0 aBerm 41 68 ab 17.6 aSidecast 66 62 ab 15.2 aLower undisturbed 75 70 a 16.7 a
10 Upper undisturbed 38 150 c 35 bInner track 25 166 bc 37 bOuter track 30 201 ab 45 bBerm 14 227 a 54 aSidecast 29 198 ab 40 bLower undisturbed 37 194 ab 40 b
*Means within columns and years followed by the same letter are not significantly different at the 0.05 level.
Table 10. Mean heights and ground-level diameters of lodgepole pine seedlings for disturbancecategories and undisturbed mineral soil (lower section)
Years after Disturbance Number of Height Diameterplanting category trees (cm) (mm)
5 Undisturbed 165 142 a* 29.8 aBerm 152 139 a 31.3 aSkidroad surface 177 131 a 29.3 a
10 Undisturbed 79 381 a 81 aBerm 57 410 a 89 aSkidroad surface 57 398 a 80 a
*Means within columns and years followed by the same letter are not significantly different at the 0.05 level.
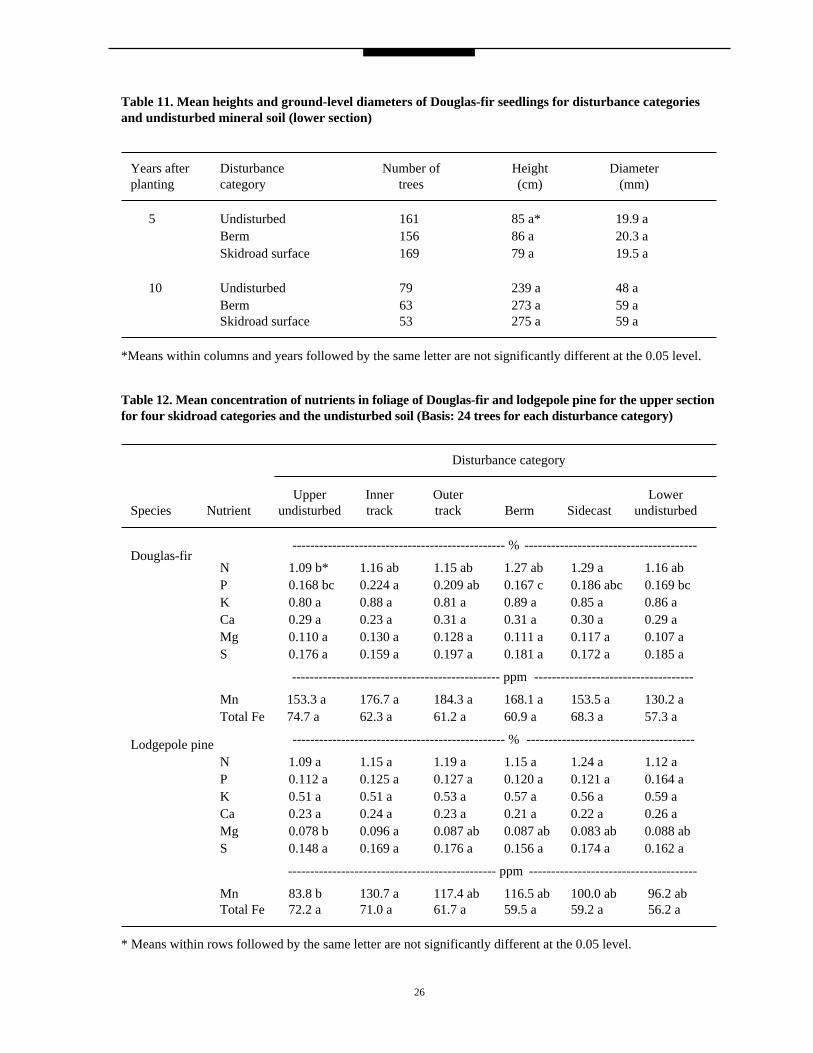
Table 11. Mean heights and ground-level diameters of Douglas-fir seedlings for disturbance categoriesand undisturbed mineral soil (lower section)
Years after Disturbance Number of Height Diameterplanting category trees (cm) (mm)
5 Undisturbed 161 85 a* 19.9 aBerm 156 86 a 20.3 aSkidroad surface 169 79 a 19.5 a
10 Undisturbed 79 239 a 48 aBerm 63 273 a 59 aSkidroad surface 53 275 a 59 a
*Means within columns and years followed by the same letter are not significantly different at the 0.05 level.
Table 12. Mean concentration of nutrients in foliage of Douglas-fir and lodgepole pine for the upper sectionfor four skidroad categories and the undisturbed soil (Basis: 24 trees for each disturbance category)
Disturbance category
Upper Inner Outer LowerSpecies Nutrient undisturbed track track Berm Sidecast undisturbed
Douglas-fir------------------------------------------------ % ---------------------------------------
N 1.09 b* 1.16 ab 1.15 ab 1.27 ab 1.29 a 1.16 abP 0.168 bc 0.224 a 0.209 ab 0.167 c 0.186 abc 0.169 bcK 0.80 a 0.88 a 0.81 a 0.89 a 0.85 a 0.86 aCa 0.29 a 0.23 a 0.31 a 0.31 a 0.30 a 0.29 aMg 0.110 a 0.130 a 0.128 a 0.111 a 0.117 a 0.107 aS 0.176 a 0.159 a 0.197 a 0.181 a 0.172 a 0.185 a
----------------------------------------------- ppm ------------------------------------
Mn 153.3 a 176.7 a 184.3 a 168.1 a 153.5 a 130.2 aTotal Fe 74.7 a 62.3 a 61.2 a 60.9 a 68.3 a 57.3 a
Lodgepole pine ------------------------------------------------ % --------------------------------------
N 1.09 a 1.15 a 1.19 a 1.15 a 1.24 a 1.12 aP 0.112 a 0.125 a 0.127 a 0.120 a 0.121 a 0.164 aK 0.51 a 0.51 a 0.53 a 0.57 a 0.56 a 0.59 aCa 0.23 a 0.24 a 0.23 a 0.21 a 0.22 a 0.26 aMg 0.078 b 0.096 a 0.087 ab 0.087 ab 0.083 ab 0.088 abS 0.148 a 0.169 a 0.176 a 0.156 a 0.174 a 0.162 a
----------------------------------------------- ppm --------------------------------------
Mn 83.8 b 130.7 a 117.4 ab 116.5 ab 100.0 ab 96.2 abTotal Fe 72.2 a 71.0 a 61.7 a 59.5 a 59.2 a 56.2 a
* Means within rows followed by the same letter are not significantly different at the 0.05 level.
26

27
Table 13. Mean concentration of nutrients in foliage of Douglas-fir and lodgepole pine for the lower sectionfor two skidroad categories and the undisturbed soil (Basis: 24 trees for each disturbance category)
Disturbance category
Species Nutrient Undisturbed Berm Skidroad surface
Douglas-fir ---------------------------------------------------------- % ------------------------------------------
N 1.13 a* 1.19a 1.17 aP 0.178 b 0.191 ab 0.235 aK 0.83 a 0.83 a 0.86 aCa 0.31 a 0.33 a 0.34 aMg 0.106 a 0.119 a 0.136 aS 0.178 a 0.178 a 0.169 a
-------------------------------------------------------- ppm ----------------------------------------
Mn 158.4 b 214.2 a 242.6 aTotal Fe 75.3 a 80.3 a 65.5 a
Lodgepole pine -------------------------------------------------------- % -------------------------------------------
N 1.11 a 1.11 a 1.25 aP 0.121 a 0.123 a 0.132 aK 0.55 a 0.56 a 0.58 aCa 0.25 a 0.23 a 0.21 aMg 0.084 a 0.087 a 0.088 aS 0.162 a 0.159 a 0.183 a
-------------------------------------------------------- ppm ----------------------------------------
Mn 107.1 a 105.0 a 122.2 aTotal Fe 74.0 a 70.8 a 90.2 a
* Means within rows followed by the same letter are not significantly different at the 0.05 level.

28
Table 14. Average dissimilarity indices (%) for the upper section based on average vegetation compositionand cover over 4 years (1985-1988) for disturbance category comparisons (Basis: 20 subplots for bermand sidecast, 11 for inner track, 9 for outer track, and 5 for upper and lower undisturbed categories)
Upper Lower Inner OuterUnlogged undisturbed undisturbed track track Berm Sidecast
Unlogged 0 98 97 100 100 100 99
Upperundisturbed 0 44 94 93 72 53
Lowerundisturbed 0 95 95 73 56
Innertrack 0 38 55 67
Outertrack 0 27 72
Berm 0 46
Sidecast 0
Table 15. Average frequency (%) and cover (%) of plants (1985-1988) present in more than 40% ofsampled plots, upper section
Undisturbed Berm Sidecast Skidroad surface
Species Freq. Cover Freq. Cover Freq. Cover Freq. Cover
Amelanchier alnifolia 75 4 - - - - - -Linnaea borealis 63 3 - - - - - -Paxistima myrsinites 73 1 - - - - - -Rosa nutkana 68 5 63 5 76 7 - -Spiraea betulifolia 90 7 80 4 99 5 - -Epilobium minutum 55 1 56 1 73 2 - -Berberis aquifolium 80 2 - - - - - -Carex rossii 58 2 - - 65 2 - -Calamagrostis rubescens 98 11 - - 60 2 - -Festuca rubra* - - 53 19 41 4 49 13Trifolium hybridum* - - 76 5 - - 93 4Festuca occidentalis* - - 48 13 - - 50 9Trifolium pratense* - - 45 2 - - 89 5
* Operationally seeded

29
Table 16. Average dissimilarity indices (%) for the lower section based on vegetation composition andcover over 4 years (1985-1988) for disturbance category comparisons (Basis: 20 subplots for berm, 20 forskidroad surface, and 5 for upper and lower undisturbed categories)
Unlogged Undisturbed Skidroad surface Berm
Unlogged 0 97 100 99
Undisturbed 0 80 44
Skidroad surface 0 52
Berm 0
Table 17. Average frequency (%) and cover (%) of plants (1985-1988) present in more than 40% ofsampled plots, lower section
Undisturbed Skidroad berm Skidroad surface
Species Frequency Cover Frequency Cover Frequency Cover
Amelanchier alnifolia 65 3 - - - -
Linnaea borealis 42 1 - - - -
Paxistima myrsinites 73 2 - - - -
Rosa nutkana 48 4 43 3 - -
Shepherdia canadensis 75 6 - - - -
Spiraea betulifolia 92 10 89 8 60 2
Epilobium minutum 58 1 53 1 - -
Berberis aquifolium 68 2 - - - -
Carex rossii 48 2 60 2 - -
Ceanothus sanguineus 46 1 54 1 47 1
Oryzopsis asperifolia 48 1 - - - -
Festuca rubra*. - - - - 45 11
Trifolium hybridum* - - 58 5 98 6
Festuca occidentalis* - - - - 53 7
Trifolium pratense* - - - - 77 5
Epilobium angustifolium - - 46 2 - -Calamagrostis rubescens - - 61 5 - -
* Operationally seeded
30
Table 18. General tree root parameters from upper section (in mm)
Disturbance category
Upper Inner Outer LowerParameter undisturbed track track Berm Sidecast undisturbed
------------------------------------------ Lodgepole pine --------------------------------------
Ground level diameter 27 a* 25 a 25 a 27 a 25 a 28 aSolid wood length 49 b 64 ab 73 ab 80 a 68 ab 67 abSolid wood width 37 a 30 a 31 a 33 a 31 a 35 aRoot depth 277 abc 252 bc 245 c 309 ab 317 a 272 abc
-------------------------------------------- Douglas-fir -----------------------------------------
Ground level diameter 16 ab 15 b 16 ab 18 ab 17 ab 19 aSolid wood length 65 a 58 a 59 a 77 a 69 a 70 aSolid wood width 18 ab 15 b 16 b 19 ab 18 ab 22 aRoot depth 214 ab 194 b 196 b 283 a 254 ab 228 ab
* Means within rows having the same letter are not significantly different at the 0.05 level.
Table 19. Mean root areas (mm2) for excavated trees from the upper section
Disturbance category
Layer Upper Inner Outer Lowerundisturbed track track Berm Sidecast undisturbed
------------------------------------------ Lodgepole pine --------------------------------------
0-10 cm 437 a* 437 a 469 a 613 a 545 a 604 a10-20 cm 455 b 426 b 517 b 807 a 685 ab 648 ab20-30 cm 57 a 35 a 39 a 108 a 86 a 54 a30-40 cm 2 c 2 c 2 c 23 a 18 ab 5 bcTotal 265 a 250 a 348 a 345 a 303 a 240 a
-------------------------------------------- Douglas-fir -----------------------------------------
0-10 cm 126 ab 80 b 94 b 247 a 195 ab 193 ab10-20 cm 127 ab 85 b 99 b 317 a 240 ab 224 ab20-30 cm 10 b 2 b 7 b 55 a 24 b 13 b30-40 cm 1 a 0 a 1 a 8 a 7 a 0 aTotal 90 a 76 a 91 a 130 a 168 a 182 a
* Means within rows having the same letter are not significantly different at the 0.05 level.
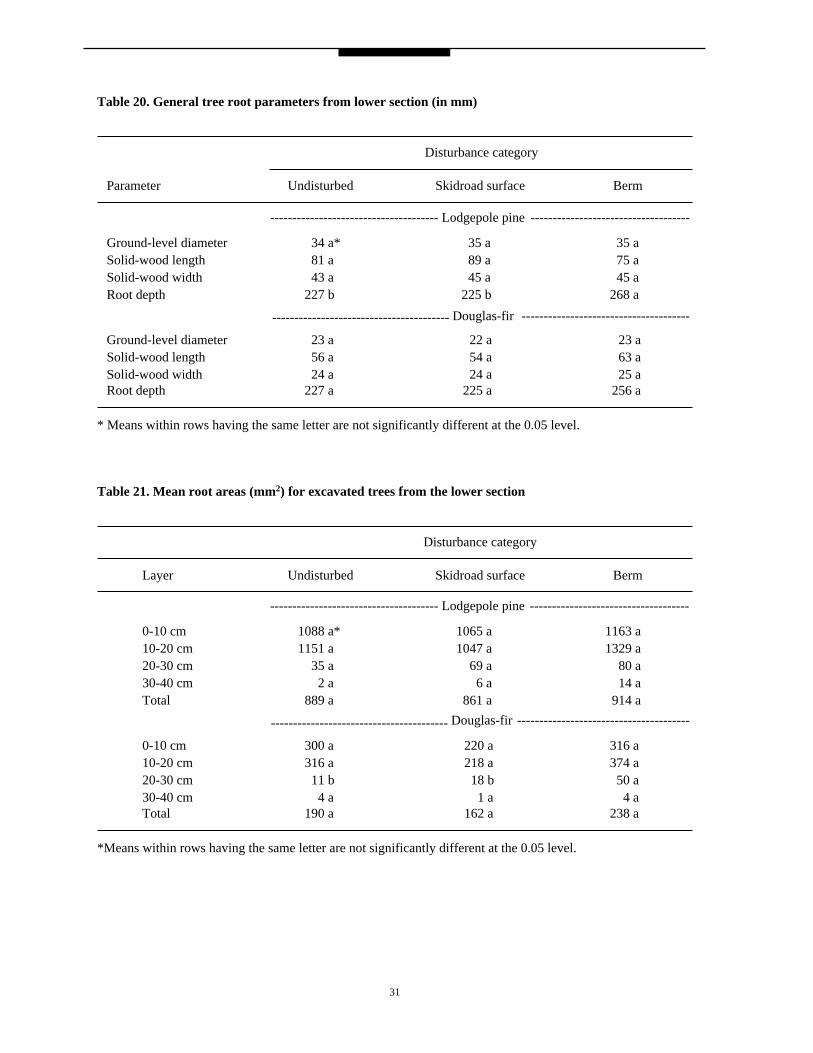
31
Table 20. General tree root parameters from lower section (in mm)
Disturbance category
Parameter Undisturbed Skidroad surface Berm
-------------------------------------- Lodgepole pine ------------------------------------
Ground-level diameter 34 a* 35 a 35 aSolid-wood length 81 a 89 a 75 aSolid-wood width 43 a 45 a 45 aRoot depth 227 b 225 b 268 a
---------------------------------------- Douglas-fir --------------------------------------
Ground-level diameter 23 a 22 a 23 aSolid-wood length 56 a 54 a 63 aSolid-wood width 24 a 24 a 25 aRoot depth 227 a 225 a 256 a
* Means within rows having the same letter are not significantly different at the 0.05 level.
Table 21. Mean root areas (mm2) for excavated trees from the lower section
Disturbance category
Layer Undisturbed Skidroad surface Berm
-------------------------------------- Lodgepole pine ------------------------------------
0-10 cm 1088 a* 1065 a 1163 a10-20 cm 1151 a 1047 a 1329 a20-30 cm 35 a 69 a 80 a30-40 cm 2 a 6 a 14 aTotal 889 a 861 a 914 a
---------------------------------------- Douglas-fir ---------------------------------------
0-10 cm 300 a 220 a 316 a10-20 cm 316 a 218 a 374 a20-30 cm 11 b 18 b 50 a30-40 cm 4 a 1 a 4 aTotal 190 a 162 a 238 a
*Means within rows having the same letter are not significantly different at the 0.05 level.

32
Appendix 1. By-species ANOVA table
Source of Variation df Error
Plot, P p-1
Row(Plot), R(P) (ri –1)
Disturbance, D d-1 PxD (for balanced case)*
PxD (p-1) x (d-1)
DxR(P) by subtraction**
Trees(DxRxP) (tijk–1)
Total n-1
* linear combination of PxD, DxR(P), and Tree (DxRxP) for unbalanced case.** Degrees of freedom for DxR(P) are by substraction
n=total sample size.p=number of plots.d=number of disturbance categories.ri=number of rows with at least one tree in plot i.
dij=number of disturbance categories with at least one tree in row j of plot i.
tijk=number of trees located in disturbance class k of row j in plot i.
( ) ( ) ( ) ( ) ( ) ( ) ( ).n p r d p d ti ijkk
d
j
r
i
p
i
p iji
− − − − − − − − − ↔ − − −====
����1 1 1 1 1 1 11111
Σp
i=1Σj=1
Σdijri
k=1
Σp
i=1
Σp
i=1Σ
p
i=1Σj=1
ri
Σp
=1Σj=1
Σdijri
k=1¾ (

33
Appendix 2. Analysis of variance for parameters for the upper section by disturbance category
Df
Parameter Num. Denom. MS F PR>F
Total bulk density0-10 cm 2 6 25x10-2 47.93 0.000210-20 cm 2 6 36x10-2 26.73 0.0010
Fine bulk density0-10 cm 2 6 16x10-3 1.13 0.384110-20 cm 2 6 16x10-2 15.44 0.0043
Coarse fragment content0-10 cm 2 6 8x10⁻² 12.11 0.007810-20 cm 2 6 4x10⁻² 4.37 0.0674
Resistance to penetration0.0 cm 2 6 1141 10.10 0.01202.5 2 6 5955 13.14 0.00645.0 2 6 6787 10.18 0.01187.5 2 6 17262 12.58 0.007110.0 2 6 44208 61.89 0.000112.5 2 6.04 72286 17.34 0.003115.0 2 6.03 121277 7.84 0.021017.5 2 6.04 191565 9.60 0.013320.0 2 6.05 260467 11.83 0.0007
Soil chemistry0-10 cm
Organic carbon 2 6 2 4.91 0.0546Total nitrogen 2 6 3x10⁻³ 5.02 0.0523C/N 2 6 17 0.44 0.6649pH 2 6 4x10⁻³ 0.48 0.6391
10-20 cmOrganic carbon 2 6 1 6.39 0.0326Total nitrogen 2 6 8x10⁻⁴ 2.07 0.2071C/N 2 6 68 0.64 0.5600pH 2 6 2 1.78 0.2478
Soil MoistureLodgepole pine 5 2.99 8x10⁻³ 48.89 0.0046Douglas-fir 5 3.72 6x10⁻³ 5.60 0.0675Combined 5 3.46 1x10⁻² 35.33 0.0040
Lodgepole pine5-year tree growth
Height 5 15.17 1857 1.24 0.3402Diameter 5 15.15 33 0.36 0.8645
MS=mean squareF=MS(treatment)/MS(error)PR>F=probability value of F-ratio
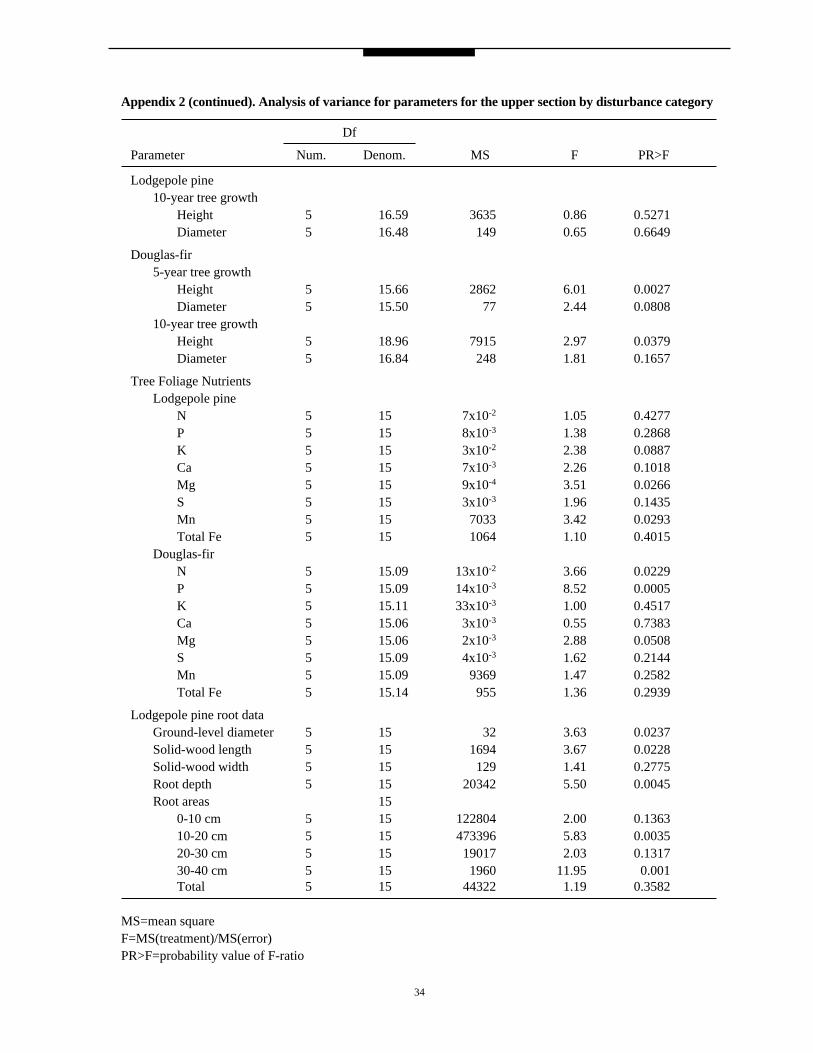
34
Appendix 2 (continued). Analysis of variance for parameters for the upper section by disturbance category
Df
Parameter Num. Denom. MS F PR>F
Lodgepole pine10-year tree growth
Height 5 16.59 3635 0.86 0.5271Diameter 5 16.48 149 0.65 0.6649
Douglas-fir5-year tree growth
Height 5 15.66 2862 6.01 0.0027Diameter 5 15.50 77 2.44 0.0808
10-year tree growthHeight 5 18.96 7915 2.97 0.0379Diameter 5 16.84 248 1.81 0.1657
Tree Foliage NutrientsLodgepole pine
N 5 15 7x10⁻² 1.05 0.4277P 5 15 8x10⁻³ 1.38 0.2868K 5 15 3x10⁻² 2.38 0.0887Ca 5 15 7x10⁻³ 2.26 0.1018Mg 5 15 9x10⁻⁴ 3.51 0.0266S 5 15 3x10⁻³ 1.96 0.1435Mn 5 15 7033 3.42 0.0293Total Fe 5 15 1064 1.10 0.4015
Douglas-firN 5 15.09 13x10-2 3.66 0.0229P 5 15.09 14x10-3 8.52 0.0005K 5 15.11 33x10-3 1.00 0.4517Ca 5 15.06 3x10⁻³ 0.55 0.7383Mg 5 15.06 2x10⁻³ 2.88 0.0508S 5 15.09 4x10⁻³ 1.62 0.2144Mn 5 15.09 9369 1.47 0.2582Total Fe 5 15.14 955 1.36 0.2939
Lodgepole pine root dataGround-level diameter 5 15 32 3.63 0.0237Solid-wood length 5 15 1694 3.67 0.0228Solid-wood width 5 15 129 1.41 0.2775Root depth 5 15 20342 5.50 0.0045Root areas 15
0-10 cm 5 15 122804 2.00 0.136310-20 cm 5 15 473396 5.83 0.003520-30 cm 5 15 19017 2.03 0.131730-40 cm 5 15 1960 11.95 0.001Total 5 15 44322 1.19 0.3582
MS=mean squareF=MS(treatment)/MS(error)PR>F=probability value of F-ratio
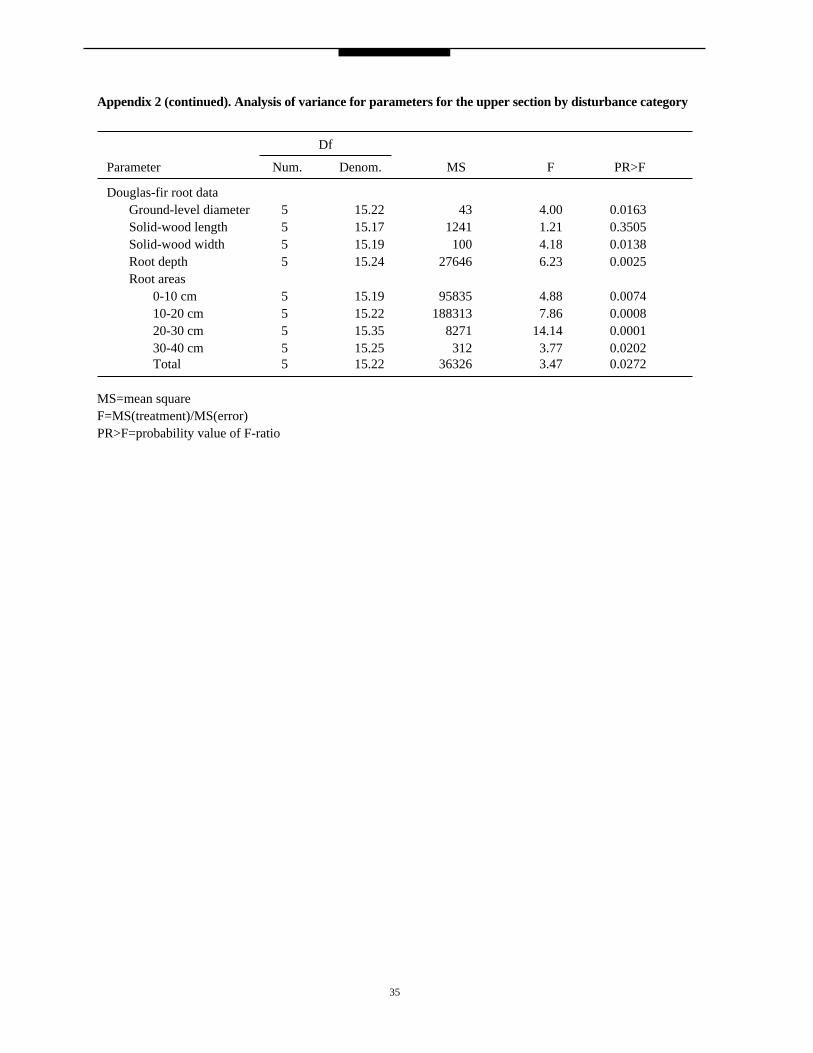
35
Appendix 2 (continued). Analysis of variance for parameters for the upper section by disturbance category
Df
Parameter Num. Denom. MS F PR>F
Douglas-fir root dataGround-level diameter 5 15.22 43 4.00 0.0163Solid-wood length 5 15.17 1241 1.21 0.3505Solid-wood width 5 15.19 100 4.18 0.0138Root depth 5 15.24 27646 6.23 0.0025Root areas
0-10 cm 5 15.19 95835 4.88 0.007410-20 cm 5 15.22 188313 7.86 0.000820-30 cm 5 15.35 8271 14.14 0.000130-40 cm 5 15.25 312 3.77 0.0202Total 5 15.22 36326 3.47 0.0272
MS=mean squareF=MS(treatment)/MS(error)PR>F=probability value of F-ratio

36
Appendix 3. Analysis of variance for parameters for the lower section by disturbance category
Df
Parameter Num. Denom. MS F PR>F
Total bulk density0-10 cm 2 6 35x10-2 5.61 0.042310-20 cm 2 6 69x10-2 28.26 0.0009
Fine bulk density0-10 cm 2 6 20x10-2 12.57 0.007110-20 cm 2 6 22x10-2 6.95 0.0274
Coarse fragment content0-10 cm 2 6 4x10⁻² 1.80 0.243610-20 cm 2 6 13x10-2 9.59 0.0135
Resistance to penetration0.0 cm 2 6 1349 36.64 0.00042.5 2 6 22851 10.63 0.01075.0 2 6 45802 14.76 0.00487.5 2 6 76424 21.25 0.001910.0 2 6 147367 37.44 0.000412.5 2 6.01 180508 21.38 0.001915.0 2 6.03 189785 31.67 0.000617.5 2 6.03 329159 32.14 0.000620.0 2 4.03 242178 22.93 0.0063
Soil chemistry0-10 cm
Organic carbon 2 6 1 3.34 0.1059Total nitrogen 2 6 9x10⁻⁴ 3.35 0.1053C/N 2 6 121 3.69 0.0901pH 2 6 5x10⁻³ 0.05 0.9488
10-20 cmOrganic carbon 2 6 3 6.10 0.0358Total nitrogen 2 6 2x10⁻³ 7.01 0.0269C/N 2 6 111 1.66 0.2660pH 2 6 8x10⁻² 0.44 0.6626
Soil MoistureLodgepole pine 2 6 10x10-3 5.51 0.0438Douglas-fir 2 6 15x10-3 6.50 0.0314Combined 2 6 24x10-3 15.63 0.0042
Lodgepole pine5-year tree growth
Height 2 6.02 5475 2.09 0.2044Diameter 2 6.02 176 1.48 0.3009
MS=mean squareF=MS(treatment)/MS(error)PR>F=probability value of F-ratio

37
Appendix 3 (continued). Analysis of variance for parameters for the lower section by disturbance category
Df
Parameter Num. Denom. MS F PR>F
Lodgepole pine10-year tree growth
Height 2 6.19 10382 2.20 0.1893Diameter 2 6.08 1181 2.36 0.1742
Douglas-fir5-year tree growth
Height 2 6.02 2430 1.91 0.2282Diameter 2 6.03 25 0.77 0.5043
10-year tree growthHeight 2 6.11 19716 1.13 0.3833Diameter 2 6.13 1805 2.98 0.1247
Tree Foliage NutrientsLodgepole pine
N 2 6 16x10-2 3.18 0.1146P 2 6 8x10⁻⁴ 2.37 0.1748K 2 6 7x10⁻³ 1.12 0.3859Ca 2 6 6x10⁻³ 4.96 0.0535Mg 2 6 9x10⁻⁵ 1.84 0.2384S 2 6 4x10⁻³ 1.23 0.3567Mn 2 6 2106 2.71 0.1447Total Fe 2 6 2612 1.48 0.3002
Douglas-firN 2 6.02 20x10-3 1.71 0.2586P 2 6 21x10-3 7.07 0.0264K 2 6.01 7x10⁻³ 0.25 0.7866Ca 2 6.02 3x10⁻³ 1.21 0.3614Mg 2 6.01 5x10⁻³ 9.07 0.0513S 2 6.05 7x10⁻⁴ 1.82 0.2405Mn 2 6.01 44084 7.04 0.0267Total Fe 2 6 1326 1.00 0.4216
Lodgepole pine root dataGround-level diameter 2 6 1 0.11 0.9013Solid-wood length 2 6 1177 1.35 0.3279Solid-wood width 2 6 42 0.64 0.5618Root depth 2 6 14224 21.62 0.0018Root areas
0-10 cm 2 6 63220 0.48 0.643110-20 cm 2 6 486779 1.65 0.268320-30 cm 2 6 13414 4.81 0.056730-40 cm 2 6 921 1.66 0.2668Total 2 6 16878 0.10 0.9067
MS=mean squareF=MS(treatment)/MS(error)PR>F=probability value of F-ratio

38
Appendix 3 (continued). Analysis of variance for parameters for the lower section by disturbance category
Df
Parameter Num. Denom. MS F PR>F
Lodgepole pineDouglas-fir
Ground-level diameter 2 6 12 1.58 0.2817Solid-wood length 2 6 565 1.53 0.2901Solid-wood width 2 6 15 1.65 0.2679Root depth 2 6 7230 1.12 0.3866Root areas
0-10 cm 2 6 64033 3.83 0.084810-20 cm 2 6 150376 2.57 0.156420-30 cm 2 6 10511 10.13 0.011930-40 cm 2 6 63 1.13 0.3819Total 2 6 35442 3.10 0.1187
MS=mean squareF=MS(treatment)/MS(error)PR>F=probability value of F-ratio