impact study of entrepreneurial dynamics - small business
TRANSCRIPT

Impact Study of Entrepreneurial Dynamics:
Office of Entrepreneurial Development
Resource Partners’
Face-to-Face Counseling
May 2012
Prepared by
6900 Wisconsin Avenue Suite 203 Bethesda, MD 20815 301-986-4581 Contract: SBAHQ09C004B
September 2012

Office of Entrepreneurial Development
Impact Study of Entrepreneurial Dynamics 2012
i
This page intentionally left blank for two-sided printing.

Office of Entrepreneurial Development
Impact Study of Entrepreneurial Dynamics 2012
ii
Table of Contents
Table of Contents……...………………………………………………………………………………………...……………….…ii
Table of Figures………….……………………………………………………….………………………………………….………iii
Table of Tables…………………………………………………………………………………………………………………….…..v
I. Introduction………………………………………………………………………………………………………..………………..1
II. Report Highlights………………………….………………………………………………………………………………………5
II. Methodology………………………………………………………………………………………………………………………..9
IV. Total OED Resource Partners’ Face-to-Face Counseling Clients………………………………………...15
V. SBDC vs. Total OED Resource Partners’ Face-to-Face Counseling Clients….…..………………...…33
VI. SCORE vs. Total OED Resource Partners’ Face-to-Face Counseling Clients…………………..….…45
VII. WBC VS. TOTAL OED Resource Partners’ Face-to-Face Counseling Clients……………....….…..57
VIII. Impact of Client Firm Characteristics………………………………………………………………………..…….69
IX. Summary of Client Comments…………………………………………………………………………….…….………71
X. Follow-up Study…………………………………………………………………………………………..………....….….…73
XI. Appendices………………………………………………………………………………………………………………..…..…87
Appendix 1 – Survey Response Values by Research topic…………………………….………......89
Appendix 2 – Quantified Survey Results – Initial Survey 2011 Clients……………..…….…..95
Appendix 3 – Quantified survey results – Follow-up Survey 2010 Clients…………………101
Appendix 4 – Initial Study Survey Instrument………………………………………………..…...……103
Appendix 5 – Follow-up Survey Instrument…………………………………………………..……...…109
Appendix 6 – Regression Analysis Computations………………………………………..…...........111

Office of Entrepreneurial Development
Impact Study of Entrepreneurial Dynamics 2012
iii
Table of Figures
Figure 3.1 ‒ Distribution of 2011 Respondents by Segment
Figure 4.1 – Total OED Resource Partners – Segments Served Figure 4.2 – Total OED Resource Partners – Revenues and Employees Figure 4.2A ‒ Total OED Resource Partners – Revenues by Hours of Counseling Figure 4.3 ‒ Total OED Resource Partners – Demographic Characteristics Figure 4.4 ‒ Total OED Resource Partners – Age of Business Owner Figure 4.5 ‒ Total OED Resource Partners – Firm Location Figure 4.6 ‒ Total OED Resource Partners – Business Type Figure 4.7 ‒ Total OED Resource Partners – Reasons for Seeking Counseling from OED Resource Figure 4.8 ‒ Total OED Resource Partners – Usefulness of Assistance Received Figure 4.8A ‒ Total OED Resource Partners – Usefulness of Assistance by Hours of Counseling Figure 4.9 ‒ Total OED Resource Partners – Assistance with Decision to Start a Business Figure 4.10 ‒ Total OED Resource Partners – Assistance with Plan Development Figure 4.11 ‒ Total OED Resource Partners – Business and Financial Impact of Assistance Figure 4.11A ‒ Total OED Resource Partners – Business and Financial Impact of Assistance by Hours of
Counseling Figure 4.12 ‒ Total OED Resource Partners – Mean Revenues by Demographic Characteristic Figure 4.13 ‒ Total OED Resource Partners – Mean Number of Employees by Demographic Characteristic
Figure 5.1 – SBDC – Distribution of Clients by Business Segment Figure 5.2 ‒ SBDC – Demographic Characteristics Figure 5.3 – SBDC – Age of Business Owner Figure 5.4 ‒ SBDC – Type of Business Figure 5.5 –SBDC – Usefulness of Counseling Assistance Figure 5.5A ‒ SBDC – Usefulness of Assistance by Hours of Counseling Figure 5.6 – SBDC – Changes in Management Practices/Strategies Figure 5.7 ‒ SBDC – Assistance in Plan Development Figure 5.8 ‒ SBDC – Business and Financial Impact of Assistance Figure 5.8A ‒ SBDC – Business and Financial Impact of Assistance by Hours of Counseling
Methodology
Total OED Resource Partners Clients Face-to-Face 2011Counseling Clients
SBDC VS. Total OED Resource Partners Clients Face-to-Face 2011Counseling Clients

Office of Entrepreneurial Development
Impact Study of Entrepreneurial Dynamics 2012
iv
Figure 6.1 –SCORE – Distribution of Clients by Business Segment Figure 6.2 ‒ SCORE – Demographic Characteristics Figure 6.3 – SCORE – Age of Business Owner Figure 6.4 ‒ SCORE – Type of Business Figure 6.5 – SCORE – Usefulness of Counseling Assistance Figure 6.5A ‒ SCORE – Usefulness of Assistance by Hours of Counseling Figure 6.6 – SCORE – Changes in Management Practices/Strategies Figure 6.7 ‒ SCORE – Assistance in Plan Development Figure 6.8 ‒ SCORE – Business and Financial Impact of Assistance Figure 6.8A ‒ SCORE – Business and Financial Impact of Assistance by Hours of Counseling
Figure 7.1 – WBC – Distribution of Clients by Business Segment Figure 7.2 ‒ WBC – Demographic Characteristics Figure 7.3 – WBC – Age of Business Owner Figure 7.4 ‒ WBC – Type of Business Figure 7.5 – WBC – Usefulness of Counseling Assistance Figure 7.5A ‒ WBC – Usefulness of Assistance by Hours of Counseling Figure 7.6 – WBC – Changes in Management Practices/Strategies Figure 7.7 ‒ WBC – Assistance in Plan Development Figure 7.8 ‒ WBC – Business and Financial Impact of Assistance Figure 7.8A ‒ WBC – Business and Financial Impact of Assistance by Hours of Counseling
Figure 10.1 – 2009 and 2010 Client Transition and Survival to In-Business in 2011 Figure 10.2 – 2009 and 2010 Client Survival vs. PSED II
Figure 10.3A – 2009 and 2010 Client Survival by Hours of Counseling
Figure 10.3B – 2010 Client Segment Survival by Hours of Counseling
Figure 10.4A – 2009 and 2010 Client Survival by Age Group
Figure 10.4B – 2009 and 2010 Client Survival by Race
Figure 10.4C – 2009 and 2010 Client Survival by Gender
Figure 10.4D – 2009 and 2010 Client Survival by Location Figure 10.5 – 2009 and 2010 Client Revenues and Employees Figure 10.5A – 2010 SBDC Client Revenues and Employees Figure 10.5 – 2010 SCORE Client Revenues and Employees Figure 10.5 –2010 WBC Client Revenues and Employees Figure 10.6 – 2009 and 2010 WBC Client Change in Mean Revenues Figure 10.7 – 2010 Client Revenue Growth Compared to GDP Percent Change from Previous Year
SCORE VS. Total OED Resource Partners Clients Face-to-Face 2011Counseling Clients
WBC VS. Total OED Resource Partners Clients Face-to-Face 2011Counseling Clients
Follow-up Study of 2010 Clients

Office of Entrepreneurial Development
Impact Study of Entrepreneurial Dynamics 2012
v
Table of Tables
Table 3.1 – Sampling Frame Table 4.1 – Total OED Resource Partner Client Revenues and Employment Table 5.1 – SBDC 2011 Client Revenues and Employment Table 6.1 – SCORE 2011 Client Revenues and Employment Table 7.1 – WBC 2011 Client Revenues and Employment

Office of Entrepreneurial Development
Impact Study of Entrepreneurial Dynamics 2012
1
I. Introduction
This report contains findings from the Initial Impact Study of face-to-face counseling services sponsored
by the U.S. Small Business Administration’s (SBA’s) Office of Entrepreneurial Development (OED). OED
manages and leverages three major resources: Small Business Development Centers (SBDCs), SCORE,
and Women’s Business Centers (WBCs). Although each resource program’s goals and target audiences
may vary, a common mission is shared between them: to provide a diverse network of business advice,
mentoring, and training to small businesses and entrepreneurs. OED is focused on measurable
outcomes of these resource programs, and has sponsored this study, now in its eighth year, to assess
resource program outcomes.
The objective of this annual study is to measure the performance of SBA resource partner face-to-face
counseling programs and the impact they have on growing and sustaining small business clients.
This year’s study comprises an initial assessment of 2011 client satisfaction and business and financial
impact, and a follow-up of 2010 clients that participated in the Initial Impact Study in 2010. The Follow-
up Study reports the longer-term business and financial impact of OED Resource Partners’ face-to-face
counseling assistance on client firms by matching 2011 to 2010 respondents to assess the impact of OED
Resource Partner face-to-face counseling assistance on survival, employment, and financial growth.
Research Questions
The following questions are the focus of these studies. The Initial Impact Study addresses questions one
through five and the Follow-up Study addresses questions six and seven and both include time series
analyses of multi-year data.
1. What is the demographic, financial, and business profile of firms who utilize services of OED
Resource Partners (SBDC, SCORE, WBC)?
2. Is there a relationship between the services/assistance provided by OED Resources Partners
(SBDC, SCORE, WBC) and the client’s perception of the usefulness and value of the
services/assistance received?
3. Is there a relationship between the services/assistance provided by OED Resource Partners
(SBDC, SCORE, WBC) and the client’s decision to start a business?
4. Is there a relationship between the services/assistance provided by OED Resource Partners
(SBDC, SCORE, WBC) and the client’s decision to implement and/or change management and/or
marketing practices?
5. Are the services/assistance provided by OED Resource Partners (SBDC, SCORE, WBC) having an
impact on the client’s financial position in terms of job creation, job retention, and sales?

Office of Entrepreneurial Development
Impact Study of Entrepreneurial Dynamics 2012
2
6. What is the impact of OED Resource Partners’ (SBDC, SCORE, WBC) assistance on firm survival
compared with subjects of the Panel Study of Entrepreneurial Dynamics II (PSED II)1?
a. What was the rate of transition of Nascent and Start-up firms to the In-Business
segment?
7. What is the financial impact of services/assistance provided by OED Resource Partners in terms
of job creation, job retention, and sales? a. How does the growth of OED resource partner clients compare with selected growth
benchmarks, such as the gross domestic product (GDP)?2
Note: Questions 6 and 7 are addressed by the Follow-up Study only, because they measure outcomes
over time.
This report consists of the following sections:
I. Introduction – description of the contents of this report.
II. Report Highlights – description of interesting and important findings.
III. Methodology –details about sampling, testing, and analysis methods.
IV. Total OED Resource Partners‘ 2011 Face-to-/Face Counseling Clients– study results for 2011
OED Resource Partner clients in aggregate compared to aggregate results for 2010 clients
with a focus on firm demographics, attitudes about face-to-face counseling services, and
business impacts.
V. SBDC 2011 Face-to-Face Counseling Clients– study results for 2011 SBDC clients compared to
results for Total OED Resource Partner clients.
VI. SCORE 2011 Face-to-Face Counseling Clients – study results for 2011 SCORE clients compared
to results for Total OED Resource Partner clients.
VII. WBC 2011 Face-to-Face Counseling Clients – study results for 2011 WBC clients compared
to results for Total OED Resource Partner clients.
1 The Panel Study of Entrepreneurial Dynamics II is a nationwide, multi-million dollar survey of nascent entrepreneurs funded
by the Kauffman Foundation. The primary purpose of the study is to identify adults active in business creation, to obtain
detailed information about the start-up effort, and to perform follow-up interviews to determine outcomes. We rely on the
PSED II as a benchmark; however, results must also be interpreted with caution due to potential response bias and definitional
differences in the ways that firms are classified.
2 Source: http://www.bea.gov/national/xls/gdpchg.xls.

Office of Entrepreneurial Development
Impact Study of Entrepreneurial Dynamics 2012
3
VIII. Impacts of 2011 Client and Firm Characteristics – assessment of the significance of the
relationship between selected firm characteristics and clients’ attitudes towards the face-
to-face counseling they received and between selected firm characteristics and the
financial and business impacts of the face-to-face counseling they received.
IX. Summary of Client Comments – highlights of remarks survey respondents provided in free
form areas of the survey.
X. Follow-up Study – report on the survival, employment and financial growth of 2010 client
respondents since their initial impact study was conducted in early 2011.
XI. Appendices – detailed survey coding, survey responses, survey instruments, and detailed
results from the regression analysis.

Office of Entrepreneurial Development
Impact Study of Entrepreneurial Dynamics 2012
4
This page intentionally left blank for two-sided printing.

Office of Entrepreneurial Development
Impact Study of Entrepreneurial Dynamics 2012
5
II. Report Highlights
The following section presents highlights of the 2011 initial and follow-up studies. It is intended to
provide an at-a-glance snapshot of some of the more interesting results of these studies and to
consolidate some of the key data in a concise format.
OED Resource Partners provided face-to-face counseling services to a
broad demographic of businesses in 2011.
Firms spanned all three business segments as shown in the chart above.
Firms ranged in size from average revenues of $791,991 (SBDC) and $478,460 (SCORE) to $157,341 (WBC); average number of employees ranged from 8.6 (SBDC) and 6.3 (SCORE) to 3.4 (WBC).
Demographics of firm ownership were diverse among Resource Partner clients.
SBDC counseled slightly more male-owned firms (39%) than female-owned firms (34%); more White firms (71%) than Black/African American (10%) or Hispanic/Latino firms (8%); and more Veteran-owned firms (9%) than Service-disabled Veteran firms (3%).
SCORE counseled more female-owned firms (40%) than male-owned firms (37%); more White firms (70%) than Black/African American (12%) or Hispanic/Latino firms (6%); and more Veteran-owned firms (8%) than Service-Disabled Veteran firms (2%).
WBC clients were measurably different from SBDC and SCORE clients with a majority of female clients (67%) versus male clients (12%) and a larger percentage of Hispanic/Latino clients (11%) than either SBDC clients (8%) or SCORE clients (6%). Other WBC demographics included: White (73%), Black/African American (9%), Veteran (6%) and Service-Disabled Veteran (2%).
Age of firm owners and for SBDC, SCORE, and WBC followed similar patterns with the largest age group being 45-54: SBDC (28%), SCORE (28%), WBC (25%).
The top three business types cited by SBDC clients were “Other” (15%), Service (9%), and Retail (9%) and by SCORE clients “Other” (15%), Service (9%), and Retail (7%). The top three business types cited by WBC clients were “Other” (18%), Retail (9%), Service.
Resource Partner Nascent Start-up In-Business
SBDC 25% 19% 56%
SCORE 33% 22% 45%
WBC 32% 15% 53%

Office of Entrepreneurial Development
Impact Study of Entrepreneurial Dynamics 2012
6
OED Resource Partners received high ratings for their counseling services
across all business segments from their 2011 face-to-face clients.
OED Resource Partner face-to-face counseling had positive business and
financial impacts on 2011clients.
A larger percentage of SBDC clients reported that they changed their management practices/strategies and a larger portion of SBDC clients reported positive financial result from their counseling than SCORE or WBC clients.3
The top four most impacted management practices by each client group were: Business Plan, Marketing Plan, Financial Strategy, and Cash Flow Analysis.
OED Resource Partner face-to-face counseling had several significant
impacts.
Clients from each OED Resource Partner that received three or more hours of counseling versus those that had fewer hours of counseling more often reported higher levels of “usefulness of assistance,” assistance with their “decision to start a business,” and positive business and financial impacts.
3 Client financial impacts (e.g. increased sales and profits, etc.) are not indicative of the reasons or purpose for seeking
counseling.
Usefulness of Face-to-Face Counseling – Ratings of High and Very High
Resource Partner Nascent Start-up In-Business
SBDC 81% 81% 76%
SCORE 76% 72% 71%
WBC 75% 84% 78%
Changes to Management Practices and Business/Financial Results
Resource Partner
Changed Management Practices/Strategies
Increased Sales
Increased Profit
Hired New Staff
Retained Current Staff
SBDC 60% 40% 32% 18% 23%
SCORE 54% 30% 25% 13% 15%
WBC 57% 30% 30% 13% 18%
Office of Entrepreneurial Development
Impact Study of Entrepreneurial Dynamics 2012
7
Larger firms, female-owned firms, joint male and female-owned firms, Nascent and Start-up firms, and suburban firms all reported higher levels of “usefulness of assistance” when compared to smaller firms, male only firms, In-Business firms, and urban or rural firms.
Larger firms and firms that received three or more hours of counseling reported higher levels of financial impact when compared to smaller firms or firms that received less than three hours of counseling.
OED Resource Partner face-to-face counseling had important outcomes for
2010 clients reporting on their progress in 2011.
Thirty percent of 2010 Nascent clients and 90% of 2010 In-Business clients transitioned to the In-Business segment. Ninety-six percent of 2010 clients were still In-Business in 2012.
OED Resource Partner client firms had a higher survival rate (94%) than small businesses surveyed in the PSED II (90%).
Non-white client firm survival rates were only one percentage point lower than white firm survival rates.
“Male and Female” firms survived at a greater rate (97%) than female firms (95%) or male firms (94%).
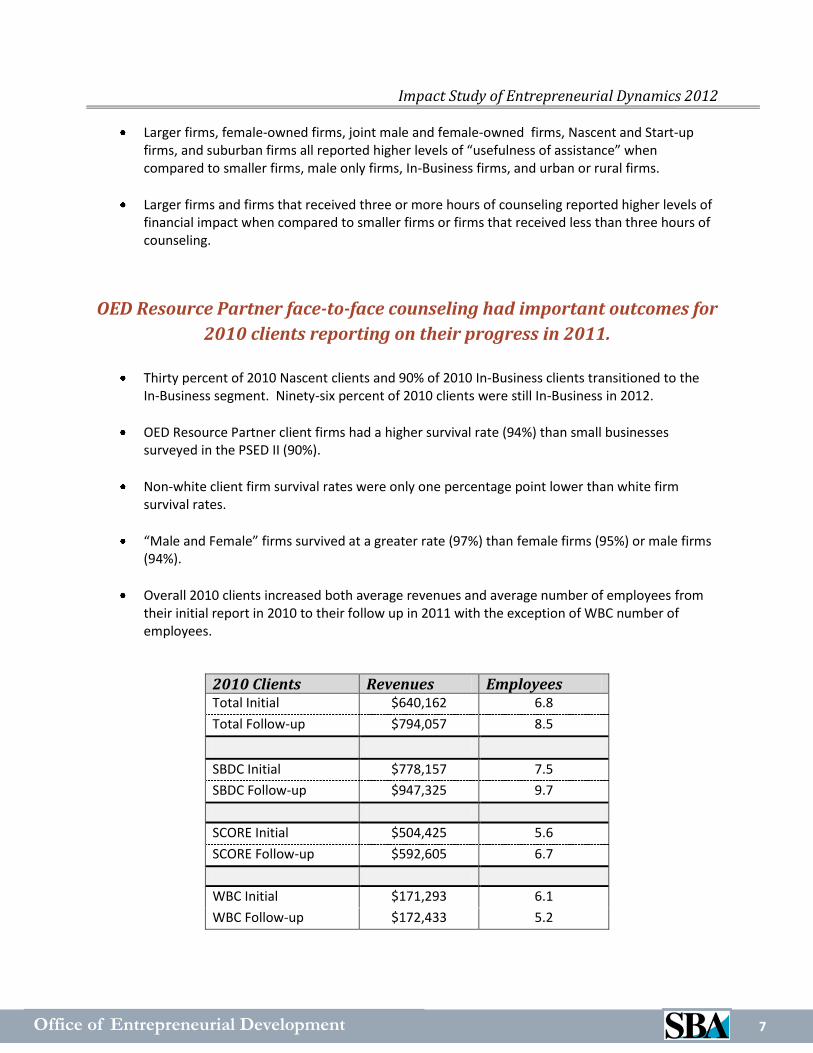
Overall 2010 clients increased both average revenues and average number of employees from their initial report in 2010 to their follow up in 2011 with the exception of WBC number of employees.
2010 Clients Revenues Employees Total Initial $640,162 6.8
Total Follow-up $794,057 8.5
SBDC Initial $778,157 7.5
SBDC Follow-up $947,325 9.7
SCORE Initial $504,425 5.6
SCORE Follow-up $592,605 6.7
WBC Initial $171,293 6.1
WBC Follow-up $172,433 5.2

Office of Entrepreneurial Development
Impact Study of Entrepreneurial Dynamics 2012
8
This page intentionally left blank for two-sided printing.

Office of Entrepreneurial Development
Impact Study of Entrepreneurial Dynamics 2012
9
III. Methodology
Sampling and Data Collection
This study examines the impacts of SBA’s OED Resource Partner face-to-face counseling on 2011 clients in the following stages of business formation:
Nascent – Individuals who have taken one or more steps to start a business,
Start-up – Individuals who have been in business one year or less, and
In-Business – Individuals who have been in business more than one year and are classified as
small by the SBA.
The Initial Impact Study of 2011 clients is quantitative in nature and based on responses to web and
telephone surveys, administered in March and April of 2012. The responses provided a statistically
significant sample for OED Resource Partners overall. To determine if the sample size was sufficient,
reported sales revenues were assessed and results indicated that the sample of 2011 clients is
sufficiently large enough for accuracy within plus or minus $74,825 in total reported annual sales
revenues at a 99% confidence level.4
Table 3.1 below depicts the sample distribution and response rates for each OED Resource Partner.
Resources Partners drew a random sample of clients served during the early fall of 2011 based upon
guidelines provided by SBA’s OED. This year’s overall target sample size was 100,000 observations
apportioned among the three Resources Partners based upon the number of clients served. The
stratified sample represents the number of client contacts received from each OED Resource Partner.
The usable sample excluded those names without valid email or valid telephone numbers.
Table 3.1 – Sampling Frame5
Resource Center
Stratified Sample
Size
Usable Sample
Size
Surveys Received via Web
Web Response
Rate
Telephone Surveys
Completed
Total Responses
Overall
Response
Rate
SBDC 44,299 43,417 6,144 14% 2119 8,263 19%
SCORE 48,516 45,339 5,369 12% 1848 7,217 16%
WBC 2,466 2,322 253 11% 87 340 15%
Total 95,281 91,078 14,833 13% 4,054 15,820 17%
4 This assumes a normal distribution of annual revenues with a standard deviation of $2,346,320.
5 Although this year’s study original sample size (100,000) was more than doubled from last year, WBC’s stratified
sample was less than last year by 733. The stratified sample for WBC was 2,466 2011 client names; the stratified sample for WBC 2010 was 3,299.

Office of Entrepreneurial Development
Impact Study of Entrepreneurial Dynamics 2012
10
We emailed SBA OED official, signed letters to the usable sample requesting that clients complete the
attached survey. We sent reminder emails each week for three weeks after the initial email. We
logged-in all received surveys, entered the survey data into a database for analysis, and developed an
electronic database list of non-respondents for a telephone follow-up survey. Each survey was assigned
a computer-generated client code ensuring unique and accurate identification of each client for next
year’s follow-up survey as well as client privacy. Concentrance scrubs all survey file data to ensure
accuracy and completeness to the extent possible.
The overall response rate this year was 17%, which is comparable to response rates found in other
surveys of entrepreneurs. For example, Aldrich and Baker (2000) found that nearly a third of surveys of
entrepreneurs had response rates below 25%.6 In another example, the National Federation of
Independent Business (NFIB) had a response rate of 20% in its Small Business Economic Trends survey
conducted in June of 2010.7 This year’s response rate of 17% is lower than last year’s overall response
rate of 23%. It should be noted that, although an increase in sample size may lead to a lower response
rate, the end result is a larger base of respondents for the follow-up. Also, Concentrance received fewer
contacts from WBC than last year.
The response rates impacted all resources similarly by phone and web. We had the survey
administrator reassess possible technical anomalies and did not find any. We assessed the viability of
conducting additional phone surveys, and determined that this would not increase the response rate in
a meaningful way.
(See Appendix 4 for the Initial Impact Study survey instrument.)
6 Aldrich, Howard E. and Ted Baker (2000), “Blinded by the Cites: Has there been any progress in entrepreneurship research?”
in Entrepreneurship 2000, ed. Donald L. Sexton and Raymond L. Smilor, Chicago: Upstart Publishing, p. 377-400.
7 William K. Dunkelberg and Holly Wade, “NFIB Small Business Economic Trends” NFIB.com. July 2010.
http://www.nfib.com/Portals/0/PDF/sbet/sbet201007.pdf

Office of Entrepreneurial Development
Impact Study of Entrepreneurial Dynamics 2012
11
The In-Business segment was the largest served by OED Resource Partners.
n = 15,820
SBDC SCORE WBC
Nascent 2,055 2,349 110
Start-up 1,563 1,621 51
In-Business 4,645 3,247 179
Total 8,263 7,217 340
19%
22%
15%
25%
33%
32% 56%
45%
53%
-
1,000
2,000
3,000
4,000
5,000
6,000
7,000
8,000
9,000
Nu
mb
er o
f R
esp
on
de
nts
Figure 3.1 Distribution of 2011 Clients by Business Segment
Figure 3.1 shows the distribution of survey respondents by respective OED Resource Partner and
business segment. The In-Business segment was the largest segment served for all resources followed by
Nascent. The Start-up segment is smaller than the other segments in part because of the narrower
definition of Start-up: firms that have been in business for one year or less.
Data Analysis
Analyses included the following methods: basic descriptive statistics, frequency distributions, cross
tabulations, and regression. Concentrance used basic descriptive statistics for continuous variables such
as annual sales revenues. We used frequency distributions for Likert scales, where respondents
answered on a scale of 1 to 5. Cross-tabulations were used to compare responses across OED resource
partners, business segments, and hours of counseling received. Finally, the team used multiple
regression analyses to test for differences in key outcomes, such as perceived usefulness and financial
impact of OED Resource Partner assistance, based on demographic and firm characteristics.
(2011 clients)
Office of Entrepreneurial Development
Impact Study of Entrepreneurial Dynamics 2012
12
We selected these analyses to meet the objectives of each research question and to facilitate
interpretation of findings. For this year’s study, revenue and employment calculations were completed
using mean data instead of median data, which is more a more appropriate measure for firms the size of
those in this study.
Analysis of Non-Response
SBA’s research plan for this study included a methodology for estimating potential non-response bias.
Non-response bias can occur in survey research if respondents differ substantially from those that do
not respond. The best way to protect against this bias is to improve the response rate. An effective
method for achieving high response rates is the use of follow-ups and reminders. In this study, non-
response bias was minimized by sending three reminder emails containing a link to the survey and
minimized further by telephone follow-ups to non-respondents.
We assessed the extent and direction of potential non-response bias by comparing the characteristics of
clients who responded to the internet survey with those who responded by telephone. Of the 15,820
total surveys, 4,054 surveys were completed over the phone. The remaining clients (11,766) were
surveyed over the web. Clients surveyed over the web were more likely to report revenue (web: 74.8%
vs. phone: 46.4%), while clients surveyed over the phone were slightly more likely to report employment
(web: 58.6% vs. phone: 61.5%). However, after controlling for other respondent characteristics (OED
Resource Partner Code, Business Stage, and Hours of Counseling Received), web clients were more likely
to report both revenues and employment figures.8
The next step was to conduct a comparative analysis of the responses between these groups to
determine if the difference in response rates would impact our analyses. Results of regression analyses
revealed no significant differences between these groups in terms of revenues. There was a significant
difference in total employees found between phone and web respondents. However, only a very small
portion of the total variance in revenue (0.13%) is explained by this difference. 9
Additionally, the difference in phone and web respondents was tested against perceived service
usefulness. Although a significant difference in usefulness of service was found, only a small portion of
8 These findings were based on results of two logistic regression analyses to determine whether web versus phone respondents
differed significantly in terms of missing revenues and employment figures. The models were significant at the p<.0001 level and the variable indicating web response was always significantly higher at the p<.0001 level.
9 These findings were based on results of a regression analysis to determine whether web versus phone respondents differed
significantly in terms of revenue, where total revenue is between 1,000 and 25,000,000, inclusive. A Scheffe test reveals no significant difference between phone and web at the 0.10 level. The t-test associated with the regression analysis reveals a non-significant result (t=-1.11 p=0.2673). A second regression was performed to determine whether web versus phone respondents differed significantly in terms of reported total employees between 1 and 998, inclusive. A Scheffe test reveals a significant difference between phone and web at the 0.10 level. The t-test associated with the regression analysis reveals a significant result (t=3.98 p<0.001). The R-square value associated with this model is 0.001339.

Office of Entrepreneurial Development
Impact Study of Entrepreneurial Dynamics 2012
13
the variance of each of the service measures can be explained by the difference between phone and
web respondents.10 Because the evidence of response bias is minimal, the phone and web respondents
were pooled in subsequent analyses.
Limitations
There are several limitations that should be considered when interpreting the results presented in this
report. These limitations are inherent in the research design and methodology.
Measures included in this initial survey are primarily attitudinal and all items are self-reported. Thus, there are few objective measures that can be used to assess actual client performance or to make comparisons with other data sources.
Many respondents did not report revenue data, or reported zero.
10
These findings were based on results of the two regression analyses to determine whether web versus phone respondents differed significantly in terms of the reported perceived service usefulness and value of information received. The R-square value of the individual measures of service and information predicted by the difference in phone vs. web respondents was explored and were found to be less than 1%.

Office of Entrepreneurial Development
Impact Study of Entrepreneurial Dynamics 2012
14
This Page intentionally left blank for two-sided printing

Office of Entrepreneurial Development
Impact Study of Entrepreneurial Dynamics 2012
15
IV. Total OED Resource Partners’ Face-to-Face Counseling Clients
The following section presents comparison results of clients from 2010 and 2011. First, the general
demographic and financial characteristics of the total OED Resource Partner clients are presented. This
is followed by findings on the usefulness and impact of the total OED Resource Partners’ counseling
assistance on Nascent, Start-up, and In-Business firms organized by research question as follows:
Is there a relationship between services/assistance provided by OED Resource Partners (SBDC, SCORE, and WBC) and the client’s perception of the usefulness and value of services/assistance received?
Is there a relationship between the services/assistance provided by OED Resource Partners (SBDC, SCORE, and WBC) and the client’s decision to start a business?
Is there a relationship between the services/assistance provided by OED Resource Partners
(SBDC, SCORE, and WBC) and the client’s decision to implement and/or change management and/or marketing practices?
Are the services/assistance provided by ED Resources (SBDC, SCORE, and WBC) having an impact on the client’s financial position in terms of job creation, job retention, and sales?
Please note that comparisons between the 2010 and 2011 initial study clients should be interpreted
with caution. Concentrance analyzed SBA collected cross-sectional data from a different set of firms
each year, and these firms were operating under different economic conditions. To better understand
changes over time, the follow-up study included in this report tracks the same firms over a one year
period.
In addition, the respondent pool for 2011 was 36% higher than for 2010 with 5,674 more respondents;
in stacked comparisons of 2010 clients and 2011 clients, percentages for 2011 clients may be smaller
due to the larger number of respondents and therefore a larger number of missing responses for a
particular survey question.

Office of Entrepreneurial Development
Impact Study of Entrepreneurial Dynamics 2012
16
Total OED Resource 2011 Face-to-Face Counseling Clients’ Revenue, Employment and
Demographic Characteristics
This section describes the general demographic and financial characteristics of total OED Resource
Partner clients that were served in 2011. These results are based on an analysis of 10,146 surveys for
2010 clients and 15,820 surveys for 2011.
The 2011 Nascent business segment was larger than the 2010 Nascent segment; the In-Business segment decreased by three percentage points
compared to the 2010 In-Business segment.
Figure 4.1 – Total OED Resource Partners by Business Segment
26% 19%
54%
29% 20%
51%
0%
20%
40%
60%
Nascent Startup In-Business
2010: = n 10,146 2011: n= 15,820
2010 2011
As shown in Figure 4.1, the In-Business segment (51%) was the largest business segment served by OED
Resource Partners in 2011. The size of the In-Business segment decreased by 3% in 2011 and the
Nascent segment increased 3% in 2011.
Table 4.1 – Total OED Resource Partner Client Revenues and Employment for 2011
2011 Total OED Resources Average Revenue $653,755
Average Employees 7.6

Office of Entrepreneurial Development
Impact Study of Entrepreneurial Dynamics 2012
17
OED Resource Partners served distinct client bases in terms of firm size.
Figure 4.2 – Total OED Resource Partners –Revenues and Employees11
SBDC SCORE WBC
2010 Rev $774,000 $502,000 $171,300
2011 Rev $792,000 $478,500 $157,300
2010 Emp 7 5 5
2011 Emp 9 6 3
SBDC SCORE WBC
0
1
2
3
4
5
6
7
8
9
$-
$100,000
$200,000
$300,000
$400,000
$500,000
$600,000
$700,000
$800,000
$900,000
Mea
n R
even
ue
2010: n=10,146 2011: n=15,820
Figure 4.2 shows that OED Resource Partners continued to serve a diverse client base in terms of the
size and employment. SBDC continued to serve larger firms with revenues of $792,000 (rounded to the
nearest thousandth), followed by SCORE at $478,500 (rounded to the nearest hundredth), and WBC at
$157,300 (rounded to the nearest hundredth). SBDC 2011 client revenues rose compared to 2010 client
revenues, but both SCORE and WBC client revenues fell compared to 2010 client revenues.
11
Firms were required to report revenues within the range of $1000 to $25,000,000, or zero and employees from 1 to 998.

Office of Entrepreneurial Development
Impact Study of Entrepreneurial Dynamics 2012
18
OED Resource Partner Clients benefited in terms of higher revenues from
face-to-face counseling.
Figure 4.2A – Total OED Resource Partners - Revenues by Hours of Counseling12
$(100,000)
$100,000
$300,000
$500,000
$700,000
$900,000
$1,100,000
$1,300,000
SBDC SCORE WBC Total Resource
Revenue < 3 Hours Revenue ≥ 3 Hours (SBDC ≥ 3 & < 5) Revenue ≥ 5 Hours
As Figure 4.2A shows, SBDC client average revenues increased for those who received 5 or more hours
of counseling over those clients that received fewer hours of counseling as did SCORE client revenues.
WBC clients who received three or more hours of counseling rose as well, but only slightly. This trend is
also apparent with the total OED Resource Partner clients’ aggregate hours of counseling where the
difference between clients that received 3 or more hours of counseling and those that received less than
3 hours of counseling is $287,500.
12
SBDC reports counseling hours in three categories: < 3, 3 to 5, ≥ 5, whereas SCORE and WBC report two categories (< 3, ≥ 3).
Office of Entrepreneurial Development
Impact Study of Entrepreneurial Dynamics 2012
19
OED Resource Partners served a broad client base in terms of
demographic characteristics.
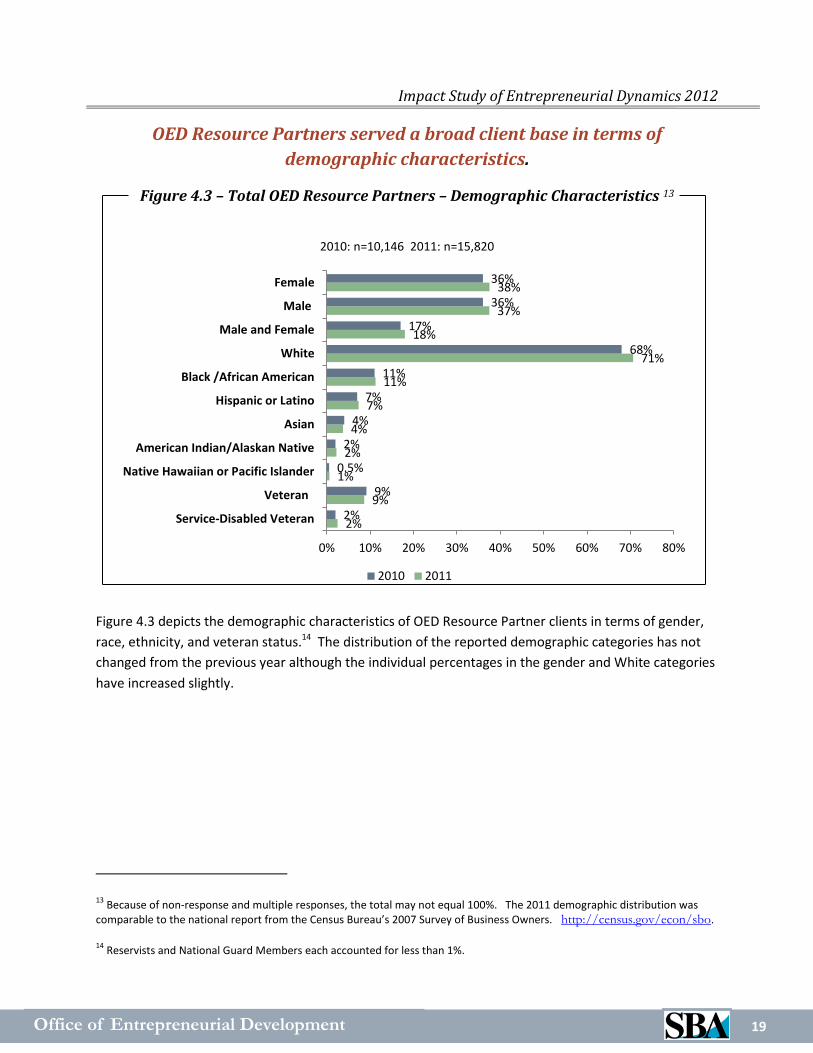
Figure 4.3 – Total OED Resource Partners – Demographic Characteristics 13
Figure 4.3 depicts the demographic characteristics of OED Resource Partner clients in terms of gender,
race, ethnicity, and veteran status.14 The distribution of the reported demographic categories has not
changed from the previous year although the individual percentages in the gender and White categories
have increased slightly.
13 Because of non-response and multiple responses, the total may not equal 100%. The 2011 demographic distribution was
comparable to the national report from the Census Bureau’s 2007 Survey of Business Owners. http://census.gov/econ/sbo.
14 Reservists and National Guard Members each accounted for less than 1%.
2%
9%
1%
2%
4%
7%
11%
71%
18%
37%
38%
2%
9%
0.5%
2%
4%
7%
11%
68%
17%
36%
36%
0% 10% 20% 30% 40% 50% 60% 70% 80%
Service-Disabled Veteran
Veteran
Native Hawaiian or Pacific Islander
American Indian/Alaskan Native
Asian
Hispanic or Latino
Black /African American
White
Male and Female
Male
Female
2010: n=10,146 2011: n=15,820
2010 2011

Office of Entrepreneurial Development
Impact Study of Entrepreneurial Dynamics 2012
20
OED Resource Partners served a diverse client base in terms of age of
business owner.
Figure 4.4 – Total OED Resource Partners – Age of Business Owner
Figure 4.4 shows the distribution of OED Resource Partner counseling clients by age of business owner.
The largest groups of OED Resource clients belonged to the 45 to 54 and 35 to 44 age categories, 28%
and 22% respectively. This outcome is consistent with previous years. The 25-34 age group increased 3
percentage points from the previous year.15
15 Totals may not equal 100% due to non-response.
2%
15%
22%
28%
20%
5%
1%
2%
13%
22%
28%
20%
4%
1%
0% 5% 10% 15% 20% 25% 30%
18-24
25-34
35-44
45-54
55-64
65-74
75+
2010: n=10,146 2011: n=15,820
2010 2011

Office of Entrepreneurial Development
Impact Study of Entrepreneurial Dynamics 2012
21
OED Resource Partners served a diverse client base in terms of location:
rural, suburban, and urban.
Figure 4.5 – Total OED Resource Partners– Firm Location16
Figure 4.5 shows the distribution of OED Resource Partner clients’ location: rural, suburban and urban.
This chart is new this year; therefore only results from 2011 are reported. Both SBDC and SCORE serve a
higher percent or suburban and urban clients and fewer rural clients; WBC on the other hand serves a
higher percentage of rural clients than either suburban or urban.
16 Due to non-response, the totals do not equal 100%
20%
9%
24%
15%
26% 28%
19%
27%
24% 24%
19%
28%
0%
5%
10%
15%
20%
25%
30%
SBDC SCORE WBC Total OED ResourcePartners
n=15,820
Rural Suburban Urban

Office of Entrepreneurial Development
Impact Study of Entrepreneurial Dynamics 2012
22
OED Resource Partner client firms, although primarily service and retail
represented a broad group of business types.
Figure 4.6 – Total OED Resource Partners – Business Type17
As shown in Figure 4.6, the two highest reported business types, besides “Other”, served by OED
Resource Partners were the service and retail.18 These results are generally consistent with the national
averages from the 2007 Survey of Business Owners (SBO) from the U.S. Census Bureau. Results that
differed included Manufacturing, reported in the SBO to be 2%; Construction, reported to be 13%; and
Health Care, reported to be 9%.
17
Several groupings were found to be present among those respondents who classified their business type as “Other”. These included multiple responses for non-profits, design/art related professions, beauty-related professions and handyman/painting services. Due to non-responses the total for all business types do not equal 100%.
18 The top 11 results for 2010 are displayed in the chart above. Additional results included: Finance, Insurance and Real Estate
(3%), Education (3%), Entertainment (2%), Engineering (1%), Transportation (1%), Publishing (1%), and Day Care (1%).
14%
2%
3%
3%
4%
6%
5%
8%
8%
22%
3%
5%
4%
5%
8%
8%
11%
14%
0% 5% 10% 15% 20% 25%
Other
Health Care
Construction
Resturant
Technology
Consulting
Manufacturing
Retail
Service
2010: n=10,146 2011: n=15,820
2010 2011

Office of Entrepreneurial Development
Impact Study of Entrepreneurial Dynamics 2012
23
Total OED Resource Partner 2011Clients’ Attitudes Regarding Face-to-Face Counseling
Assistance
This section details total OED Resource Partner Clients’ attitudes and perceptions on why they sought
counseling and the usefulness and value that they received from that assistance.
OED Resource Partner clients appreciated the low cost of face-to-face
counseling services and the reputation of those services.
Figure 4.7 – Total OED Resource Partners – Reason for Seeking Counseling from OED Resource Partners19
Figure 4.7 depicts the reasons clients reported seeking business counseling from OED Resource Partners.
Low/free cost of service was the most common reason for SBDC clients (46%), SCORE clients (47%) and
WBC clients (46%). Reputation was also important at 37%, 46% and 33% respectively. Referral to an
OED Resource Partner was the next highest response at 27%, 21%, and 24% respectively. The primary
sources for referral were clients’ bankers, accountants, and friends.
19
Because of non-response and respondents selecting multiple factors totals may not equal 100%.
7% 6% 7% 7%
37%
46%
33%
41%
46% 47% 46% 46%
27%
21% 24% 24%
0%
5%
10%
15%
20%
25%
30%
35%
40%
45%
50%
SBDC SCORE WBC Total
n=15,820
Tried other Alternatives Reputation Low/free Cost of Service Referral

Office of Entrepreneurial Development
Impact Study of Entrepreneurial Dynamics 2012
24
Seventy-six percent of OED Resource Partner clients cited their face-to-face
counseling as useful or very useful.
Figure 4.8 – Total OED Resource Partners – Usefulness of Assistance Received?20
As shown in Figure 4.8, 76% of 2011 ED Resource Partner clients reported that the information they
received from their counselor was useful/valuable. This is an increase of three percentage points
compared to the previous year.
20
Low value includes the ‘Somewhat Valuable’ and ‘Not Valuable’ response categories. High value includes the ‘Extremely Valuable’ and ‘Valuable’ response categories. Percentages may not total 100% due to non-response.
14%
3%
73%
16%
3%
76%
0%
10%
20%
30%
40%
50%
60%
70%
80%
Low Medium High
2010 2011
2010: n=10,146 2012: n=15,820

Office of Entrepreneurial Development
Impact Study of Entrepreneurial Dynamics 2012
25
Eighty percent of OED Resource Partner clients that received three or
more hours of counseling rated their counseling experience as useful or
very useful, while 71% of clients that received less than three hours rated
their experience as useful or very useful.
Figure 4.8A – Total OED Resource Partners ‒ Usefulness of Assistance
by Hours of Counseling21
Figure 4.8A shows the perceived usefulness of OED Resource Partner Clients’ face-to-face counseling
relative to the number of hours of counseling received recorded in two categories, less than 3 hours and
3 or more hours. For comparison, the overall level of perceived usefulness is also provided, which does
not distinguish by hours of counseling received.
As illustrated above, 80% of clients that received three or more hours of counseling rated the
usefulness of their counseling as “high” or “very high” more often than those who had less than three
hours of counseling.
21
Percentages may not total 100% due to non-response.
20%
3%
71%
12%
2%
80%
16%
3%
76%
0%
20%
40%
60%
80%
100%
Low Medium High<3 Hours >= 3 Hours Total ED Resources
n=15,820
Office of Entrepreneurial Development
Impact Study of Entrepreneurial Dynamics 2012
26
OED Resource Partners’ counseling assisted Nascent firms more often
than other business segments in their decisions to start a business.
Figure 4.9 – Total OED Resource Partners – Assistance with Decision
to go into Business
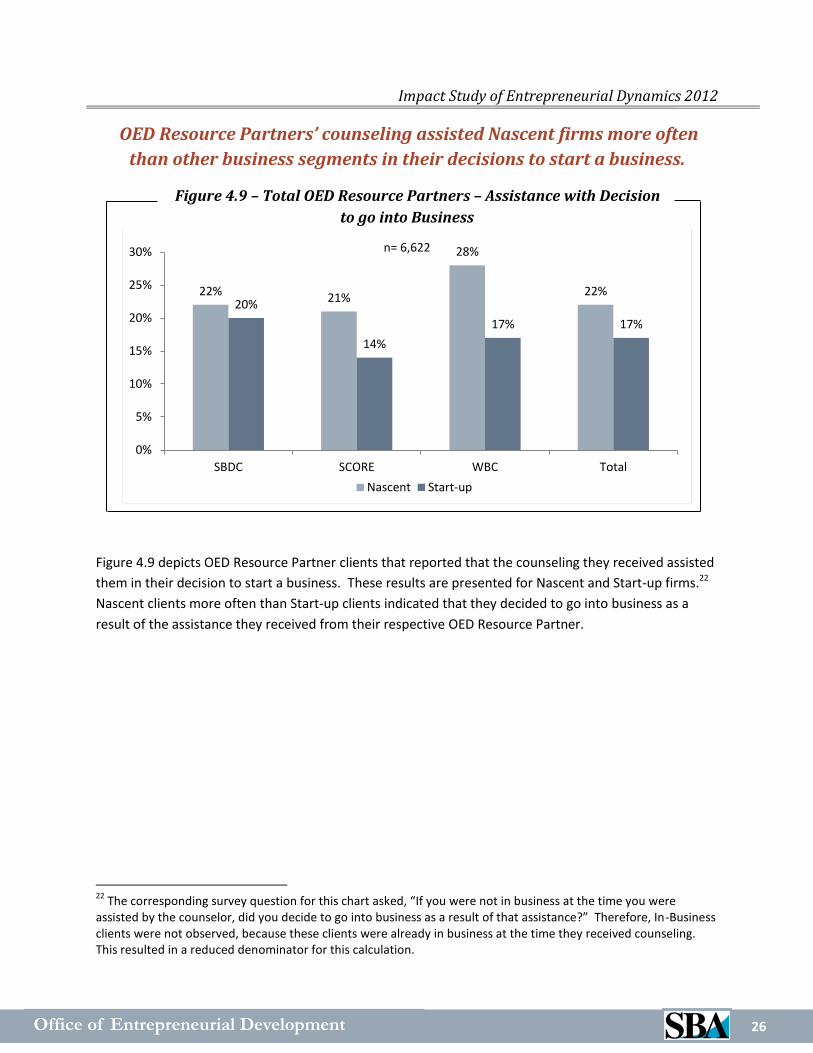
Figure 4.9 depicts OED Resource Partner clients that reported that the counseling they received assisted
them in their decision to start a business. These results are presented for Nascent and Start-up firms.22
Nascent clients more often than Start-up clients indicated that they decided to go into business as a
result of the assistance they received from their respective OED Resource Partner.
22
The corresponding survey question for this chart asked, “If you were not in business at the time you were assisted by the counselor, did you decide to go into business as a result of that assistance?” Therefore, In-Business clients were not observed, because these clients were already in business at the time they received counseling. This resulted in a reduced denominator for this calculation.
22% 21%
28%
22% 20%
14%
17% 17%
0%
5%
10%
15%
20%
25%
30%
SBDC SCORE WBC Total
n= 6,622
Nascent Start-up

Office of Entrepreneurial Development
Impact Study of Entrepreneurial Dynamics 2012
27
Total OED Resource Partner Clients’ Business and Financial Impacts of Face-to-Face
Counseling Assistance
In this section we report on the impact total OED clients’ face-to-face counseling has had on their
management and business practices and as well as the financial outcomes that this counseling afforded
them.
OED Resource Partners continue to assist clients to develop business and
financial plans.
Figure 4.10 – Total OED Resource Partners – Assistance in Plan Development23
Figure 4.10 reflects the percentage of firms that reported that OED Resource Partner assistance led to
the development of business plans, marketing plans, etc. Clients continued to rank Business Plan (34%),
Marketing Plan (29%), Financial Strategy (20%), and General Management (19%) as the
planning/strategy areas where they have been most often assisted. Both Web-based Strategy and
Feasibility Plan both increased by two percentage points this year.
23
Additional results for 2011 included: purchasing strategy and production plan (5%), training plan for staff (4%), distribution plan and international trade (2%). Totals may not equal 100% due to non-response and multiple responses.
35% 30%
19% 18% 17% 14% 13%
10% 8% 8% 5%
34% 29%
20% 19% 17% 15% 13% 12% 10% 8% 6%
0%5%
10%15%20%25%30%35%40%
2010 2011
2010: n=10,146 2011: n=15,820

Office of Entrepreneurial Development
Impact Study of Entrepreneurial Dynamics 2012
28
OED Resource Partners’ counseling helped clients increase their sales and
profit margins.
Figure 4.11 – Total OED Resource Partners – Impact of Business and Financial
Assistance
Figure 4.11 presents findings on financial impact of OED Resource Partner face-to-face counseling
assistance irrespective of the client’s reasons for seeking assistance. OED Resource Partner clients
indicated that face-to-face counseling most often helped them to increase their sales (36%) and profit
margins (29%).
36%
16%
20%
29%
34%
15%
20%
30%
0% 5% 10% 15% 20% 25% 30% 35% 40%
Increase sales
Hire new staff
Retain current staff
Increase profit margin
2010: n=10,146 2011: n=15,820
2010 2011

Office of Entrepreneurial Development
Impact Study of Entrepreneurial Dynamics 2012
29
OED Resource Partner Clients who received three or more hours of
counseling realized their greatest impacts on sales (40%) and profit
margins (33%).
Figure 4.11A – Total OED Resource Partners –Impact of
Business/Financial Assistance by Hours of Counseling
Figure 4.11A shows the financial impact of OED Resource Partner counseling relative to the number of
hours of counseling received reported in two categories: less than 3 hours and 3 or more hours of
counseling received. For comparison, the overall level of perceived financial impact is also provided; this
does not distinguish by hours of counseling. Total OED Resource Partner clients’ ratings by aggregated
hours of counseling were lower than those more than three hours of counseling.
36%
16%
20%
29%
40%
19%
23%
33%
29%
12%
15%
24%
0% 5% 10% 15% 20% 25% 30% 35% 40% 45%
Increase sales
Hire new staff
Retain current staff
Increase profit margin
< 3 Hours >=3 Total OED Resource Partners

Office of Entrepreneurial Development
Impact Study of Entrepreneurial Dynamics 2012
30
Cross-Sectional Demographic Analysis
This section compares mean revenues and employment for OED Resource Partners’ face-to-face
counseling clients by gender, race, ethnicity, and veteran status.
OED Resource Partners provided face-to-face counseling to a wide range
of firm sizes in 2011 from average revenues of $154,000 to $911,000.
Figure 4.12 – Total OED Resource Partners – Mean Revenues (000s)
by Demographic Characteristics24
Figure 4.12 compares average revenues for firms in each demographic category, rounded to the nearest
thousandth for 2010 and 2011 clients. This chart shows that 2011 female-owned firms ($303,000) were
on average much smaller than by male-owned firms ($828,000) and firms owned by Males and Females
($911,000), which were the largest. Average revenues for female-owned firms decreased in 2011 while
those for male-owned and male- and female-owned rose in 2011. Veteran, White, Asian, and
Hispanic/Latino firms had decreased revenues in 2011; however, American Indian/Native Alaskan,
Black/African American and Hawaiian/Pacific Islander revenues increased. Veteran-owned firms
($745,000, male- and female-owned firms ($911,000), and male-owned firms ($828,000) were the
largest firms.
24
Firms were required to report revenues within the range of $1,000 to $25,000,000.
$778 $767
$385
$1,035
$727 $691 $688 $628
$378 $247
$83
$828 $911
$303
$745 $649 $646 $681
$465
$820
$331
$154
$0
$200
$400
$600
$800
$1,000
$1,200
2010 2011
2010: n=10,146 2011: n=15,820

Office of Entrepreneurial Development
Impact Study of Entrepreneurial Dynamics 2012
31
OED Resource Partners provided face-to-face counseling to a wide range
of firm sizes in 2011 from an average of 4.5 to 10.1 employees.
Figure 4.13 – Total OED Resource Partners –Mean Number of Employees
by Demographic Characteristics
Figure 4.13 compares employment by demographic category. Every demographic group increased its
number of employees in 2011,25 although several groups had decreased revenues. (See previous chart).
Female firms (4.5) in 2011 had fewer employees than Male firms (7.7); however, firms with both male
and female owners had the highest average employment levels in the gender category at 10.1.
25
Due to the small sample sizes of Veteran, Asian, and Hawaiian/Pacific Islander and non-response, results should be treated with caution.
4.0 3.7
6.1
5.0 4.8 4.8 4.5 4.1 3.7 3.5 3.3
7.7
4.5
10.1
7.2 7.7 7.9
7.2 7.3
4.8
9.0
4.7
0.0
2.0
4.0
6.0
8.0
10.0
12.0
2010 2011
2010: n=10,146 2011: n=15,820

Office of Entrepreneurial Development
Impact Study of Entrepreneurial Dynamics 2012
32
This page intentionally left blank for two-sided printing.

Office of Entrepreneurial Development
Impact Study of Entrepreneurial Dynamics 2012
33
V. SBDC vs. Total OED Resource Partners’ Face-to-Face Counseling
Clients
The following section presents results from SBDC clients. First, we report the general demographic and
financial characteristics of SBDC 2011 face-to-face counseling clients. This is followed by findings on the
usefulness of SBDC counseling as reported by Nascent, Start-up and In-Business firms organized by
research question as follows:
Is there a relationship between services/assistance provided by SBDC and the client’s perception of the usefulness and value of services/assistance received?
Is there a relationship between the services/assistance provided by SBDC and the client’s decision to implement and/or change management and/or marketing practices?
Is the service/assistance provided by SBDC having an impact on the client’s financial position in terms of job creation, job retention and sales?

Office of Entrepreneurial Development
Impact Study of Entrepreneurial Dynamics 2012
34
SBDC 2011 Face-to-Face Counseling Clients’ Demographic Characteristics
This section describes the general demographic and firm characteristics of SBDC face-to-face counseling
clients. These results are based on an analysis of 8,263 completed surveys.
Fifty-six percent of SBDC respondents were In-Business.
Figure 5.1 – SBDC – Distribution Clients by Business Segment
As shown in Figure 5.1, the largest business segment served by SBDC was the In-Business segment
(56%), followed by the Nascent segment (25%), and the Start-up segment (19%).
Table 5.1 compares revenues and employment for SBDC vs. total OED Resource Partners. These results
indicate that SBDC clients have higher average revenues and employees than total OED Resource
Partner clients.
Table 5.1 – SBDC 2011 Client Revenues and Employment
2011 Clients SBDC Total OED Resources
Average Revenue $791,991 $653,755
Average Employees 8.6 7.6
25% 19%
56%
29%
20%
51%
0%
10%
20%
30%
40%
50%
60%
Nascent Start-up In-Business
SBDC= n = 8,263 Total OED Resource Partners: n= 15,820
SBDC Total OED Resource Partners

Office of Entrepreneurial Development
Impact Study of Entrepreneurial Dynamics 2012
35
SBDC counsels a large percentage of White firms (71%) and a mix of Male
(39%), Female (34%) and Male and Female (20%) firms.
Figure 5.2 – SBDC – Demographic Characteristics
Demographic characteristics of SBDC clients, including gender, race, ethnicity, and veteran status are
reported in Figure 5.2. 26 The demographic makeup of SBDC comprised a smaller percentage of Females
(34%) and a higher percentage of Males (39%) unlike total OED Resource Partners at 38% and 37%
respectively. In addition, SBDC served a higher percentage of Females than Males and Females
combined by 14 percentage points. Other demographic proportions followed a pattern similar to those
of total OED Resource Partners.
26
Reservists and National Guard Members each accounted for less than 1%. Totals may not equal 100% due to non-response or multiple responses.
2%
9%
1%
2%
4%
7%
11%
71%
18%
37%
38%
3%
9%
1%
2%
3%
8%
10%
71%
20%
39%
34%
0% 20% 40% 60% 80%
Service-Disabled Veteran
Veteran
Native Hawaiian or Pacific Islander
American Indian/Alaskan Native
Asian
Hispanic or Latino
Black /African American
White
Male and Female
Male
Female
SBDC: n=8,263 Total OED Resource Partners: n=15,820
SBDC Total OED Resource Partners

Office of Entrepreneurial Development
Impact Study of Entrepreneurial Dynamics 2012
36
SBDC clients represented a similar age distribution as that of total OED
Resource Partner clients.
Figure 5.3 –SBDC ‒ Age of Business Owner
Figure 5.3 shows the distribution of SBDC clients by age of business owner. The largest age group served
was between the ages of 45 and 54 (28%). SBDC clients’ age distribution was consistent with that of
total OED Resource Partners.
2%
15%
22%
28%
20%
5%
1%
2%
15%
23%
28%
21%
5%
1%
0% 5% 10% 15% 20% 25% 30%
18-24
25-34
35-44
45-54
55-64
65-74
75+
SBDC: n=8,263 Total OED Resource Partners: n=15,820
SBDC Total OED Resource Partners

Office of Entrepreneurial Development
Impact Study of Entrepreneurial Dynamics 2012
37
SBDC client distribution of type of business was consistent with total OED
Resource Partner distribution across all categories.
Figure 5.4 – SBDC – Type of Business 27
Figure 5.4 shows that the most common types of businesses served by SBDC were in the Service and
Retail categories.28 These results are generally consistent with the national averages from the 2007
Survey of Business Owners (SBO) from the U.S. Census Bureau. Results that were not consistent
included Manufacturing, reported in the SBO to be 2%; Construction, reported to be 13%; and Retail at
12%, and Health Care, reported to be 9%. It should be noted that SBO Industry classifications are not
identical to those of this study; therefore, exact comparisons are not possible.
27
Because of non-responses and multiple business type selections, the total for all business types might not equal 100%.
28 The top 9 categories for 2011 clients are displayed in the chart above. Additional responses included: Finance, Education,
Insurance and Real Estate, Entertainment, Publishing, Transportation, and Engineering each at 2% or less.
14%
2%
3%
3%
4%
6%
5%
8%
8%
15%
3%
4%
4%
4%
5%
6%
9%
9%
0% 2% 4% 6% 8% 10% 12% 14% 16%
Other
Health Care
Construction
Resturant
Technology
Consulting
Manufacturing
Retail
Service
SBDC: n=8,263 Total OED Resource Partners: n=15,820
SBDC Total OED Resource Partners

Office of Entrepreneurial Development
Impact Study of Entrepreneurial Dynamics 2012
38
SBDC 2011 Client Attitudes Regarding Face-to-Face Counseling Assistance
In this section we report on SBDC client attitudes regarding the usefulness and value received from SBDC
face-to-face counseling and the impact on those attitudes based upon the hours of counseling received.
SBDC client attitudes are compared to those of total OED Resource Partners.
Eighty-one percent of SBDC Nascent and Start-up clients and 76% of In-
Business clients reported their counseling was useful of very useful.
Figure 5.5 –SBDC – Usefulness of Counseling Assistance29
Overall 79% of SBDC clients reported that the information they received from counselors was useful.30
Figure 5.5 shows ratings of usefulness of SBDC OED Resources provided by business segment and
compared to total OED Resource Partners. Nascent and Start-up firms rated the usefulness of
information higher than and In-Business firms.
29 Low value includes the ‘Somewhat Useful/Valuable’ and ‘Not Useful/Valuable’ response categories. High value includes the ‘Extremely useful/Valuable’ and ‘Useful/Valuable’ response categories. 30
Totals for SBDC clients overall were calculated without regard to business stage.
15% 12% 13% 16%
3% 2% 3% 3%
81% 81% 76% 76%
0%
10%
20%
30%
40%
50%
60%
70%
80%
90%
Nascent Start-up In-Business Total OED ResourcePartnersLow Medium High
SBDC: n=8,263 Total OED Resource Partners: n=15,820

Office of Entrepreneurial Development
Impact Study of Entrepreneurial Dynamics 2012
39
Eighty-three percent of SBDC clients that received more than five hours of
face-to-face counseling and 77% that received between three and five
hours of counseling found it useful or very useful.
Figure 5.5A – SBDC – Usefulness of Assistance by Hours of Counseling31
Figure 5.5A shows the perceived usefulness of SBDC counseling based upon the number of hours of
counseling received. It shows that SBDC clients who received more than 5 hours of counseling rated
usefulness as “high” or “very high” much more frequently than those SBDC clients who received less
than 5 hours of counseling and more frequently than total OED Resource Partner clients aggregate hours
of counseling.
31
Low value includes the ‘Somewhat Useful/Valuable’ and ‘Not Useful/Valuable’ response categories. High value includes the ‘Extremely Useful/Valuable’ and ‘Useful/Valuable’ response categories.
16% 15% 10%
16%
3% 3% 2% 3%
74% 77% 83%
76%
0%
10%
20%
30%
40%
50%
60%
70%
80%
90%
<3 Hours Between 3 and 5 Hours > 5 Hours Total OED ResourcePartners
Low Medium High

Office of Entrepreneurial Development
Impact Study of Entrepreneurial Dynamics 2012
40
SBDC 2011 Clients’ Business and Financial Impacts of Face-to-Face Counseling
Assistance
In this section the business and financial impacts of SBDC counseling are reported. SBDC client impacts
are compared to those of total OED Resource Partner clients.
Over half of SBDC Start-up (56%) and In-Business (60%) clients changed
their management practices/strategies as a result of the assistance they
received.
Figure 5.6 –SBDC –Changes in Management Practices/Strategies
Figure 5.6 compares SBDC client decisions to change management practices or strategies by business
segment. As a result of SBDC assistance, 56% of Start-up firms and 60% of In-business firms changed
their management practices or strategies. The levels of SBDC Start-up and In-Business clients that
changed their management practices were consistent with those for total OED Resource Partner clients.
56% 57%
60% 60%
52%
54%
56%
58%
60%
62%
SBDC Total OED Resource Partners
Start-up In-Business
SBDC: n=8,263 Total OED Resource Partners: n=15,820

Office of Entrepreneurial Development
Impact Study of Entrepreneurial Dynamics 2012
41
SBDC clients reported that the counseling they received led to the
development of business plans (37%) and marketing plans (31%).
Figure 5.7 – SBDC – Assistance in Plan Development
Figure 5.7 reflects the percentage of Start-up and In-Business firms that reported that SBDC face-to-face
counseling assistance led to the development of business plans (37%), marketing plans (31%), and
financial strategies (22%), etc. 32 The percentage of SBDC counseling clients that received assistance
with the plan development was higher in every category than the corresponding percentages for total
OED Resource Partners except hiring plan where those percentages were equal.
32
The 2011 results for the top 11 categories are displayed in the chart above. Additional results included: Purchasing and Production at 5%, Training and Distribution Strategy at 4%, and International Trade at 2%. Totals do not add to 100% due to non-response and multiple selections.
37%
31%
22% 20% 20%
16% 15% 14%
11% 11%
6%
34%
29%
20% 17% 19%
15% 13% 12%
8% 10%
6%
0%
5%
10%
15%
20%
25%
30%
35%
40%
SBDC Total OED Resource Partners
SBDC: n=8,263 Total OED Resource Partners: n=15,820

Office of Entrepreneurial Development
Impact Study of Entrepreneurial Dynamics 2012
42
SBDC In-Business client ratings of business/financial impact of assistance
exceeded both Start-up and total Resource client ratings.
Figure 5.8 – SBDC –Business/Financial Impact of Assistance
Figure 5.8 depicts that SBDC counseling assistance had greater business and financial impact on the In-
Business segment than on the SBDC Start-up segment in every category; and it had a greater impact on
SBDC client than total OED Resource Partner clients. Clients attributed these impacts to the counseling
they received, regardless of the type of assistance they were originally seeking.
36%
16%
20%
29%
41%
20%
26%
32%
34%
13%
14%
30%
0% 5% 10% 15% 20% 25% 30% 35% 40% 45%
Increase sales
Hire new staff
Retain current staff
Increase profit margin
Start-Up In-Business Total OED Resource Partners
SBDC: n=8,263 Total OED Resource Partners: n=15,820

Office of Entrepreneurial Development
Impact Study of Entrepreneurial Dynamics 2012
43
SBDC clients that received more hours of face-to-face counseling reported
higher levels of business/financial impact of counseling.
Figure 5.8A compares SBDC’s clients’ financial impact of counseling assistance on sales, profits, jobs, and
the hiring and retention of employees to the financial impact results for total OED Resource Partners by
hours of counseling received. The SBDC number of hours of counseling received is divided into three
categories: less than three hours, between three and five hours, and five or more hours; and these are
compared to the aggregated totals for all Resource Partners.
SBDC Clients who received five or more hours of counseling perceived greater impact of assistance than
total OED Resources in each category. For example, 45% of clients that received more than five hours of
counseling reported an increase in sales, and 37% of clients that received 5 or more hours reported an
increase in profit margins. Total OED Resource Partners reported 36% and 29% in the same categories,
respectively. These figures are reported for Start-up and In-Business clients only, because they are not
relevant for Nascent firms.
36%
16%
20%
29%
45%
22%
27%
37%
35%
21%
20%
28%
34%
4%
19%
27%
0% 10% 20% 30% 40% 50%
Increase sales
Hire new staff
Retain current staff
Increase profit margin
< 3 Hours Between 3 and 5 >5 Total OED Resource Partners
Figure 5.8A – SBDC–Impact of Financial of Assistance by Hours of Counseling

Office of Entrepreneurial Development
Impact Study of Entrepreneurial Dynamics 2012
44
This page intentionally left blank for two-sided printing.

Office of Entrepreneurial Development
Impact Study of Entrepreneurial Dynamics 2012
45
VI. SCORE vs. Total OED Resource Partners’ Face-to-Face
Counseling Clients
The following section presents results from 2011 clients that received face-to-face counseling from
SCORE. First, we report the general demographic and financial characteristics of SCORE clients. This is
followed by findings on the usefulness and financial impact of SCORE’s face-to-face counseling
assistance for Nascent, Start-up, and In-Business firms organized by research question as follows:
Is there a relationship between services/assistance provided by SCORE and the client’s perception of the usefulness and value of services/assistance received?
Is there a relationship between the services/assistance provided by SCORE and the client’s decision to implement and/or change management and/or marketing practices?
Is the service/assistance provided by SCORE having an impact on the client’s financial position in
terms of job creation, job retention and sales?
Office of Entrepreneurial Development
Impact Study of Entrepreneurial Dynamics 2012
46
SCORE 2011 Face-to-Face Counseling Clients’ Demographic Characteristics
This section describes the general demographic and firm characteristics of SCORE clients. These results
are based on an analysis of 7,217 completed surveys.
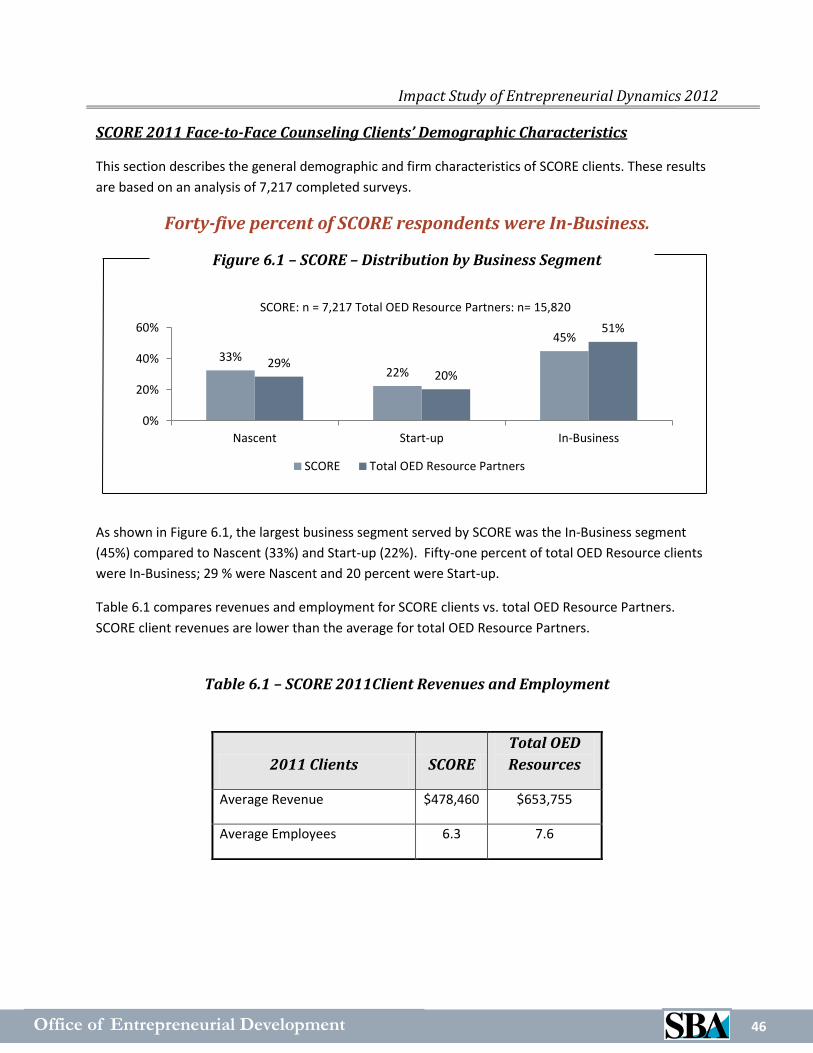
Forty-five percent of SCORE respondents were In-Business.
Figure 6.1 – SCORE – Distribution by Business Segment
As shown in Figure 6.1, the largest business segment served by SCORE was the In-Business segment
(45%) compared to Nascent (33%) and Start-up (22%). Fifty-one percent of total OED Resource clients
were In-Business; 29 % were Nascent and 20 percent were Start-up.
Table 6.1 compares revenues and employment for SCORE clients vs. total OED Resource Partners.
SCORE client revenues are lower than the average for total OED Resource Partners.
Table 6.1 – SCORE 2011Client Revenues and Employment
33% 22%
45%
29% 20%
51%
0%
20%
40%
60%
Nascent Start-up In-Business
SCORE: n = 7,217 Total OED Resource Partners: n= 15,820
SCORE Total OED Resource Partners
2011 Clients SCORE
Total OED
Resources
Average Revenue $478,460 $653,755
Average Employees 6.3 7.6

Office of Entrepreneurial Development
Impact Study of Entrepreneurial Dynamics 2012
47
SCORE counseled a large percentage of White firms (70%) and a mix of
Male (37%), Female (40%), and Male and Female (16%).
Figure 6.2 – SCORE – Demographic Characteristics33
Demographic characteristics of SCORE clients, including gender, race, ethnicity, and veteran status are
reported in Figure 6.2.34 The distribution of firms was compared to the national averages from the SBO.
The distribution was comparable across characteristics except for the following SBO figures: White
business owners were 83% of the small business population, female business owners were 29%, and
male business owners were 51%.
The demographic distribution of SCORE clients follows a similar demographic pattern to that of total
OED Resource Partners.
33
Because of non-response and multi-responses, the totals may not equal 100%. 34
The Veteran and Service-disabled Veteran categories are shown in the figure above. Additional results for SCORE clients included: Reservist and National Guard Member which are both less than 1%.
2%
9%
1%
2%
4%
7%
11%
71%
18%
37%
38%
2%
8%
1%
2%
4%
6%
12%
70%
16%
37%
40%
Service-Disabled Veteran
Veteran
Native Hawaiian or Pacific Islander
American Indian/Alaskan Native
Asian
Hispanic or Latino
Black /African American
White
Male and Female
Male
Female
SCORE: n=7,217 Total OED Resource Partners n=15,820
SCORE Total OED Resource Partners

Office of Entrepreneurial Development
Impact Study of Entrepreneurial Dynamics 2012
48
SCORE clients represented a similar age distribution as that of total OED
Resource Partner clients.
Figure 6.3 – SCORE – Age of Business Owner
Figure 6.3 shows the distribution of SCORE clients by age of business owner. The largest age group
served was between the ages of 45 and 54 (28%). SCORE clients’ age distribution was consistent with
that of total OED Resource Partners.
2%
15%
22%
28%
20%
5%
1%
2%
16%
22%
28%
19%
4%
1%
0% 5% 10% 15% 20% 25% 30%
18-24
25-34
35-44
45-54
55-64
65-74
75+
SCORE: n=7,217 Total OED Resource Partners: n=15,820
SCORE Total OED Resource Partners

Office of Entrepreneurial Development
Impact Study of Entrepreneurial Dynamics 2012
49
SCORE client distribution of type of business was consistent with that of
total OED Resource Partners across all categories.
Figure 6.4 – SCORE – Type of Business35
Figure 6.4 shows that the most common types of businesses served by SCORE were in Service (8%) and
Retail (7%).36 These results are mostly consistent with the national averages from the SBO. Results that
were not consistent included Manufacturing, reported in the SBO to be 2%; Construction, reported to be
13%; and Health Care, reported to be 9%. Also, the figure shows the share of SCORE clients in the
technology and restaurant was slightly lower than total OED Resources.
35
Due to non-responses and multiple business type selections, the total for all business types may not equal 100%.
36Additional results for each of the other categories were 2% or less including Finance, Insurance and Real Estate, Education,
Entertainment, Publishing, Transportation, Engineering, and Day Care.
14%
3%
2%
3%
3%
4%
6%
5%
8%
8%
14%
3%
2%
3%
2%
3%
6%
4%
7%
8%
0% 2% 4% 6% 8% 10% 12% 14% 16%
Other
Health and Wellness
Health Care
Construction
Resturant
Technology
Consulting
Manufacturing
Retail
Service
SCORE: n=7,217 Total OED Resource Partners: n=15,820
SCORE Total OED Resources

Office of Entrepreneurial Development
Impact Study of Entrepreneurial Dynamics 2012
50
SCORE 2011 Client Attitudes Regarding Face-to-Face Counseling Assistance
In this section we report on SCORE client attitudes regarding the usefulness and value that they received
from their face-to-face counseling and the impact of those attitudes based upon the hours of counseling
that they received. SCORE client attitudes are compared to those of total OED Resource Partners.
Seventy-six percent of SCORE Nascent clients, 72% of Start-ups, and 71%
of In-Business clients reported their counseling was useful or very useful.
Figure 6.5 – SCORE –Usefulness of Counseling Assistance 37
SCORE: n=7,217 Total OED Resource Partners: n= 15,820
Figure 6.5 shows ratings of usefulness of SCORE counseling provided by business segment compared to
total OED Resource Partners. More Nascent clients reported higher levels of usefulness regarding the
counseling assistance they received when compared to other business segments. Approximately 73% of
SCORE clients reported that the information they received from their counselors was valuable. This
percentage was calculated for SCORE clients overall, without regard to business segment and is lower
than the rating for overall total OED Resource Partners at 76%
37 Low value includes the ‘Somewhat Valuable’ and ‘Not Valuable’ response categories. High value includes the ‘Extremely Valuable’ and ‘Valuable’ response categories.
20% 18% 19% 16%
3% 3% 2% 3%
76% 72% 71% 76%
0%
10%
20%
30%
40%
50%
60%
70%
80%
Nascent Start-up In-Business Total OED ResourcePartners
Low Medium High

Office of Entrepreneurial Development
Impact Study of Entrepreneurial Dynamics 2012
51
Seventy-three percent of SCORE clients that received three or more hours
of face-to-face counseling found it useful.38
Figure 6.5A –SCORE – Usefulness of Assistance by Hours of Counseling
Figure 6.5A shows the perceived usefulness of SCORE assistance based upon the number of hours of
counseling received. Figure 6.5A shows that 73% of SCORE clients that received 3 or more hours of
counseling rated SCORE usefulness as “high” or “very high” compared to 69% of clients that received
less than 3 hours of counseling.
38
Low value includes the ‘Somewhat Useful’ and ‘Not Useful’ response categories. High value includes the ‘Very Useful’ and ‘Useful’ response categories.
22% 19%
16%
3% 3% 3%
69% 73%
76%
0%
10%
20%
30%
40%
50%
60%
70%
80%
<3 Hours 3 or More Hours Total OED Resource Partners
Low Medium High

Office of Entrepreneurial Development
Impact Study of Entrepreneurial Dynamics 2012
52
SCORE 2011 Clients’ Business and Financial Impacts of Face-to-Face Counseling
Assistance
In this section we report on the impact SCORE face-to-face counseling had on their clients’ business and
management practices/strategies as well as the financial outcomes that this counseling afforded them.
SCORE client impacts are compared to those of total OED Resource Partners.
Over half of SCORE In-Business (61%) and Start-up (57%) clients changed
their management practices/strategies as a result of the counseling they
received.
Figure – 6.6 SCORE –Changes in Management Practices/Strategies
SCORE: n=7,217 Total OED Resource Partners: n= 15,820
Figure 6.6 compares SCORE client decisions to change management practices or strategies by business
segment. As a result of SCORE assistance, 57% of Start-up firms changed their management practices or
strategies, and 61% of In-Business clients reported changing management practices or strategies. The
percentages of SCORE Start-up and In-Business clients that changed their management practices and
strategies were comparable to those for total OED Resource Partners.
57% 57%
61%
60%
54%
55%
56%
57%
58%
59%
60%
61%
62%
SCORE Total OED Resource Partners
Start-up In-Business

Office of Entrepreneurial Development
Impact Study of Entrepreneurial Dynamics 2012
53
SCORE clients reported that the counseling they received led to the
development of business plans (31%) and marketing plans (26%).
Figure 6.7 – SCORE – Assistance in Plan Development
SCORE: n=7,217 Total OED Resource Partners: n= 15,820
Figure 6.7 reflects the percentage of firms reporting that SCORE counseling assistance led to the
development of business plans, marketing plans, and financial strategies, etc.39 SCORE clients reported
receiving assistance somewhat less often than total OED Resources Partners for every category.
39
The 2011 results for the top 11 categories are displayed in the figure above. Additional results for included: distribution plan (4%), production plan (4%), hiring plan (4%), and training plan (3%).
31%
26%
18% 18% 15% 14%
12% 10% 9% 4% 4%
34%
29%
20% 19% 15% 17%
13% 12% 10%
8% 5%
0%
5%
10%
15%
20%
25%
30%
35%
40%
SCORE Total OED Resource Partners

Office of Entrepreneurial Development
Impact Study of Entrepreneurial Dynamics 2012
54
SCORE In-Business client ratings of business/financial impact of
assistance exceeded Start-up client ratings but were less than those for
total OED Resource Partner clients.
Figure 6.8 – SCORE – Business and Financial Impact of Assistance
SCORE: n=7,217 Total OED Resource Partners: n= 15,820
Figure 6.8 compares SCORE’s Start-up and In-Business clients in terms of the reported business and
financial impact of counseling assistance on sales, profits, jobs, and the retention and hiring of
employees irrespective of reasons for seeking assistance.40 Twenty-eight percent of Start-up clients
reported that they were able to increase sales as a result of SCORE assistance, compared to 36% for
total OED Resources. Twenty-four percent increased their profit margin; 19% of SCORE In-Business
clients reported that they were able to retain current staff and 16% hire new staff. SCORE clients
reported slightly lower impacts in every category and business segment compared to that of total OED
Resource Partners.
40
This comparison excludes the Nascent category for total OED Resources and SCORE.
36%
16%
20%
29%
32%
16%
19%
28%
28%
10%
11%
24%
0% 5% 10% 15% 20% 25% 30% 35% 40%
Increase sales
Hire new staff
Retain current staff
Increase profit margin
Start-Up In-Business Total ED Resources Partners

Office of Entrepreneurial Development
Impact Study of Entrepreneurial Dynamics 2012
55
SCORE Clients that received more hours of face-to-face counseling
reported higher levels of business/financial impact of counseling.
Figure 6.8A – SCORE – Impact of Assistance by Hours of Counseling
SCORE: n=7,217 Total OED Resource Partners: n= 15,820
Figure 6.8A compares SCORE’s financial impact of assistance for increasing sales, profits, jobs, and the
retention of employees to the financial impact results for total OED Resources by hours of counseling
received. The number of hours of counseling received is divided into two categories for SCORE: less
than 3 hours, and 3 or more hours. It is apparent from the figure above that the greater the number of
hours of counseling received, the greater the perceived impact of assistance in every category reported
by SCORE In-Business and Start-up clients.
36%
16%
20%
29%
39%
18%
21%
33%
26%
7%
13%
23%
0% 10% 20% 30% 40% 50%
Increase sales
Hire new staff
Retain current staff
Increase profitmargin
< 3 Hours 3 or More Hours Total ED Resource Partners

Office of Entrepreneurial Development
Impact Study of Entrepreneurial Dynamics 2012
56
This page intentionally left blank for two-sided printing.

Office of Entrepreneurial Development
Impact Study of Entrepreneurial Dynamics 2012
57
VII. WBC vs. Total OED Resource Partners’ Face-to-Face Counseling
Clients
The following section presents results from 2011 WBC face-to face counseling clients. First, we report
the general demographic and financial characteristics of WBC face-to-face counseling 2011 clients. This
is followed by findings on the usefulness of WBC counseling for Nascent, Start-up, and In-Business firms
organized by research question as follows:
Is there a relationship between services/assistance provided by WBC and the client’s perception of the usefulness and value of services/assistance received?
Is there a relationship between the services/assistance provided by WBC and the client’s decision to implement and/or change management and/or marketing practices?
Is the service/assistance provided by WBC having an impact on the client’s financial position in terms of job creation, job retention and sales?

Office of Entrepreneurial Development
Impact Study of Entrepreneurial Dynamics 2012
58
WBC 2011 Face-to-Face Counseling Clients’ Demographic Characteristics
This section describes the general demographic and firm characteristics of WBC clients. These results are
based on an analysis of 340 completed surveys.
Fifty-three percent of WBC respondents were In-Business
Figure 7.1 – WBC – Distribution Clients by Business Segment
As shown in Figure 7.1, the largest business segments served by WBC were In-Business (53%) and
Nascent (32%), which were higher percentages than those of total OED Resource Partners at 51% and
29% respectively. WBC percentage of Start-ups was smaller than that of total OED Resource Partners.
Table 7.1 compares revenues and employment for WBC clients vs. total OED Resources. WBC client
revenues were lower than the average for total OED Resource Partners. WBC provides counseling
services to the smallest firms among the OED Resource Partners.
Table 7.1 –WBC Client Revenues and Employment
32%
15%
53%
29% 20%
51%
0%
20%
40%
60%
Nascent Start-up In-Business
WBC: n = 340 Total OED Resource Partners: n= 15,820
WBC Total OED Resource Partners
2011 Clients WBC
Total OED
Resources
Average Revenue $157,341 $653,755
Average Employees 3.4 7.6

Office of Entrepreneurial Development
Impact Study of Entrepreneurial Dynamics 2012
59
WBC counsels a large percentage of White firms (73%) and a large
percentage of Female firms (67%).
Figure 7.2 – WBC –Demographic Characteristics41
Demographic characteristics of WBC clients, including gender, race, ethnicity, and veteran status are
reported in Figure 7.2.42 WBC serves a large proportion of Females (67%), a larger percentage of Female
clients than any other Resource Partner. The percentages of White clients (73%), Hispanic or Latino
clients (11%), and American Indian/Alaskan Native (4%) are also larger than those of total OED Resource
Partners at 71%, 7%, and 2% respectively. The WBC percentage of Asian clients is 2%; whereas total
OED Resource Partners share is 4%.
41
Because of non-response and multi-responses, the totals may not equal 100% .The WBC demographic distribution was compared to the national averages from the SBO. The distribution was comparable across characteristics except for the following SBO figures: White business owners were 83% of the small business population, Female business owners were 29%, and Male business owners were 51%.
42 The Veteran and Service-disabled Veteran categories are shown in the figure above. Additional results for WBC
clients included: Reservist and National Guard Member which are both less than 1%.
2%
9%
1%
2%
4%
7%
11%
71%
18%
37%
38%
2%
6%
0%
4%
2%
11%
9%
73%
14%
12%
67%
Service-Disabled Veteran
Veteran
Native Hawaiian or Pacific Islander
American Indian/Alaskan Native
Asian
Hispanic or Latino
Black /African American
White
Male and Female
Male
Female
WBC: n=340 Total OED Resource Partners n=15,820
WBC Total OED Resource Partners

Office of Entrepreneurial Development
Impact Study of Entrepreneurial Dynamics 2012
60
Twenty-five percent of WBC clients were in the 45- 54 age group, followed
by 23% for ages 35-44.
Figure 7.3 – WBC – Age of Business Owner
Figure 7.3 shows the distribution of WBC clients by age of business owner. The largest age group served
was between the ages of 45 and 54 (25%). WBC served a larger percentage of clients aged 35-44 (23%)
and 23-34 (17%) than total OED Resource Partners at 22% and 15% respectively.
2%
15%
22%
28%
20%
5%
1%
1%
17%
23%
25%
21%
6%
1%
0% 5% 10% 15% 20% 25% 30%
18-24
25-34
35-44
45-54
55-64
65-74
75+
WBC: n=340 Total OED Resource Partners: n=15,820
WBC Total OED Resource Partners

Office of Entrepreneurial Development
Impact Study of Entrepreneurial Dynamics 2012
61
WBC clients reported a higher percentage of “other” (18%) for business
type than total Resource Partner clients (14%).
Figure 7.4 – WBC ‒Type of Business43
The most common businesses counseled by WBC were Service (6%) and Retail (9%).44 The highest
response was “other” and the largest number of business types reported in “other” was non-profit,
design/art related, beauty-related and handyman/painting. WBC results are generally consistent with
the national averages from the SBO. Results that were not consistent included Manufacturing, reported
in the SBO to be 2%; Construction, reported to be 13%; and Health Care, reported to be 9%. Also, the
figure shows that the share of WBC clients in the technology and restaurant industries was lower than
total OED Resource Partners.
43
Due to non-responses and multiple business type selections, the total for all business types may not equal 100%.
44The top 10 categories for 2011 clients are displayed in the figure above. Additional results include: 2% or less
including Finance, Insurance and Real Estate, Education, Entertainment, Publishing, Transportation, Engineering, and Day Care.
14%
2%
3%
3%
4%
6%
5%
8%
8%
18%
2%
1%
2%
1%
4%
3%
9%
6%
0% 2% 4% 6% 8% 10% 12% 14% 16% 18% 20%
Other
Health Care
Construction
Resturant
Technology
Consulting
Manufacturing
Retail
Service
WBC: n=340; Total OED Resource Partners: n=15,820
WBC Total OED Resource Partners

Office of Entrepreneurial Development
Impact Study of Entrepreneurial Dynamics 2012
62
WBC 2011 Client Attitudes Regarding Face-to-Face Counseling Assistance
In this section we report on WBC clients’ attitudes regarding the usefulness and value that they received
from their face-to-face counseling and the impact of those attitudes based upon the hours of counseling
that they received. WBC client attitudes are compared to those of total OED Resource Partners.
Eighty-four percent of Start-ups, 78% of In-Business, and 75% of Nascent
reported that WBC counseling was useful or very useful.
Figure 7.5 – WBC – Usefulness of Counseling Assistance45
Figure 7.5 shows ratings of usefulness of WBC counseling provided by business segment compared to
total OED Resource Partners. For WBC clients, a high percentage of Start-up clients (84%) reported their
counseling was useful or very useful, 78% of In-Business, and 75% of Nascent also reported that WBC
counseling was useful or very useful.
Approximately 79% of WBC clients reported that the information they received from their counselors
was useful.46
45 Low value includes the ‘Somewhat Useful/Valuable’ and ‘Not Useful/Valuable’ response categories. High value
includes the ‘Extremely Useful/Valuable’ and ‘Useful/Valuable’ response categories.
46
This result does not appear in the figure above, which is displayed by business segment. This percentage was calculated for SCORE clients overall, without regard to business segment.
16%
6% 10%
16% 7%
2% 5% 3%
75% 84%
78% 76%
0%
20%
40%
60%
80%
100%
Nascent Start-up In-Business Total OED ResourcePartners
Low Medium High

Office of Entrepreneurial Development
Impact Study of Entrepreneurial Dynamics 2012
63
Seventy-eight percent of WBC clients that received three or more hours of
counseling found it useful or very useful.
Figure 7.5A –WBC – Usefulness of Assistance by Hours of Counseling
Figure 7.5A shows the perceived usefulness of WBC assistance based upon the number of hours of face-
to-face counseling received. Figure 7.5A shows that 78% of WBC clients that received 3 or more hours
of counseling rated WBC usefulness as “high” or “very high” compared to 75% of clients that received
less than 3 hours of counseling.
14% 11% 16%
6% 5% 3%
75% 78% 76%
0%
10%
20%
30%
40%
50%
60%
70%
80%
90%
<3 Hours 3 or More Hours Total OED Resource Partners
Low Medium High

Office of Entrepreneurial Development
Impact Study of Entrepreneurial Dynamics 2012
64
WBC 2011 Clients’ Business and Financial Impacts of Face-to-Face Counseling
Assistance
In this section we report on the impact WBC face-to-face counseling had on its clients’ management and
business practices and as well as the financial outcomes that this counseling afforded them. WBC client
impacts are compared to those of total OED Resource Partners.
Seventy-five percent of WBC Start-up clients and fifty-nine percent of In-
Business clients changed their management practices/strategies as a
result of the counseling they received.
Figure 7.6 –WBC –Changes in Management Practices/Strategies
Figure 7.6 compares WBC client decisions to change management practices or strategies by business
segment. As a result of WBC assistance, 75% of Start-up clients changed their management practices or
strategies, and 57% of In-Business clients reported changing management practices or strategies.
75%
57% 59% 60%
0%
10%
20%
30%
40%
50%
60%
70%
80%
WBC Total OED Resource Partners
Start-up In-Business
WBC: n=340 Total OED Resource Partners: n=15,820
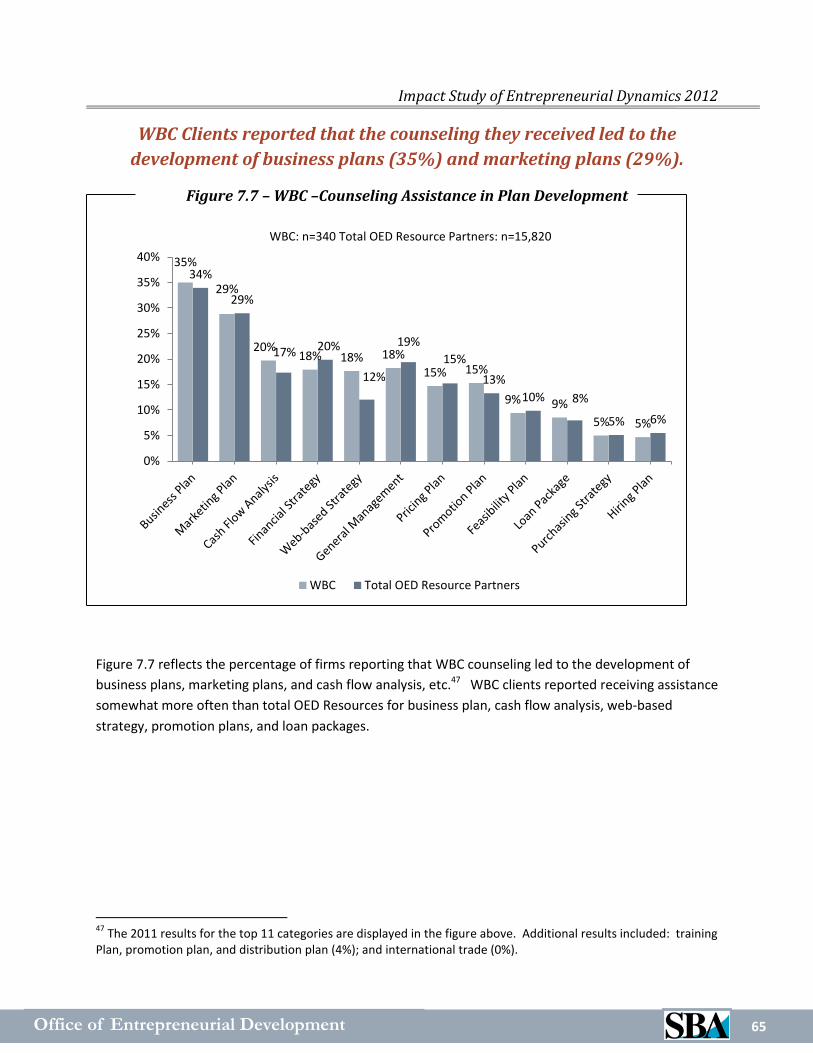
Office of Entrepreneurial Development
Impact Study of Entrepreneurial Dynamics 2012
65
WBC Clients reported that the counseling they received led to the
development of business plans (35%) and marketing plans (29%).
Figure 7.7 – WBC –Counseling Assistance in Plan Development
Figure 7.7 reflects the percentage of firms reporting that WBC counseling led to the development of
business plans, marketing plans, and cash flow analysis, etc.47 WBC clients reported receiving assistance
somewhat more often than total OED Resources for business plan, cash flow analysis, web-based
strategy, promotion plans, and loan packages.
47
The 2011 results for the top 11 categories are displayed in the figure above. Additional results included: training Plan, promotion plan, and distribution plan (4%); and international trade (0%).
35%
29%
20% 18% 18% 18%
15% 15%
9% 9%
5% 5%
34%
29%
17% 20%
12%
19%
15%
13%
10% 8%
5% 6%
0%
5%
10%
15%
20%
25%
30%
35%
40%
WBC Total OED Resource Partners
WBC: n=340 Total OED Resource Partners: n=15,820

Office of Entrepreneurial Development
Impact Study of Entrepreneurial Dynamics 2012
66
WBC In-Business clients were able to increase sales (39%) and profit
margins (34%) as a result of the counseling they received.
Figure 7.8 – WBC – Business and Financial Impact of Assistance
Figure 7.8 compares WBC’s Start-up and In-Business clients in terms of the business and financial impact
of counseling assistance on sales, profits, jobs, and the retention and hiring of employees irrespective of
reasons for seeking assistance.48 Thirty-seven percent of Start-up clients reported that they were able
to increase sales as a result of WBC assistance and 31% increased profit margins. Thirty-nine percent of
In-Business clients increased sales and 34% increased their profit margin. Only 12% and 10% of Start-up
clients reported impact on retaining current staff or hiring new staff respectively.
48
This comparison excludes the Nascent category for WBC and total OED Partner Resources as they as not relevant.
36%
16%
20%
29%
39%
15%
22%
34%
37%
10%
12%
31%
0% 5% 10% 15% 20% 25% 30% 35% 40% 45%
Increase sales
Hire new staff
Retain current staff
Increase profit margin
Start-Up In-Business Total OED Resource Partners
WBC: n=340 Total OED Resource Partners: n=15,820

Office of Entrepreneurial Development
Impact Study of Entrepreneurial Dynamics 2012
67
WBC Clients that received more than three hours of counseling reported
higher levels of business/financial impacts.
Figure 7.8A – WBC – Business and Financial Impact of Assistance
by Hours of Counseling
Figure 7.8A examines WBC’s financial impact of counseling assistance for increasing sales, profits, jobs,
and the retention and hiring of employees to the financial impact results for total OED Resources by
hours of counseling received. The number of hours of counseling received is divided into two categories
for WBC: less than three hours, and three or more hours. Clients that received more than 3 hours of
counseling reported greater impact than that of total OED Resource Partners in every category except
hiring new staff.
36%
16%
20%
29%
42%
15%
25%
39%
36%
7%
16%
28%
0% 5% 10% 15% 20% 25% 30% 35% 40% 45%
Increase sales
Hire new staff
Retain current staff
Increase profit margin
< 3 Hours 3 or More Total OED Resource Partners

Office of Entrepreneurial Development
Impact Study of Entrepreneurial Dynamics 2012
68
This page intentionally left blank for two-sided printing.

Office of Entrepreneurial Development
Impact Study of Entrepreneurial Dynamics 2012
69
VIII. IMPACTS OF CLIENT AND FIRM CHARACTERISTICS
In the results presented in this section, statistically-significant predictor variables are identified.49
Detailed regression results are presented in Appendix 6.
The first regression model tested for a relationship between selected firm and client characteristics
and the client’s perception of the usefulness of the services/assistance received. 50
Results of this regression suggest that larger firms reported higher levels of perceived usefulness of
OED resource assistance than smaller firms. Additionally, firms who received less than 3 hours of
assistance reported lower levels of perceived usefulness than firms with 3 or more hours of counseling.
Nascent and Start-up segments also reported significantly higher perceived usefulness from OED
resource assistance than firms in the In-Business segment; however the difference between In-Business
and Nascent segments was marginal. WBC clients reported higher perceived usefulness compared with
SCORE clients. No significant difference was found when comparing SBDC clients to either WBC or
SCORE clients.
In terms of client demographics, there were no differences in perceived usefulness based on age or
ethnicity. Males reported lower perceived usefulness from counseling compared with respondents
reporting both male and female ownership, while female owners reported higher perceived
usefulness. The perceived usefulness of counseling was lower for veterans. Clients in urban locations
reported lower perceived usefulness than those clients located in the suburbs or rural areas, although
the difference between rural and urban clients was marginal. Black and white clients reported
significantly higher perceived usefulness compared with all other races, but there were no other
differences based on race.
The second regression model tested for a relationship between selected firm and client characteristics
and perceived OED resource assistance with the decision to start a business.51 This model was not
49
Relationships are considered statistically-significant at the 0.05 level. Marginal significance is defined as significant at the 0.10 level. 50
The overall model was statistically significant at the p<0.01 level, although the R2, a measure of model fit, was
very small (0.0328). Coefficients reported here were significant at the 0.10 level. The usable sample size was 5,606. Firms with revenue greater than 25 million and less than $1,000 were removed from all regression analyses, as were firms with unknown business segment. 51
This model was estimated using a logistic regression analysis due to the binary dependent variable. The overall model was not significant, even at the p<0.50 level. Only responses from nascent and start-up clients were included.

Office of Entrepreneurial Development
Impact Study of Entrepreneurial Dynamics 2012
70
significant, even at a 0.10 level. However, when a more parsimonious model is fit with only the
significant variables from the larger model, a significant overall fit is found.52
This simpler model shows firms receiving less counseling were less likely to report starting a business
as a result of assistance. The odds of a male reporting the decision to start a business as the result of
assistance was lower than responses from both male and female business owners; however females
reported the opposite results of assistance.
The third regression model tested for a relationship between selected firm and client characteristics
and the self-reported financial impact of OED resource assistance.
These impacts include a combination of increases in sales, cash flow, hiring of new employees and
profits.53 Larger firms and firms receiving 3 or more hours of counseling were reported higher
financial impacts. Compared with In-Business clients, Start-up clients reported higher financial
impacts. Additionally, female firm owners and owners under 54 were more likely to report higher
financial impacts. No significant difference was found with male clients. However urban businesses
reported lower financial impacts when compared with suburban and rural clients, although the
difference between urban and rural clients was marginal. Businesses owned by black individuals
reported relatively lower positive financial impacts, but no other differences were found by race.
These regression analyses indicate that both firm and client characteristics can be significant
determinants of the perception of the usefulness of the assistance received and its financial impact.
Variations in perceived usefulness, assistance with the decision to start a business, and financial impacts
are due in part to differences in firm size, OED Resource, and hours of assistance. Unlike previous
analyses geographic location played a significant role in all but one model. In addition, in some cases,
there were significant effects of gender, age, and race, but never ethnicity.
There were two consistent findings across all of the significant models. First, clients receiving 3 or
more hours of counseling were more likely to report positive results than those receiving less. And
second, female clients were the most likely to report positive results. Additionally, clients with higher
sales have an increased perceived usefulness and reported an increased financial impact. These
increased usefulness and financial impact results also hold for rural or suburban locations compared
with urban locations as well as for start-up businesses compared with those already in business.
52
This model was estimated using a logistic regression analysis due to the binary dependent variable with hours of counsel and gender as independent variables. The overall model was significant at the p<0.01 level, while the pseudo R
2, a measure of model fit, was very small (0.0191). Only responses from Nascent and Start-up clients were
included and thus there was a relatively low usable sample size of 811. Coefficients discussed were significant at the 0.10 level. 53
The overall model was significant at the p<0.01 level, but the R2 was very small (0.0383). The usable sample size
was 5,509. Coefficients reported here were significant at the 0.10 level.

Office of Entrepreneurial Development
Impact Study of Entrepreneurial Dynamics 2012
71
IX. Summary of Client Comments
A few of the survey questions enabled OED Resource Partner clients to enter open-ended responses. Clients expressed both positive and negative experiences with their face-to-face counseling. Overall more clients had positive than negative comments about their experiences. This section reviews these findings in more detail. Among the positive comments received, clients communicated several themes:
Counselors helped many clients gain structure in their business through planning, enhancing organization, focusing goals, or solidifying strategy.
Information provided by counselors was well informed and relevant.
Counselors were genuinely interested in providing guidance to the client.
Counselors provided encouragement, instilling a sense of confidence in clients and in their businesses.
Counselors helped many clients plan for the future. When asked what the result of the assistance
received from SBDC, SCORE or WBC, one respondent wrote that the resource provided “more help than
I can list!” Another praised the guidance from their counselor, saying it left them with a “new plan
altogether.” A third highlighted the value her business gained from her experience, saying “I believe I
will quadruple my revenue.”
Several clients found OED Resource Partner counselors to be both well informed and genuinely
interested in helping them. One respondent wrote that “the staff was very knowledgeable of subject
matter;” while another said “the counselor took a keen interest in my progress.” Many respondents
praised their counselors, describing them with words like “extremely helpful,” “insightful,” and
“excellent.”
Clients repeatedly cited “confidence” or “motivation” as key result of their experience with SBDC, SCORE
or WBC. When asked to indicate the impact of counseling on their business, one client considered the
experience delivered “very motivating and helpful emotional support.” Another said “I was highly
encouraged by the helpful mentoring.”
The survey also revealed negative feedback regarding clients’ experience with OED Resource Partners.
Among the negative comments:
The most common complaint related to the counselor’s unavailability or unresponsiveness to the client in regard to meetings or other requests.

Office of Entrepreneurial Development
Impact Study of Entrepreneurial Dynamics 2012
72
Some clients mentioned dissatisfaction with the relevancy of information provided by the counselor or felt that their counselors lacked subject matter or industry knowledge.
The majority of negative feedback stemmed from clients who had difficulty arranging a meeting with
their counselors. Many complained that they reached out to a counselor, but there was no follow up on
the part of the counselor, as one client lamented, “I contacted a counselor several months ago and have
not yet heard back” or as another said, “I was never called back.” One client was able to set up a
meeting with their counselor, but then the “advisor failed to show up to the appointment.”
Other instances of dissatisfaction arose when a client felt that his/her counselor was not knowledgeable
on the issues that were relevant to the business. One respondent complained, “I was better educated
than the counselor on the topic.” Some used words like “weak,” “worthless,” and “a disappointment” to
describe the guidance provided by SBDC, SCORE or WBC. In a few extreme cases, clients called the
advice provided to them “horrible.”
As stated earlier, this assessment is based on the written comments provided by OED Resource Partner
face-to-face counseling clients while answering the survey. Our analysis revealed that most clients had a
positive experience and a much small number had a negative experience as demonstrated in the
percentage of clients that provided high “usefulness” ratings for their counseling experience.

Office of Entrepreneurial Development
Impact Study of Entrepreneurial Dynamics 2012
73
X. Follow-up Study of 2010 clients
Methodology and Analysis
A follow-up study was conducted of 2010 clients in order to evaluate the business and financial impacts
on this group one year after being counseled by OED Resource Partners. There were 10,146 clients from
2010 that were contacted for follow-up in early 2012. Twenty-one hundred and seventy-three clients
responded, which represents a 21% response rate. Each of these respondents had valid client codes
that were matched on a one-to-one basis with the initial impact survey respondents. Thus, for a sample
of 2,173 clients, there were detailed data which could be tracked over one year.
Table 10.1 – Follow-up Impact Study Clients
Client Year Stratified
Sample
Useable
Sample
Surveys
Received
Response
Rate
2010 10,146 10,146 2,173 21%
These matched samples were used to perform pair-wise statistical tests that compared changes in
growth by business segment and by OED Resource Partner. Although a pair-wise approach results in a
smaller number of available observations to analyze, it provides a more precise estimate of changes in
revenues and employment over time than aggregate, non-matched/cross-sectional comparisons.
Limitations
There are several limitations that should be considered when interpreting the results presented in this
report. These limitations are inherent in the research design and methodology.
Measures included in this initial survey are primarily attitudinal and all items are self-reported. Thus, there are few objective measures that can be used to assess actual client performance or make comparisons with other data sources.
Many respondents did not report revenue data, which is critical to measuring growth from year-to-year. For example, out of Start-up and In-Business firms, approximately 42% reported zero revenues or did not report revenues.
Estimates of firm survival and growth over time should be interpreted with caution. Due to attrition, firms which have gone out of business may be under-represented.

Office of Entrepreneurial Development
Impact Study of Entrepreneurial Dynamics 2012
74
In this section, Concentrance reports findings from our analysis of follow-up surveys of FY2010 OED
Resource Partners’ face-to-face counseling clients. These follow-up surveys (see Appendix 5 for the
Follow-up survey) were conducted in order to examine the impact of OED Resource Partners’ counseling
assistance over time. The follow-up study of these FY2010 clients is the first follow-up survey of these
clients. The follow-up survey results of FY2009 clients, conducted last year, are also reported to give a
baseline comparison.
This key research questions addressed in this year’s analysis are:
1. What was the rate of transition of Nascent and Start-up firms to the In-Business segment?
2. Based on a comparison with the Panel Study of Entrepreneurial Dynamics54 (PSED II), what is the impact of OED Resource Partner counseling assistance on firm survival?
3. Does OED Resource Partner counseling assistance have a positive impact on firm
survival?
4. What impact do client and firm characteristics have on survival?
5. What was the financial impact of services/assistance provided by SBA OED Resource Partners in terms of job creation, job retention and sales?
6. How does the growth of OED Resource Partners clients compare with gross domestic product (GDP)?
The analysis of the data show:
There was a slight increase in 2010 Nascent clients who went into business the following year compared to 2009 Nascent clients at their one year follow up. In addition, a substantial share of 2010 Start-up and In-Business clients remained in business in 2011.
2010 clients reported a higher survival rate when compared with the PSED II, although there was a slight decrease in the overall survival rate of 2010 clients versus 2009 clients.
The marginal benefit of receiving three or more hours of counseling in 2009 is not evident in 2010 clients; this reversal can be accounted for by the size of the In-Business segment of 2010 clients.
54
The Panel Study of Entrepreneurial Dynamics is a nationwide, multi-million dollar survey of nascent entrepreneurs funded by the Kauffman Foundation. The primary purpose of the study is to identify adults active in business creation, obtain detailed information about the start-up effort, and perform follow-up interviews to determine outcomes. We rely on the PSED II as a benchmark; however, results must also be interpreted with caution due to potential response bias and definitional differences in the ways that firms are classified.

Office of Entrepreneurial Development
Impact Study of Entrepreneurial Dynamics 2012
75
The survival rates for 2010 Clients’ age groups were higher than for 2009 clients, except for those aged 65+; In addition, the difference in survival rates between White non-Hispanic/Latino with the remainder of the population decreased for 2010 clients when compare to 2009 clients.
Matched 2010 clients reported an increase in revenue from the initial survey to the follow-up. Overall, these clients reported an increase in total employees from the initial survey to the follow-up.
OED Resource Partner client growth outpaced GDP.

Office of Entrepreneurial Development
Impact Study of Entrepreneurial Dynamics 2012
76
Each year a substantial proportion of Start-up SBDC, SCORE and WBC
firms were able to transition to In-Business.
Figure 10.1 shows the movement of firms from their initial segments to the In-Business segment in
2011. There was a slight increase in 2010 Nascent clients reporting being in business in 2011, while a
significant number of 2010 Start-up and In-Business clients were In-Business in 2011.55
For example, 30.3% of 2010 Nascent clients had started businesses by 2011. This figure is slightly up
from the 28.9% of 2009 Nascent clients who started businesses by 2010. Overall, the results are
relatively flat when comparing 2009 clients to 2010 clients. For 2010 clients that were initially in the In-
Business segment, 95.6% remained in business in 2011. This is slightly lower than the 96.9 % reported
for 2009 In-Business clients. Figure 8.1 also shows little change between 2009 clients and 2010 clients
with respect to the transition rates of Start-up firms to reporting being In-Business firms.
55
Segments are defined as follows: Nascent included those who have not yet started a business; Start-up firms have been in
business for one year or less; In-Business firms have been operating for more than one year.
Nascent 28.9%
Nascent 30.3%
Start-up 91.0%
Start-up 90.3%
In-Business 96.9%
In-Business 95.6%
0.0%
50.0%
100.0%
2009 Clients 2010 Clients
% in
bu
sin
ess
the
follo
win
g ye
ar
Figure 10.1 – 2009 and 2010 Client Transition and Survival to
In-Business in 2011 1 1 1
2009 n=1,968 2010 n=2,173

Office of Entrepreneurial Development
Impact Study of Entrepreneurial Dynamics 2012
77
The ability of SBA OED Resource Partner clients to survive and remain in
business exceeds industry benchmarks for small businesses.
Figure 10.2 compares the survival rates for firms in the Follow-up Study with those in the PSED II.
These results suggest that businesses that received OED Resource Partner face-to-face counseling
assistance had a higher survival rate than other small businesses such as those randomly sampled
for the PSED II.
For example, in the Follow-up Study of FY2010 clients, 94.3% of these firms remained in business
after one year. Although this is lower than FY2009 clients (95.8%), the rate is still higher than the
PSED II survey respondents that reported a 90% survival rate.
95.8%
94.3%
90.0%
84.0%
86.0%
88.0%
90.0%
92.0%
94.0%
96.0%
98.0%
100.0%
2009 Clients 2010 Clients PSEDII
On
e Ye
ar S
urv
ival
Rat
es
Figure 10.2 –2009 and 2010 Client Survival vs. PSED II
2009 n=1,968 2010 n=2,173

Office of Entrepreneurial Development
Impact Study of Entrepreneurial Dynamics 2012
78
A small benefit of receiving three or more than hours of face-to-face
counseling can be seen in the Start-up segment for 2010 clients.
Figure 10.3 shows the survival rate of OED Resource Partner clients by hours of counseling for the first
follow-up of 2009 and 2010 clients. There was a negligible decrease in survival by 2010 clients that
received three or more hours of counseling when compared with those who received less. Examining
this finding further in Figure 10.3A, the 2010 Start-up clients appear to have achieved a marginal benefit
from receiving more assistance, while the 2010 In-Business clients may have offset that benefit.
< 3 hours 95.1% < 3 hours
94.5%
3 + hours 96.1% 3 + hours
94.2%
86.0%
88.0%
90.0%
92.0%
94.0%
96.0%
98.0%
2009 2010
Surv
ival
Rat
e b
y C
lien
t Ye
ar
< 3 94.5%
< 3 96.4%
< 3 89.9%
3 >= 94.2%
3 >= 95.3%
3 >= 90.5%
86.0%
88.0%
90.0%
92.0%
94.0%
96.0%
98.0%
Total In-Business Start-up
20
10
Clie
nt
Year
: S
urv
ival
Rat
es
Figure 10.3 – 2009 and 2010 Client Survival by Hours of
Counseling
Figure 10.3A – 2010 Client Segment Survival by Hours of
Counseling

Office of Entrepreneurial Development
Impact Study of Entrepreneurial Dynamics 2012
79
Client survival rate was highest for groups aged 45-54 and 55-64.
Figure 10.4A shows that for all age groups under 65, survival rates for 2010 clients were slightly above
2009 clients; and for the 65+ age group, there was a marked decrease in 2010 clients reporting to be In-
Business, while for 2009 clients there was a discernible increase.
The gap between survival rates for White vs. Not-White clients is
decreasing. Figure 10.4B - 2009 and 2010 Client Survival and Race
Figure 10.4B shows that the difference of survival rates between White non-Hispanic/Latino with the
remainder of the population decreased from 3.4 percentage points to 1.2 percentage points when
comparing 2009 clients with 2010 clients.
2009 7% 2010
5%
2009 96.2%
2010 92.6%
0%
5%
10%
15%
20%
25%
30%
35%
40%
45%
50%
86.0%
88.0%
90.0%
92.0%
94.0%
96.0%
98.0%
< 35 35-44 45-54 55-64 65 +
Distrib
utio
n Su
rviv
al R
ate
Age Group
2009 %Total 2010 %Total 2009 Survival 2010 Survival
96.6% 94.7%
93.2% 93.5%
88.0%
93.0%
98.0%
2009 Clients 2010 Clients
Surv
ival
Rat
e
White (NonHispLatino) Not White
Figure 10.4A - 2009 and 2010 Client Survival by Age Group
by Age Group

Office of Entrepreneurial Development
Impact Study of Entrepreneurial Dynamics 2012
80
Firms owned by members of both genders survived longer than firms
owned by a male or a female.
Figure 10.4C shows that for both 2009 and 2010 clients, the survival rate for female owners is marginally
higher than the survival rate for male owners. 2010 clients could respond that the owners were both
male and female, so making comparisons from 2009 to 2010 is tenuous.
Figure 10.4D shows survival by client year and business location. 2010 urban clients experienced an
increase in survival rates compared with suburban or rural clients and compared with 2009 urban
clients.
Male 95.7%
Male 94.3%
Female 95.9% Female
94.6%
Both 96.5%
88.0%
90.0%
92.0%
94.0%
96.0%
98.0%
100.0%
2009 2010
Surv
ival
Rat
e
Rural 95.6% Rural
94.9%
Suburban 96.2%
Suburban 94.4%
Urban 95.0%
Urban 95.6%
88.0%
90.0%
92.0%
94.0%
96.0%
98.0%
100.0%
2009 2010
Surv
ival
Rat
e
Figure 10.4C - 2009 and 2010 Client Survival by Gender
Figure 10.4D - 2009 and 2010 Client Survival by Location

Office of Entrepreneurial Development
Impact Study of Entrepreneurial Dynamics 2012
81
2010 Total OED Resource Partner clients reported increases in revenues
and employees.
$778,157
$947,325 7.5
9.7
0.0 $-
$200,000
$400,000
$600,000
$800,000
$1,000,000
2010 Initial 2010 Follow-up
SBD
C:
Mea
n R
even
ues
(E
mp
)
Rev Emp
(10)
(8)
(6)
(4)
(2)
Figure 10.5 – 2009 and 2010 Client Revenues and Employees:
Figure 10.5A – 2010 SBDC Client Revenues and Employees
640,162
794,057 6.8
8.5
0.0
10. 0
$-
2010 Initial 2010 Follow-up
789,612
667,019
8.6 9.4
0.0 $-
$200,000
$400,000
$600,000
$800,000
$1,000,000
2009 Initial 2009 Follow-up
Mea
n R
even
ues
(E
mp
)
Rev Emp
(10)
(8)
(6)
(4)
(2)

Office of Entrepreneurial Development
Impact Study of Entrepreneurial Dynamics 2012
82
We assessed the financial impact of the face-to-face counseling provided by OED Resource Partners in
terms of job creation, retention and sales by measuring the mean revenues and employees of matched
pairs of follow-up clients from 2010 and 2009.
$504,425
$592,605
5.6
6.7
0.0 $-
$200,000
$400,000
$600,000
$800,000
$1,000,000
2010 Initial 2010 Follow-up
SCO
RE:
Mea
n R
even
ues
(E
mp
)
RevEmp
(10)
(8)
(6)
(4)
(2)
$171,293 $172,433
6.1
5.2
0.0 $-
$200,000
$400,000
$600,000
$800,000
$1,000,000
2010 Initial 2010 Follow-up
WB
C: M
ean
Re
ven
ues
(E
mp
)
Rev
(10)
(8)
(6)
(4)
(2)
Figure 10.5B – 2010 SCORE Client Revenues and Employees
Figure 10.5C – 2010 WBC Client Revenues and Employees

Office of Entrepreneurial Development
Impact Study of Entrepreneurial Dynamics 2012
83
Figure 10.5 series compares 2010 clients in terms of mean annual revenues and number of employees
in the initial and follow-up study with those of the 2009 clients. According to this matched comparison,
2010 client mean revenues rose from an initial level of $640,000 to $794,000 by early in 2012. Mean
employees rose from 6.8 to 8.5 over the same period. These results show a reverse trend when
compared with 2009 clients who reported decreased revenue and increased employees from the initial
survey to the follow-up.56
This analysis was repeated for each OED Resource Partner of 2010 clients. Figures 10.5 A-C compare
firms in terms of mean annual revenues and number of employees in the initial 2010 survey as well as in
the follow-up survey.
According to this matched comparison, mean revenues and employees consistently increased OED
Resource Partner clients except for WBC counseling clients.
56
Revenues from Nascent and unknown business segments are not included. In addition, Start-up or In-Business Firms with revenues below $1,000 and more than $25 million were excluded from this analysis and firms with reported employees below 1 and above 998 were excluded from the employee calculations.

Office of Entrepreneurial Development
Impact Study of Entrepreneurial Dynamics 2012
84
Seventy-three percent of 2120 OED Resource Partner clients experienced
revenue growth by their first follow-up.
Figure 10.6 – 2009 and 2010 Client Change in Mean Revenues
Figure 10.6 provides additional detail on the change in revenues for 2009 and 2010 clients. For example,
73.1% of 2010 clients experienced revenue growth by early 2012; this is an increase when compared
with 2009 clients at their first follow-up. On the other side, 26.8% of 2010 clients experienced declining
revenues over this period. Compared with 32.0% of 2009 clients for their first follow-up in early 2011,
this is a decrease in clients experiencing negative growth from the initial study to the follow-up.
2009 Clients 33.1%
2009 Clients 34.9%
2009 Clients 32.0%
2010 Clients 36.1%
2010 Clients 37.1%
2010 Clients 26.8%
0.0% 10.0% 20.0% 30.0% 40.0%
More than50% growth
Up to50% growth
Negativegrowth
% Follow-up Respondents
% C
han
ge in
Rev
enu
es

Office of Entrepreneurial Development
Impact Study of Entrepreneurial Dynamics 2012
85
SBA OED Resource Partner clients’ growth exceeded economic benchmark.
Figure 10.7 – 2010 Client Revenue Growth Compared to GDP
Percent Change from Previous Year
The OED Resource Partner sample outpaced the economy overall. Figure 10.7 compares growth of OED
Resource Partner clients57 to GDP58. The overall economy has experienced growth over this time period,
as have OED Resource Partner clients. A comparison between these two growth rates show SBA OED
Resource clients are growing faster overall than GDP, in addition SBA OED Resource clients have
experienced growth at an increasing rate.
57
SBA OED figures are based on Start-up or In-Business firms’ mean revenues from the 2009 and 2010 clients compared with their matched follow-up surveys. Clients with revenue less than $1000 or greater than $25 million in either survey were excluded. 58 Source: http://www.bea.gov/national/xls/gdpchg.xls
GDP 4.2%
3.9%
SBA ED 8.2%
9.6%
0.0%
2.0%
4.0%
6.0%
8.0%
10.0%
12.0%
2010 Growth Rate 2011 Growth Rate

Office of Entrepreneurial Development
Impact Study of Entrepreneurial Dynamics 2012
86
Summary of Follow-up Study Findings
Firm Survival
Approximately 30% of 2010 Nascent clients had transitioned to the In-Business segment after 1 year. At
the same time, 10% of 2010 Start-up and 4% of In-Business clients went out of business by 2011 (See
Figure 10.1).
In addition, 2010 clients receiving more than 3 hours of counseling did not have a higher survival rate
than those receiving less counseling. All age groups of 2010 clients had survival rate higher than 2009
clients with the exception of the 65+ group. Examining the survival rates of White non-Hispanic/Latino
with the remainder of the population, the difference decreased from 3.4 percentage points to 1.2
percentage points when comparing 2009 clients with 2010 clients.
Based on a comparison to firms in the PSED, businesses who received OED Resource Partner face-to-
face counseling had a higher survival rate than other small businesses. For example, the survival rate
after one year was 94.3% for ED Resource clients, compared to 90% for firms in the PSED (See Figure
10.2).
Financial Impact and Growth
These analyses showed that OED Resource Partner counseling had a significant impact on the revenue
and employment growth of small business clients. The overall rate of revenue growth for 2010 clients is
9.6%, which is outpacing GDP by a significant margin (Figure 10.7).

Office of Entrepreneurial Development
Impact Study of Entrepreneurial Dynamics 2012
87
XI. Appendices

Office of Entrepreneurial Development
Impact Study of Entrepreneurial Dynamics 2012
88
This page intentionally left blank for two-sided printing.
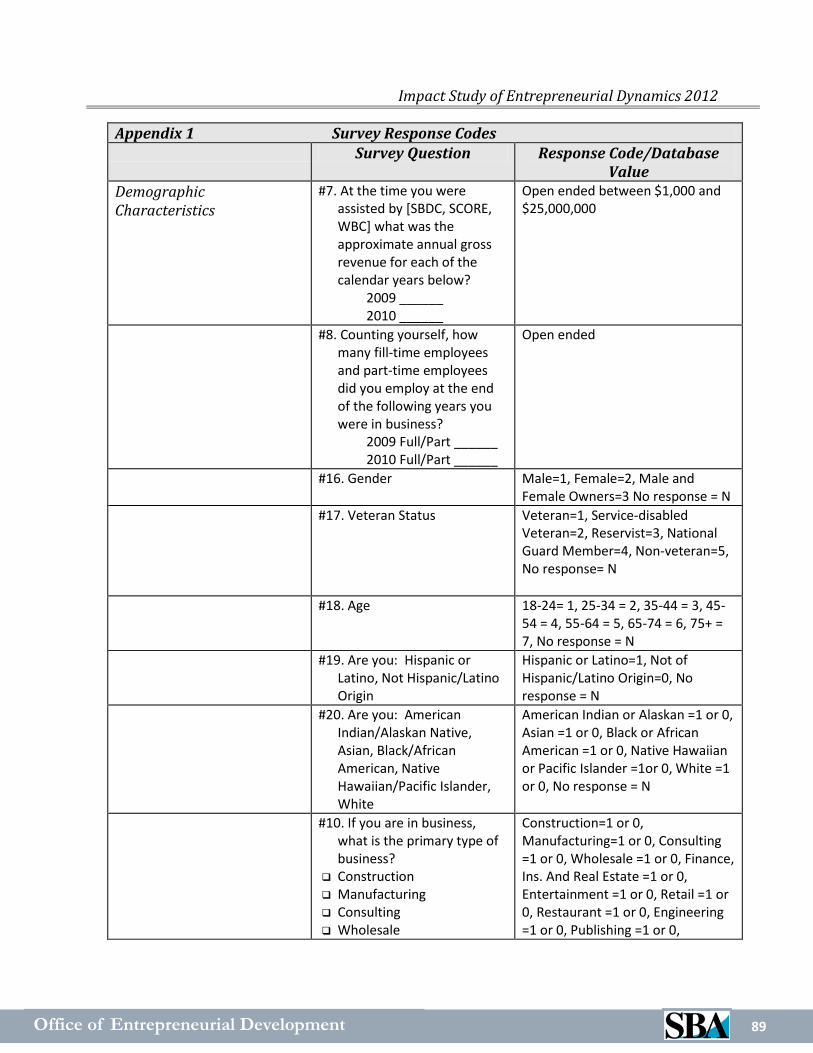
Office of Entrepreneurial Development
Impact Study of Entrepreneurial Dynamics 2012
89
Appendix 1 Survey Response Codes Survey Question Response Code/Database
Value Demographic Characteristics
#7. At the time you were assisted by [SBDC, SCORE, WBC] what was the approximate annual gross revenue for each of the calendar years below?
2009 ______ 2010 ______
Open ended between $1,000 and $25,000,000
#8. Counting yourself, how many fill-time employees and part-time employees did you employ at the end of the following years you were in business?
2009 Full/Part ______ 2010 Full/Part ______
Open ended
#16. Gender Male=1, Female=2, Male and Female Owners=3 No response = N
#17. Veteran Status Veteran=1, Service-disabled Veteran=2, Reservist=3, National Guard Member=4, Non-veteran=5, No response= N
#18. Age 18-24= 1, 25-34 = 2, 35-44 = 3, 45-54 = 4, 55-64 = 5, 65-74 = 6, 75+ = 7, No response = N
#19. Are you: Hispanic or Latino, Not Hispanic/Latino Origin
Hispanic or Latino=1, Not of Hispanic/Latino Origin=0, No response = N
#20. Are you: American Indian/Alaskan Native, Asian, Black/African American, Native Hawaiian/Pacific Islander, White
American Indian or Alaskan =1 or 0, Asian =1 or 0, Black or African American =1 or 0, Native Hawaiian or Pacific Islander =1or 0, White =1 or 0, No response = N
#10. If you are in business, what is the primary type of business?
Construction Manufacturing Consulting Wholesale
Construction=1 or 0, Manufacturing=1 or 0, Consulting =1 or 0, Wholesale =1 or 0, Finance, Ins. And Real Estate =1 or 0, Entertainment =1 or 0, Retail =1 or 0, Restaurant =1 or 0, Engineering =1 or 0, Publishing =1 or 0,
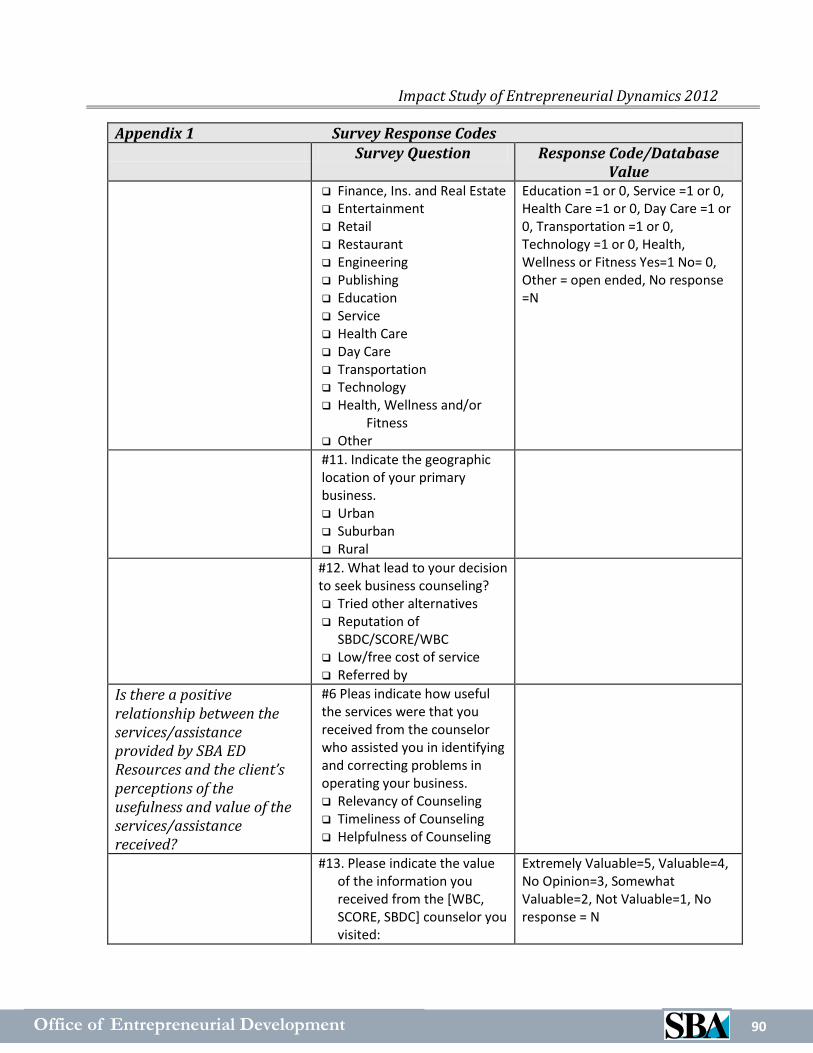
Office of Entrepreneurial Development
Impact Study of Entrepreneurial Dynamics 2012
90
Appendix 1 Survey Response Codes Survey Question Response Code/Database
Value Finance, Ins. and Real Estate Entertainment Retail Restaurant Engineering Publishing Education Service Health Care Day Care Transportation Technology Health, Wellness and/or
Fitness Other
Education =1 or 0, Service =1 or 0, Health Care =1 or 0, Day Care =1 or 0, Transportation =1 or 0, Technology =1 or 0, Health, Wellness or Fitness Yes=1 No= 0, Other = open ended, No response =N
#11. Indicate the geographic location of your primary business. Urban Suburban Rural
#12. What lead to your decision to seek business counseling? Tried other alternatives Reputation of
SBDC/SCORE/WBC Low/free cost of service Referred by
Is there a positive relationship between the services/assistance provided by SBA ED Resources and the client’s perceptions of the usefulness and value of the services/assistance received?
#6 Pleas indicate how useful the services were that you received from the counselor who assisted you in identifying and correcting problems in operating your business. Relevancy of Counseling Timeliness of Counseling Helpfulness of Counseling
#13. Please indicate the value of the information you received from the [WBC, SCORE, SBDC] counselor you visited:
Extremely Valuable=5, Valuable=4, No Opinion=3, Somewhat Valuable=2, Not Valuable=1, No response = N

Office of Entrepreneurial Development
Impact Study of Entrepreneurial Dynamics 2012
91
Appendix 1 Survey Response Codes Survey Question Response Code/Database
Value 1. Usefulness of information 2. Relevancy of the
information 3. Timeliness of the
information
#15. I would refer the counseling services I received to other small businesses.
Strongly Agree=5, Agree=4, No Opinion=3, Disagree=2, Strongly Disagree=1, other=open ended, No response = N
Is there a positive relationship between the services/assistance provided by SBA ED Resources and the client’s perceived quality of the counseling experience?
Please indicate the counselor’s effectiveness in assisting you: 1. The counselor exhibited
excellent customer service techniques.
2. The counselor was able to assist me
3. The counselor exhibited a high level of professionalism
4.The counselor was knowledgeable of current management practices and issues.
5. The counselor identified with my needs.
6. I would rate my overall experience with the counselor as excellent
Strongly Agree=5, Agree=4, No Opinion=3, Disagree=2, Strongly Disagree=1, other=open ended, No response = N
Is there a positive relationship between the services/assistance provided by SBA ED Resources and the client’s decision to start a business?
#2 If you were not in business at the time you were assisted by the counselor, did you decide to go into business as a result of that assistance?
Yes = 1 No=0 No Response = N
Is there a positive relationship between the services/assistance provided by SBA ED Resources and clients’ decisions to implement and/or change management and/or marketing practices in their
#3. As a result of the assistance you received, have you changed any of your current management practices?
Yes=1, No=0, No response = N

Office of Entrepreneurial Development
Impact Study of Entrepreneurial Dynamics 2012
92
Appendix 1 Survey Response Codes Survey Question Response Code/Database
Value business #4. As a result of the assistance
I received from the [WBC, SCORE, SBDC] counselor I was able to develop [i.e., Business Plan] in order to start or better manage my business. [Check all that apply] Business Plan Loan Package Purchasing Strategy Marketing Plan Hiring Plan Feasibility Plan Promotional Plan Training Plan for Staff Production Plan Pricing Strategy Financial Strategy Distribution Plan Cash Flow Analysis Web-based Strategy International Trade General Management Other
If checked = 1, Not checked = 0, Other =open ended, No response = N

Office of Entrepreneurial Development
Impact Study of Entrepreneurial Dynamics 2012
93
Appendix 1 Survey Response Codes Survey Question Response Code/Database
Value Is there a positive relationship between the services/assistance provided by SBA ED Resources and the clients’ businesses having a positive financial impact on job creation and retention and increase in sales?
#5. Please indicate the impact these changes have had on your firm: 1. Increase my sales 2. Improve my cash flow 3. Acquire a bank loan 4. Expand my products/
services 5. Hire new staff 6. Revise my marketing
strategy 7. Increase my profit margin 8. Retain current staff 9. Acquire a SBA guarantee
loan 10. Acquire a government
contract 11. Acquire a SBA Disaster
loan 12. Other
Strongly Agree=5, Agree=4, No Opinion=3, Disagree=2, Strongly Disagree=1, other=open ended, No response = N
#9 If you were projecting to reduce your total number of employees prior to counseling by SBDC/SCORE/WBC how many positions have you retained due to the counseling? Full time _____ Part time _____
Open Ended
General Business #1.i. Are you currently in business?
Yes=1, No=0, No response = N
#1.ii. If yes, when was the business started?
mm/yyyy
#1.iii. What is the zip code of your business
XXXXX
#1a. If NO, when do you plan on starting a business?
Within 30 days=1, 31-90 days=2, 91-120 days=3, No idea at this time=4, No response = N
#1b. Have you ever been in business?
Yes=1, No=0, No response = N
#1b.i. If YES when was the business started?
mm/yyyy
#13. Please indicate how useful Very Useful=5, Useful=4, No

Office of Entrepreneurial Development
Impact Study of Entrepreneurial Dynamics 2012
94
Appendix 1 Survey Response Codes Survey Question Response Code/Database
Value the services you received from the counselor who assisted you in identifying and correcting problems in operating your business and/or assisted you in starting or not starting a business 1. Identification of
problem(s) 2. Correction of problem(s)
Opinion=3, Somewhat Useful=2, Not Useful=1, No response = N
#21.i. Did you utilize any other SBA resources/program?
Yes=1, No=0, No response = N
#21.ii. If YES, select those you used [Check all that apply] SBDC SCORE WBC SBA’s Guarantee Loan
Programs SBIC Venture Capital
Program Government contracting SBA’s Surety Bond Program Small Business Training
Network (Online Training)
Disaster Assistance
SCORE =1 or 0, SBDC =1 or 0, Women Business Center =1 or 0, SBA’s Guarantee Loan Programs =1 or 0, SBIC Financing Program =1 or 0, SBA’s Surety Bond Program =1 or 0, No response = N

Office of Entrepreneurial Development
Impact Study of Entrepreneurial Dynamics 2012
95
Appendix 2 Quantified Survey Results – Initial Survey 2011 Clients
Surveys Questions Percentage of Sample
Q1) Are you currently in business?
Yes 72.25%
No 27.75%
Missing 0%
Q1a) If no, when do you plan on starting a business?
Within 30 days 1.77%
31-90 days 4.23%
91-120 days 4.59%
No idea at this time 16.65%
Missing 72.76%
Q1b) Have you ever been in business?
Yes 10.42%
No 17.64%
Missing 71.92%
Q2) If you were not in business at the time you were assisted by the counselor, did you decide to go into business as a result of that assistance?
Yes 17.41%
No 38.41%
Not Applicable (already in business)
50.88%
Missing 0.30%
Q3) As a result of the assistance you received, have you changed any of your current management practices/strategies?
Yes 42.60%
No 22.69%
Missing 28.71%

Office of Entrepreneurial Development
Impact Study of Entrepreneurial Dynamics 2012
96
Q4) As a result of the assistance I received from the counselor I was able to develop [i.e., Business Plan] in order to start or better manage my business.
Business Plan 33.94% Loan Package 7.99% Purchasing Strategy 5.11% Marketing Plan 28.97% Hiring Plan 5.51% Feasibility Plan 9.86% Promotional Plan 13.30% Training Plan for Staff 3.97% Production Plan 4.68% Pricing Strategy 15.24% Financial Strategy 19.86% Distribution Plan 4.11% Cash Flow Analysis 17.33% Web-based Strategy 12.05% International Trade 2.36% General Management Strategy 19.39% Other 33.49%
Q5) Please indicate the impact of these changes have had on your firm: Strongly Agree=SA, Agree=A, No Opinion-No, Disagree=D, Strongly Disagree=SD]
SA A NO D SD Missing
I was able to:
Increase my sales 11.26% 27.74% 35.00% 9.73% 5.99%% 36.04%
Improve my cash flow 7.20% 17.84% 25.89% 7.38% 5.28% 36.40%
Acquire a bank loan 4.75% 4.87% 34.13% 9.92% 7.74% 38.60%
Expand my products/services 7.11% 17.27% 25.32% 7.95% 5.54% 36.81%
Hire new staff 5.72% 12.60% 46.99% 13.85% 7.15% 38.50%
Revise my marketing strategy 12.79% 25.58% 16.28% 5.52% 4.82% 35.01%
Increase my profit margin 9.02% 22.62% 38.95% 11.11% 6.02% 37.29%
Retain current staff 6.41% 16.41% 47.57% 9.41% 6.02% 38.86%
Acquire a SBA guarantee loan 3.02% 2.47% 36.24% 10.58% 8.39% 39.30%
Acquire a government contract 1.19% 2.18% 37.93% 11.35% 7.86% 39.49%
Acquire a SBA Disaster loan .35% .46% 39.92% .52% 2.24% 75.93%
Other 8.04% 3.24% 10.03% .52% 2.24% 75.93%

Office of Entrepreneurial Development
Impact Study of Entrepreneurial Dynamics 2012
97
Q6) Please indicate how useful the services were that you received from the counselor who assisted you in identifying and correcting problems in operating your business: [Very Useful=VU, Useful=U, No Opinion-NO, Somewhat Useful =SU, Not Useful =NU]
VU U NO SU NU Missing
Relevancy of Counseling 45.17% 30.54% 2.74% 9.20% 6.65% 5.71%
Timeliness of Counseling 37.21% 19.58% 4.36% 4.02% 5.09% 29.75%
Helpfulness of Counseling 38.93% 17.77% 2.46% 5.15% 6.20% 29.49%
Q7) At the time you were assisted by [SBDC/SCORE/WBC], what was the approximate annual gross revenue for each of the calendar years below?
2010
Revenue given 33.66
Missing or Zero 66.33%
2011
Revenue given 41.26% Average = $653,755
Missing or Zero 58.74%
Q8) Counting yourself, how many full-time employees and part-time employees did you employ at the end of the following years you were in business?
2010 Full-time jobs Average = 2.7
2011Full-time jobs Average = 4.6
2010 Part-time jobs Average = 1.7
2011 Part-time jobs Average = 2.5
Q9) At the time you were assisted by [SBDC/SCORE/WBC], what was the approximate annual gross revenue for each of the calendar years below?
Existing Full-time jobs saved Total Full-time Jobs Saved – 6,926
Existing Part-time jobs saved Total Part-time Jobs Saved – 4,831

Office of Entrepreneurial Development
Impact Study of Entrepreneurial Dynamics 2012
98
Q10) If you are in business, what is the primary type of business? (This question includes multiple responses)
Construction 3.79%
Manufacturing 6.39%
Consulting 5.38%
Wholesale 2.18%
Finance, Insurance, Real Estate 1.75%
Entertainment 1.26%
Retail 8.71%
Restaurant and/or Eating and Drinking 8.73%
Engineering 0.99%
Publishing 0.75%
Education 1.74%
Service 8.94%
Health Care 2.63%
Day Care 0.53%
Transportation 0.97%
Technology 4.02%
Health, Wellness and/or Fitness
2.36%
Other 14.67%
Missing 29.31%
Q11) Indicate the geographic location of your primary business.
Rural 15.01%
Suburban 26.72%
Urban 24.09%
Missing 34.18%
Q12) What led to your decision to seek business counseling from [SBDC/SCORE/WBC]?
Tried other alternatives but was dissatisfied 6.76%
Reputation of [SBDC/SCORE/WBC] 41.28%
Low/free cost of service 46.39%
Referral 23.82%

Office of Entrepreneurial Development
Impact Study of Entrepreneurial Dynamics 2012
99
Q13) Please indicate the value of the information: [Extremely Valuable=EV, Valuable=V, No Opinion=NO, Somewhat Valuable=SV, Not Valuable=NV] Usefulness of Information
Relevancy of the Information
Timeliness of the Information
Q14) Please indicate the counselor's effectiveness in assisting you: [Strongly Agree=SA, Agree=A, No Opinion-No, Disagree=D, Strongly Disagree=SD] The counselor exhibited excellent customer service techniques
The counselor was able to assist me
The counselor exhibited a high level of professionalism
The counselor was knowledgeable of current management practices and issues
The counselor identified with my needs
I would rate my overall experience with the counselor as excellent
Q15) I would refer the counseling services I received to other small businesses. [Strongly Disagree=SA, Agree=A, No Opinion=NO, Disagree=D, Strongly Disagree=SD]
Q16) Gender: Male 37.51%
Female 37.47%
Both male and female 18.00%
Missing 7.02%
Q17) Veteran Status
Veteran 8.62%
Service-disabled Veteran 2.47%
Reservist 0.43%
National Guard Member 0.38%
Non-veteran 78.96%
Missing 9.19%
Q18) Age
18-24 1.95%
25-34 15.43%
35-44 22.15%
45-54 27.89%
55-64 20.23%
65-74 4.50%
75 + 0.65%
Missing 7.20%
Q19) Are you:
Hispanic/Latino 7.32%
Non-Hispanic/Latino 80.25%
Missing 12.43%
Q20) Are you:
American Indian or Alaskan Native 2.20%

Office of Entrepreneurial Development
Impact Study of Entrepreneurial Dynamics 2012
100
Asian 3.72%
Black or African American 11.21%
Native Hawaiian or Pacific Islander 0.59%
White 70.63%
Missing 11.65%
Q21) Did you utilize any other SBA resources/program?
Yes 36.59%
No 55.32%
Missing 8.10%
Q21 cont.) If yes, select those you used
SCORE 17.47%
SBA’s Guarantee Loan Program 6.43%
Women Business Center 32.96%
SBIC Venture Capital Program 0.67%
Government Contracting 3.57%
SBDC 10.78%
SBA’s Surety Bond Program 0.35%
Sm. Bus. Training Network (Online Assistance) 6.26%
Disaster Assistance 0.50%
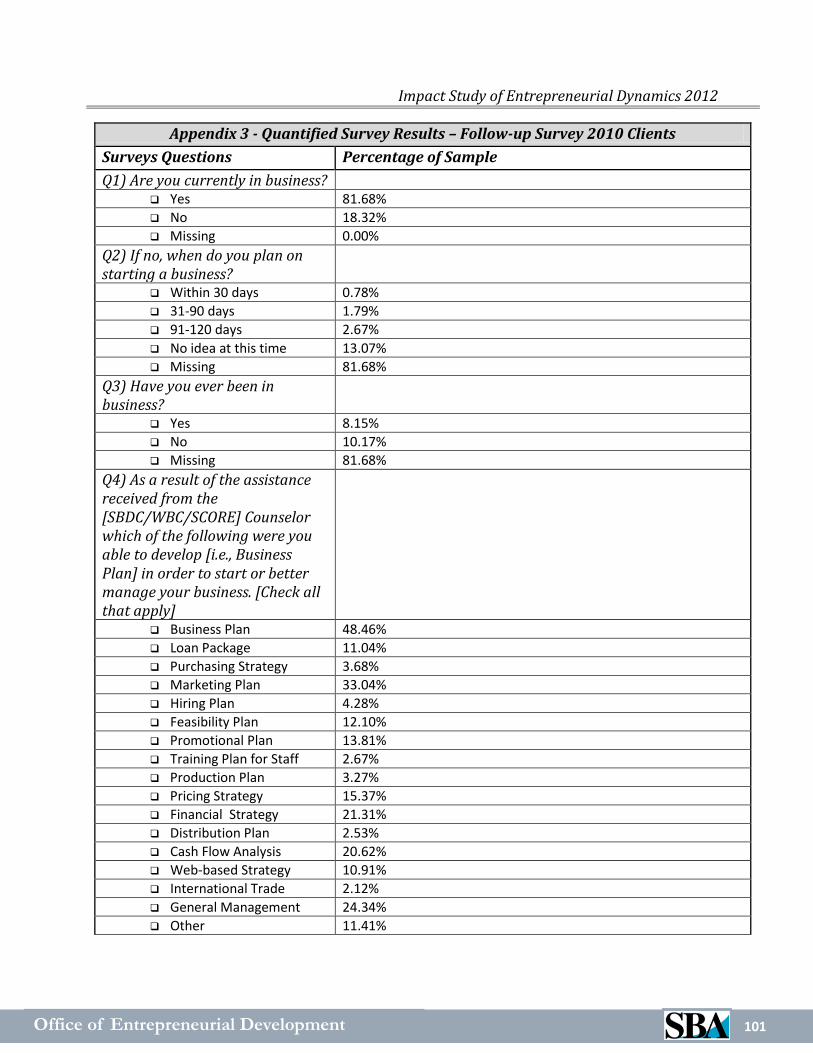
Office of Entrepreneurial Development
Impact Study of Entrepreneurial Dynamics 2012
101
Appendix 3 - Quantified Survey Results – Follow-up Survey 2010 Clients
Surveys Questions Percentage of Sample
Q1) Are you currently in business?
Yes 81.68%
No 18.32%
Missing 0.00%
Q2) If no, when do you plan on starting a business?
Within 30 days 0.78%
31-90 days 1.79%
91-120 days 2.67%
No idea at this time 13.07%
Missing 81.68%
Q3) Have you ever been in business?
Yes 8.15%
No 10.17%
Missing 81.68%
Q4) As a result of the assistance received from the [SBDC/WBC/SCORE] Counselor which of the following were you able to develop [i.e., Business Plan] in order to start or better manage your business. [Check all that apply]
Business Plan 48.46%
Loan Package 11.04%
Purchasing Strategy 3.68%
Marketing Plan 33.04%
Hiring Plan 4.28%
Feasibility Plan 12.10%
Promotional Plan 13.81%
Training Plan for Staff 2.67%
Production Plan 3.27%
Pricing Strategy 15.37%
Financial Strategy 21.31%
Distribution Plan 2.53%
Cash Flow Analysis 20.62%
Web-based Strategy 10.91%
International Trade 2.12%
General Management 24.34%
Other 11.41%

Office of Entrepreneurial Development
Impact Study of Entrepreneurial Dynamics 2012
102
Appendix 3 - Quantified Survey Results – Follow-up Survey 2010 Clients
Surveys Questions Percentage of Sample
Q5) What was the approximate annual gross revenue of your business in 2010?
Reported 63.00%
Missing 37.00%
Q6) Currently, how many people (full and part time), including yourself, does your business employ?
Average Full-Time 6.1 employees
Average Part-Time 4.1 employees
Q7) Have you utilized any other SBA resources/program?
Yes 25.13%
No 68.80%
Missing 6.07%
Q8) If YES, select those you used [check all that apply]
SCORE 8.97%
SBA’s Loan Guarantee Programs 5.89%
SBDC 3.77%
SBIC Venture Capital Program 0.32%
Woman Business Center 3.73%
Government Contracting 3.54%
SBA’s Surety Bond Program 0.18%
Small Business Training Network (online training) 5.20%

Office of Entrepreneurial Development
Impact Study of Entrepreneurial Dynamics 2012
103
Appendix 4 ‒ Initial Study Survey Instrument
U.S. Small Business Administration Office of Entrepreneurial Development
Initial Economic Impact Survey OMB Number 3245-0351
Expiration 03/31/2013 Dear Small Business Client: Thank you for your recent visit to [the Small Business Development Center (SBDC)/ SCORE/ the Women’s Business Center (WBC)], one of SBA’s Entrepreneurial Development (ED) Resource Partners. We hope you found the business assistance you sought. The SBA is always striving to better its programs and deliver relevant and meaningful assistance. We want to know if our programs and services are helping the economy by providing useful information on starting and managing businesses and eventually helping your business create jobs, and increasing your revenues and, in general, fueling the entrepreneurial spirit in America. We would appreciate you taking a few minutes to answer some brief questions that will help us determine the quality and impact of the programs. All responses to these questions are voluntary and will be held in confidence. The data will not be released to any other government agency or private firm. Please answer the following questions based on your visit to [the Small Business Development Center (SBDC)/ SCORE/ the Women’s Business Center (WBC)]. 1. Are you currently in business? Yes □ No □ If YES when was the business started? _ _/_ _ _ _ mm/ yyyy What is the zip code of your business location __ __ __ __ __ If Yes to Question 1, skip to Question 2. If No, continue to 1a
1a. If NO (to Question 1), when do you plan on starting a business? Within 30 days □ 31-90 days □ 91-120 days □ No idea at this time □
1b If NO (to Question 1), have you ever been in business? Yes □ No □
If YES when was the business started? _ _ /_ _ _ _ mm/yyyy 2. If you were not in business at the time you were assisted by the counselor, did you
decide to go into business as a result of that assistance?

Office of Entrepreneurial Development
Impact Study of Entrepreneurial Dynamics 2012
104
Yes □ No □ Not applicable (already in business) □
If you answered NO to Question 1, please skip ahead to Question 12 3. As a result of the assistance you received, have you changed any of your current
management practices/strategies? Yes □ No □ 4. As a result of the assistance I received from the [SBDC/ SCORE/ WBC] Counselor, I was
able to develop one or more of the following (i.e., Business Plan) in order to better manage my business. [Check all that apply]
Business Plan □ Loan Package □ Purchasing Strategy □ Marketing Plan □ Hiring Plan □ Feasibility Plan □ Promotional Plan □ Training Plan for Staff □ Production Plan □ Pricing Strategy □ Financial Strategy □ Distribution Plan □ Cash Flow Analysis □ Web Based Strategy □ International Trade □
General Management Other ________________________ 5. Please indicate the impact your counseling experience had on your firm:
[Strongly Agree=SA, Agree=A, No Opinion=NO, Disagree=D, Strongly Disagree=SD]
SA A NO D SD
I was able to:
1. Increase my sales 5 4 3 2 1 2. Improve my cash flow 5 4 3 2 1 3. Acquire a bank loan 5 4 3 2 1 4. Expand my products/services 5 4 3 2 1 5. Hire new staff 5 4 3 2 1 6. Revise my marketing strategy 5 4 3 2 1 7. Increase my profit margin 5 4 3 2 1 8. Retain current staff 5 4 3 2 1 9. Acquire a SBA guarantee loan 5 4 3 2 1 10. Acquire a government contract 5 4 3 2 1 11. Acquire a SBA Disaster loan 5 4 3 2 1 12. Other (specify ____________________) 5 4 3 2 1
6. Please indicate how useful the services were that you received from the counselor who
assisted you in identifying and correcting problems in operating your business. Very No Somewhat Not
Useful Useful Opinion Useful Useful 1. Relevancy of Counseling 5 4 3 2 1 2. Timeliness of Counseling 5 4 3 2 1

Office of Entrepreneurial Development
Impact Study of Entrepreneurial Dynamics 2012
105
3. Helpfulness of Counseling 5 4 3 2 1 7. At the time you were assisted by [the Small Business Development Center (SBDC)/
SCORE/ the Women’s Business Center (WBC)], what was the approximate annual gross revenue for each of the calendar years below: [All data will be held in strict confidence and reported only in the aggregate without identifying any individual small business] Enter dollar figures only. Do not include commas or currency symbols.
2010: __________________________ 2011: __________________________ 8. Counting yourself, how many full-time employees (35 hours or more per
week) and part-time employees (less than 35 hours per week) did you employ at the end of the following years you were in business?
2010 _______________ Number of Full-time employees 2011 _______________ Number of Full-time employees
2010 _______________ Number of Part-time employees 2011 _______________ Number of Part-time employees 9. If you were projecting to reduce your total number of employees prior to receiving
counseling from [SBDC/ SCORE/ WBC], how many positions have you retained due to the counseling? Existing Full-time jobs saved ___________ Existing Part-time jobs saved ___________
10. What is your firm’s primary type of business? [Please choose only one] Construction □ Manufacturing □ Consulting □ Wholesale □ Finance, Insurance and Real Estate □ Entertainment □ Retail □ Restaurant and/or Eating and Drinking □ Engineering □ Publishing □ Education □ Service □ Health Care □ Day Care □ Transportation □
Technology □ Health, Wellness and/or Fitness □ Other (describe) _______________________
11. Indicate the geographic location of your primary business. Rural □ Suburban □ Urban □ 12. What led to your decision to seek business counseling from [SBDC/ SCORE/ WBC]?
[Check all that apply]
Tried other alternatives and was dissatisfied □

Office of Entrepreneurial Development
Impact Study of Entrepreneurial Dynamics 2012
106
Reputation of [SBDC/ SCORE/ WBC] □ Low/free cost of service □ Referred by __________________________________ (Fill in blank or add options such as SBA office of ______ )
Other _______________________________________ (Fill in the blank)
13. Please indicate the value of the information you received from the counselor you visited:
Extremely No Somewhat Not Valuable Valuable Opinion Valuable Valuable
1. Usefulness of Information 5 4 3 2 1 2. Relevancy of Information 5 4 3 2 1 3. Timeliness of Information 5 4 3 2 1 14. Please indicate the counselor’s effectiveness in assisting you: [Strongly Agree=SA, Agree=A, No Opinion=NO, Disagree=D, Strongly Disagree=SD] SA A NO D SD 1. The counselor exhibited excellent
customer service techniques 5 4 3 2 1 2. The counselor was able to assist me 5 4 3 2 1 3. The counselor exhibited a high level of
professionalism 5 4 3 2 1 4. The counselor was knowledgeable of current management practices and issues 5 4 3 2 1 5. The counselor identified with my needs 5 4 3 2 1 6. I would rate my overall experience with
the counselor as excellent 5 4 3 2 1 15. I would refer the counseling services I received to other small businesses.
Strongly Agree □ Agree □ No Opinion □ Disagree □ Strongly Disagree □ 16. Gender: Male owner(s) □ Female owner(s) □ Both male and female owners □
17. Veterans status: Veteran □ Service Disabled Veteran □ Reservist □ National Guard member □ Non-Veteran □ 18. Age: [Circle one] 18-24 25-34 35-44 45-54 55-64 65-74 75+

Office of Entrepreneurial Development
Impact Study of Entrepreneurial Dynamics 2012
107
19. Are you: Hispanic or Latino □ Not of Hispanic or Latino Origin □ 20. Are you: [Please choose one or more] American Indian or Alaskan Native □ Asian □ Black or African American □ Native Hawaiian or Pacific Islander □ White □
21. Did you utilize any of the following SBA resources or programs? Yes □ No □ If YES, select those you used [Check all that apply] SBDC □ SCORE □
SBA’s Guarantee Loan programs □ Women Business Center □
SBIC Venture Capital Program □ Government Contracting □ SBA’s Surety Bond Program □ Small Business Training Network □
Disaster Assistance □ (On-line training)
PLEASE NOTE: The estimated burden for completing this form is 12 minutes per response. You are not required to respond to any collection of information unless it displays a currently valid OMB approval number. Comments on the burden should be sent to U.S. Small Business Administration, Chief, AIB, 409 3
rd St., S.W., Washington,
D.C. 20416 and Desk Officer for the Small Business Administration, Office of Management and Budget, New Executive Building, Room 10202, Washington, D.C. 20503. OMB Approval (3245-0351). PLEASE DO NOT SEND FORMS TO OMB.
SBA Form 2214 THANK YOU

Office of Entrepreneurial Development
Impact Study of Entrepreneurial Dynamics 2012
108
This page intentionally left blank for two-sided printing.

Office of Entrepreneurial Development
Impact Study of Entrepreneurial Dynamics 2012
109
Appendix 5 – Follow-up Survey
U.S. Small Business Administration
Office of Entrepreneurial Development
Follow-up Economic Impact Survey
OMB Number TBD
Expiration TBD
Dear Small Business Client:
Within the last twelve months you were kind enough to respond to our request for some initial data regarding
your visit(s) to SBA’s Entrepreneurial Development resource the [Small Business Development Center
(SBDC), Women’s Business Center (WBC), SCORE]. To continually understand the impact our programs
and services are having on the economy it would be helpful to know if our assistance to you regarding starting
and managing a business resulted in job creation, increases in your business’ revenues or other results.
We understand that you responded to a thorough survey not so long ago, but we ask that you help us in
answering a few questions for this follow-up survey which will take less than 5 minutes. All responses to
these questions are voluntary and will be held in confidence. The data will not be released to any other
government agency or private firm. Based on your visit to the [SBDC, WBC, SCORE], please use that
experience as a benchmark to answer the following:
1. Are you currently in business?
Yes □ No □
If YES when was the business started? _ _/_ _ _ _
mm/ yyyy
2. If NO, when do you plan on starting a business?
Within 30 days □ 31-90 days □
91-120 days □ No idea at this time □
3. Have you ever been in business? Yes □ No □ If YES, when was the business started? _ _/_ _ _ _
mm/ yyyy
4. As a result of the assistance received from the [SBDC/WBC/SCORE] Counselor which of the
following were you able to develop [i.e., Business Plan] in order to start or better manage your
business. [Check all that apply]
Business Plan □ Loan Package □ Purchasing Strategy □
Marketing Plan □ Hiring Plan □ Feasibility Plan □
Promotional Plan □ Training Plan for Staff □ Production Plan □
Pricing Strategy □ Financial Strategy □ Distribution Plan □
Cash Flow Analysis□ E-Commerce Strategy □ Other ________________
5. What was the approximate annual gross revenue of your business in 2009? $_____,______,_____.00

Office of Entrepreneurial Development
Impact Study of Entrepreneurial Dynamics 2012
110
6. Currently, how many people (full and part-time), including yourself, does your business employ?
Number of Full-Time Employees _________________________
Number of Part-Time Employees _________________________
7. Have you utilized any other SBA resources/program?
Yes □ No □
8. If YES, select those you used [Check all that apply]
SCORE □ SBA’s guarantee loan programs □
SBDC □ SBIC Financing Program □
Women Business Center □ SBA’s Surety Bond Program □
PLEASE NOTE: The estimated burden for completing this form is less than 5 minutes per response. You are not required to
respond to any collection of information unless it displays a currently valid OMB approval number. Comments on the burden
should be sent to U.S. Small Business Administration, Chief, AIB, 409 3rd St., S.W., Washington, D.C. 20416 and Desk Officer
for the Small Business Administration, Office of Management and Budget, New Executive Building, Room 10202, Washington,
D.C. 20503. OMB Approval (TBD). PLEASE DO NOT SEND FORMS TO OMB.
THANK YOU

Office of Entrepreneurial Development
Impact Study of Entrepreneurial Dynamics 2012
111
Appendix 6 - Regression Results: Effects of Firm and Demographic Characteristics on Perceived
Usefulness, Assistance with Decision to Start a Business, and Financial Impact
***Significant at 0.01 level **Significant at 0.05 level *Significant at 0.10 level
Dependent Variable
Independent Variable
Perceived Usefulness
Assistance with Decision to Start a Business (LR)
Financial Impact
Intercept 3.83373 *** 0.47719 8.76344 ***
SBDC -0.14620 -0.08498 0.11411
SCORE -0.27060 ** -0.11412 -0.25204
< 3 hours Counsel
-0.22728 *** -0.39753 ** -0.77621 ***
Rural 0.07216 * -0.04934 0.27894 *
Suburb 0.08271 ** 0.09288 0.30389 **
Log of Sales 0.03310 *** -0.02438 0.23128 ***
Male -0.09003 ** -0.19303 * 0.02835
Female 0.09702 ** 0.2179 * 0.35579 **
Veteran -0.10303 ** 0.24722 -0.04160
Latino -0.03933 -0.23161 -0.25031
Age 18-34 -0.01966 0.16563 1.87654 ***
Age 35-44 -0.11750 0.04465 1.01547 ***
Age 45-44 -0.11054 0.02219 0.61713 **
Age 55-64 -0.09988 -0.16974 0.32773
Native American -0.14023 0.07113 0.64578
Asian 0.05406 0.59856 -0.61446
Black 0.25850 *** -0.21327 -0.62826 *
Hawaiian/Pacific Islander
0.24965 -0.33726 -0.35023
White 0.27174 *** -0.05572 -0.24883
Startup 0.19593 *** 0.15723 0.30754 *
Nascent -0.03379 n/a n/a
R-square 0.03287 *** 0.026 0.03836 ***