impact of wto’s trade liberalization on selected food ... · 1 impact of wto’s trade...
TRANSCRIPT

1
IMPACT OF WTO’S TRADE LIBERALIZATION ON SELECTED FOOD CROPS IN PAKISTAN
Shahzad Sharif, M. Siddique Javed, and Azhar Abbas
Department of Agricultural Economics, University of Agriculture, Faisalabad
Abstract
The study intended to evaluate the impact of WTO on domestic prices, production and consumption of major food commodities like wheat and rice and ultimately their impact on the producer’s and consumer’s surpluses. The farm level impact was also evaluated to chalk out the eventual position at farm level with the purpose to identify necessary policies and actions to cope with the new world situation. The study tries to provide a useful guide to the likely impacts of agricultural liberalization. It was found that openness of the economy would affect the domestic demand, supply and consumption along with affecting the producer and consumer surpluses. Overall the impact of the increase in the international price of wheat would have resulted in a net loss to Pakistan of Rs. 1,875 million during 2004-05 while in case of rice it would have resulted in a gain of Rs. 1,215 million in 2004-05.

2
INTRODUCTION
Pakistan has great potential for producing all types of food commodities as it has a rich
and vast natural resource base, covering various ecological and climatic zones. Most of the
agricultural commodities produced in the country are consumed by the local population while the
rest is exported in the form of primary products and some value added products. Previously,
Pakistani products had had a good market overseas with no restrictions of quality and quantity
but under the changing environment affected by WTO, it is expected that Pakistan will face a
strong competition in the agriculture sector from its competitors in the world market. According
to the neoclassical trade theory, trade flows and pattern will develop along the lines of
comparative advantage and competitiveness that can act as indicators of trade potential and
direction.
There has been extensive government involvement in the determination of the overall
structure of agriculture and its patterns of production, employment and trade. Major reasons for
government intervention in the past included the desire to support agricultural production,
income supports, ensure food security, improve the balance of trade, reduce consumer prices,
address environmental and regional concerns and to pursue sanitary and phyto-sanitary
objectives (Hassan, 1995). In the early post-war years, when the General Agreement on Tariffs
and Trade (GATT) was created, most countries maintained restrictive import regimes in farm
products, using a variety of non-tariff barriers (NTBs) (UNCTAD, 1999).
Pakistan has been a founding member of the General Agreement on Tariffs and Trade
(GATT) since its creation. Following the Uruguay Round negotiations, all agricultural products
were brought under multinational trade rules by WTO, under the Agreement on Agriculture. This
established a framework to begin liberalizing agricultural trade through the reduction of import
duties (tariffs), trade-distorting production subsidies and export subsidies.
Prior to the Uruguay Round, trade in agriculture was highly distorted. Market access for
agricultural products was limited as most markets were restricted by physical import barriers.
The presence of massive domestic subsidies led to overproduction of temperate crops in the
developed countries that led to excess supply, and export subsidies were used to dump the
surplus agricultural output in international markets. This resulted in depressed market prices and,
in spite of being low-cost producers of agricultural products; developing countries could not
compete with the subsidized exports from developed countries.
3
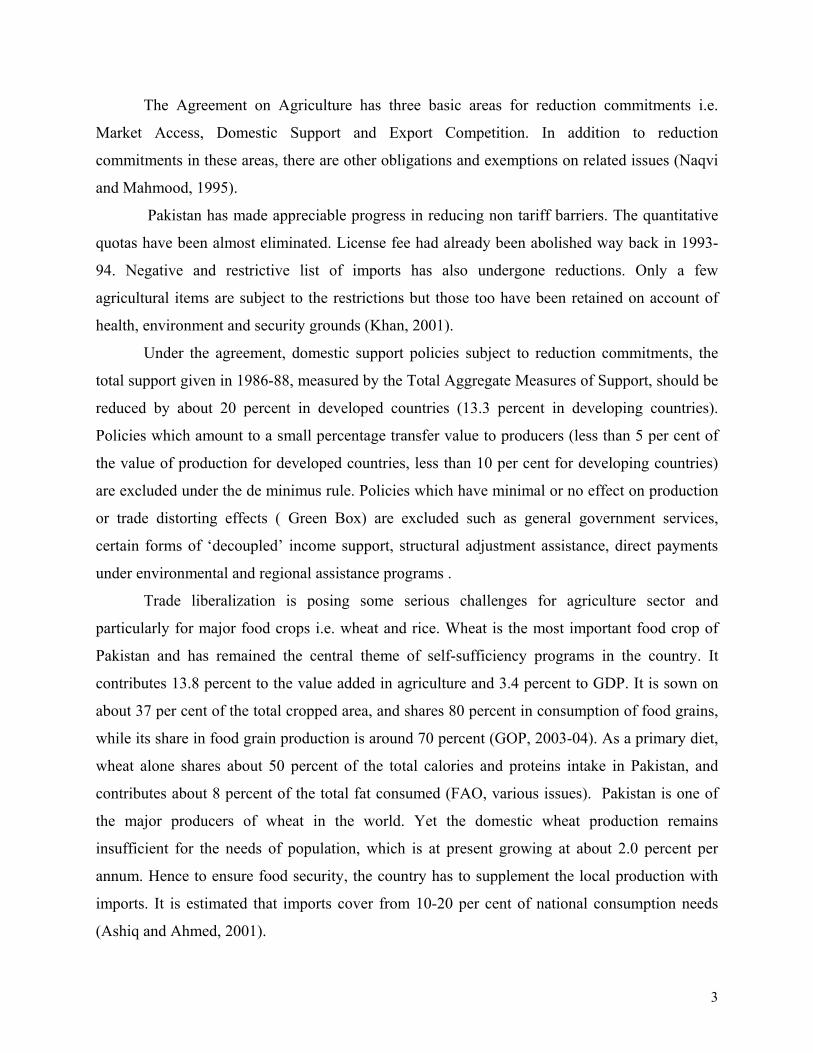
The Agreement on Agriculture has three basic areas for reduction commitments i.e.
Market Access, Domestic Support and Export Competition. In addition to reduction
commitments in these areas, there are other obligations and exemptions on related issues (Naqvi
and Mahmood, 1995).
Pakistan has made appreciable progress in reducing non tariff barriers. The quantitative
quotas have been almost eliminated. License fee had already been abolished way back in 1993-
94. Negative and restrictive list of imports has also undergone reductions. Only a few
agricultural items are subject to the restrictions but those too have been retained on account of
health, environment and security grounds (Khan, 2001).
Under the agreement, domestic support policies subject to reduction commitments, the
total support given in 1986-88, measured by the Total Aggregate Measures of Support, should be
reduced by about 20 percent in developed countries (13.3 percent in developing countries).
Policies which amount to a small percentage transfer value to producers (less than 5 per cent of
the value of production for developed countries, less than 10 per cent for developing countries)
are excluded under the de minimus rule. Policies which have minimal or no effect on production
or trade distorting effects ( Green Box) are excluded such as general government services,
certain forms of ‘decoupled’ income support, structural adjustment assistance, direct payments
under environmental and regional assistance programs .
Trade liberalization is posing some serious challenges for agriculture sector and
particularly for major food crops i.e. wheat and rice. Wheat is the most important food crop of
Pakistan and has remained the central theme of self-sufficiency programs in the country. It
contributes 13.8 percent to the value added in agriculture and 3.4 percent to GDP. It is sown on
about 37 per cent of the total cropped area, and shares 80 percent in consumption of food grains,
while its share in food grain production is around 70 percent (GOP, 2003-04). As a primary diet,
wheat alone shares about 50 percent of the total calories and proteins intake in Pakistan, and
contributes about 8 percent of the total fat consumed (FAO, various issues). Pakistan is one of
the major producers of wheat in the world. Yet the domestic wheat production remains
insufficient for the needs of population, which is at present growing at about 2.0 percent per
annum. Hence to ensure food security, the country has to supplement the local production with
imports. It is estimated that imports cover from 10-20 per cent of national consumption needs
(Ashiq and Ahmed, 2001).
4
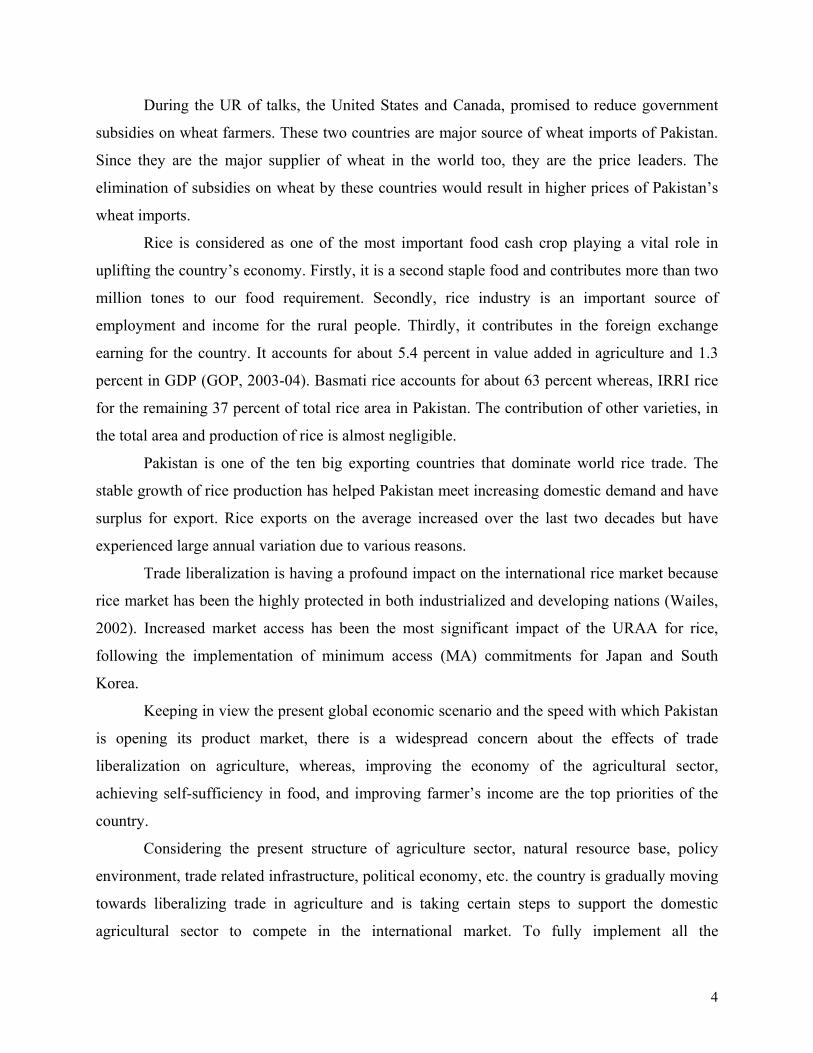
During the UR of talks, the United States and Canada, promised to reduce government
subsidies on wheat farmers. These two countries are major source of wheat imports of Pakistan.
Since they are the major supplier of wheat in the world too, they are the price leaders. The
elimination of subsidies on wheat by these countries would result in higher prices of Pakistan’s
wheat imports.
Rice is considered as one of the most important food cash crop playing a vital role in
uplifting the country’s economy. Firstly, it is a second staple food and contributes more than two
million tones to our food requirement. Secondly, rice industry is an important source of
employment and income for the rural people. Thirdly, it contributes in the foreign exchange
earning for the country. It accounts for about 5.4 percent in value added in agriculture and 1.3
percent in GDP (GOP, 2003-04). Basmati rice accounts for about 63 percent whereas, IRRI rice
for the remaining 37 percent of total rice area in Pakistan. The contribution of other varieties, in
the total area and production of rice is almost negligible.
Pakistan is one of the ten big exporting countries that dominate world rice trade. The
stable growth of rice production has helped Pakistan meet increasing domestic demand and have
surplus for export. Rice exports on the average increased over the last two decades but have
experienced large annual variation due to various reasons.
Trade liberalization is having a profound impact on the international rice market because
rice market has been the highly protected in both industrialized and developing nations (Wailes,
2002). Increased market access has been the most significant impact of the URAA for rice,
following the implementation of minimum access (MA) commitments for Japan and South
Korea.
Keeping in view the present global economic scenario and the speed with which Pakistan
is opening its product market, there is a widespread concern about the effects of trade
liberalization on agriculture, whereas, improving the economy of the agricultural sector,
achieving self-sufficiency in food, and improving farmer’s income are the top priorities of the
country.
Considering the present structure of agriculture sector, natural resource base, policy
environment, trade related infrastructure, political economy, etc. the country is gradually moving
towards liberalizing trade in agriculture and is taking certain steps to support the domestic
agricultural sector to compete in the international market. To fully implement all the
5
requirements of the Uruguay Round agreement on agriculture, the country has a long way to go,
especially in terms of improving the trade infrastructure, quality of the products, environmental
issues and issues related to sanitary and phyto-sanitary requirements of the agreement. To
smoothly proceed towards a more liberalized economic environment, the expected effects of
trade liberalization related to various agricultural products, especially, those on the major food
crops are needed to be identified and measured. The more specific objectives of the study are as
follows:
OBJECTIVES
• To analyze the welfare effects of trade liberalization on the producers and consumers of
major food commodities like wheat and rice in Pakistan.
• To determine the impact of trade liberalization on farmers’ returns from major food crops
(wheat, rice) at farm level in Punjab.
• To implicate policy options for smooth adjustment process of trade liberalization of
agriculture in Pakistan.
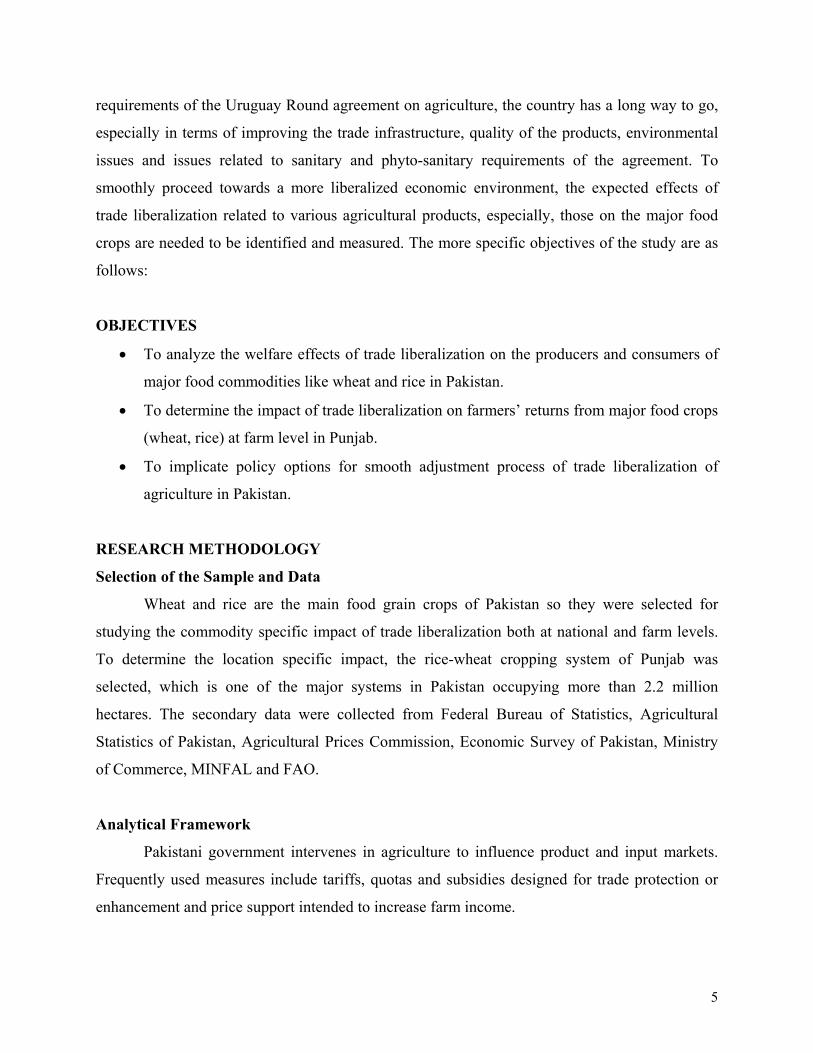
RESEARCH METHODOLOGY
Selection of the Sample and Data
Wheat and rice are the main food grain crops of Pakistan so they were selected for
studying the commodity specific impact of trade liberalization both at national and farm levels.
To determine the location specific impact, the rice-wheat cropping system of Punjab was
selected, which is one of the major systems in Pakistan occupying more than 2.2 million
hectares. The secondary data were collected from Federal Bureau of Statistics, Agricultural
Statistics of Pakistan, Agricultural Prices Commission, Economic Survey of Pakistan, Ministry
of Commerce, MINFAL and FAO.
Analytical Framework
Pakistani government intervenes in agriculture to influence product and input markets.
Frequently used measures include tariffs, quotas and subsidies designed for trade protection or
enhancement and price support intended to increase farm income.
6
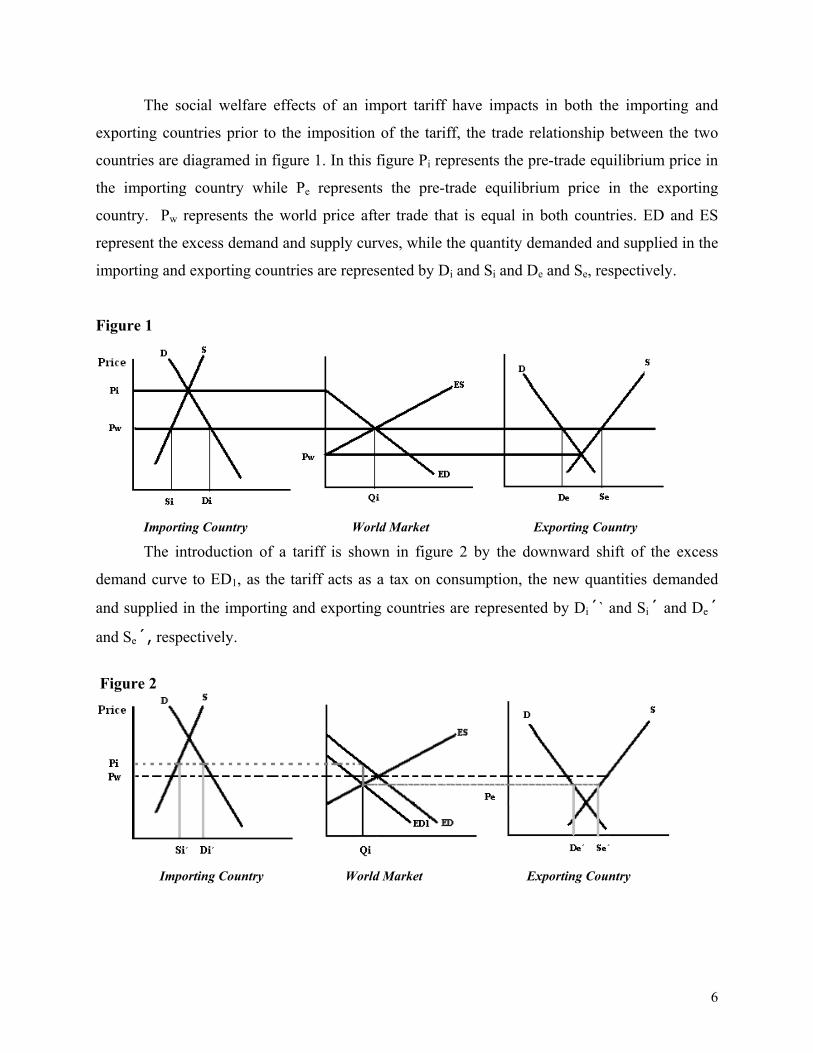
The social welfare effects of an import tariff have impacts in both the importing and
exporting countries prior to the imposition of the tariff, the trade relationship between the two
countries are diagramed in figure 1. In this figure Pi represents the pre-trade equilibrium price in
the importing country while Pe represents the pre-trade equilibrium price in the exporting
country. Pw represents the world price after trade that is equal in both countries. ED and ES
represent the excess demand and supply curves, while the quantity demanded and supplied in the
importing and exporting countries are represented by Di and Si and De and Se, respectively.
Figure 1
Importing Country World Market Exporting Country
The introduction of a tariff is shown in figure 2 by the downward shift of the excess
demand curve to ED1, as the tariff acts as a tax on consumption, the new quantities demanded
and supplied in the importing and exporting countries are represented by Di´` and Si´ and De´
and Se´, respectively.
Figure 2
Importing Country World Market Exporting Country

7
Figure 3
As shown in figure 3, the impact of the tariff on the importing country raises domestic
prices to Pt, increases quantity supplied to Si´ and decreases quantity demanded to Di´. This
results in a decrease in imports from Si-Di to Si´-Di´. The geometric areas A-F can identify the
welfare effects wherein A is an increase in producer surplus, as producers produce more with the
higher price Pt. This area is a transfer from consumers as they pay more for the increase in
quantity supplied. B is the extra cost to produce the extra supply above what it would cost to
import the same quantity and represents a dead weight social welfare loss to society, since the
resources representing area B could have been used to produce something else in the country. C
is revenue that is collected by the importing government from domestic consumers while D is the
loss in consumer surplus when consumers reduce their consumption because of the higher price
Pt. This area represents a dead weight social welfare loss because it is not a transfer to another
group in society. E and F represent savings in foreign exchange for the importing country and
losses in foreign exchange to the exporting country. These are not social welfare losses to the
importing country because these represent the opportunity cost of buying the imports.

8
Figure 4
Figure 4 shows the remaining impacts of the tariff in the exporting country. In the
exporting country, the tariff reduces the domestic price to Pt, increase the domestic quantity
demanded to De´ and decreases quantity supplied from Se to Se´. This results in a decrease in
exports from De-Se to De´-Se´. The welfare effects can be identified by the geometric area H-O
wherein H and I together represent an increase in consumer surplus, as domestic consumers buy
more of the item when its price falls to Pt.
H-L together represents a loss in producer surplus as producers produce less and receive a
lower price. J is the dead weight social welfare loss. K represents the revenue obtained by the
importing country from the exporting country producers. This is a social welfare loss in the
exporting country but not a dead weight social welfare loss and L is a dead weight social welfare
loss.
M and O represent the opportunity cost of resources that are saved by the reduced
production. These resources may be used for other activities in the exporting country and
therefore, do not represent a net social welfare loss. N is the additional cost that consumers must
pay for their increased demand and, therefore, is not a welfare loss. N and O together represent
losses in foreign exchange to the exporting country and savings in foreign exchange for the
importing country.
Using the welfare analysis (Akhtar, 1999), effects of trade liberalization on major
agricultural commodities were calculated. Following equations were estimated for quantitative
analysis:

9
1. consumer and producer surpluses were estimated using following equations :
Consumer Surplus = (Pt – Pw) [Di´ + (Di – Di´) 0.5] ……….. 1
Producer Surplus = (Pt – Pw) [Si + (Si´ – Si) 0.5] ................ 2
Where Di´ and Si´ are the demand and suply after trade.
2. In evaluating the quantitative effects of liberalization on wheat and basmati and non-
basmati rice (IRRI), following functions were estimated for each commodity viz. the
domestic demand and supply functions, and two price linkage equations. Nominal prices
were used for the analysis and the equations were estimated through double log standard
regression analysis by using SPSS.
Domestic Demand Function
Domestic Demand (QDi) = ƒ (PCi, I)
Elasticity of demand (Epc) = (%∆QDi) / (%∆PCi)
Where
(QDi) = Total quantity demanded of commodity i;
PCi = Domestic market price of commodity i;
I = Income
Epc = Demand elasticity of commodity i with respect to its market price.
Domestic Supply Function
The supply response of wheat and rice (Basmati and IRRI) can be assumed to be a
function of their own prices, prices of other relevant crops, prices of inputs and technology (Ali,
1990). For this study, to measure price elasticity coefficients, commodity’s own price and
technology were used keeping other factors constant.
Domestic Supply (QSi) = ƒ (PFi, T)
Elasticity of Supply (EPf) = (%∆Qsi) / (%∆PFi)
Where
QSi = Total quantity supplied of commodity i;
PFi = Price of commodity i at farm level;
T = Trend (year as a proxy for technology)
EPf = Supply elasticity of commodity i with respect to its market price

10
Price Linkage Equations
Two price linkage equations were estimated. Equation 3 ascertained the relationship
between world and domestic prices whereas the equation 4 represented the relationship between
wholesale and farm level prices (Akhtar, 1999).
PCi = PCif + Tariff + Transfer cost ………….. 3
PFi = α + ß* PCi …………………. 4
Et = (%∆PFi) / (%∆PCi)
Where,
PCi = Domestic market price of commodity i
PCif = World Price of commodity i
PFi = Price of commodity i at farm level
ß = Farm price transmission elasticity of commodity i with respect to its
market price (%∆PFi) / (%∆PCi)
Et = Market price transmission elasticity of commodity i with respect to
its world price
The location specific impact of trade liberalization on rice and wheat was analyzed using
partial budgets of these crops without trade liberalization (for 1993-94) and with trade
liberalization (for 2003-04) at farm level. Net Returns were calculated using the formula
Net Returns = Gross Returns – Gross Costs
RESULTS AND DISCUSSION
Impact of trade liberalization on wheat at national level
To assess the impact of trade liberalization on wheat at the national level in Pakistan,
supply, demand and price linkage equations were estimated using standard regression analysis.
All the equations were used to assess the impact of a 7% (FAO, 1995) increase in the
international prices on domestic supply, demand, wholesale price; and producer and consumer
surpluses. The estimated parameters were consistent across equations and with prior expectations
concerning sign and significance except the price coefficient in the demand equation of wheat.
The price coefficient, although, had negative sign but insignificant in explaining the variation in
demand. The reason may be the lack of consistent time series data on the consumption of wheat.
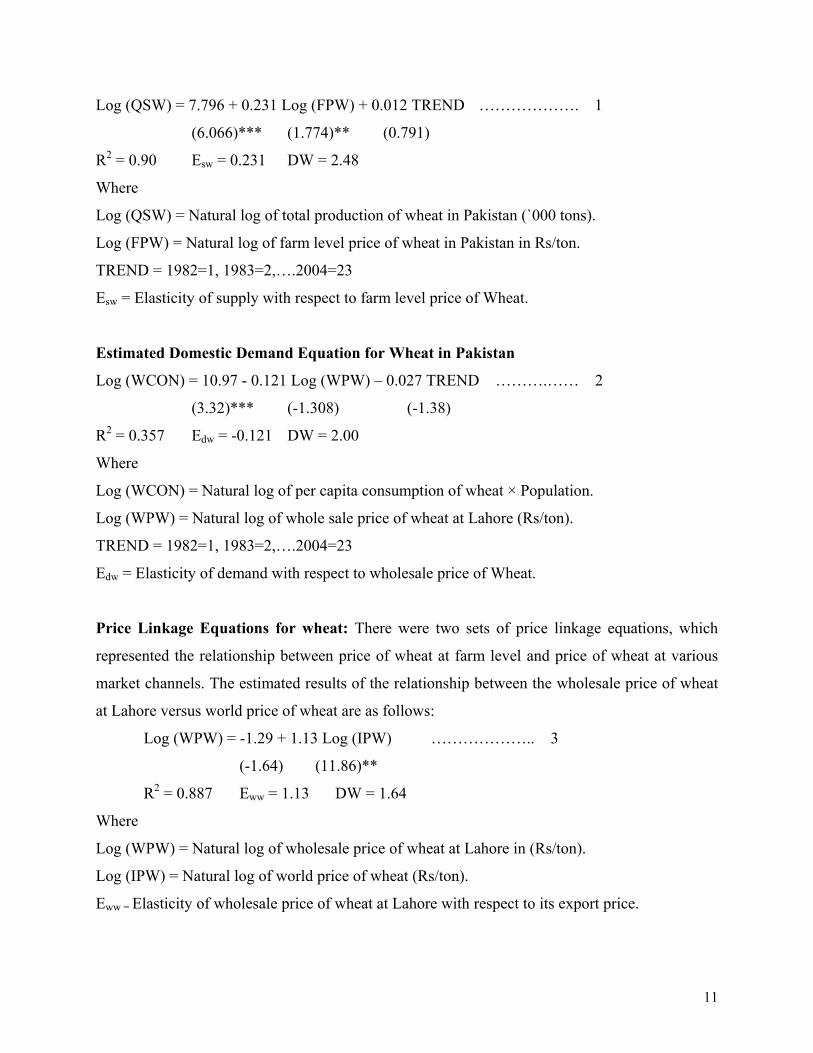
Estimated supply equation for wheat in Pakistan (QSW)
11
Log (QSW) = 7.796 + 0.231 Log (FPW) + 0.012 TREND ………………. 1
(6.066)*** (1.774)** (0.791)
R2 = 0.90 Esw = 0.231 DW = 2.48
Where
Log (QSW) = Natural log of total production of wheat in Pakistan (`000 tons).
Log (FPW) = Natural log of farm level price of wheat in Pakistan in Rs/ton.
TREND = 1982=1, 1983=2,….2004=23
Esw = Elasticity of supply with respect to farm level price of Wheat.
Estimated Domestic Demand Equation for Wheat in Pakistan
Log (WCON) = 10.97 - 0.121 Log (WPW) – 0.027 TREND ……….…… 2
(3.32)*** (-1.308) (-1.38)
R2 = 0.357 Edw = -0.121 DW = 2.00
Where
Log (WCON) = Natural log of per capita consumption of wheat × Population.
Log (WPW) = Natural log of whole sale price of wheat at Lahore (Rs/ton).
TREND = 1982=1, 1983=2,….2004=23
Edw = Elasticity of demand with respect to wholesale price of Wheat.
Price Linkage Equations for wheat: There were two sets of price linkage equations, which
represented the relationship between price of wheat at farm level and price of wheat at various
market channels. The estimated results of the relationship between the wholesale price of wheat
at Lahore versus world price of wheat are as follows:
Log (WPW) = -1.29 + 1.13 Log (IPW) ……………….. 3
(-1.64) (11.86)**
R2 = 0.887 Eww = 1.13 DW = 1.64
Where
Log (WPW) = Natural log of wholesale price of wheat at Lahore in (Rs/ton).
Log (IPW) = Natural log of world price of wheat (Rs/ton).
Eww = Elasticity of wholesale price of wheat at Lahore with respect to its export price.

12
The results of the estimated price linkage equation for the farm gate price of wheat versus
wholesale price of wheat at Lahore are as under:
Log (FPW) = 0.244 + 0.95 Log (WPW) …………………… 4
(0.291) (28.31)***
R2 = 0.974 Efw = 0.95 DW = 2.18
Log (FPW) = Natural log of farm gate price of wheat (Rs/ton).
Efw = Elasticity of farm gate price of wheat with respect to wholesale price of wheat.
Impact on domestic prices of wheat in Pakistan
From equation 3, the elasticity of wholesale price of wheat at Lahore with respect to
international price (c.i.f. Karachi) was 1.13. Therefore, the increase in the world prices of wheat
by 7 percent would have caused an increase in the wholesale price of wheat in Pakistan by 7.91
percent under globalization. Therefore, the wholesale price of wheat during 2004-05 would have
increased from Rs. 8,827/ton to Rs. 9,525/ton.
The impact of the increase in wholesale price of wheat on the price received by wheat
growers was estimated by equation 4. It was estimated by using elasticity of transmission of the
wheat price received by farmers with respect to the wholesale price of wheat at Lahore, which
was found to be 0.95. The impact is such that the price of wheat received by farmers (farm-gate
price) would have increased by 6.65% in 2004-05 (from Rs. 8,175/ton to Rs. 8,719/ton).
Impact on the domestic supply and demand of wheat
From equation 1, the elasticity of supply of wheat with respect to farm level price was
0.23. The impact of the 7% increase in the world price of wheat on the price of wheat received
by the farmers was estimated at (7 x 0.95) in 2004-05. Therefore, this would have increase the
domestic production of wheat by (7 x 0.95) (0.23), i.e. from 19.50 million tons to 19.80 million
tons during 2004-05. This increase in production of wheat would have generated a gain in
producers’ surplus of Rs. 10,682 million (using equation 2 of the analytical framework in
methodology).
The impact on domestic demand for wheat was estimated by equation 2. The demand
elasticity with respect to Lahore wholesale price of wheat was -0.121. Therefore, the impact of
the 7 percent increase in world price of wheat on the wholesale price was estimated to be 7.91

13
percent, as elasticity of wholesale price of wheat at Lahore with respect to international price
(c.i.f. Karachi) was estimated to be 1.13, given by the equation 3. Therefore, this would have
caused the per capita demand for wheat to decline by 0.957%. The domestic demand of wheat
was estimated to decline from 18.07 million tons to 17.90 million tons during 2004-05.
The increase in wholesale price of wheat in Pakistan and resultantly decrease in quantity
demanded would have caused a loss of consumer’s surplus of Rs. 12,557 million (using equation
1 of the analytical framework in methodology). It can be concluded from the preceding analysis
that the 7% increase in the international price of wheat due to trade liberalization had a positive
impact on the production of wheat in Pakistan. On the other hand it caused a negative impact on
the consumers while the overall impact or net loss to Pakistan was of Rs.1,875 million.
Impact of trade liberalization on Rice (Basmati) at national level
Following results, representing coefficients of price transmission, supply and demand
elasticities of basmati rice, are unit-free and relate only to percentage changes. The R2, DW and
F-statistics, all showed reasonable values.
Estimated supply equation for Basmati Rice in Pakistan
Log (BPROD) = 4.308 + 0.322 Log (FPB) (-1) + 0.011 TREND ………………. 5
(2.624)*** (1.650)** (0.627)
R2 = 0.861 Esbr = 0.322 DW = 1.758
Where
Log (BPROD) = Natural log of total production of rice in Pakistan (`000 tons).
Log (FPB) = Natural log of farm level price of paddy in Pakistan (Rs/Ton).
TREND = 1982=1, 1983=2,….2004=23
Esbr = Elasticity of supply with respect to farm level price of paddy.
Estimated Domestic Demand Equation for rice in Pakistan
Log (BCONS) = 7.243 - 0.225 Log (WPB) + 0.0456 TREND ……………….. 6
(2.380)** (-1.993)* (1.780)*
R2 = 0.683 Edbr = -0.225 DW = 1.451
Where

14
Log (BCON) = Natural log of total consumption of Rice in ‘000’ tons.
Log (WPB) = Natural log of wholesale price of Rice in Lahore (Rs/Ton).
Edbr = Elasticity of demand of Basmati rice with respect to its wholesale price.
Price Linkage Equations for Rice: Two sets of price linkage equations, representing the
relationship between price of paddy at farm level and price of milled rice at various market
channels, were estimated. The results of the relationship between wholesale price of milled rice
at Lahore versus its export price are given below:
Log (WPB) = -0.746 + 1.036 Log (IPB) ………………. 7
(-0.888) (11.764)***
R2 = 0.868 Ewbr = 1.036 DW = 1.615
Where
Log (WPb) = Natural log of wholesale price of Rice at Lahore in (Rs/ton).
Log (IPB) = Natural log of export price of Rice (Rs/ton).
Ewbr = Elasticity of wholesale price of rice at Lahore w.r.t. its export price.
The estimated results of the relationship between the farm gate price of paddy versus
wholesale price of rice at Lahore are as under:
Log (FPB) = -1.427 + 1.076 Log (WPB) …………….…. 8
(-4.251)*** (29.272)***
R2 = 0.976 Efbr = 1.076 DW = 1.68
Log (FPB) = Natural log of farm gate price of rice (Rs/ton).
Efbr = Elasticity of farm gate price of rice with respect to its wholesale price.
Impact on domestic prices of Rice in Pakistan
From equation 7, the elasticity of price transmission of wholesale price of Rice at Lahore
with respect to its export price was 1.036. It means that 1% increase in the export price of rice
would increase wholesale price of rice by 1.036 percent at Lahore. Therefore the increase in the
export price of rice by 7% would have caused an increase in the wholesale price of rice in
Pakistan by 7.252% under full trade liberalization. Thus the wholesale price of rice during 2004-
0 would have increased from Rs. 23328/ton to Rs. 25020/ton.

15
The impact of the increase in wholesale price of rice on the farm gate price of paddy was
estimated using equation 8. The elasticity of price transmission of the paddy at farm gate with
respect to wholesale price of rice at Lahore was 1.076. The impact was such that the farm gate
price of paddy would have increased by 7.532% in 2004-05 (from Rs. 12525/ton to Rs.
13468/ton) as a result of 7% increase in the wholesale price of rice at Lahore.
Impact on the domestic supply and demand of Rice
From equation 5, the elasticity of supply of rice with respect to its farm level price was
0.322. The impact of the 7% increase in the world price of rice on the farm gate price of paddy
was estimated at (7 x 1.076) in 2004-05. Therefore, this would have caused an increase in the
domestic production of rice by (7 x 1.076) (0.322), i.e. from 3884 thousand tons of Basmati
paddy (2522 thousand tons of rice x 1.54) to 3978 thousand tons (2583 thousand tons of rice x
1.54). This increase in production of paddy would generate a gain of producers’ surplus of Rs.
3708 million (using equation 2 of the analytical framework in methodology).
The impact on the domestic demand for rice was estimated by equation 6. The demand
elasticity with respect to wholesale price of Basmati at Lahore was -0.225. Therefore, the impact
of the 7% increase in world price of rice on wholesale price was estimated to be 7.252%. This
would have caused the domestic demand for Basmati rice to decline by 1.63%.
The domestic demand of rice was estimated to decline from 16.03 million tons to 15.77
million tons during 2004-05. The increase in wholesale price of rice in Pakistan and resultantly
decrease in quantity demanded would have caused a loss of consumer’s surplus of Rs. 2690
million. It can be concluded from the above analysis that the 7% increase in the international
prices of rice due to trade liberalization would have a positive impact on the production of rice in
Pakistan while causing a negative impact on the consumers although the net gain to Pakistan was
to be Rs.1018 million.
Effects of Trade Liberalization at Farm Level
Impact of trade liberalization on wheat and Basmati Basmati rice was analyzed using the
partial budgets of these crops without liberalization (during 1993-94) and with trade
liberalization (during 2004-05) at farm level in the rice areas of Punjab (Appendices A1and A2).
The impact of trade liberalization was analyzed through the changes in input and output prices

16
which considerably increased from 1993-94 to 2004-05 as the support prices of these crops
significantly increased and were quite close to the international prices (which were used to be
below international prices). Government allowed trade of these commodities to the private sector
which used to be completely under its control.
Impact of Trade Liberalization on Wheat at Farm Level
The impact of trade liberalization on wheat producers was analyzed using the partial
budgets of wheat crop without (1993-94 crop) and with (2004-05 crop) trade liberalization at
farm level in the rice areas of Punjab (Appendix A1). During this period, the minimum support
price of wheat had considerably increased and was close to the International price during 2004-
05. Expenditure on fertilizer, irrigation and land preparation significantly increased from 1993-
94 to 2004-05. For Example, expenditure on fertilizer increased from Rs. 1,187/ha to Rs.
4,804/ha during this period. Total cost of production of wheat increased from Rs. 8,130/ha to
Rs.26,576/ha during before and after liberalization period. Gross cost per ton of wheat increased
from Rs. 3,764 to Rs. 10,673 for with and without trade liberalization, respectively. These results
show positive impact of trade liberalization on wheat production in Punjab.
Impact of Trade Liberalization on Basmati Rice at Farm Level
The impact of trade liberalization on Basmati was analyzed using the partial budgets of
Basmati crop without (1993-94 crop) and with (2004-05 crop) trade liberalization at farm level in
the rice areas of Punjab (Appendix A2). Expenditure on fertilizer, irrigation and land preparation
had significantly increased from 1993-94 to 2004-05. For Example, expenditure on fertilizer
increased from Rs. 1,109/ha to Rs. 3,378/ha while total cost of production increased from Rs.
9,439/ha to Rs.27,831/ha before and after liberalization period. Gross cost per ton of Basmati
rice increased from Rs. 4,271 to Rs. 13,253 for with and without trade liberalization,
respectively. These results show positive impact of trade liberalization on Basmati production in
Punjab.
The trade liberalization in agriculture is affecting the production and consumption of
major food commodities in many ways. The most vital impact is on the prices of these
commodities which have significant implications for production and consumption pertaining to
producer’s ability to produce and consumer’s ability to consume. It is argued that trade

17
liberalization will increase domestic prices of basic food stuffs and thus will serve as incentives
for farmers to increase production. However, Pakistani farmers and Pakistan, as a whole cannot
get as much benefit as projected in many studies. In the case of wheat, the supply elasticity was
found to be extremely low by any reasonable standard. Thus increase in wheat production may
not be sufficient to meet the country’s deficit of wheat and price increase is likely to increase the
import bill and burden on the poor people, who purchase food grains from the market.
Moreover, keeping in view relatively inelastic supply response, the finding of means to
increase agricultural productivity and the issue of food security would be a challenge to Pakistan
in the near future. In the case of rice, domestic price is expected to be significantly higher than it
would have been in the absence of Uruguay Round. Such increase in price, on the domestic
level, would increase the production while internationally it would mean higher prices for rice
exporters. The effect on the consumption of rice would be relatively slight mainly due to
increasing trend in the rice consumption, which is likely to continue.
It may be concluded that membership of WTO is not a magic formula that will abruptly
bring only positive aspects for Pakistan. However, globalization trend in the coming years
suggests the need for a critical review of Pakistan’s agricultural policies and it is implicit that
precise policies and right reforms will create the necessary environment for improved and
sustained growth of agriculture leading to unrelenting economic performance.
SUMMARY AND CONCLUSION
The study intended to evaluate the impact of WTO on domestic prices, production and
consumption of major food commodities like wheat and rice and ultimately their impact on the
producers’ and consumers’ surpluses. The farm level impact was also calculated to chalk out the
eventual position at farm level with the purpose to identify necessary policies and actions to cope
with the new world situation. The study tries to provide a useful guide to the likely impacts of
agricultural liberalization. The findings of this study may be summarized as follows.
Because of the strategic importance of wheat, government used to intervene not only to
guarantee affordable supplies to consumers but also to provide market support to producers. The
impact of trade liberalization on wheat was estimated by standard regression analysis, utilizing
data on the relevant variables for the period 1982-83 to 2004-05. Using an FAO study, it was
assumed that the international price of wheat would increase by 7 percent. Due to this 7%

18
increase, it was estimated that wholesale and farm level prices of wheat in Pakistan would
increase by 7.91 and 6.65 percent, respectively under full liberalization. The increase in farm
level prices would have increased the total production of wheat from 19.50 million tons to 19.80
million tons (by 1.53%) during 2004-05. This increase in production of wheat would have
generated a gain of producer’s surplus of Rs. 10682 million. On the other hand due to increase in
wholesale price of wheat, the domestic demand of wheat would have declined form 18.07
million tons to 17.90 million tons (by 0.96%) in 2003-04, and so caused a loss of consumer
surplus of Rs. 12557 million. Overall the impact of the increase in the international price of
wheat would have resulted in a net loss to Pakistan of Rs. 1,875 million during 2004-05.
To find out the impact of trade liberalization on basmati rice, the data from 1982-83 to
2004-05 was analyzed by using standard regression analysis assuming that the world price of rice
would increase by 7 percent. The results showed that the wholesale and farm gate prices of
basmati rice would increase by 7.25. The increase in the farm level price would have increased
the total production of rice from 3884 thousand tons to 3978 thousand tons (by 0.35%), during
2004-05. This increase in the production of rice would have generated a gain of producer’s
surplus of Rs. 3708 million. However, due to increase in the wholesale price of rice (by 7.252%),
its domestic demand would have declined from 1,603 thousand tons to 1,577 thousand tons
during 2004-05 causing a loss of consumers’ surplus of Rs. 2690 million. Overall the impact of
the increase in the international prices of rice would have resulted in a gain to Pakistan of Rs.
1,215 million in 2003-04.
To study the impact of trade liberalization at farm level, the rice-wheat area of Punjab
province was selected to analyze the effects on wheat and rice. Partial budgets of these two
commodities were estimated for this purpose. The cost of production and net returns for wheat
and rice were estimated for the scenarios ‘without trade liberalization’ (using base year 1993-94)
and ‘with trade liberalization’ (for 2004-05). The difference in cost of production and net returns
between these two scenarios was assumed to be the effect of trade liberalization at the farm level
while keeping the yield constant.
Costs of production of wheat and rice increased by Rs. 18,595/ha and Rs. 18,553/ha
respectively, during 2004-05 as a result of trade liberalization. On the other hand, net returns in
case of wheat and rice increased by Rs. 2255/ha and Rs. 1345/ha, respectively during 2004.

19
Finally, on the basis of above findings, the study concluded that along with the challenges,
liberalization also offers immense potential for sustained agricultural performance. This,
however, cannot come about automatically and most of the projected gains from trade
liberalization would largely depend on the extent of internal liberalization and adjustment ability
of national agricultural policies to a rapidly changing environment.
4.2 SUGGESTIONS
Following suggestions may prove quite useful for the smooth process of liberalization;
• Agricultural policy needs to aim at improved infrastructure and institutions. Without
infrastructure and other institutional approach, Pakistan may not be able to take
advantage of price increase in the world market.
• It is expected that domestic prices of wheat will increase considerably and the country
will have to spend a huge amount of foreign exchange on its imports and the best
strategy would be to achieve self sufficiency through increased productivity of the local
wheat crop which is far below the potential yield levels.
• Targeted consumer subsidies should be provided to the low income groups and people
below the poverty line who are expected to be adversely affected by increase in wheat
prices. These subsidies are much less costly then the general subsidies, available to all
food consumers via price depressing policies.
• Export of rice is expected to gain from increased prices. Government should play its role
in terms of funding new research and development activities, aimed at improving rice
quality so that Pakistan remains competitive in the world rice market.
• Internal liberalization is the key to fully benefiting from external trade liberalization in
agriculture. There is a need to remove distortions in the agricultural sector, such as
excessive and unnecessary government control, restrictions on produce movement and
private sector participation in agriculture, fixing minimum support prices, etc.
• Due to lower (or negative) net returns from planting food grains, including wheat, the
cropping pattern is getting diversified with a shifting away from food grains towards
high value and export oriented crops. This is a very serious issue, since with the current
population growth of around 2%; demand for food commodities is increasing at a faster
rate. In such a situation there is need to carefully design policies on key issues, such as
whether or not to shift the food grain area towards high value and export oriented crops,

20
although earnings from these crops may be used to import food grains to meet domestic
requirements.
• Trade-related physical infrastructure in the country needs considerable improvements to
fulfill the growing needs of international trade in Pakistan. Facilities such as the
transport network, equipment for quality control, bulk storage and handling, railway
sheds, etc., should be improved through increased public and private investment to
develop the physical infrastructure.

21
Literature Cited Akhtar, M. R. (1999). Effects of trade liberalization on agriculture in Pakistan: Commodity
aspects. Working paper No. 44 United Nations ESCAP CGPRT center, Bogor
Indonesia. pp. 2-18.
Ashiq, M. R. and M. I. Ahmed (2001). Social profitability of wheat and oil seeds production in Pakistan. Pak. J. Agri. Econ. 4(2): 34-37.
FAO (1995). Impact of Uruguay Round on agriculture. Food and Agriculture Organization.
Rome. Italy. http://www.fao.org.htm Updated on 2004 February. Accessed 2004
May.
Govt. of Pakistan, (2003-2004). Pakistan Economic Survey. Economic Advisor’s Wing,
Finance Division, Islamabad.
Hassan, Z. A. 1995. Agreement on Agriculture in the Uruguay Round of GATT: From Punta Del
Esta to Marrakash. GATT Research Paper 95-GATT 2. Center for Agricultural and
Rural Development. Iowa State University, U. S. A.
Khan, S. (2001). Agriculture and the WTO: Economic issues and policy options for Pakistan.
Paper presented at the South Asia workshop on agriculture and the new trade agenda
in the WTO 2000 negotiations. Jan. 1st. Delhi. India
http://www.ictsd.org/pub/agr/wto.htm. Updated on 2003 January. Accessed 2004
August 23.
Naqvi, S.N.H. and Z. Mehmood (1995). The Uruguay Round and the developing countries. The
implications of the Uruguay Round for Pakistan. Islamabad: Pakistan institute of
development economics.
UNCTAD (1999). Tools for multilateral trade negotiations on Agriculture: Division on
International Trade in Goods and services and commodities. Commercial Diplomacy
Programme in Geneva. Doc # UNCTAD-DITC/MISC.30.
Wailes, E. J. (2002). Trade Liberalization in rice: Agricultural trade policies in the New
Millennium. P.L. Kennedy (ed.). Haworth Press. p. 26.
WTO (1995). Trade Policy Review-Pakistan. World Trade Organization. <http//:www.wto.org>

22
Appendix A1: Average farmer's cost of production and returns of wheat crop in Punjab, Pakistan
Without Trade Lib* With Trade Lib** Difference Operations/Input/Output
(Rs/hac) (Rs/hec) (Rs/hec)
1. Land Preparation 785.78 2022.93 1237.15
2. Seeds & Planting 784.69 2687.36 1902.67
3. Interculture/weeding/weedicides 45.42 508.27 462.85
4. Farm yard manure 52.34 111.15 58.81
5. Fertilizer 1187.06 4804.07 3617.01 6. Irrigation 674.75 4870.84 4196.09 7. Interest on investment @ 14%per year for 6 months on items 1-7 264.47 817.17 552.7
8. Harvesting & threshing 1833.98 5132.66 3298.68
9. Management charges for 6 months 252.68 681.72 429.04
10. Land rent for 6 months 2000.7 4940 2939.3
11. Gross cost (add items 1-10) 8129.99 26576.17 18446.18
12. Yield per hec (ton) 2.16 2.49 0.33
13. Farm gate price per ton (Avg. market price) 4000 10575 6575
14. Returns (multiply items 12 & 13) 8640 26331 17691
15. Value of wheat bhoosa 950.26 2470 1519.74
16. Gross returns (add items 14 & 15) 9590.26 28801 19210.74 17. Net returns per hec (subtract item 11 from 16) 1460.27 2225.58 765.31
19. Gross cost per ton (divide item 11 by 12) 3763.88 10673.16 6909.28
20. Net return per ton (divide item 17 by 12) 676.05 893.8 217.75 * Cost of production and net returns of 1993-94 wheat crop per acre, without the impact of trade
liberalization at the farm level
** Cost of production and net returns of 2004-05 wheat crop per acre, with the impact of trade
liberalization at the farm level
Source: Agricultural Prices Commission, Islamabad, Pakistan
A2: Average farmer's cost of production and returns of Basmati paddy rice crop in Punjab, Pakistan
Without Trade Lib* With Trade Lib** Difference Operations/Input/Output
(Rs/ha) (Rs/ha) (Rs/ha)
1. Land Preparation 1330.29 3161.60 1831.31
2. Nursery 944.31 2731.5 1787.19
3. Weedicides/Plant protection 364.7 1249.82 885.12
4. Fertilizer including FYM 1109.3 3378.96 2269.66
5. Irrigation 2397.48 9005.62 6608.14
6. Interest on investment @ 14%
per year for 6 months on items 1-5 430.23 1062.03 631.80
7. Harvesting, threshing & winnowing 880.78 2679.95 1799.17
8. Management charges for 6 months 252.68 610.09 357.41
9. Land rent for 6 months 1729 3952.0 2223
10. Gross cost (add items 1-9) 9438.77 27831.62 8392.85
11. Yield per ha (tons) 2.21 2.21 -
12. Farm gate price per ton 4850 13580 9000

23
13. Returns (multiply items 11 & 12) 10718.5 28518 17799.5
14. Value of straw 406.66 2346.5 1939.84
15. Gross returns (add items 13 & 14) 11125.16 30864.50 19739.34
16. Net returns/ha (subtract item 10 from 15) 1686.39 3031.88 1345.49
17. Gross cost per ton (divide item 10 by 11) 4270.93 13253.15 8982.22
18. Net return per ton (divide item 16 by 11) 763.07 1443.75 680.68
* Cost of production and net returns of 1993-94 Basmati paddy rice crop per hectare, without the impact of trade
liberalization at the farm level
** Cost of production and net returns of 2004-05 Basmati paddy rice crop per hectare, with the impact of trade
liberalization at the farm level
Source: Agricultural Prices Commission, Islamabad, Pakistan