impact of working capital management on market return: a … 10-25.pdf · · 2016-05-26is a...
TRANSCRIPT

Business Management Dynamics
Vol.5, No.10, Apr 2016, pp.10-25
©Society for Business and Management Dynamics
Impact of Working Capital Management on Market Return: A Comparative Study of Pakistan and Indian Chemical Sector
Muhammad Akram1, Sulaman Jamil2, Najaf Ali3, Bilal Ali4, Abdulsattar5, Waqas Khan6 Abstract Working Capital Management is an excellent tool that is used by a lot of companies to improve their earnings. This concept is used to manage the arrangement of its short term asset and short term liabilities. The present study is a comparative study to test the impact of working capital management on market return of chemical sector in Pakistan and India. The chemical companies listed in the Karachi Stock Exchange (KSE) of Pakistan and National Stock Exchange (NSE) of India, were studied for a period of 14 years from 1998 to 2011. In all 30 out of 36 chemical companies from Pakistan and 44 out of 53 chemical companies from India were included in the study as a sample with complete financial data. Market return is used as dependent variable and working capital management with its key measures (ACP, APP, Inventory turnover, CCC, CATAR, CLTAR, FDR, CR, CATSR and Firm Size ) used as independent variables. Statistical measures as descriptive statistics, Pearson’s correlation and panel regression methods were used for data analysis. The results of the study showed that there is a positive significant relationship of Average Payment Period (APP), Cash Conversion Cycle (CCC), Financial Debt Ratio (FDR), Current Assets to Total Assets Ratio (CATAR) with market return in Pakistan and Inventory Turnover, Current Assets to Total Assets (CATAR), Firm Size with Market Return in India. Similarly, there is negative significant relationship between Average Collection Period (ACP), Current Assets to Total Sales Ratio (CATSR) with market return in Pakistan and Average Collection Period (ACP), Average Payment Period (APP), Financial Debt Ratio (FDR), Current Liability to Total Assets Ratio (CLTAR), Current Assets to Total Sales Ratio (CATSR) with market return in India. These results show that in improving the market return (shareholder’s wealth), the working capital management plays an important role in chemical sector.
Key words: Working Capital Management, Tobin’s Q, Chemical Sector, Pakistan, India
Available online
www.bmdynamics.com ISSN: 2047-7031
INTRODUCTION Working Capital Management is the management to finance its day to day operational activities. This is an excellent tool that is used by a lot of companies to improve their earnings. This concept is used to manage the arrangement of its short term asset and short term liabilities. Short term assets involve the short term debtors, cash in hand, cash lying at bank and investment in securities and inventories. Similarly, the current liabilities consist of advances, borrowings and creditors. In the all ages of business, the efficient and effective use of Working Capital is necessary. A number of policies and arrangements are to be followed to ensure the business reliability and minimizing the risks to be involved. It is the most top priority of all businesses to plan and develop itself with the development and planning of working capital. Broadly speaking, it can be said that all current assets refer to the gross working capital which states all investment in current assets. In other hands, narrowly speaking working capital termed as all current assets less current liabilities. Horne & John (2001) said about the working capital as
* National University of Modern Languages Islam Abad, Pakistan 1 E-mail: [email protected] 2 E-mail: [email protected] 3 E-mail: [email protected] 4 E-mail: [email protected] 5 E-mail: [email protected] 6 E-mail: [email protected]

Business Management Dynamics
Vol.5, No.10, Apr 2016, pp.10-25
©Society for Business and Management Dynamics
difference of current assets and current liabilities. The main objective of the research is to examine the impact of working capital management on market return of the chemical companies in Pakistan and India. Weston J. and Brigham (1975) examined that the hedging and conservative approaches and policies to be followed while financing and managing working capital to its risks and returns. The aggressive approach states that there should match the fund sources and the financed assets. For analyzing, these assets are categorized broadly as those which require a certain amount and not varied over time and those which varied. Under the conservative approach, firms finance in permanent assets along with current assets. The condition, under which the firms avoid in investing current assets than such firms do invest in trade able securities. This all is to be done to conserve liquidity that is why such approach said to be a conservative approach. Under the aggressive approach more of the financing is short term than by matching plan. By this approach some of the parts of financing are in permanent current assets. The focus of this study is on market return of chemical sectors and the performance of the working capital management and initiated to answer the question of the impact of working capital management on market return. The specific objectives of the study are to examine the impact of average collection period, average payment period, inventory turnover, cash conversion cycle, financial debt ratio, current assets to total assets ratio, current liability to total assets ratio, current ratio, current assets to total sales ratio and firm size on market return of the Indo-Pak chemical companies. This study is much important as a comparison between the Pakistan and Indian chemical sector. It provides guidelines to experts by comparing their sector with the foreign country. It also explains the relationship between various factors and the returns from the industry. This study also provides guidelines to the policy makers’ of the financial institutes to formulate an appropriate financial policy for the chemical industry of Pakistan and India. LITERATURE REVIEW
Many researchers have focused on the study to indicate the relationship between the working capital management and the returns in the different prospects and environment. Korankye (2013) examined the working capital management effect on the firm’s profitability. For such purpose, study was conducted using a sample of 6 out of 7 manufacturing companies of Ghana stock exchange. The data was collected by using the company’s reports and final accounts during 2004 to 2011. The working capital cycle was used as a proxy for the measurement of working capital and for measuring profitability gross operating profit margin was used. Financial leverage, interest coverage ratio and aggressive investment policy as measured by CATAR (current assets to total assets ratio) were involved as control variables in the research. Pearson’s co-relation and ordinary least square regression methods were used for analysis. The result indicated the significant negative effect of the working capital cycle on the profitability. The study also suggested from the correlation analysis the negative relationship between the collection days, payment days, and inventory in days and the firm’s profitability. While there was a positive significant relationship among interest coverage, current assets to total assets (CATAR) ratio and the firm’s output. Alvinasab and Davoudi (2013) worked out for the association between the WCM and the firm’s profitability. A Sample of companies listed on the Tehran stock exchange was studied. There were 147 listed companies included in the study. Panel Data for 2005-2009 was selected in the study. Various variables for the working capital management just like current assets to total assets ratio (CATAR), Current Ratio (CR), current liabilities to total assets ratio (CLTAR), Cash Conversion Cycle (CCC), and debt to assets (DTA) ratio were studied as independent variables and for the measurement of profitability return on asset (ROA) and return on equity (ROE) were taken. For the analysis purpose regression and correlation analysis were taken in the study. The observations concluded that there were negative significant association of the CCC with the ROA and ROE. On the other hand there were insignificant relationships between the CR and ROE. Adina (2010) analyzed the efficiency of working capital management. For analyzing such efficiency, 20 Alba country companies’ financial statements were studied. The study period was from 2004 to 2008. The
Business Management Dynamics
Vol.5, No.10, Apr 2016, pp.10-25
©Society for Business and Management Dynamics
profitability indicators used in the study were Assets return (ROA), Return on Equity (ROE) and the Sales Return. Period for cash receivables, storage period, periods of paying debts and the cash conversion cycle was the proxy variables used for measuring the working capital management. For analyzing data, a method of Regression analysis was used. The analysis concluded the weak negative association between the firm’s profitability and the working capital management. David (2009) studied to investigate the association between the profitability of the firms and the working capital management. A number of 30 listed companies from the Nairobi Stock Exchange were selected to accomplish the goal. There was a study period from 1993 to 2008. For the analysis of the data regression model was used in the study. The collection days, inventory conversion days and the payment period were three variables used to measure the working capital management. Results indicated that there was high profit with the short collection period. There is a highly significant positive relationship of inventory conversion period and also a significant positive association of the payment period with the firm’s profitability. There is also a significant positive relationship between average payment period and the profitability. Zafar and Athar (2012) examined the effect of the management of working capital on the profitability of a firm. For the study purpose sugar industry in Pakistan was selected. A sample of 19 sugar companies was selected which were listed on the KSE (Karachi Stock Exchange). The secondary data was for a period of 1999 to 2009. Trade credit policy, payment policy and the inventory policy were used as components of Working Capital which were considered as independent variables. Net Operating Income (NOI) as the dependent variable was used to measure the profitability. Pearson’s correlation and regression model used to analyze the data. The result showed that sales growth, current ratio, account payable in days and inventory have a significant relationship with the profitability. Similarly on the other hand collection period, sales and the gearing ratio have the insignificant relationship with the profitability. HYPOTHESIS
The firms under study suffer from inadequacy of working capital and poor and ineffective working capital management practices. So the research is based on the following hypothesis. 1 Ho: There is no significant relationship between Tobin’s Q and ACP.
H1: There is a significant relationship between Tobin’s Q and ACP.
2 Ho: There is no significant relationship between Tobin’s Q and APP.
H1: There is a significant relationship between Tobin’s Q and APP.
3 Ho: There is no significant relationship between Tobin’s Q and ITID.
H1: There is a significant relationship between Tobin’s Q and ITID.
4 Ho: There is no significant relationship between Tobin’s Q and CCC.
H1: There is a significant relationship between Tobin’s Q and CCC.
5 Ho: There is no significant relationship between Tobin’s Q and FDR.
H1: There is a significant relationship between Tobin’s Q and FDR.
6 Ho: There is no significant relationship between Tobin’s Q and CATAR.
H1: There is a significant relationship between Tobin’s Q and CATAR.
Business Management Dynamics
Vol.5, No.10, Apr 2016, pp.10-25
©Society for Business and Management Dynamics
7 Ho: There is no significant relationship between Tobin’s Q and CLTAR.
H1: There is a significant relationship between Tobin’s Q and CLTAR.
8 Ho: There is no significant relationship between Tobin’s Q and CR.
H1: There is a significant relationship between Tobin’s Q and CR.
9 Ho: There is no significant relationship between Tobin’s Q and CATSR.
H1: There is a significant relationship between Tobin’s Q and CATSR.
10 Ho: There is no significant relationship between Tobin’s Q and Firm Size.
H1: There is a significant relationship between Tobin’s Q and Firm Size.
RESEARCH METHODOLOGY
This study is based on the data of chemical companies of Pakistan and India from a period of 1998-2011. For the analysis of such data to accomplish the goal Panel Data Regression Model is estimated in the study. The estimation is
Model involved the Market Return. Tobin’s Q (measure of market return) will be used as a dependent variable with ten explanatory variables. The impact can be checked of the working capital management on the market return in the following equation form. YTobin’s Q = a + b(ACP) + b(APP) + b(ITID) + b(CCC) + b(CATAR) + b(CLTAR) + b(Firm Size) + b(FDR) +
b(CR) + b(CATSR) + e
Average Collection Period in days (ACP), Firm Size measured by the logarithm of sales, Financial Debt Ratio (FDR), Current Ratio (CR), Average Payment Period in days (APP), Cash Conversion Cycle (CCC), Inventory Turnover in days (ITID), Current Assets to Total Assets Ratio (CATSR), Current Liabilities to Total Assets Ratio (CLTAR), and Current Assets to Total Assets Ratio (CATAR) will be used as a proxy measure for the working capital management in the model. Market return will be measured by the term Tobin’s Q. Tobin’s Q was introduced by James Tobin and William Brainerd in 1969. It is an “Economic Theory of Investment Behavior”. Tobin’s Q is a ratio of the market value of the firm’s existing shares to the replacement cost of firm’s physical assets. The advantage of using Tobin's Q is that the difficult problem of estimating either rate of return or marginal costs is avoided. On the other hand, for Q to be meaningful, one needs accurate measures of both the market value and replacement cost of a firm’s assets. It is usually possible to get an accurate estimate for the market value of a firm’s assets by summing the values of the securities that a firm has issued, such as stocks and bonds. It is much more difficult to obtain an estimate of the replacement costs of its assets, unless the used equipment still exists in the market. Moreover, expenditures on advertising and research and development create intangible assets that may be hard to value. Typically, researchers who construct Tobin's Q ignore the replacement costs of these intangible assets in their calculations. This ratio states that if Q (representing equilibrium) is greater than one (Q> 1), additional investment in the firm would make sense because the profits generated would exceed the cost of firm's assets. If Q is less than one (Q< 1), the firm would be better off selling its assets

Business Management Dynamics
Vol.5, No.10, Apr 2016, pp.10-25
©Society for Business and Management Dynamics
instead of trying to put them to use. The ideal state is where Q is approximately equal to one denoting that the firm is in equilibrium. Tobin’s Q can be computed by the following formula.
Working capital management would be considered as independent variable. The proxy variables with the formula and abbreviations used for the working capital management measures are presented in the table.
Table 1: Variables Abbreviations
Here the study is in the struggle to establish the relationship of the working capital management measures with the performances for a sample of 74 companies which were with-in the range of entire window period that is 1998 to 2011 over a period of 14 years or 1036 firm’s year observations. In this study only empirically test is being conducted to solve the problem. Therefore, it is an applied type of Research. Fertilizer companies listed in KSE (Karachi Stock Exchange) of Pakistan and NSE (National Stock Exchange ) of India have been selected for study. The secondary data have been collected from financial reports of the companies for a period of 1998 to 2011 and structured questionnaire and interview from Managers and high ups have been conducted for further clarification. All chemical companies listed on the Pakistani stock exchanges and Indian stock exchanges are treated study population. It is very hard to get all populations, so a criteria is selected through which every company should have to examine in order to include in the sample. The study consists of 36 companies related to chemical sector listed on Karachi Stock Exchange and the 53 companies related to chemical sector listed in National stock exchange of India. Final companies for data analysis were selected by some selection criteria which stated that the companies which were with-in the range of entire window period that is 1998 to 2011.So finally, a sample of 74companies, 30 companies related to KSE and 44 companies related to NSE over a period of 14 years and a total of 1036 firm’s year observations were selected. To accomplish the goal, the data was collected from Karachi Stock Exchange (KSE), National Stock Exchange (NSE), State bank of Pakistan (SBP), Internet and web sites.
Sr. Variables Measures Abbreviation
i. Average Collection Period Account Receivables / sales * 365 ACP
ii. Average Payment Period Account Payables / purchase * 365 APP
iii. Inventory Turnover in days Inventory / C.G.S * 365 ITID
iv. Cash Conversion Cycle ACP + ITID – APP CCC
v. Financial Debt Ratio Total Liabilities / Total Assets FDR
vi. Current Assets To Total Assets Current Assets / Total Assets CATAR
vii. Current Liabilities To Total Assets Current Liabilities / Total Assets CLTAR
viii. Current Ratio Current Assets / Current Liabilities CR
ix. Current Assets To Sales Ratio Current Assets / Sales CATSR
x. Firm Size Logarithm of sales LOS

Business Management Dynamics
Vol.5, No.10, Apr 2016, pp.10-25
©Society for Business and Management Dynamics
In addition to the results concluded from the secondary data, it was also conducted the structured questionnaire and personal interview with the Managers and high-ups just for further result clarification. For the purpose, five number of managers and financial analyst of chemical companies which were easy to access and available in the Lahore (Pakistan) region as Descon Chemical Limited, Nimir Industrial Chemical Limited, Sardar Chemical Industries Limited, Shaffi Chemical Industries Limited and Pak Arab Fertilizer (Multan). RESULTS OF THE STUDY Table 2 and 3 shows the descriptive statistics of the companies listed in Karachi Stock Exchange of Pakistan and National Stock Exchange of India.
Table 2: Descriptive Summary Statistics {KSE-Pakistan}
ACP APP CATAR CATSR CCC CLTAR CR FDR Firm
Size
Inventory
Turnover TOBINSQ
Mean 41.62 449.84 0.58 0.96 -354.79 0.47 1.65 0.55 7.81 49.77 0.45
Maximum 298.20 1286.88 0.97 35.60 135.49 4.53 10.55 3.55 49.70 992.98 1.008
Minimum 0.00 0.00 0.007 0.00 -12692.9 0.048 0.009 0.099 -40.3 0.00 -2.557
Std. Dev. 47.82 1228.79 0.25 2.92 1217.70 0.37 1.27 0.277 13.50 72.47 0.297
Jarque-Bera 356.21 5987.03 34.60 14691.82 6225.301 7546.94 3234.37 2067.07 11.90 8066..18 1884.97
Probability 0.00 0.00 0.00 0.00 0.00 0.00 0.00 0.00 0.0025 0.00 0.00
Sum 17480.56 188933.7 246.5408 406.69 -149014 197.98 696.44 232.28 3281.71 20906.38 191.67
Sum Sq. Dev.
958375..2 6.33E+08 26.44 3589.04 6.21E+08 59.33 683.26 32.37 76420.21 220103.6 37.105
Obs.rvations 420 420 420 420 420 420 420 420 420 420 420
The result indicated the average collection period for an average of 42 days with a minimum of zero and a maximum of 298 days. This means that the firms granted a credit period of 42 days to their customers for the collection of credit. The average payment period for the firms was 450 days that means the firms pay to creditors for an average period of 450 days. This concluded that firm enjoyed a time exceed of 408 days in payment than collection. The Inventory took an average for sales were 50 days. The time lag between purchase and sales was for an average period of 355 days. The current assets formed 58% of total assets and 96% of sales. Similarly, current liability formed for an average 47% of total assets. The firms included 45% market return in the sample.

Business Management Dynamics
Vol.5, No.10, Apr 2016, pp.10-25
©Society for Business and Management Dynamics
Table 3: Descriptive statistics [NSE-India]
ACP APP CATAR CATSR CCC CLTAR CR FDR FIRM
SIZE Invtrnovr TOBINSQ
Mean 38.99 1410.7 0.55 0.48 242.14 0.45 1.61 0.54 8.95 40.99 0.46
Max 186.15 1628.81 0.97 3.16 417.99 3.00 10.55 1.05 49.70 259.55 1.00
Min 0.00 0.00 0.05 0.09 -702.99 -2 0.11 0.09 -28 0.00 -0.05
Std.
Dev. 36.98 11731.1 0.26 0.31 291.03 0.28 1.46 0.20 12.49 46.67 0.22
Jarque
Bera 102.07 79748.34 55.48 22196.3 1048.63 13294.04 4833.45 20.92 32.86 162.61 17.00
Prob 0.00 0.00 0.00 0.00 0.00 0.00 0.00 0.000029 0.00 0.00 0.000203
Sum 24019.6 86902.0 343.13 299.41 149161.72 280.38 996.7 336.68 5513.7 25250.2 289.28
Sum Sq. Dev.
841431.9 8.46E+10 44.79 60.51 5.21E+13 50.95 1324.4 29.94 96061.7 1339803. 31.85
Obs 616 616 616 616 616 616 616 616 616 616 616
The result indicated the average collection period for an average of 39 days with a minimum of zero and a maximum of 186 days. This means that the firms granted a credit period of 39 days to their customers for the collection of credit. The average payment period for the firms was 85 days that means the firms pay to creditors for an average period of 1410 days. This concluded that the customers enjoyed for a period of 1371 days-time exceed in payments. The Inventory took an average for sales were 41 days. The time lag between purchase and sales was for an average period of 242 days. The current assets formed 56% of total assets and 48% of sales. Similarly, current liability formed for an average 45% of total assets. The firms included 46% market return in the sample. Model analyzes the effect of Working capital management on market return in Pakistan and India. For the purpose dependent variable Tobin’s Q and independent variable working capital management were selected. The dependent variables Tobin’s Q andthe independent variables as ACP, APP, ITID, CCC, CATAR and CATSR, Firm Size, FDR, CR and CATSR. The study employed a panel least square method on 74 Indo-Pak chemical firms. Tables structured in the models clearly depict the comparisons between Pakistan and India. Table 4 and 5 shows the correlation matrix of the Pakistani and Indian data for the model.
Business Management Dynamics
Vol.5, No.10, Apr 2016, pp.10-25
©Society for Business and Management Dynamics
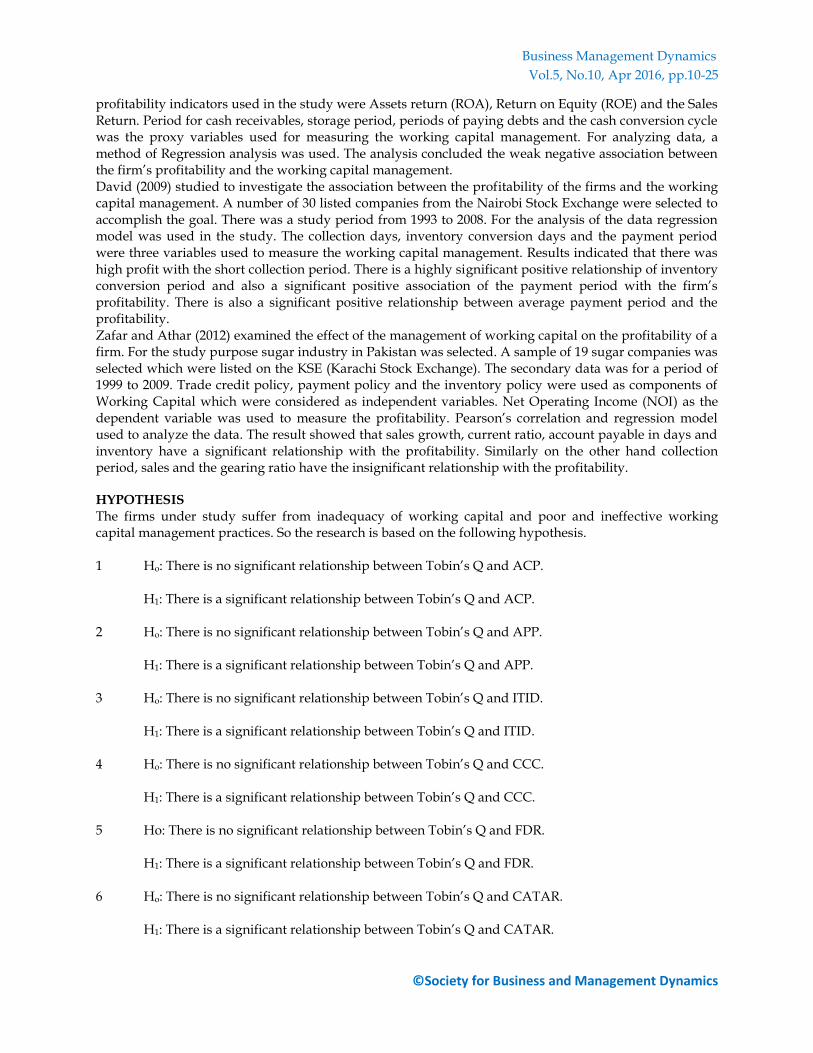
Table4: Correlation Matrix [KSE]
Variables ACP APP CATAR CATSR CCC CLTAR CR FDR FIRMSIZE INVTURNOVR TOBINSQ
ACP 1 0.123 0.081 0.118 -0.164 0.151 -0.209 0.206 -0.146 -0.081 -0.221
APP 1 0.169 0.284 -0.444 0.255 -0.106 0.056 0.001 -0.476 -0.088
CATAR 1 0.121 0.199 -0.109 0.508 -0.279 -0.052 0.168 0.312
CATSR 1 -0.27 0.136 -0.008 0.128 0.039 -0.022 -0.131
CCC 1 -0.509 0.214 -0.384 -0.003 0.276 0.461
CLTAR 1 -0.406 0.568 -0.029 -0.114 -0.838
CR 1 -0.521 0.132 0.229 0.522
FDR 1 -0.075 -0.154 -0.826
FIRMSIZE 1 -0.047 0.057
INVTURNOVR 1 0.16
TOBINSQ 1
The table 4 shows the coefficient correlations for the Pakistani chemical firms. Results show that Tobin’s
Q is positively related to the CATAR, CCC, CR, Firm Size and ITID but negatively related with ACP,
APP, CATSR, CLTAR and FDR.
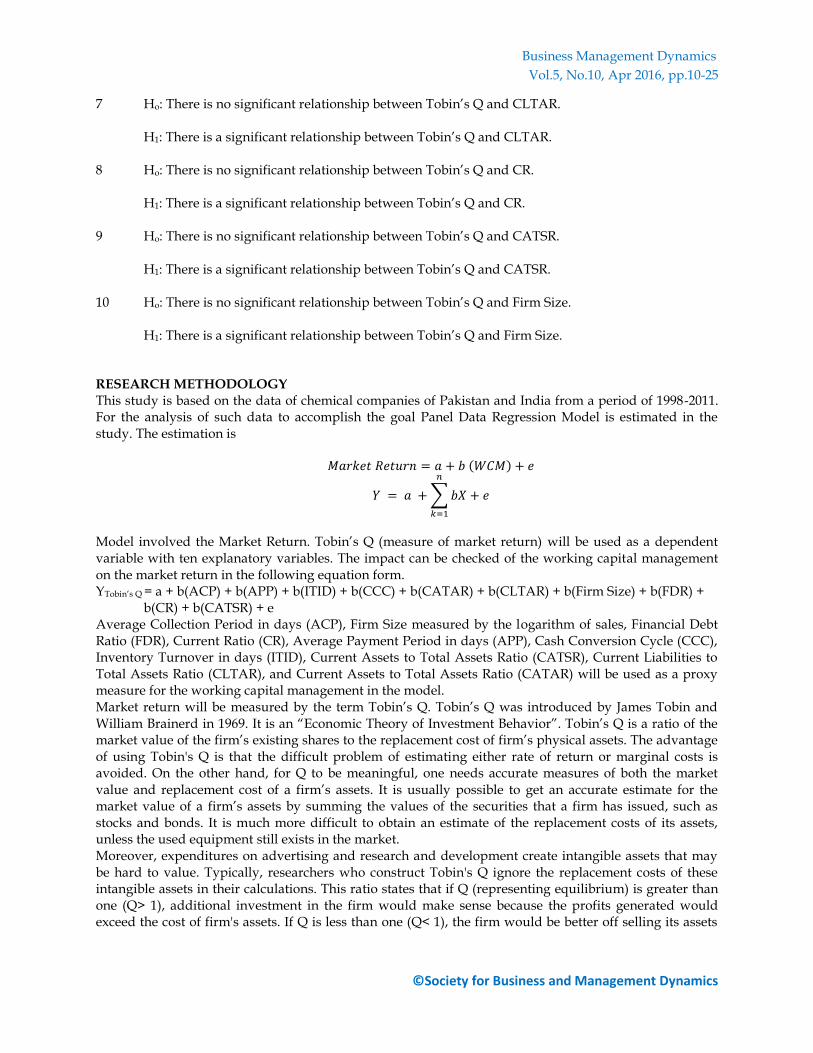
Table5: Correlation Matrix [NSE]
Variables ACP APP CATAR CATSR CCC CLTAR CR FDR FIRMSIZE Invtrnovr TOBINSQ
ACP 1.000 0.085 0.134 0.082 0.115 0.322 -0.316 0.457 0.003 -0.066 -0.519
APP
1.000 0.203 0.148 -0.763 0.275 -0.142 0.068 0.184 -0.058 -0.091
CATAR
1.000 0.382 0.059 0.103 0.437 -0.095 -0.062 0.311 0.100
CATSR
1.000 -0.098 0.030 0.439 -0.046 0.112 0.124 0.030
CCC
1.000 -0.258 0.221 -0.101 -0.174 0.265 0.116
CLTAR
1.000 -0.302 0.575 0.037 -0.043 -0.587
CR
1.000 -0.508 0.074 0.363 0.520
FDR
1.000 0.001 -0.157 -0.958
FIRMSIZE
1.000 -0.148 0.038
Invtrnovr
1.000 0.172
TOBINSQ
1.000
Business Management Dynamics
Vol.5, No.10, Apr 2016, pp.10-25
©Society for Business and Management Dynamics
The above table 5 shows the coefficient correlations for the Indian chemical firms. Results show that Tobin’s Q is positively related to the CATAR, CATSR, CCC, CR, Firm Size and ITID but negatively related with ACP, APP, CLTAR and FDR. The independent variables are checked on dependent variable Tobin’s Q for both the countries separately. YTobin’s Q = a + b(ACP) + b(APP) + b(ITID) + b(CCC) + b(CATAR) + b(CLTAR) + b(FirmSize) + b(FDR) +
b(CR) + b(CATSR) + e ……(1) Table6 and 7 shows the regression analysis with fixed effect for the Pakistani and Indian data and accepted for the model after a test check through fixed, random and OLS effect models. To check which model is most appropriate either fixed effect or random effect, Hausman test is used. The results concluded that probability value is very small that is less than 5 percent so the fixed effect model is more appropriate. Now further Wald test is used to check whether fixed effect or OLS model which one is most appropriate. The results concluded that fixed model is most appropriate. So here the author selected the fixed effect model as most appropriate for analysis.
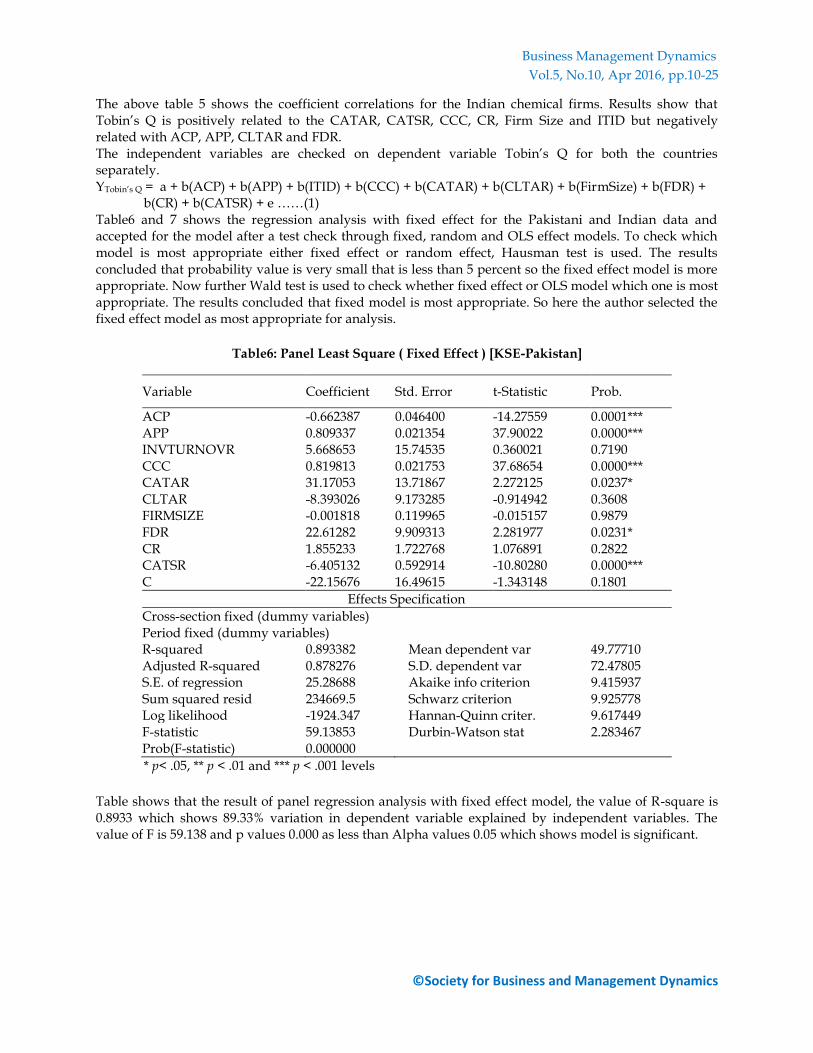
Table6: Panel Least Square ( Fixed Effect ) [KSE-Pakistan]
Variable Coefficient Std. Error t-Statistic Prob.
ACP -0.662387 0.046400 -14.27559 0.0001*** APP 0.809337 0.021354 37.90022 0.0000*** INVTURNOVR 5.668653 15.74535 0.360021 0.7190 CCC 0.819813 0.021753 37.68654 0.0000*** CATAR 31.17053 13.71867 2.272125 0.0237* CLTAR -8.393026 9.173285 -0.914942 0.3608 FIRMSIZE -0.001818 0.119965 -0.015157 0.9879 FDR 22.61282 9.909313 2.281977 0.0231* CR 1.855233 1.722768 1.076891 0.2822 CATSR -6.405132 0.592914 -10.80280 0.0000*** C -22.15676 16.49615 -1.343148 0.1801
Effects Specification
Cross-section fixed (dummy variables) Period fixed (dummy variables) R-squared 0.893382 Mean dependent var 49.77710 Adjusted R-squared 0.878276 S.D. dependent var 72.47805 S.E. of regression 25.28688 Akaike info criterion 9.415937 Sum squared resid 234669.5 Schwarz criterion 9.925778 Log likelihood -1924.347 Hannan-Quinn criter. 9.617449 F-statistic 59.13853 Durbin-Watson stat 2.283467 Prob(F-statistic) 0.000000
* p< .05, ** p < .01 and *** p < .001 levels
Table shows that the result of panel regression analysis with fixed effect model, the value of R-square is 0.8933 which shows 89.33% variation in dependent variable explained by independent variables. The value of F is 59.138 and p values 0.000 as less than Alpha values 0.05 which shows model is significant.
Business Management Dynamics
Vol.5, No.10, Apr 2016, pp.10-25
©Society for Business and Management Dynamics
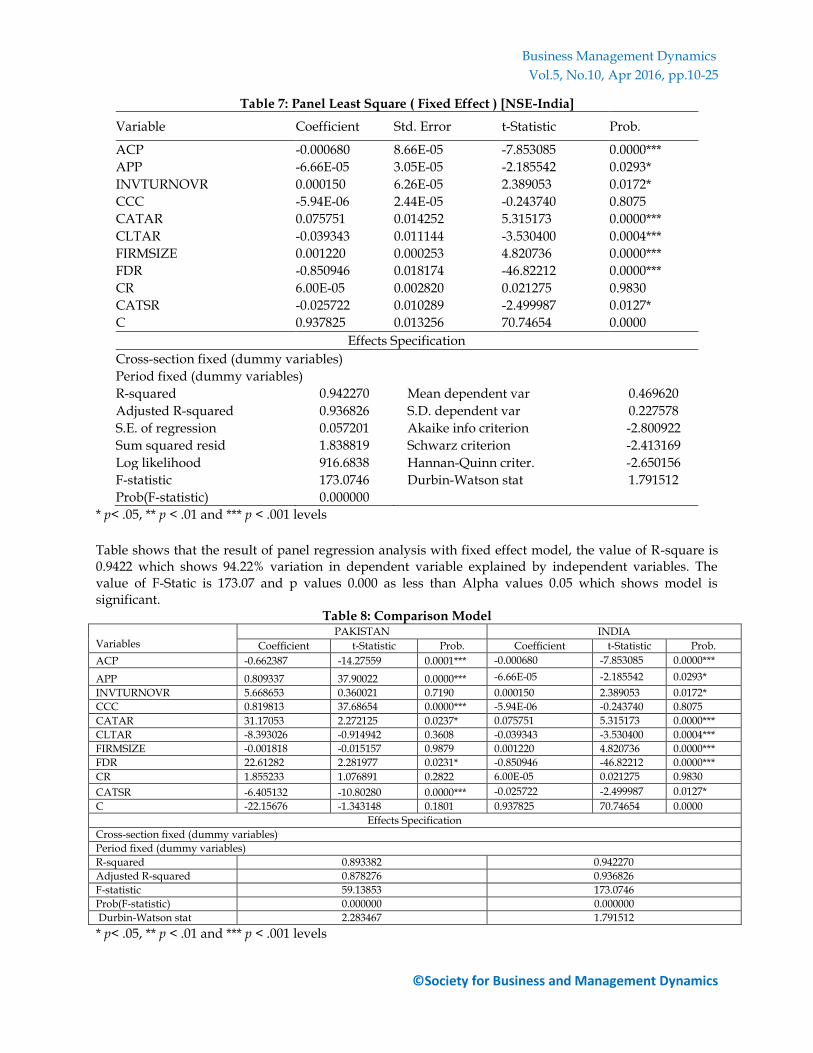
Table 7: Panel Least Square ( Fixed Effect ) [NSE-India]
Variable Coefficient Std. Error t-Statistic Prob.
ACP -0.000680 8.66E-05 -7.853085 0.0000***
APP -6.66E-05 3.05E-05 -2.185542 0.0293*
INVTURNOVR 0.000150 6.26E-05 2.389053 0.0172*
CCC -5.94E-06 2.44E-05 -0.243740 0.8075
CATAR 0.075751 0.014252 5.315173 0.0000***
CLTAR -0.039343 0.011144 -3.530400 0.0004***
FIRMSIZE 0.001220 0.000253 4.820736 0.0000***
FDR -0.850946 0.018174 -46.82212 0.0000***
CR 6.00E-05 0.002820 0.021275 0.9830
CATSR -0.025722 0.010289 -2.499987 0.0127*
C 0.937825 0.013256 70.74654 0.0000
Effects Specification
Cross-section fixed (dummy variables)
Period fixed (dummy variables)
R-squared 0.942270 Mean dependent var 0.469620
Adjusted R-squared 0.936826 S.D. dependent var 0.227578
S.E. of regression 0.057201 Akaike info criterion -2.800922
Sum squared resid 1.838819 Schwarz criterion -2.413169
Log likelihood 916.6838 Hannan-Quinn criter. -2.650156
F-statistic 173.0746 Durbin-Watson stat 1.791512
Prob(F-statistic) 0.000000
* p< .05, ** p < .01 and *** p < .001 levels
Table shows that the result of panel regression analysis with fixed effect model, the value of R-square is 0.9422 which shows 94.22% variation in dependent variable explained by independent variables. The value of F-Static is 173.07 and p values 0.000 as less than Alpha values 0.05 which shows model is significant.
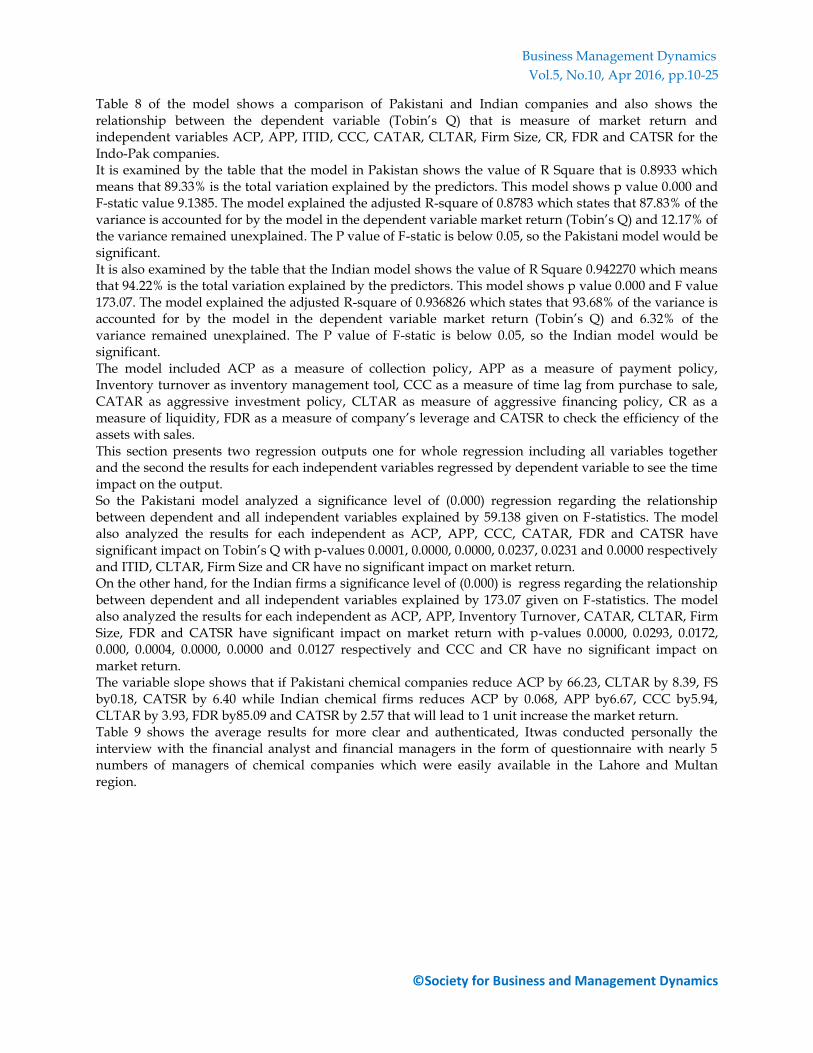
Table 8: Comparison Model
Variables PAKISTAN INDIA
Coefficient t-Statistic Prob. Coefficient t-Statistic Prob.
ACP -0.662387 -14.27559 0.0001*** -0.000680 -7.853085 0.0000***
APP 0.809337 37.90022 0.0000*** -6.66E-05 -2.185542 0.0293*
INVTURNOVR 5.668653 0.360021 0.7190 0.000150 2.389053 0.0172*
CCC 0.819813 37.68654 0.0000*** -5.94E-06 -0.243740 0.8075
CATAR 31.17053 2.272125 0.0237* 0.075751 5.315173 0.0000***
CLTAR -8.393026 -0.914942 0.3608 -0.039343 -3.530400 0.0004***
FIRMSIZE -0.001818 -0.015157 0.9879 0.001220 4.820736 0.0000***
FDR 22.61282 2.281977 0.0231* -0.850946 -46.82212 0.0000***
CR 1.855233 1.076891 0.2822 6.00E-05 0.021275 0.9830
CATSR -6.405132 -10.80280 0.0000*** -0.025722 -2.499987 0.0127*
C -22.15676 -1.343148 0.1801 0.937825 70.74654 0.0000
Effects Specification
Cross-section fixed (dummy variables)
Period fixed (dummy variables)
R-squared 0.893382 0.942270
Adjusted R-squared 0.878276 0.936826
F-statistic 59.13853 173.0746
Prob(F-statistic) 0.000000 0.000000
Durbin-Watson stat 2.283467 1.791512
* p< .05, ** p < .01 and *** p < .001 levels
Business Management Dynamics
Vol.5, No.10, Apr 2016, pp.10-25
©Society for Business and Management Dynamics
Table 8 of the model shows a comparison of Pakistani and Indian companies and also shows the relationship between the dependent variable (Tobin’s Q) that is measure of market return and independent variables ACP, APP, ITID, CCC, CATAR, CLTAR, Firm Size, CR, FDR and CATSR for the Indo-Pak companies. It is examined by the table that the model in Pakistan shows the value of R Square that is 0.8933 which means that 89.33% is the total variation explained by the predictors. This model shows p value 0.000 and F-static value 9.1385. The model explained the adjusted R-square of 0.8783 which states that 87.83% of the variance is accounted for by the model in the dependent variable market return (Tobin’s Q) and 12.17% of the variance remained unexplained. The P value of F-static is below 0.05, so the Pakistani model would be significant. It is also examined by the table that the Indian model shows the value of R Square 0.942270 which means that 94.22% is the total variation explained by the predictors. This model shows p value 0.000 and F value 173.07. The model explained the adjusted R-square of 0.936826 which states that 93.68% of the variance is accounted for by the model in the dependent variable market return (Tobin’s Q) and 6.32% of the variance remained unexplained. The P value of F-static is below 0.05, so the Indian model would be significant. The model included ACP as a measure of collection policy, APP as a measure of payment policy, Inventory turnover as inventory management tool, CCC as a measure of time lag from purchase to sale, CATAR as aggressive investment policy, CLTAR as measure of aggressive financing policy, CR as a measure of liquidity, FDR as a measure of company’s leverage and CATSR to check the efficiency of the assets with sales. This section presents two regression outputs one for whole regression including all variables together and the second the results for each independent variables regressed by dependent variable to see the time impact on the output. So the Pakistani model analyzed a significance level of (0.000) regression regarding the relationship between dependent and all independent variables explained by 59.138 given on F-statistics. The model also analyzed the results for each independent as ACP, APP, CCC, CATAR, FDR and CATSR have significant impact on Tobin’s Q with p-values 0.0001, 0.0000, 0.0000, 0.0237, 0.0231 and 0.0000 respectively and ITID, CLTAR, Firm Size and CR have no significant impact on market return. On the other hand, for the Indian firms a significance level of (0.000) is regress regarding the relationship between dependent and all independent variables explained by 173.07 given on F-statistics. The model also analyzed the results for each independent as ACP, APP, Inventory Turnover, CATAR, CLTAR, Firm Size, FDR and CATSR have significant impact on market return with p-values 0.0000, 0.0293, 0.0172, 0.000, 0.0004, 0.0000, 0.0000 and 0.0127 respectively and CCC and CR have no significant impact on market return. The variable slope shows that if Pakistani chemical companies reduce ACP by 66.23, CLTAR by 8.39, FS by0.18, CATSR by 6.40 while Indian chemical firms reduces ACP by 0.068, APP by6.67, CCC by5.94, CLTAR by 3.93, FDR by85.09 and CATSR by 2.57 that will lead to 1 unit increase the market return. Table 9 shows the average results for more clear and authenticated, Itwas conducted personally the interview with the financial analyst and financial managers in the form of questionnaire with nearly 5 numbers of managers of chemical companies which were easily available in the Lahore and Multan region.

Business Management Dynamics
Vol.5, No.10, Apr 2016, pp.10-25
©Society for Business and Management Dynamics
Table 9: Summary of the average results of Interview with Managers
Variables
If
Market Return (Tobin’s Q)
ACP
Increase
Increase
Decrease No effect
APP
Increase
Increase Decrease No effect
Inventory Turnover
Increase
Increase
Decrease No effect
CCC
Increase
Increase
Decrease No effect
CATAR
Increase
Increase Decrease No effect
CLTAR
Increase
Increase
Decrease No effect
Firm Size
Increase
Increase Decrease No effect
FDR
Increase
Increase
Decrease No effect
CR
Increase
Increase
Decrease No effect
CATSR
Increase
Increase
Decrease No effect
The average result summary table drawn from the personnel interviews of different financial managers shows that there is
Negative relationship between ACP and Market Return
Positive relationship between APP and Market Return
Negative relationship between ITID and Market Return
Negative relationship between CCC and Market Return
Positive relationship between CATAR and Market Return
Negative relationship between CLTAR and Market Return
Positive relationship between Firm Size and Market Return
Negative relationship between FDR and Market Return
Positive relationship between CR and Market Return
Business Management Dynamics
Vol.5, No.10, Apr 2016, pp.10-25
©Society for Business and Management Dynamics
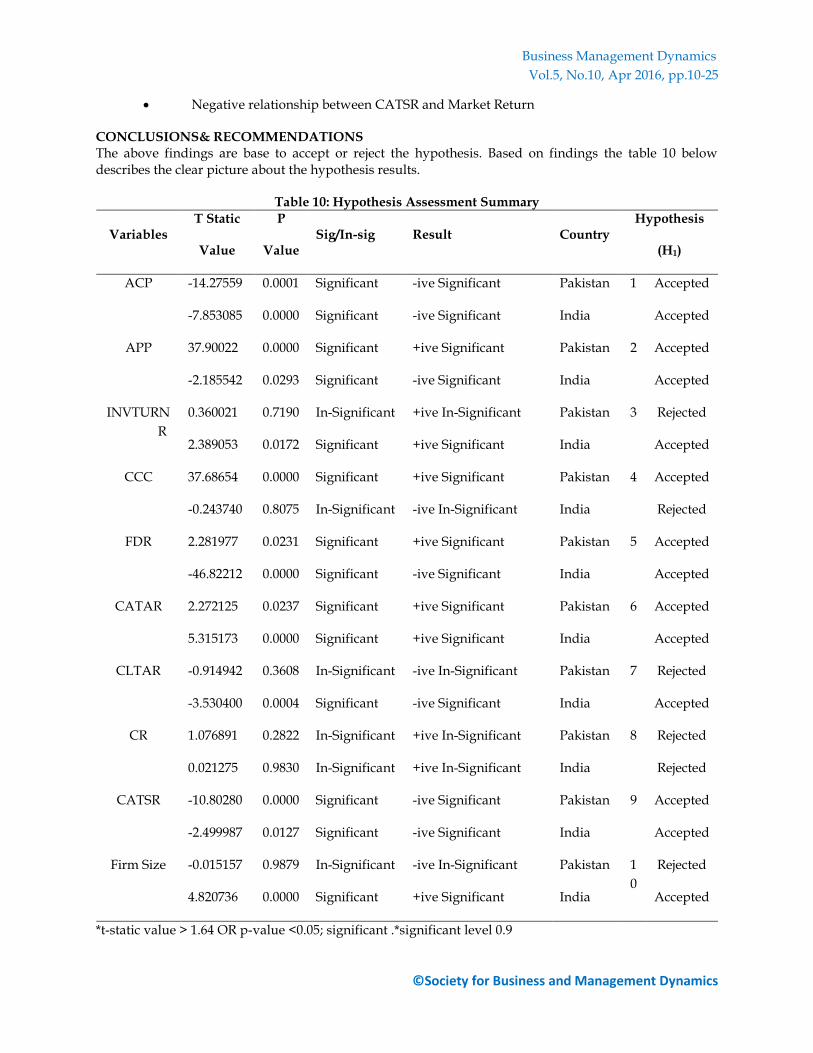
Negative relationship between CATSR and Market Return CONCLUSIONS& RECOMMENDATIONS The above findings are base to accept or reject the hypothesis. Based on findings the table 10 below describes the clear picture about the hypothesis results.
Table 10: Hypothesis Assessment Summary
Variables T Static
Value
P
Value Sig/In-sig Result Country
Hypothesis
(H1)
ACP -14.27559 0.0001 Significant -ive Significant Pakistan 1 Accepted
-7.853085 0.0000 Significant -ive Significant India Accepted
APP 37.90022 0.0000 Significant +ive Significant Pakistan 2 Accepted
-2.185542 0.0293 Significant -ive Significant India Accepted
INVTURN
R
0.360021 0.7190 In-Significant +ive In-Significant Pakistan 3 Rejected
2.389053 0.0172 Significant +ive Significant India Accepted
CCC 37.68654 0.0000 Significant +ive Significant Pakistan 4 Accepted
-0.243740 0.8075 In-Significant -ive In-Significant India Rejected
FDR 2.281977 0.0231 Significant +ive Significant Pakistan 5 Accepted
-46.82212 0.0000 Significant -ive Significant India Accepted
CATAR 2.272125 0.0237 Significant +ive Significant Pakistan 6 Accepted
5.315173 0.0000 Significant +ive Significant India Accepted
CLTAR -0.914942 0.3608 In-Significant -ive In-Significant Pakistan 7 Rejected
-3.530400 0.0004 Significant -ive Significant India Accepted
CR 1.076891 0.2822 In-Significant +ive In-Significant Pakistan 8 Rejected
0.021275 0.9830 In-Significant +ive In-Significant India Rejected
CATSR -10.80280 0.0000 Significant -ive Significant Pakistan 9 Accepted
-2.499987 0.0127 Significant -ive Significant India Accepted
Firm Size -0.015157 0.9879 In-Significant -ive In-Significant Pakistan 1
0
Rejected
4.820736 0.0000 Significant +ive Significant India Accepted
*t-static value > 1.64 OR p-value <0.05; significant .*significant level 0.9

Business Management Dynamics
Vol.5, No.10, Apr 2016, pp.10-25
©Society for Business and Management Dynamics
Table 10 and the pi chart shows the clear picture of the results relating to Pakistan and India.Following charts show the picture of contribution of working capital management on market return comparatively in both the countries i.e Pakistan and India.
Pi-Chart-Contribution of Working Capital Management on Market Return
1* Pakistani companies 43% and 2* Indian companies 57%
Chart shows the 43% contribution of working capital management of Pakistani chemical companies on market return and 57% contribution of working capital management of Indian chemical companies on market return during a period of 1998-2011.The table is a clear picture of the results that shows the relationship between the measures of working capital management and the market return observed by the Pakistan, India and personal interview analysis with the managers. In this study, relatively a sample data has been used relating to the period from 1998 to 2011. Secondly, the future longitudinal research may well focus on the related aspects of liquidity management to gain a deep insight into the determinants and impact of working capital management at large. The proposed study is one of the unique researches on the subject conducted in Pakistan and India and also supposed to guide the firms to evaluate their working capital financing, turnover performance in terms of days and its effective management. The study has several implications and is supposed to be very beneficial for the industries, academics and analysts, as it is supposed to describe the working capital management performance of the selected sector and its findings can help in setting some useful benchmarks in the related sector. It is hoped that further research can usefully test the points raised in this study across a large representative sample of firms representing a larger set of industries. In particular, to identify the circumstances in which the firms change their attitudes towards particular sources of working capital, and that in the different phases of growth cycle, the longitudinal studies may prove more helpful. The research may also be conducted from the perspective of designing a growth oriented optimal working capital financing policy for firms. REFERENCES Afza, T.&Nazir, M.S. (2009). Working Capital Requirements and the Determining Factors in
Pakistan.Journal of Applied Finance,15(4), 28-38. Alvanassb, S.M.&Dauoudi,E. (2013).Relationship between Working Capital Management and
Profitability of Listed Companies in Tehran Stock Exchange.Business Management Dynamics, Vol.2, No.7, Jan 2013, pp.01-08.
Adina, S.(2010).Working Capital Management and Profitability.A Case of Alba County Companies.Annalesuniversitatisapulensis series oeconomica, 12(1), 2010.
Afza, T.&Nazir, M.S. (2011).Working Capital Management Efficiency of Cement Sector of Pakistan.Journal of Economics and Behavioral Studies,Vol. 2, No. 5, pp. 223-235.
Abuzayed, B. (2011). Working Capital Management and firm’s Performance in Emerging Markets at Jordan. Text archive of journal available,www.emeraldinsight.com/1743-9132.htm.
43%
57%
1
2
Business Management Dynamics
Vol.5, No.10, Apr 2016, pp.10-25
©Society for Business and Management Dynamics
Ahmadi, M. (2012).Relationship between Working Capital Management and Profitability at Tehran Stock Exchange.A Case Study of Food Industry.Research Journal of Applied Sciences, Engineering and Technology, 4(13), 1868-1874. 2012, 2040-7467.
Barida, S.C. (2004).Liquidity Management: A Case Study of Steel Authority of India Ltd. The Management Accountant, Vol.39, No.6, 463-495.
Bhalla, V.K. (2002). Financial Management and Policy.Anmol Publications (P) Ltd., New Delhi, 3rdedition, 185.
Chakraborty, K. (2008).Working Capital and Profitability for An Empirical Analysis and the Relationship with Reference to Selected Companies in the Indian Pharmaceutical Industry.TheIcfai Journal of Management Research, Vol. 2, No. 5, pp. 233-239.
Czyzewski, A.B. and Hicks, D.W. (1992). Hold onto Your CashManagement.Management of Accounting,27-30.
Chander, Subash and Rajan, K. (2004).An Empirical Analysis of some aspects of Working Capital requirements in small scale Textile Industry of Punjab.The Management Acountant, July, 542-549.
Dong &Jyh-tay, S. (2010).The Relationship between Working Capital Management and Profitability at Vietnam Case.International Research Journal of Finance and Economics, ISSN 1450-2887 Issue 49 (2010) © Euro Journals Publishing, Inc. 2010.
Deloof, M. (2003). Does Working Capital Management Affect Profitability of Belgian Firms? Journal of Business, Finance and Accounting, 30(3&4), 573-587.
Elgelly, A. (2004).Liquidity-Profitability Trade-off.An Empirical Investigation in an Emerging Market.International Journal of Commerce and Management, 14(2), 48-61.
Falope, O.L. and Ajilore, O.T. (2009).Working Capital Management and Corporate Profitability, Evidence from Panel Data Analysis of Selected Quoted Companies in Niegria.Research Journal of Business Management, Vol. (3), pp.73-84.
Gosh, S.K. and Maji, S.G. (2003).Working Capital Management Efficiency, A study on the Indian Cement Industry, The Institute of Cost and Works Accountants of India.Journal of Management Accountant, Vol.39, No.5, 365-372.
Gill, A. (2010).The Relationship between Working Capital Management and Profitability.United States Business and Economics Journal, Volume, 2010, BEJ-10.
Gupta, K. Shashi& Sharma, R. K. (2005).Management Accounting – Principles and Practice, Kalyani Publishers, New Delhi, 10thedition, p. 23.12.
Horne, V & John, C. (2001).Fundamentals of Financial Management.Pearson Education Asia, 11thedition, 210.
Jose, M. L., Lancaster, C. and Stevens, J.L. (1996).Corporate Returns and Cash Conversion Cycles.Journal of Economics and Finance, 20(1), 33-46.
Korankye, T. (2013).Empirical Analysis of Working Capital Management and its Impact on the Profitability of Listed Manufacturing Firms in Ghana.Research Journal of Finance and Accounting,ISSN 2222-1697 (Paper) ISSN 2222-2847.Vol.4, No.1, 2013.
Lazaridis, I.&Trfonidis, D. (2006). Relationship between Working Capital Management and Profitability of companies listed in the Athens Stock Exchange. Journal of Financial Management and Analysis, 19(1), 26-35.
Mautheva, D. M. (2009).The Influence of Working Capital Management Components on Corporate Profitability.A survey on Kenyan Listed Firms. Research Journal of Business Management, 2009, ISSN 1819-1932.
Moyer, R. C., Guigan, J. R. and Kretlow, W. J. (2005).Contemporary Financial Management,10th Edition. New York, South-Western College Publication.
Myers, S. C. and Majluf, N. S.(1984).Corporate Financing and Investment Decisions when Firms have Information that Investors Do Not Have.Journal of Financial Economics,13(2).
Ngwenya, S. (2012). The Relationship Between Working Capital Management and Profitability of Companies Listed on the Johannesburg Stock Exchange. Journal of Modern Accounting and Auditing, 1548-6583, August 2012, Vol. 8, No. 8, 1204-1213.

Business Management Dynamics
Vol.5, No.10, Apr 2016, pp.10-25
©Society for Business and Management Dynamics
Padachi, K. (2006).Trends in Working Capital Management and its Impact on Firms’ Performance.An Analysis of Mauritian small Manufacturing Firms.International Review of Business Research Papers,Vo.2 No. 2.October 2006, pp. 45 -58.
Petersen, M.A. &Rajan, R.G. (1997).Trade Credit Theories and Evidence.ReviewofFinancial Studies, 10 (3), 661-691.
Raheman, A. and Nasr, M. (2007).Working CapitalManagement and Profitability, case of Pakistani firms. International Review of Business Research Papers, 3, 279-300.
Raheman, A. (2010). Working Capital Management and Corporate Performance of Manufacturing Sector in Pakistan.International Research Journal of Finance and Economics, ISSN 1450-2887 Issue 47 (2010) © Euro Journals Publishing, Inc. 2010.
Rajan, R. G. &Zingales, L. (1995).Financial Dependence and Growth.The American Economic Review 88(3), 559-596.
Shin, H.H. and Soenen, L. (1998).Efficiency of Working Capital Management and Corporate Profitability.Financial practice and Education,8 (2), 37-45.
Smith, M. and Begemann, E. (1997).Measuring Association between Working Capital and Return on Investment.South African Journal of Business Management, 28(1).
Sumaira, T. (2012).Impact of Working Capital Management on Profitability of Textile Sector of Pakistan.3rd International Conference on Business Management, (ISBN: 978-969-9368-07-3).
Singh, J. and Pandey,S. (2008).Impact of Working Capital Management on the Profitability of Hindalco Industries Limited.Journal of Financial Economics, 6(4), 62-72.
Srinivasan, N.P.&Shakthivel, M. (2006).Financial Management.Vrinda Publications (P) Ltd., New Delhi, 1st edition, 183.
Uyar, A. (2009).The Relationship of Cash Conversion Cycle with Firm Size and Profitability.An Empirical Investigation in Turkey International Research Journal of Finance and Economics. 24.
Walker, J. (1964).Walker’s Approach on Working Capital Management.Journal of Financial Management and Analysis, 19(1), 26-35.
Wang, Y.J. (2002).Liquidity Management, Operating Performance and Corporate Value.Evidence from Japan and Taiwan.Journal of Multinational Financial Management, 12, 159-169.
Weston, J. Fred & Eugene, F. Brigham, (1975). Managerial Finance, Dryden Press, Illinois, p. 510. Zafar, M. and Athar, I. (2012).Animpact of Working Capital Management on Firms Profitability in Sugar Industry of Pakistan. MPRE Paper No. 41436.Posted 19, September 2012.